Article

Hedgerows on Crop Field Edges Increase Soil Carbon to a Depth of 1 meter

by
Jessica L. Chiartas
1,*,
Louise E. Jackson
2,
Rachael F. Long
3,
Andrew J. Margenot
4,5 and
Anthony T. O'Geen
2
1
Department of Plant Sciences, University of California Davis, Davis, CA 95616, USA
2
Department of Land, Air and Water Resources, University of California Davis, Davis, CA 95616, USA
3
University of California Cooperative Extension, Woodland, CA 95695, USA
4
Department of Crop Sciences, University of Illinois Urbana-Champaign, Urbana, IL 61801, USA
5
Agroecosystem Sustainability Center, Institute for Environment, Energy and Sustainability, University of Illinois Urbana-Champaign, Urbana, IL 61801, USA
*
Author to whom correspondence should be addressed.
Sustainability 2022, 14(19), 12901; https://doi.org/10.3390/su141912901
Submission received: 29 August 2022 / Revised: 3 October 2022 / Accepted: 4 October 2022 / Published: 10 October 2022

Abstract

:
Effective incentivization of soil carbon (C) storage as a climate mitigation strategy necessitates an improved understanding of management impacts on working farms. Using a regional survey on intensively managed farms, soil organic carbon (SOC) concentrations and stocks (0–100 cm) were evaluated in a pairwise comparison of long-term (10+ years) woody hedgerow plantings and adjacent crop fields in Yolo County, CA, USA. Twenty-one paired sites were selected to represent four soil types (Yolo silt loam, Brentwood clay loam, Capay silty clay, and Corning loam), with textures ranging from 16% to 51% clay. Soil C was higher in the upper 100 cm under hedgerows (14.4 kg m−2) relative to cultivated fields (10.6 kg m−2) and at all depths (0–10, 10–20, 20–50, 50–75, and 75–100 cm). The difference in SOC (3.8 kg m−2) did not vary by soil type, suggesting a broad potential for hedgerows to increase SOC stocks. Assuming adoption rates of 50 to 80% across California for hypothetical field edges of average-size farms, and an identical SOC sequestration potential across soil types, hedgerows could sequester 10.8 to 17.3 MMT CO2e, or 7 to 12% of California’s annual greenhouse gas reduction goals.

1. Introduction

Conversion of natural ecosystems to agriculture and its continued intensification have resulted in substantial losses of carbon (C) from the top 100 cm of soils worldwide [1,2]. Recent projections indicate negative emissions of 150 Pg C is required to avoid a rise in global temperatures [3]. Globally, soils under agricultural management have the potential to sequester approximately 0.7 to 1.85 Pg C yr−1 for up to 20 years [4,5], although stoichiometric constraints [6,7], photosynthetic capacity [8], and socioeconomic barriers [9,10] may limit actual sequestration.
New government and market-based initiatives are emerging to incentivize C storage on natural and working lands to simultaneously mitigate and adapt to climate change [11,12]. It is widely documented in intensively managed systems that conservation practices, particularly cover cropping, compost, reduction of bare ground, and conservation tillage, can increase soil organic carbon (SOC) storage [5,11,12,13,14,15]. Afforestation, or the integration of perennial vegetation in the form of hedgerows, windbreaks, and/or riparian corridors, integrates several conservation practices known to sequester SOC (i.e., no tillage, increased ground cover, and deep perennial roots), while providing an additional source of C in the form of biomass (e.g., trees, shrubs, and vines) [16,17,18]. Hedgerows are typically planted on marginal lands, field edges, and waterways, infringing little on production agriculture [16,19], although this may change as market prices increase for low-value commodities. Hedgerows also provide valuable ecosystem services at the field and landscape scale, including increased infiltration and interception of nutrient leachate [20,21], increased pollination and pest control [22,23,24], and the promotion of habitat and biodiversity in increasingly fragmented landscapes [25,26].
Hedgerows have the potential to sequester SOC [25,27,28,29] through both increased inputs (e.g., litter deposition and root exudates) [30,31] and reduced losses (e.g., reduced disturbance, lack of irrigation, and erosion control) [32,33]. Quantitative investigations of SOC stocks in deep soil layers and the distribution and dynamics of C sequestration under hedgerows, however, are scarce [28,34,35]. Woody shrubs and trees used in hedgerows often have extensive, perennial root systems that extend several meters deep and may contribute more to subsoil C than annually harvested row crops with finer, shallower, and shorter-duration roots [36,37,38]. Different plant functional types also have different patterns of C allocation to roots that may promote different distributions of SOC [39].
Moreover, soil type (e.g., soil texture and mineralogy) influences SOC, so comparisons of a given management type may not be consistent across a landscape [40,41]. Climate, vegetation, and land-use/management are also recognized as key drivers of C sequestration, but their relative importance, especially at various depths, remains unclear [39,42,43,44].
In the Sacramento Valley of California, a 2001 collaborative campaign between local agencies to “Bring Farm Edges Back to Life” established hedgerows on working farms across Yolo County [45,46]. This provided an opportunity to quantify SOC storage between hedgerows and adjacent cultivated cropland in a Mediterranean-type climate. There is a paucity of SOC data in the semi-arid Western US [47], where models project large increases in temperature and severity and frequency of drought [48,49,50]. Previous studies in California have shown higher SOC in woody plant communities than adjacent agricultural land [25,51].
The overall objective of this study was to assess the impact of hedgerows (established for 10+ years) on SOC to a depth of 1 m, by sampling all farm sites in a 100 km2 region that met criteria for hedgerow age, height, composition, and proximity to the edge of a cultivated field. The specific objectives were to: (1) compare SOC and physicochemical properties in cultivated fields and adjacent hedgerows to a depth of 1 m, using a regional survey; (2) evaluate the difference in SOC across a range of soil types; (3) identify factors that contribute to the accrual of SOC in the surface (0–20 cm) and subsurface (20–100 cm) using multivariate statistics. We hypothesize that SOC will be greater under hedgerows than cultivated fields, in both the surface and the subsurface, but that the difference and distribution will vary by soil type and/or silt and clay content.

2. Materials and Methods

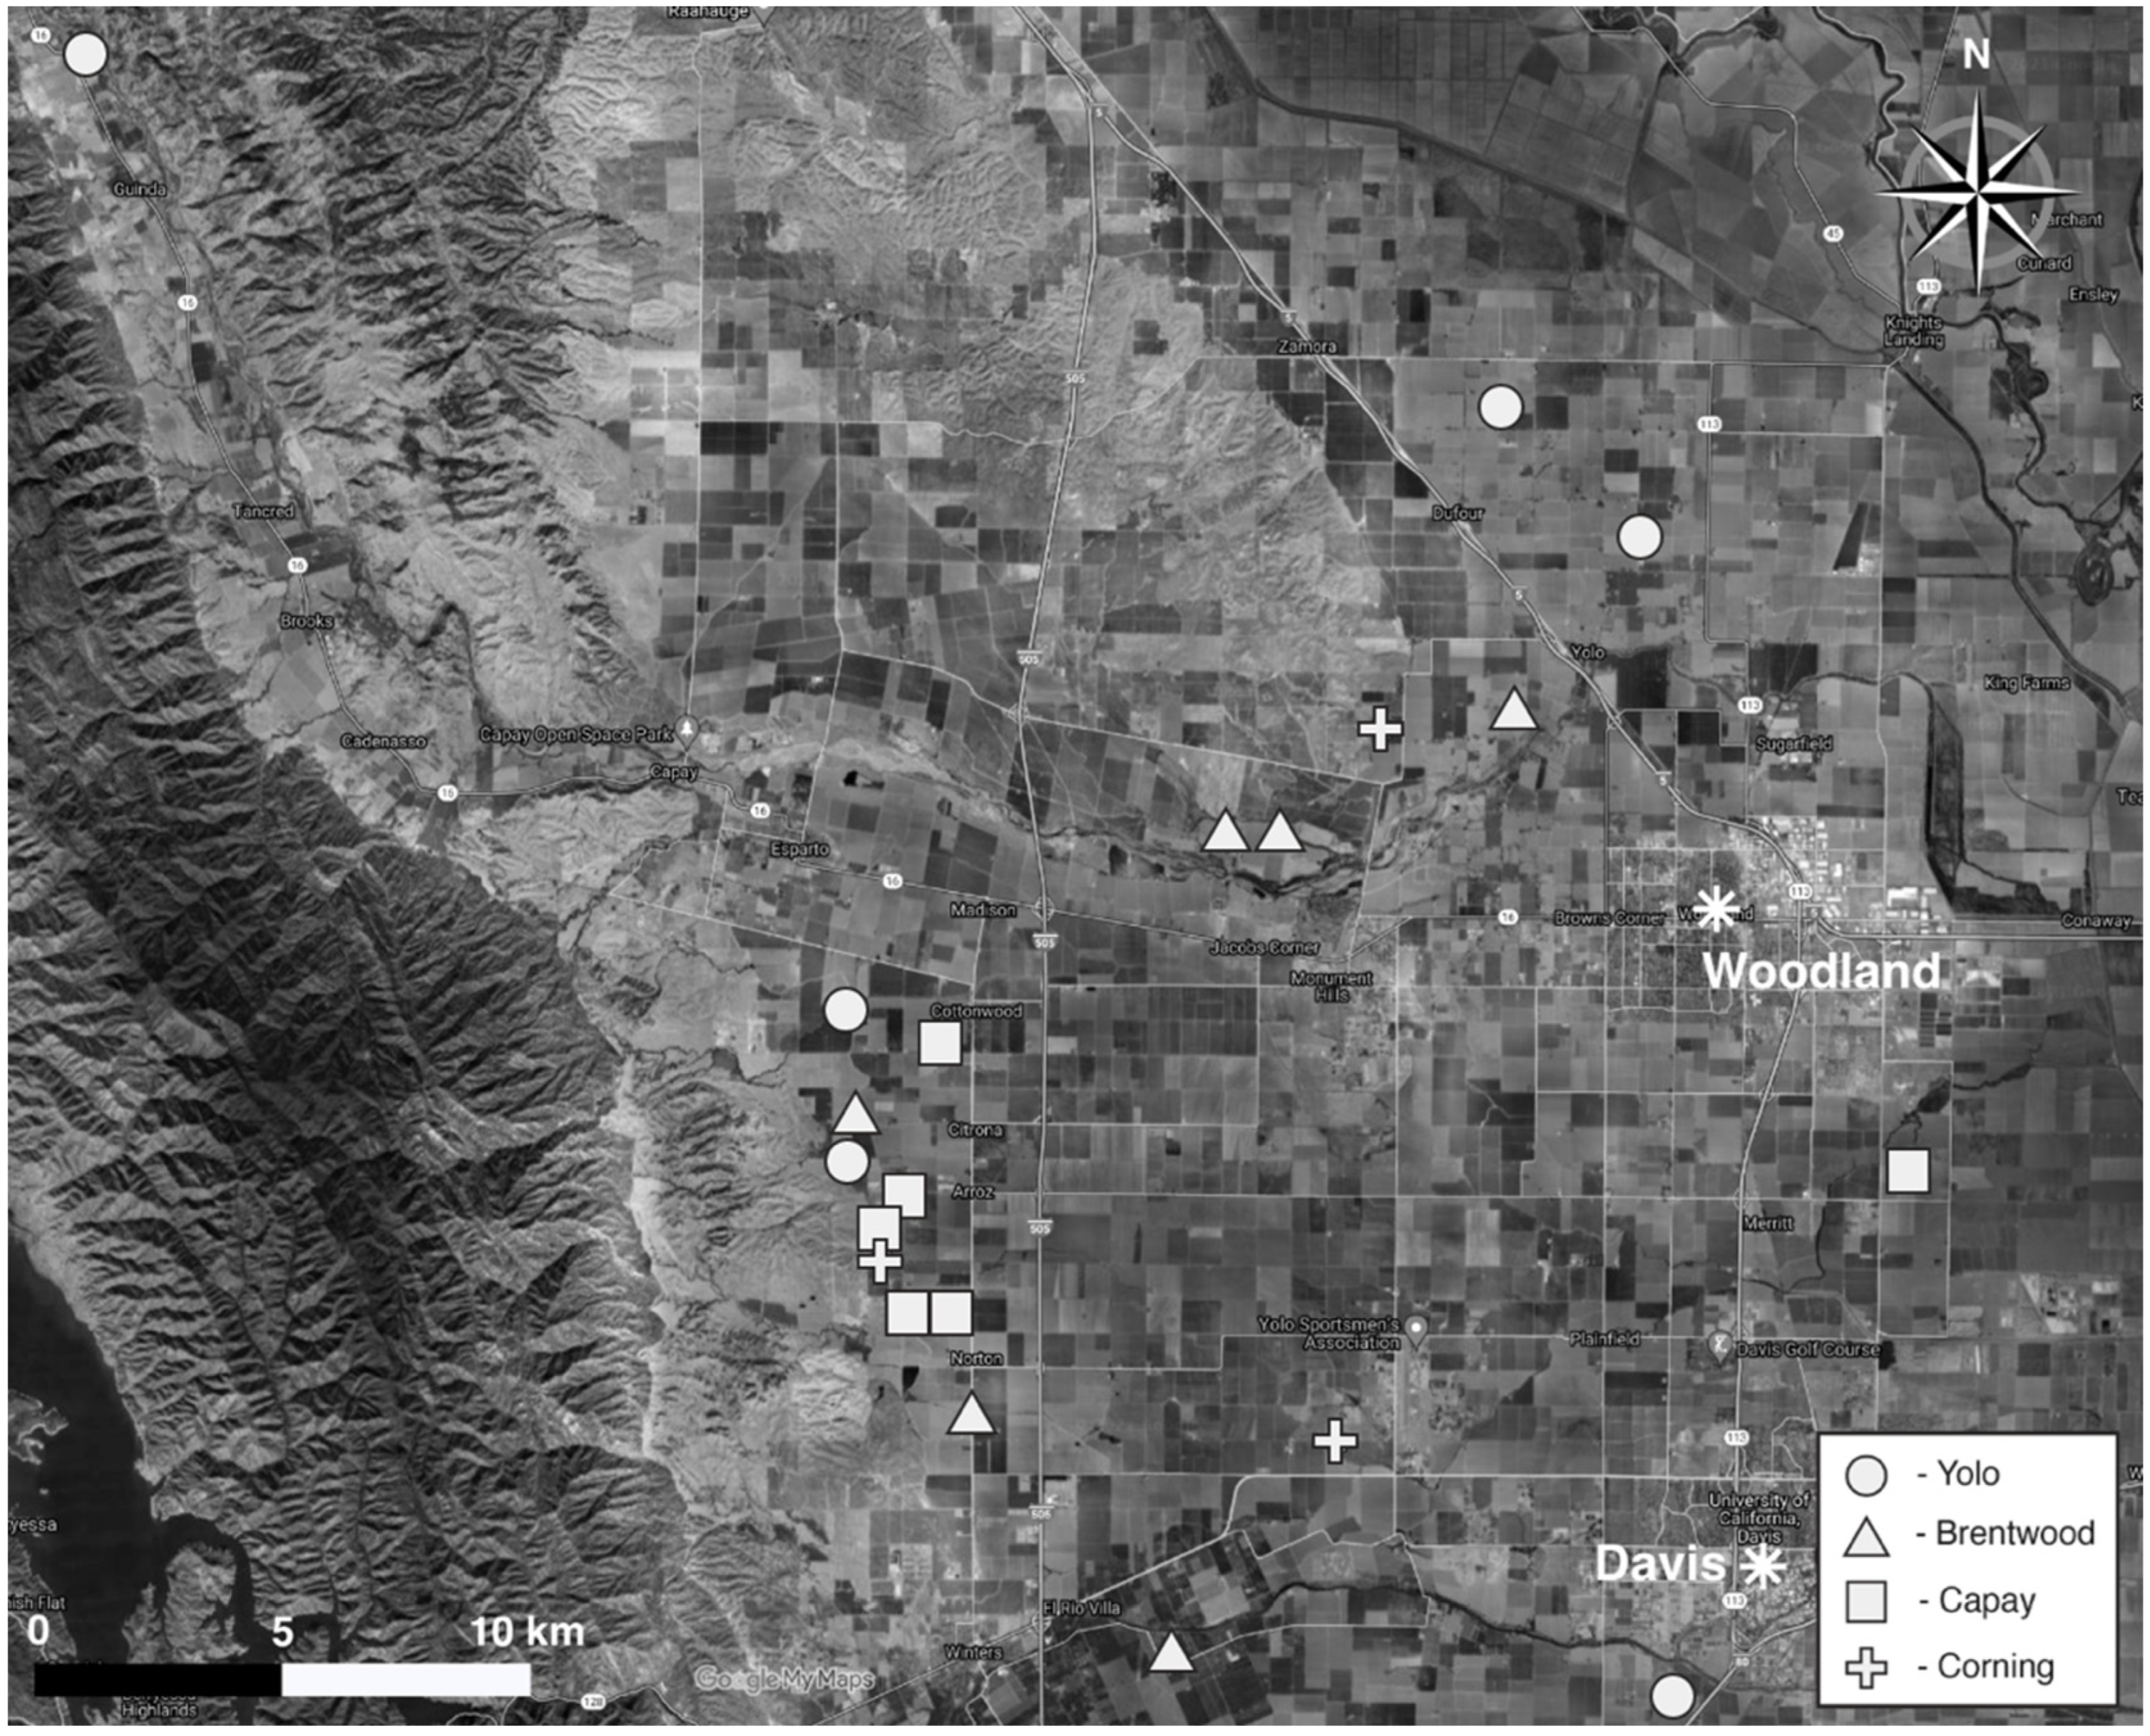
2.1. Site Description

A regional survey was conducted across farms in the mostly leveled, lowland alluvial plains, fans, and terraces of Yolo County (Figure 1), situated in the southern Sacramento Valley, California, USA. Sites ranged in elevation from 16 to 140 m above sea level. The 92,463 ha region is characterized by cool, wet winters and hot, dry summers that engender a xeric soil moisture regime and a thermic soil temperature regime [52]. Annual precipitation is 52.6 cm and mean annual temperature of 17 °C, based on the city of Woodland, CA. Soils are developed largely from materials deposited from the Coast Range mountains to the west.
The study area was historically (pre-1900) dominated by oak woodlands, savannas, and wetlands, but is characterized today by intensive irrigated agriculture with dominant crop rotations including tomato (Lycopersicum esculentum), alfalfa hay (Medicago sativa), sunflower (Helianthus annuus), safflower (Carthamus tinctorius), wine grapes (Vitis vinifera), almonds (Prunus dulcis), and rice (Oryza sativa). Management is characterized by irrigation, frequent bare ground, and intensive tillage [47,53]. Since the mid-1990s, multi-stakeholder collaborations have helped farmers establish hedgerows, filter strips, and vegetated riparian corridors on agricultural lands [21,54,55], resulting in approximately 71 hectares of hedgerows in Yolo County with goals to establish an additional 80 hectares by 2030 [56].

2.2. Site Selection

Criteria for site selection included hedgerows that were (1) greater than or equal to 10 years in age; (2) greater than or equal to 1.5 m in height; (3) contiguously planted woody species; (4) immediately adjacent to a cultivated crop; (5) not situated in or along a waterway or irrigation canal; (6) where soil had not been reworked, moved, or made into a berm prior to planting. We sampled all hedgerows that met the criteria in the area portrayed in Figure 1.
Sampling occurred on four agriculturally representative soil types spanning a range in pedogenesis, or soil formation. Twenty-one paired sites were identified (Figure 1), which included: six on Yolo silt loam (fine-silty, mixed, superactive, nonacid, thermic Mollic Xerofluvents); six on Brentwood clay loam (fine, smectitic, thermic Typic Haploxerepts); six on Capay silt clay (fine, smectitic, thermic Typic Haploxererts); three on Corning loam (fine, mixed, semiactive, thermic Typic Palexeralfs) (Table 1). In California, Yolo soils are found on 601 km2, Brentwood soils on 206 km2; Capay soils on 1216 km2; Corning soils on 559 km2 [57]. For sites sampled in this study, the cultivated field sizes ranged from 2.5 to 99.6 ha (mean = 26.0 ha) (Table S5). Hedgerows covered an area ranging from 0.05 to 1.23 ha per sampling site (mean = 0.32 ha) (Table S5). Hedgerows constituted 0.33 to 9.43% of total agricultural field area (mean = 1.89%) based on analysis of data from the Soil Survey Geographic Database and Google Earth [58].
Most of the cropping systems were furrow-irrigated tomato/wheat/sunflower rotations, which varied slightly in management and crop in rotation at the time of sampling (Table 1). One perennial system, a vineyard, was included on the Corning series. One-on-one interviews with land managers were conducted in May 2019 to characterize management practices in both hedgerows and cultivated crops.
Hedgerows plants were predominantly shrubs with occasional trees. Commonly occurring species included Willow (Salix spp.), Ceanothus (Ceanothus spp.), Elderberry (Sambucus mexicana), California coffeeberry (Frangula californica ssp. tomentella), Toyon (Heteromeles arbutifolia), Saltbush (Atriplex lentiformis), Coyote brush (Baccharis pilularis), Western redbud (Cercis occidentalis), and Milkweed (Asclepias spp.). Hedgerows ranged in age from 10 to 25 years (mean of 17 years) and were all established with irrigation and amendments (compost and/or mineral fertilizer) in the first three years. The levels of maintenance (i.e., pruning and weeding) may have varied over their lifetime, but annual records were not available.

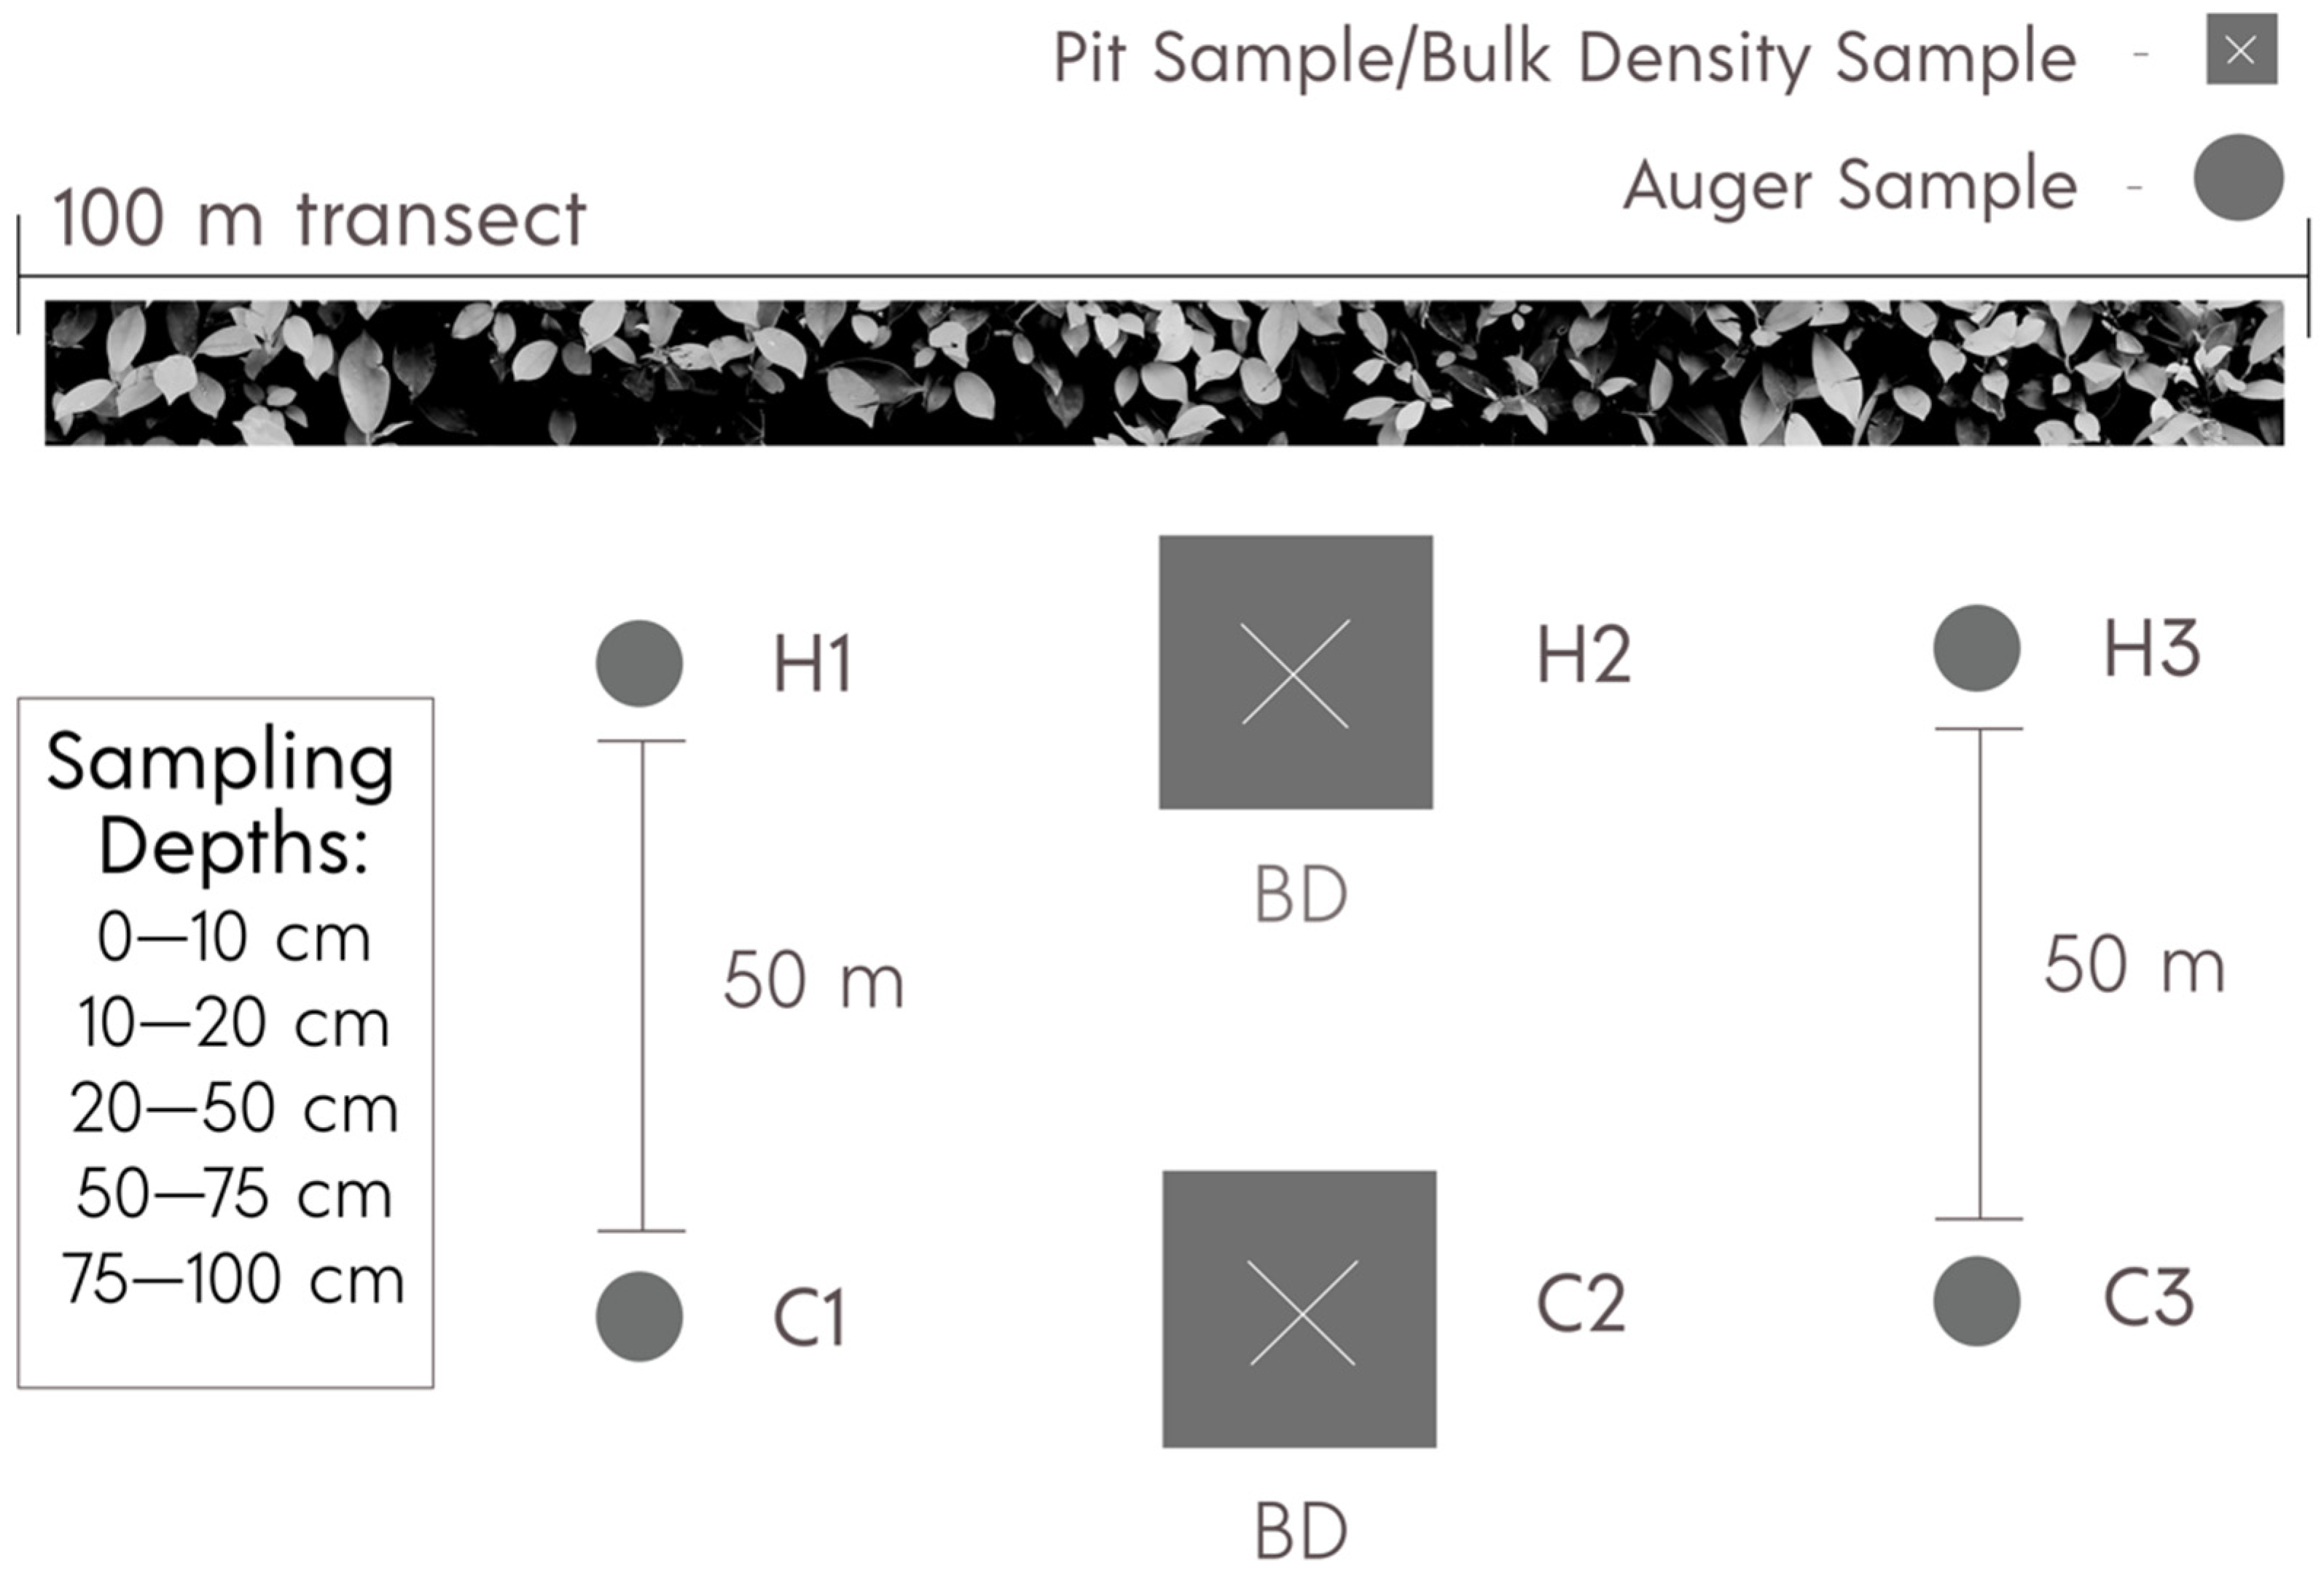
2.3. Soil Sampling and Profile Descriptions

In April 2019, prior to spring irrigation in adjacent crops, soil samples were collected from each site. In order to sample the full set of hedgerows in a short period of time, minimizing management variability and the effects of moisture content on bulk density collection, we chose to sample three locations within the hedgerows and three in the adjacent fields. Hedgerow locations were selected along a 100 m transect, using a random number generator (Figure 2). To avoid an edge effect from the impact of traffic and equipment, but minimize variability in inherent soil properties, a transect of three locations within the cultivated field was selected 50 m from and parallel to the hedgerow transect.
Soil pits were excavated manually, or mechanically where possible, in the central sampling location of both the hedgerow and the cultivated field, while 10 cm diameter augers were used to collect samples at the other two locations in each transect.
Samples were collected from depth increments of 0–10, 10–20, 20–50, 50–75, and 75–100 cm, representing agriculturally relevant surface horizons and similar genetic horizons across soil types. For instance, USDA soil survey mapped all soils (except Capay) with Ap horizons at 0–20 cm, as this is a common tillage depth. Soil from each sampling location was kept separate and thoroughly homogenized before bagging for subsequent analysis of SOC, total nitrogen (N), texture, and pH. Soils were stored at 4 °C until field sampling was complete (no more than 12 days).
Soil profile descriptions were conducted using standard soil survey techniques [59] The following morphologic indicators were characterized: (1) A-horizon thickness; (2) depth to redoximorphic features; (3) maximum rooting depth; (4) root size (scored 1 to 5 for very fine, fine, medium, coarse, and very coarse roots) and quantity (1 to 3 for few, common, and many); (5) type, size, and grade of soil structure. Redoximorphic features were not encountered at any of the sites. Root density was calculated as:
Ri = 1(VFq) + 2(Fq) + 3(Mq) + 4(Cq) + 5(VCq),
where Ri is the root density for sampling depth i; VFq is the quantity of very fine roots, Fq is fine roots, Mq is medium roots, Cq is coarse roots, and VCq is very coarse roots. Weighted averages were calculated for 0–20 cm and 20–100 cm depths. The quantity of earthworms was determined at each soil pit via hand sorting [60] and converted to an index of 1 to 3 for few (1–2), common (3–5), and many (6+), respectively.

2.4. Bulk Density

At each pit (Figure 2), bulk density samples were collected from the center of each sampling depth using the core method (8.25 cm diameter; 7.5 cm length) [61]. For depths greater than 10 cm, 2 cores were collected in sequence (i.e., 27.5–35 cm and 35–42.5 cm for 20–50 cm depth), offset horizontally to avoid potential compaction. Rock fragments (>2 mm) present in Corning soils were weighed, wrapped in paraffin wax, and submerged in water to determine volume. Mass and volume of rock fragments, where present, were subtracted from the total mass and volume prior to calculating bulk density.

2.5. Soil Chemical Properties

Soil samples were air-dried at 25 °C and sieved to <2 mm. All visible plant materials, including fine roots, were removed and subsamples oven-dried at 60 °C for 72 h before ball milling in metal cylinders for 12–24 h, or until a fine powder was achieved. Soil pH was measured on <2 mm sieved samples in a 1:2 suspension with 0.01 M CaCl2 using a combination glass and calomel electrode [62]. Soil texture was measured by a hydrometer [63]. Total C and N were determined on ball-milled samples by dry combustion using an ECS 4010 Costech Elemental Analyzer and a LECO soil standard [64]. Samples with a pH over 7.4 were pre-treated with 1 N HCl to remove carbonates [65].
Total SOC and soil N were calculated on a mass basis for each fixed depth, in order to convert concentrations to stocks:
Ci = BDi × di × ci,
where Ci is the total mass of SOC (kg m−2) for sampling depth i, BD is the bulk density (kg m−3) of sampling depth i, di is the length (m) of sampling depth i, and ci is the concentration of SOC (g kg−1 soil) for sampling depth i. Profile SOC stocks (0–100 cm) were calculated by summing the total SOC (kg m−2) from each individual soil depth [66]. Weighted averages of measured SOC (used in principal component analysis) at 0–10 cm and 10–20 cm depths were used for 0–20 cm SOC stock values and at 20–50 cm, 50–75 cm, and 75–100 cm for 20–100 cm SOC stock values:
S i   = ( Σ i n ( s i   ×   d i ) ) / l t ,
where Si is the total mass of SOC (kg m−2) for the total aggregated depth (0–20 or 20–100 cm), si is the stock of SOC (kg m−2) for sampling depth i, di is the length (m) of sampling depth i, and lt is the total length of the aggregated depth.

2.6. Statistical Analyses

Data for total SOC, total soil N, BD, pH, sand, and clay were tested for normality and homogeneity of variance and normalized using log (x + 1) transformations when necessary to meet ANOVA assumptions. Effects of management (hedgerow vs. crop) and soil type on each variable were analyzed using a mixed-effects model using the R statistical package nlme [67]. Management (within-subject factor) and soil type (between-subject factor) were considered fixed effects, while site was considered a random effect (based on repeated measures). Data were analyzed separately for each individual sampling depth, as well as for the entire 0–100 cm. Differences between means were calculated using Tukey’s Honestly Significant Difference (HSD) tests. Statistical significance was evaluated at p < 0.05 unless otherwise stated. Box plots (Figure S1) were graphed using the ggplot package in R [68].
Sources of variability in the dataset were characterized by Principal Component Analysis (PCA) on a standardized correlation matrix using the vegan package in R [69]. Loadings and proportions of variance, as well as means for included variables, are presented in Tables S3 and S4. The first three components were selected based on visual interpretation of the scree plots and criteria of having eigenvalues >1 and a cumulative variance of at least 70% [70].

2.7. Scenario Estimates

To estimate the viability of hedgerow plantings in achieving state-wide emissions reductions goals, the potential for C sequestration was assumed to be equivalent to the difference between measured SOC stocks (0–100 cm) in hedgerows and cultivated fields. It is estimated that the state of California includes a total of 76,500 farms with an average farm size of 126 ha [71]. Farms were assumed to be square to estimate the perimeter of an average farm in each region. Based on recommendations for implementation and a literature review of 60 studies, an average 5 m hedgerow width [21,54,72] was used to calculate the total area of hedgerows if the entire perimeter of each farm was re-vegetated. The total potential hedgerow area was then multiplied by the total number of farms and either 0.5 or 0.8 to represent a 50% or 80% adoption scenario. The final area was converted to hectares (77,167 or 123,467 ha) and multiplied by the mean difference in SOC stocks under hedgerows relative to adjacent cultivated fields. Finally, CO2e was calculated with a conversion factor of 3.67 (44g CO2/12g C).

3. Results and Discussion

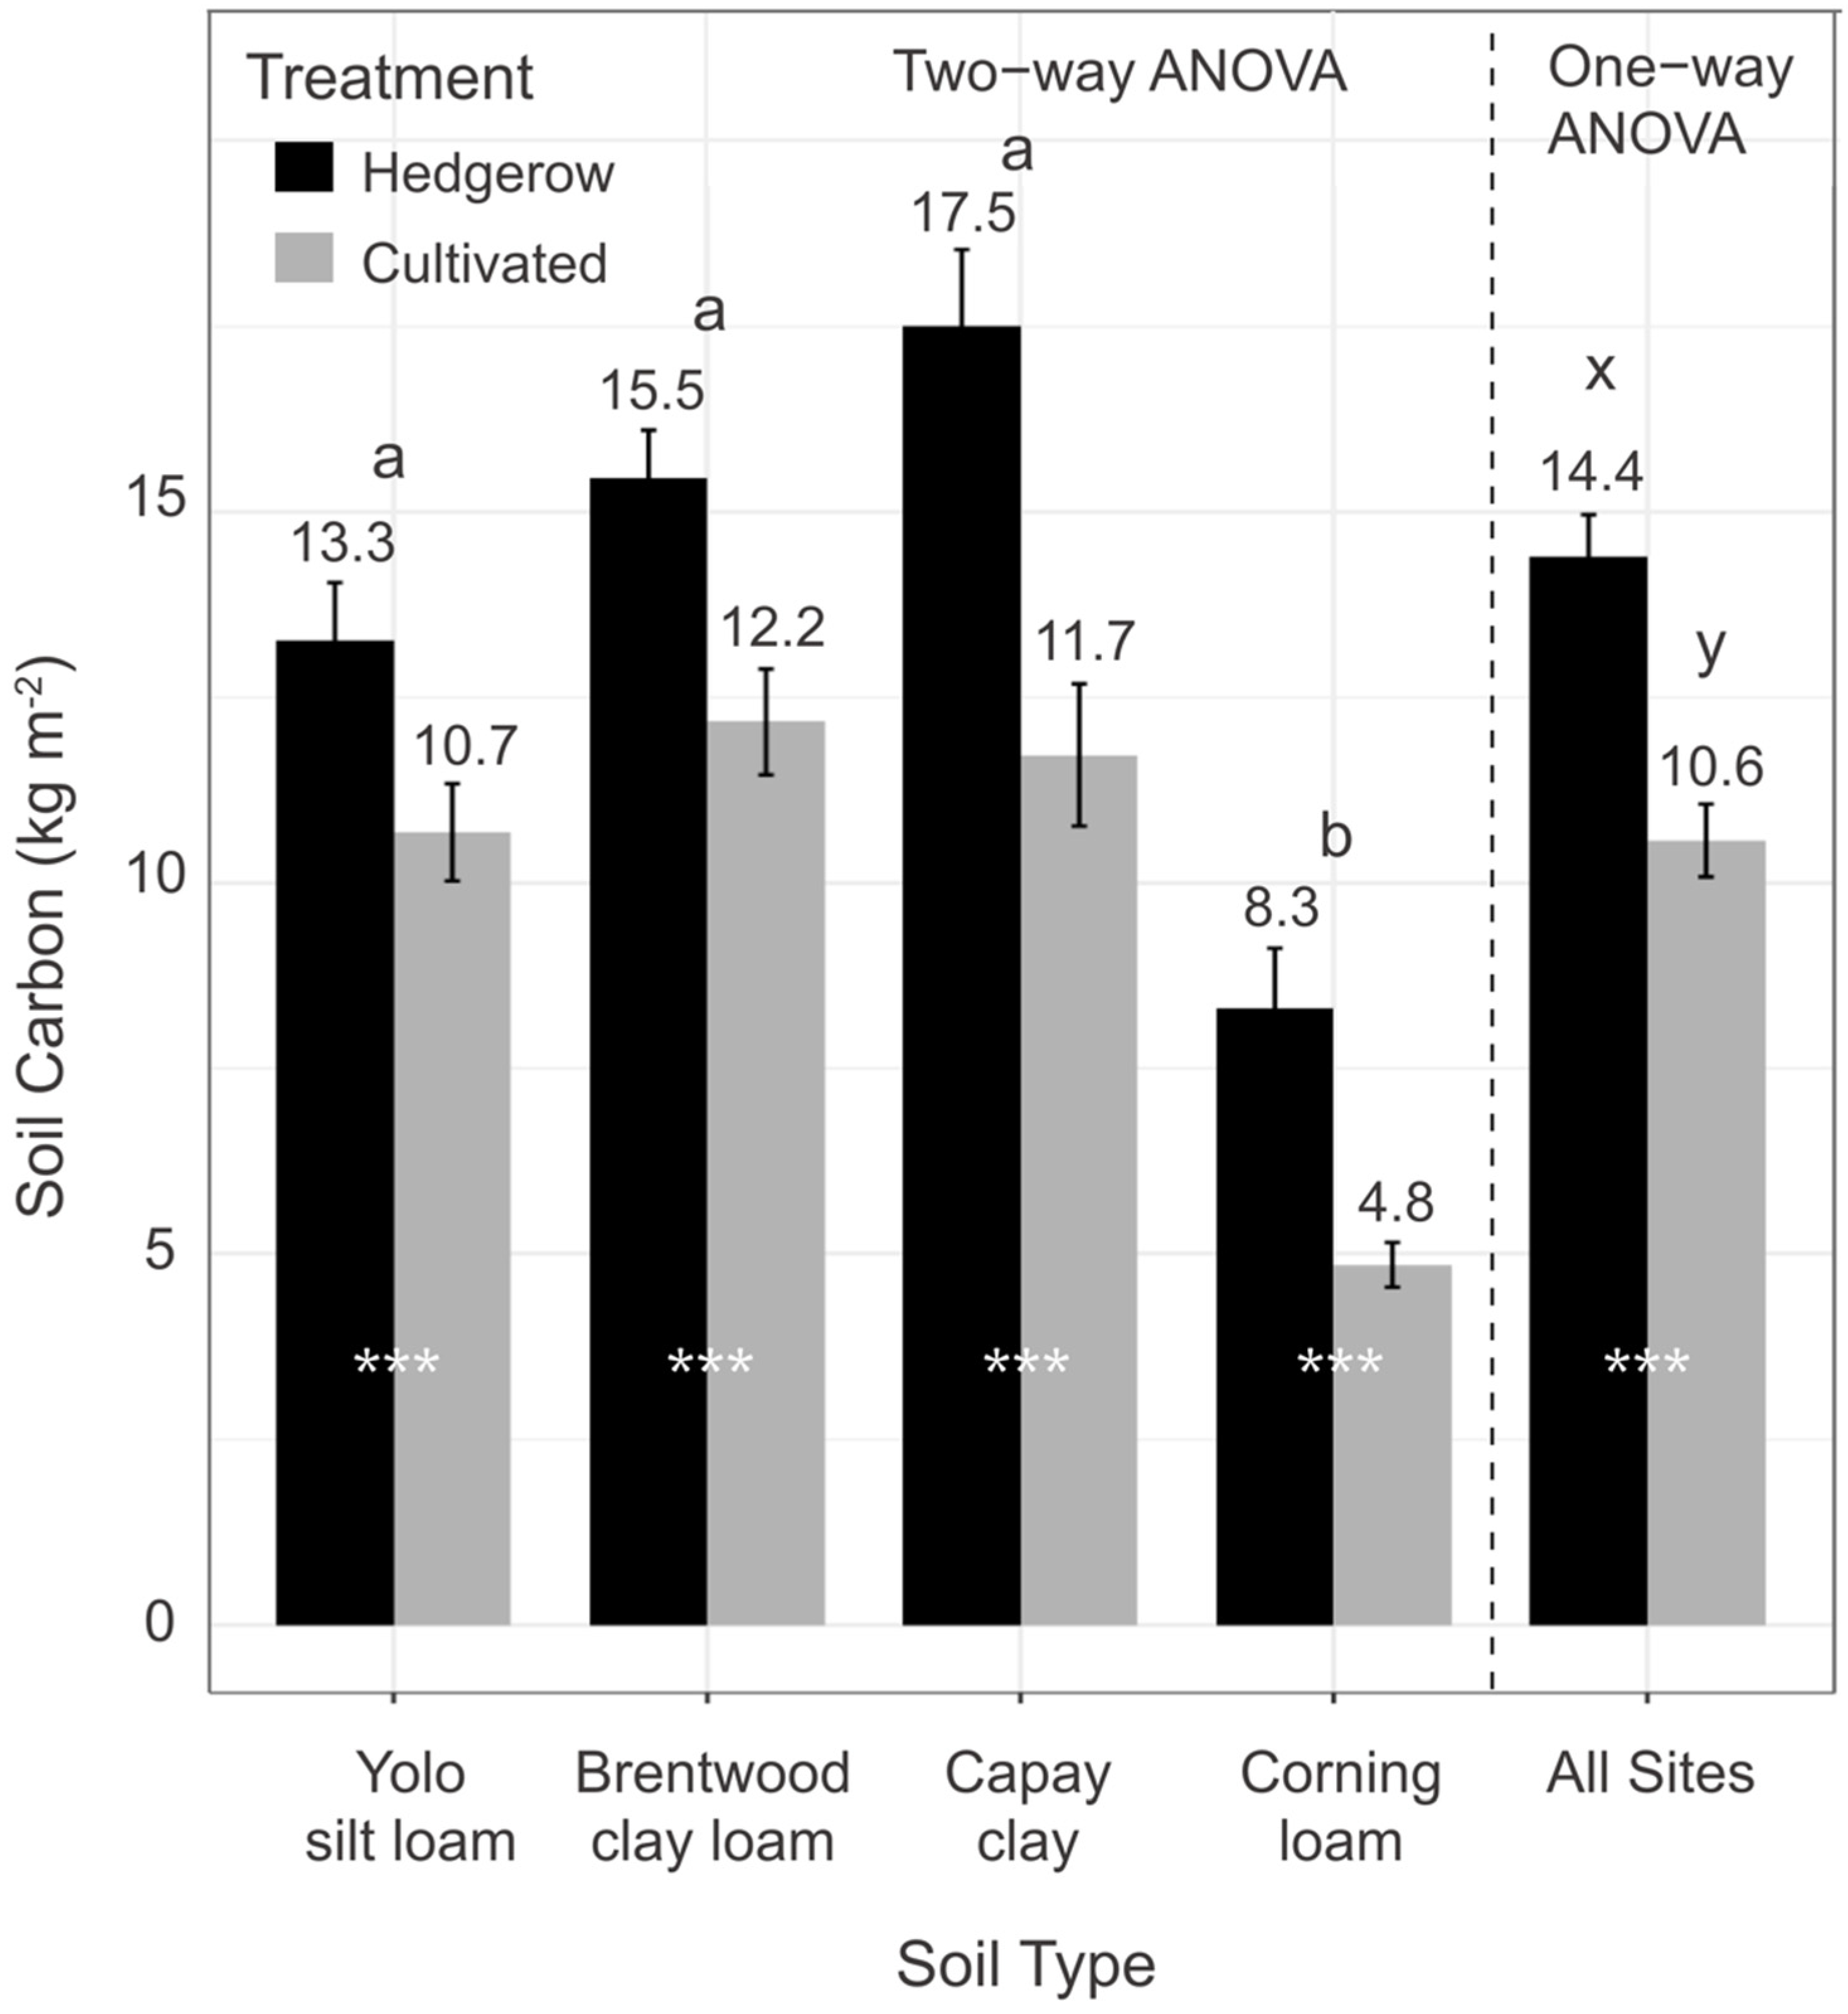
3.1. Soil Organic Carbon Stocks (0–100 cm)

Whole-profile (0–100 cm) SOC (kg m−2) stocks across all sites differed by management and soil type (p < 0.001) (Figure 3). Whole-profile SOC stocks were, on average, 36% greater in hedgerows (mean = 14.4 kg m−2; range = 7–26 kg m−2) compared to cultivated fields (mean = 10.6 kg m−2; range = 4–19 kg m−2) (Figure 3). Whole-profile stocks were 24%, 27%, 49%, and 74% greater under hedgerows than adjacent cropland on Yolo silt loam, Brentwood clay loam, Capay silt clay, and Corning loam soils, respectively, with absolute differences ranging from 2.6 kg m−2 for Yolo to 5.8 kg m−2 for Capay. Importantly, soil texture did not vary between hedgerow and cultivated soils at any site or depth (Table S1), indicating field sites were paired effectively on the same soil types. Soil texture did vary by soil type at each depth, ranging from loam to clay (16.1% to 50.9% clay). Thus, across a wide range of soil textures, hedgerows consistently stored more SOC in the 0–100 cm profile than adjacent cultivated fields. Bulk density (Table S1) also did not vary between hedgerow and cultivated soils, except at 0–10 cm on Corning soils, but differences did not impact differences in C stocks.
Studies across a diversity of climates and soil types have reported a range of 3 to 32 kg C m−2 (0–100 cm) under agroforestry systems [34], as well as similar magnitudes of SOC stock increases (32–45%) relative to adjacent cropland [18,73,74]. Thiel et al. 2015 found that planted hedgerows adjacent to cropland on Inceptisols in British Columbia stored a mean of 17.6 kg C m−2 from 0–100 cm, 40% greater than adjacent cultivated fields. In western France, hedgerows on Inceptisols and Alfisols were found to store 15.5 kg C m−2 to a depth of 90 cm, 42% greater than adjacent cultivated fields [74]. In the UK, hedgerows on Inceptisols were found to store 31% more C to a depth of 50 cm than adjacent managed grasslands [35]. Within California, across a range of soil types, SOC (0–100 cm) was approximately 11–20 kg m−2, or 45% higher in woodland ecosystems relative to adjacent vineyards [51] but was not different between forested riparian corridors and adjacent cropland [75]. A meta-analysis of 84 studies in temperate climates found hedgerows stored 32 ± 23% more SOC than adjacent cropland [28].
Whole-profile SOC stocks for cultivated fields were similar to those found at a nearby long-term research station on similar soil types (Yolo and Rincon soil series), where conventionally managed fields averaged 10.7 kg m2 and organically managed fields (receiving annual compost applications and cover crops) resulted in SOC stocks of 13.1 kg m−2 to a depth of 100 cm [14]. Management information (Table 1) collected in our study demonstrated similar mean SOC stocks (0–100 cm) of 9.54 kg m−2 and 13.0 kg m−2 in conventionally and organically managed fields, respectively. This indicates that organic management can help close the gap in SOC stocks between cultivated fields and hedgerows, despite the generally higher use of tillage for weed control.
Hedgerow age (Table 1) had no effect on whole-profile SOC stocks, possibly due to the relatively constrained age range (10–25 years; mean = 17 years) in this study and/or variability in maintenance and care (i.e., pruning). Soils under hedgerows may have reached C saturation. Estimates suggest that SOC reaches maximum sequestration ~7 years after a change in management and steady-state equilibrium by ~20 years [76,77]. Thiel et al., 2015 found a weak negative correlation between the difference in SOC and age of hedgerows (9–45 years), while Drexler et al., 2021 found a positive correlation (10–37 years), and Viaud and Kunnemann 2021 found no relationship (20+ years).

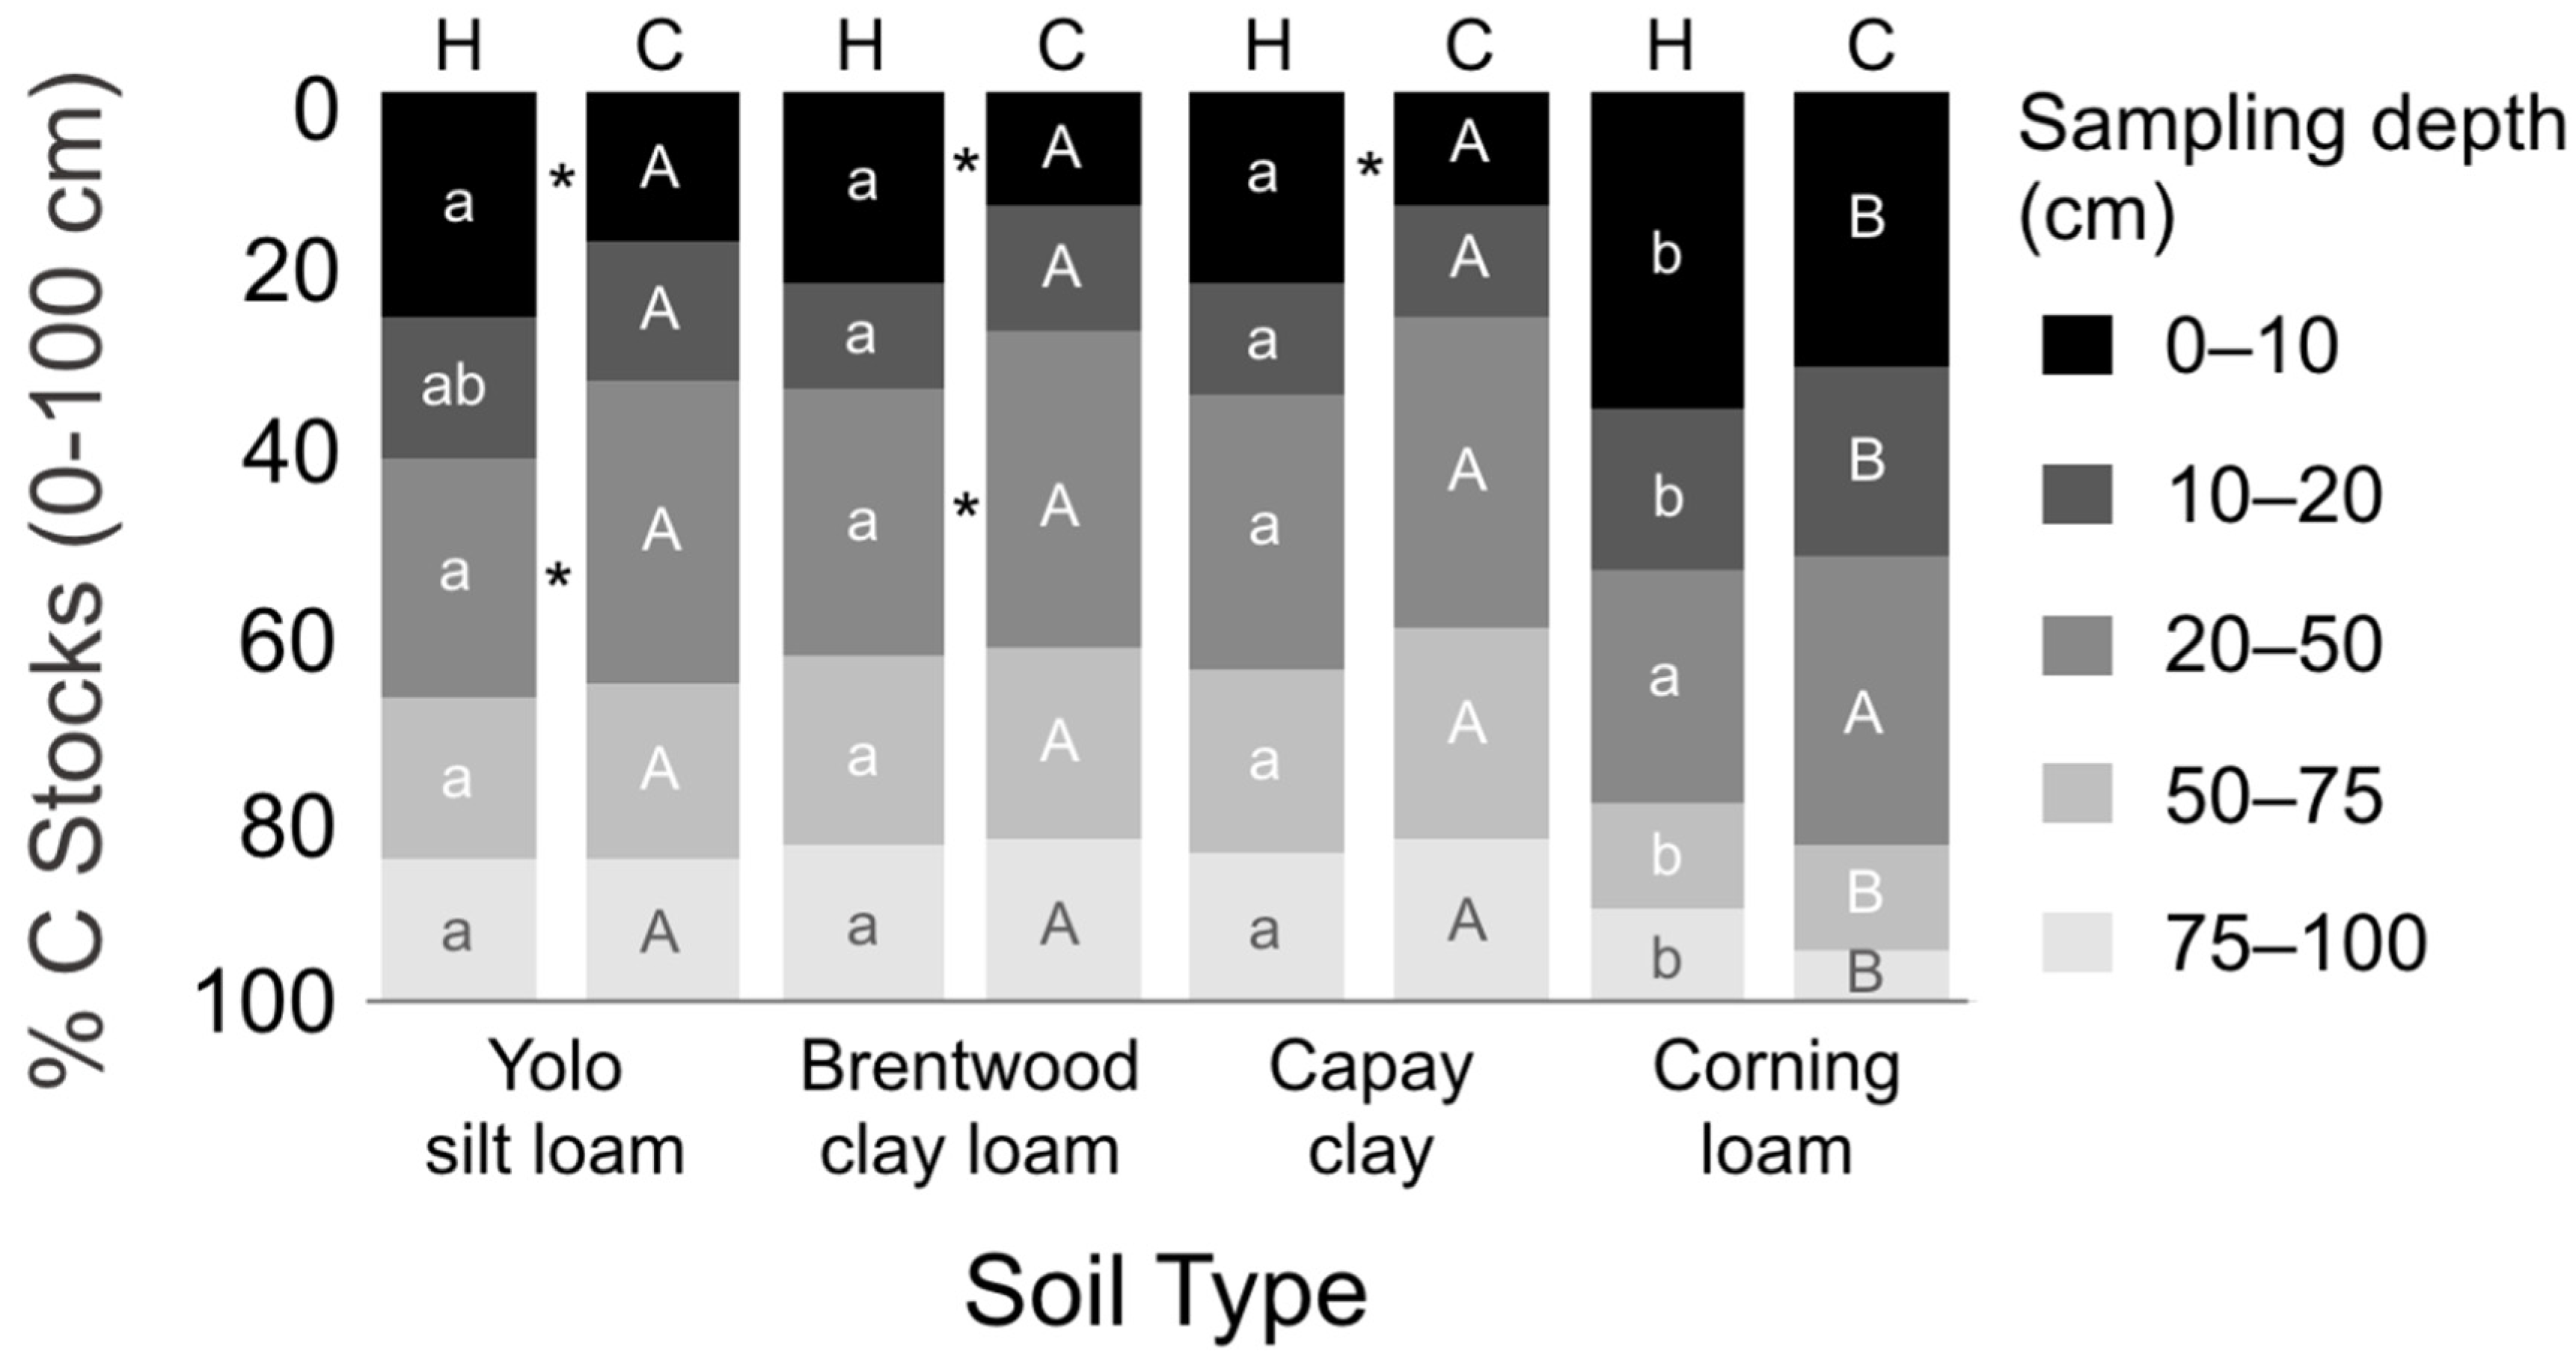
3.2. SOC Concentrations and Stocks by Depth

When analyzed by depth increments (Table 2; Figure S1), SOC concentrations (g kg−1) and SOC stocks (kg m−2) were significantly higher under hedgerows at all depths and across all soil types, except at 10–20 cm and 20–50 cm in Yolo (concentrations only) and Brentwood. At 0–10 cm, SOC in hedgerows was nearly double that of cultivated fields across soil types, likely due to both increased organic inputs and decreased decomposition. Hedgerows have been shown to increase litter deposition [31,78,79] and prevalence and turnover of fine roots [80,81].
The lack of disturbance (i.e., cessation of tillage) and constant ground cover under perennial woody shrubs may alter the physical environment in ways that impact microbial activity and overall C-dynamics. Hedgerows have been found to create more favorable microclimates [82,83,84], resulting in lower air and surface soil temperatures [85,86]. This may contribute to reduced microbial activity and/or increased carbon use efficiency in the surface 0–10 cm [43,87,88]. Soil moisture content may be lower or not significantly different, as year-round vegetative cover increases transpiration, some of which may be offset by reduced evaporation and increased infiltration [83,89,90]. Both lower moisture content and temperatures slow microbial activity and, thus, decomposition.
The greater concentrations of SOC at 50–75 and 75–100 cm under hedgerows could be the result of multiple mechanisms, including deep roots and their exudates [37,91], increased dissolved organic carbon that accompanies greater surface inputs [92,93], and/or increased bioturbation [94]. Cessation of tillage and the buildup of a litter layer can encourage increased prevalence of earthworms [95,96] and other invertebrates [97,98], which can redistribute organic materials throughout the profile. We observed a higher occurrence of earthworms and increased root density (Table S3) throughout the profile under hedgerows.
The distribution of SOC among horizons was significantly different between hedgerows and cultivated fields, except in Corning soils (Figure 4). Hedgerows had a greater proportion of C near the surface (0–10 cm), whereas cultivated fields had a greater proportion of C at 20–50 cm. Under hedgerows, Yolo, Brentwood, and Capay stored an average of 35% of C (kg m−2) at 0–20 cm and 65% at 20–100 cm. Under cultivated fields, these soils stored an average of 28% at 0–20 cm and 72% at 20–100 cm. Global estimates suggest that 30–63% of SOC stocks (0–100 cm) are situated at 30–100 cm [39,41]. Under hedgerows, studies have found 66% of SOC below 20 cm [18].
Corning soils exhibited a greater proportion of C at 0–20 cm and a lesser proportion at 50–100 cm (Figure 4). At 0–20 cm, Corning soils held 53% of SOC under hedgerows and 41% under cultivated fields. At 50–100 cm, Corning soils averaged 19% SOC, compared to an average of 37% under all other soil types. The Corning series has a root- and water-restrictive argillic horizon (claypan) with an upper boundary around 50 cm. This horizon likely limits root exploration, water percolation, and mixing via fauna.
While the proportion of total C stocks was higher in some cultivated subsoils (Yolo and Brentwood 20–50 cm), the absolute amount was lower, indicating that the difference is attributed to a lower relative C in the surface of cultivated fields, rather than mechanisms contributing additional C with depth. Long fallow without adequate C inputs has been shown to decrease SOC in Mediterranean agroecosystems [98,99,100]. Bare fallow leaves soil exposed for several months of the year and can increase soil temperatures in semi-arid environments by 5–10 °C relative to soils with vegetative cover [101,102,103]. Frequent tillage may also contribute to loss of SOC in the topsoil.

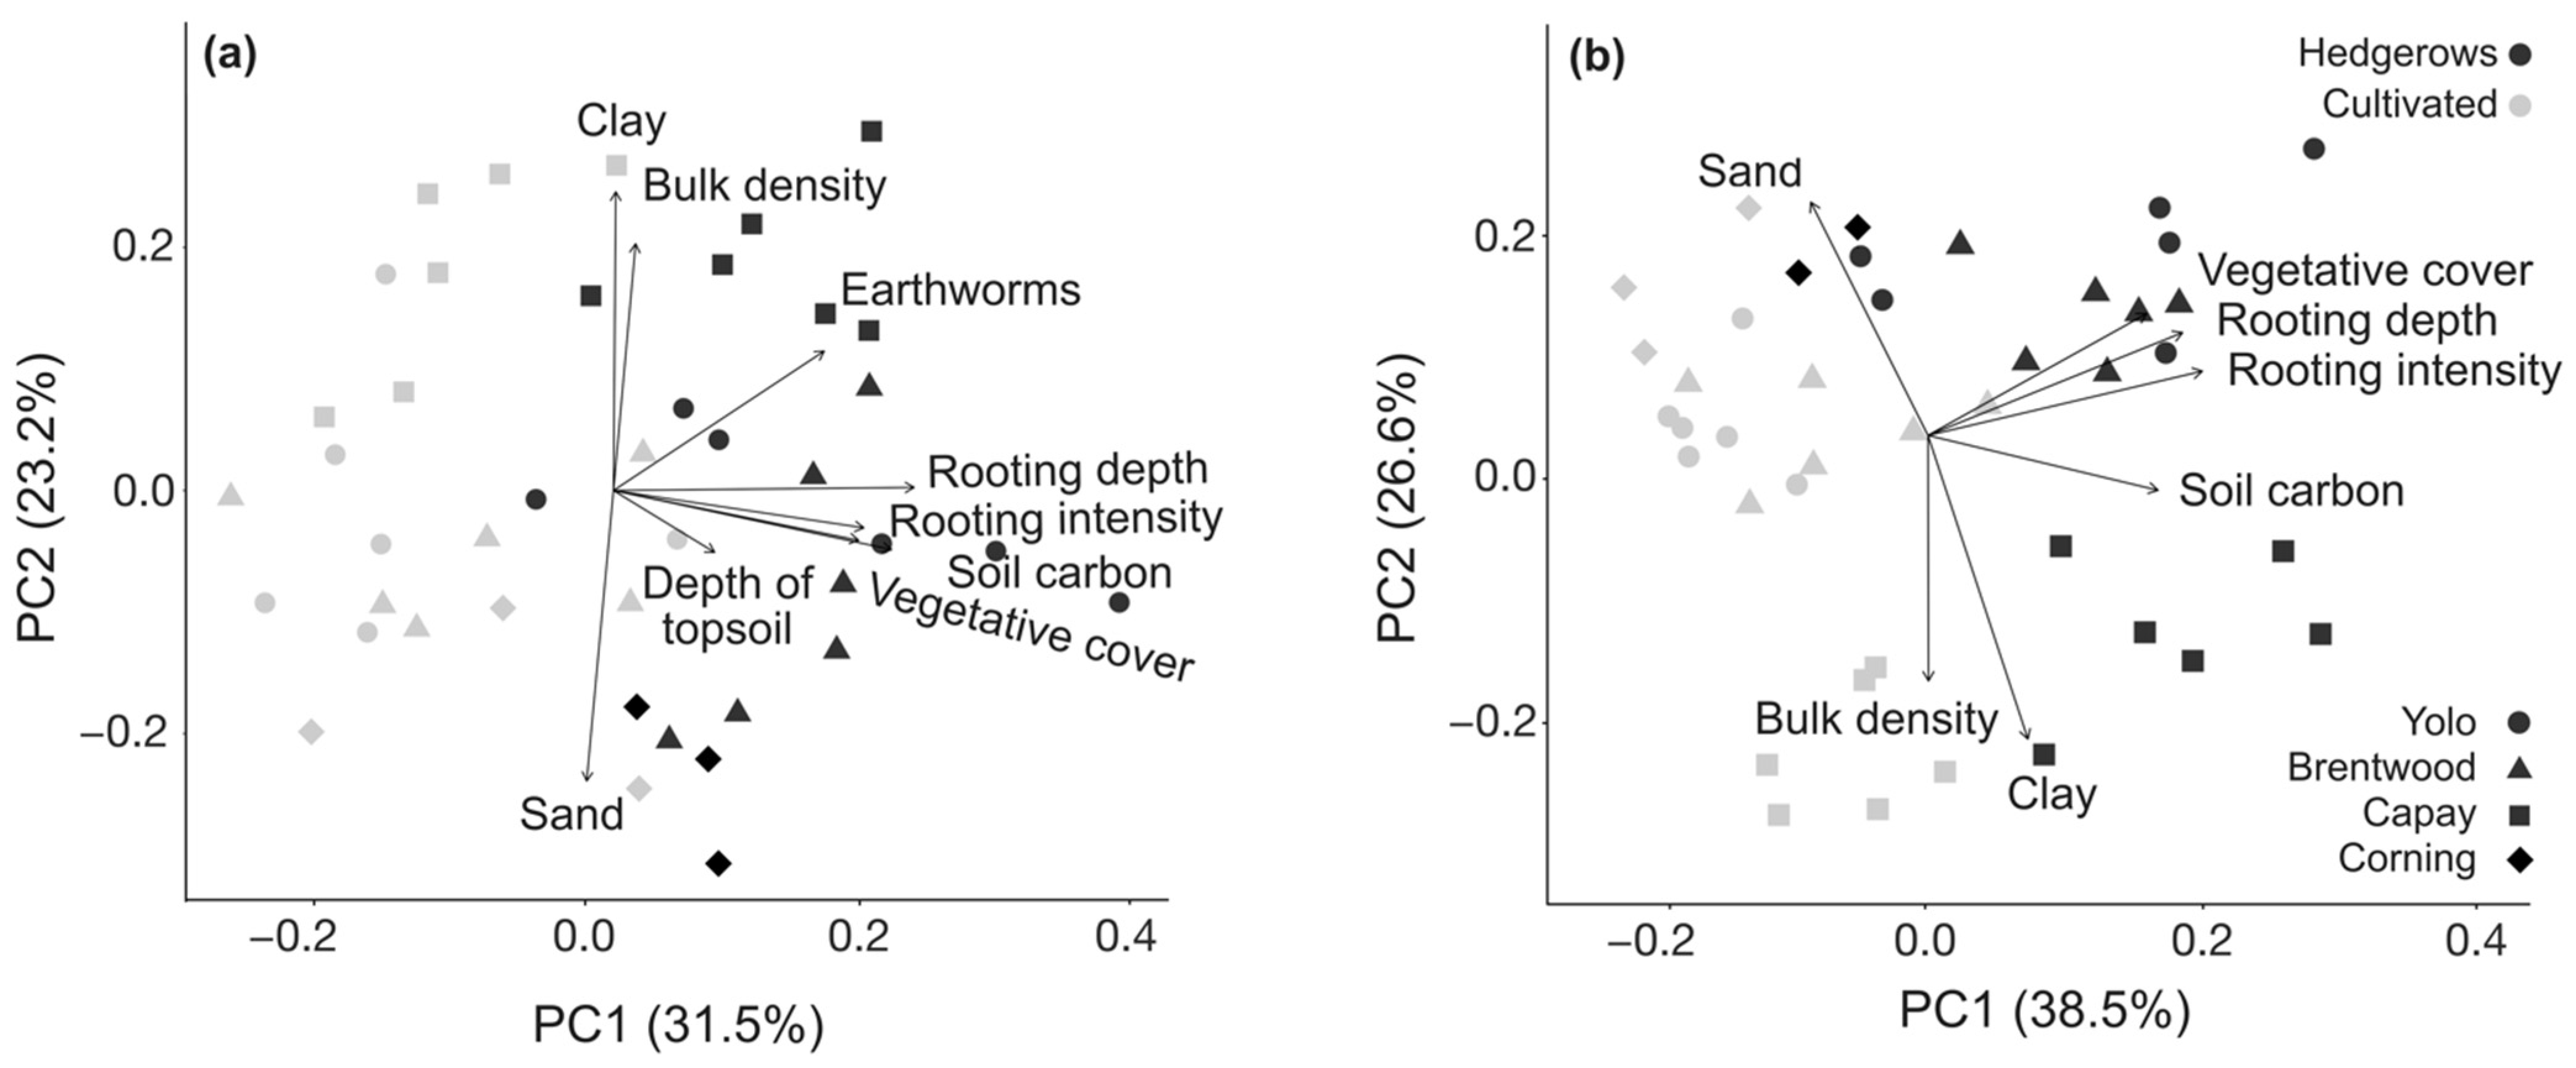
3.3. Multivariate Analysis of Management Effects

Ordination with PCA was performed to further examine the relationships between SOC, physicochemical properties, and variables from soil pit descriptions (Figure 5; Table S4). Three PCs accounted for 72% and 85% of the variation in the surface (0–20 cm) and subsurface (20–100 cm) depths, respectively. At both depths, cultivated and hedgerow soils formed distinct clusters along the x-axes of the biplots (PC1) with vectors represented by SOC and biological and morphological characteristics from soil pit descriptions. Amongst both hedgerows and cultivated fields, sites with the same soil type tended to group together along the y-axes (PC2). Vectors were represented by physical properties, such as bulk density and sand and clay content.
PC1 accounted for 31.5% of the variation at 0–20 cm and 38.5% at 20–100 cm with high positive loadings for root density, root depth, vegetative cover, and SOC, all of which were positively associated with hedgerows (Table S4). This supports our expectation that roots and increased vegetative cover (and the associated increases in litter deposition) contribute largely to differences in SOC under hedgerows. At 0–20 cm, PC2 explained 23.2% of the total variance with high positive loadings for clay content and bulk density, and high negative loadings for sand content. At 20–100 cm, PC2 represented 26.6% of the total variance with high positive loadings for sand and high negative loadings for clay and bulk density. Differentiation across the y-axis by soil type is more distinct, corroborating the increased effect of soil type at lower depths in our study and others [104,105]. Capay soils were negatively associated with PC1 and PC2, suggesting that the high clay content and bulk density were restrictive of root growth and SOC storage, especially in cultivated soils.

3.4. Scaling up—Potential Carbon Sinks State-wide

When considering their limited extent across an agroecosystem, hedgerows may not currently account for the greatest potential carbon sink on farms [106], although one California study found that hedgerows accounted for 18% of total on-farm C, despite only occupying 6% of the area [25]. To better understand the potential contribution toward reducing greenhouse gases and climate forcing, we used empirical results from our study sites and conservative adoption scenarios to estimate the state-wide potential for planting hedgerows along farm edges. Based on the assumptions in the methods above, we estimate 154,334 hectares of farm edges across California. Assuming a 50% adoption rate (77,167 ha) and an average increase in SOC storage of 38.3 Mg ha−1, this could store an additional 2,955,498 Mg C, or 10.8 MMT CO2e, in California soils. At an 80% adoption rate (123,467 ha), SOC storage would increase to 4,728,797 Mg C, or 17.3 MMT CO2e (Table 3). These adoption scenarios could account for between 7 and 12% of state-wide annual GHG reduction goals [107], though it can take 10 years or more to detect from the time of establishment. At estimated average household emissions of 4.83 MT CO2e [108,109], this could offset emissions by 2.5–4 million homes, or a similar number of combustion engine automobiles for one year. A 2008 policy report to the California Air Resources Board (CARB) estimated 202,350 ha of field edges could be revegetated on crop and rangelands across the state, considerably more than estimated in our calculations [110].
It was estimated that 100 m of hedgerows could be implemented per hectare across the European Union’s agricultural lands (3 times our estimate per farm), or 178 million ha total [111]. At 0.10 Mg C ha−1 yr−1, they estimated that hedgerow soils could store 65 MMT CO2e yr−1, or 2% of the total annual emissions in the EU (based on 2007 data). In the UK, it was estimated that the SOC sequestration potential for field margins was between 0.1 and 2.4% of their 1990-nationwide CO2 emissions [27]. None of these estimates, however, include woody biomass, which would greatly increase the C sequestration potential. In a field study in California, hedgerows stored approximately 25 Mg C ha−1 in woody biomass [25]. A recent meta-analysis including measured data from 64 hedgerows (mean height = 5 m) reported an average of 47 ± 29 Mg C ha−1 in above-ground biomass alone [28]. This would provide an additional technical potential of 13.3 ± 8.2–21.3 ± 13.1 MMT CO2e under our adoption scenarios.

3.5. Future Research

Further research is needed to (1) better characterize contributions of above- and below-ground woody C stocks (and relationships with tree/shrub dimensions); (2) identify appropriate hedgerow species for various contexts; and (3) investigate how SOC changes with distance from the hedgerow and determine if SOC gains extend into the field or are offset by losses, due to light interception or competition between tree/shrub roots and crops. The impact of field edge plantings on soil health and yields in adjacent fields should also be characterized. Where possible, larger sample sizes are recommended to ensure sufficient replication and statistical power to detect changes over the high spatial variability of SOC [112].

4. Conclusions

Our results demonstrate that restoration of field edges with hedgerows has a pronounced impact on SOC storage with significant differences extending throughout the profile to a depth of 100 cm. The differential between hedgerows and cultivated fields was similar across soil types, indicating that hedgerows may have broad potential across edaphic contexts, although further investigation is necessary on soils with more diverse mineralogy, degree of weathering, and climates than the study region. Although farm edges do not constitute a substantial proportion of total farm area, if implemented at broad scale, hedgerows could contribute to a small portion of GHG reduction goals, while promoting biodiversity, providing critical habitats in increasingly fragmented agricultural landscapes, and supporting a host of co-benefits and ecosystem services.
The presence of hedgerows had the strongest effect on SOC in the surface at 0–10 cm and at 50–100 cm, with the perennial cover and root systems of the hedgerows explaining much of the variation in SOC. At 20–100 cm, inherent soil properties/soil type contributed more to the variation in SOC than in the surface at 0–20 cm. Soil type should always be considered in sampling design and model development.

Supplementary Materials

The following supporting information can be downloaded at: https://www.mdpi.com/article/10.3390/su141912901/s1, Figure S1: Box plots of soil organic carbon concentration; Table S1: Soil properties to a depth of 1 m; Table S2: Total soil nitrogen concentrations, carbon-to-nitrogen ratios, and pH to a depth of 1 m; Table S3: Mean values and standard error for input data used in Principal Component Analysis; Table S4: Summary results from the first three principal components of a PCA of soil physicochemical properties and biological indicators, Table S5: Spatial information on extent of 21 hedgerows and adjacent cultivated fields, including the percent total of each field occupied by hedgerows.

Author Contributions

J.L.C.: Conceptualization, methodology, formal analysis, investigation, data curation, writing—original draft preparation, review and editing, visualization, and project administration; L.E.J.: conceptualization, methodology, investigation, writing—original draft preparation, writing—review and editing, supervision; R.F.L.: investigation, resources, writing—review and editing; A.J.M.: resources, writing—review and editing; A.T.O.: methodology, resources, writing—review and editing, supervision. All authors have read and agreed to the published version of the manuscript.

Funding

This research received no external funding.

Institutional Review Board Statement

Not applicable.

Informed Consent Statement

Not applicable.

Data Availability Statement

Data supporting reported results can be found at https://do.org/10.17632/p5nbm6s32v.1.

Acknowledgments

We would like to acknowledge all the incredible Yolo County growers who were kind enough to have us come out and dig holes in the middle of their hedgerows and fields and for sharing information on past management and intentions/experience with hedgerows. Thanks go to the late John Anderson and Hedgerow Farms for all their work to increase hedgerow adoption across Yolo County and beyond.

Conflicts of Interest

The authors declare no conflict of interest.

References

  1. Amundson, R. The Carbon Budget in Soils. Annu. Rev. Earth Planet. Sci. 2001, 29, 535–562. [Google Scholar] [CrossRef]
  2. Sanderman, J.; Hengl, T.; Fiske, G.J. Soil Carbon Debt of 12,000 Years of Human Land Use. Proc. Natl. Acad. Sci. USA 2017, 114, 9575–9580. [Google Scholar] [CrossRef] [PubMed] [Green Version]
  3. Hansen, J.; Sato, M.; Kharecha, P.; Von Schuckmann, K.; Beerling, D.J.; Cao, J.; Marcott, S.; Masson-Delmotte, V.; Prather, M.J.; Rohling, E.J.; et al. Young People’s Burden: Requirement of Negative CO2 Emissions. Earth Syst. Dyn. 2017, 8, 577–616. [Google Scholar] [CrossRef] [Green Version]
  4. Smith, P. Soil Carbon Sequestration and Biochar as Negative Emission Technologies. Glob. Change Biol. 2016, 22, 1315–1324. [Google Scholar] [CrossRef] [PubMed]
  5. Amelung, W.; Bossio, D.; de Vries, W.; Kögel-Knabner, I.; Lehmann, J.; Amundson, R.; Bol, R.; Collins, C.; Lal, R.; Leifeld, J.; et al. Towards a Global-Scale Soil Climate Mitigation Strategy. Nat. Commun. 2020, 11, 5427. [Google Scholar] [CrossRef]
  6. Kirkby, C.A.; Richardson, A.E.; Wade, L.J.; Batten, G.D.; Blanchard, C.; Kirkegaard, J.A. Carbon-Nutrient Stoichiometry to Increase Soil Carbon Sequestration. Soil Biol. Biochem. 2013, 60, 77–86. [Google Scholar] [CrossRef]
  7. van Groenigen, J.W.; van Kessel, C.; Hungate, B.A.; Oenema, O.; Powlson, D.S.; van Groenigen, K.J. Sequestering Soil Organic Carbon: A Nitrogen Dilemma. Environ. Sci. Technol. 2017, 51, 4738–4739. [Google Scholar] [CrossRef] [Green Version]
  8. Janzen, H.H.; van Groenigen, K.J.; Powlson, D.S.; Schwinghamer, T.; van Groenigen, J.W. Photosynthetic Limits on Carbon Sequestration in Croplands. Geoderma 2022, 416, 115810. [Google Scholar] [CrossRef]
  9. Poulton, P.; Johnston, J.; Macdonald, A.; White, R.; Powlson, D. Major Limitations to Achieving “4 per 1000” Increases in Soil Organic Carbon Stock in Temperate Regions: Evidence from Long-Term Experiments at Rothamsted Research, United Kingdom. Glob. Change Biol. 2018, 24, 2563–2584. [Google Scholar] [CrossRef] [Green Version]
  10. Amundson, R.; Biardeau, L. Soil Carbon Sequestration Is an Elusive Climate Mitigation Tool. Proc. Natl. Acad. Sci. USA 2018, 115, 11652–11656. [Google Scholar] [CrossRef]
  11. Paustian, K.; Lehmann, J.; Ogle, S.; Reay, D.; Robertson, G.P.; Smith, P. Climate-Smart Soils. Nature 2016, 532, 49–57. [Google Scholar] [CrossRef] [Green Version]
  12. Bossio, D.A.; Cook-Patton, S.C.; Ellis, P.W.; Fargione, J.; Sanderman, J.; Smith, P.; Wood, S.; Zomer, R.J.; von Unger, M.; Emmer, I.M.; et al. The Role of Soil Carbon in Natural Climate Solutions. Nat. Sustain. 2020, 3, 391–398. [Google Scholar] [CrossRef]
  13. Paustian, K.; Collier, S.; Baldock, J.; Burgess, R.; Creque, J.; DeLonge, M.; Dungait, J.; Ellert, B.; Frank, S.; Goddard, T.; et al. Quantifying Carbon for Agricultural Soil Management: From the Current Status toward a Global Soil Information System. Carbon Manag. 2019, 10, 567–587. [Google Scholar] [CrossRef] [Green Version]
  14. Tautges, N.E.; Chiartas, J.L.; Gaudin, A.C.M.; O’Geen, A.T.; Herrera, I.; Scow, K.M. Deep Soil Inventories Reveal That Impacts of Cover Crops and Compost on Soil Carbon Sequestration Differ in Surface and Subsurface Soils. Glob. Change Biol. 2019, 25, 3753–3766. [Google Scholar] [CrossRef] [PubMed] [Green Version]
  15. Aguilera, E.; Lassaletta, L.; Gattinger, A.; Gimeno, B.S. Managing Soil Carbon for Climate Change Mitigation and Adaptation in Mediterranean Cropping Systems: A Meta-Analysis. Agric. Ecosyst. Environ. 2013, 168, 25–36. [Google Scholar] [CrossRef]
  16. Schoeneberger, M.M. Agroforestry: Working Trees for Sequestering Carbon on Agricultural Lands. Agrofor. Syst. 2009, 75, 27–37. [Google Scholar] [CrossRef] [Green Version]
  17. Wang, F.; Xu, X.; Zou, B.; Guo, Z.; Li, Z.; Zhu, W. Biomass Accumulation and Carbon Sequestration in Four Different Aged Casuarina Equisetifolia Coastal Shelterbelt Plantations in South China. PLoS ONE 2013, 8, e77449. [Google Scholar] [CrossRef]
  18. Thiel, B.; Smukler, S.M.; Krzic, M.; Gergel, S.; Terpsma, C. Using Hedgerow Biodiversity to Enhance the Carbon Storage of Farmland in the Fraser River Delta of British Columbia. J. Soil Water Conserv. 2015, 70, 247–256. [Google Scholar] [CrossRef]
  19. Brodt, S.B.; Fontana, N.M.; Archer, L.F. Feasibility and Sustainability of Agroforestry in Temperate Industrialized Agriculture: Preliminary Insights from California. Renew. Agric. Food Syst. 2020, 35, 513–521. [Google Scholar] [CrossRef]
  20. Ghazavi, G.; Thomas, Z.; Hamon, Y.; Marie, J.C.; Corson, M.; Merot, P. Hedgerow Impacts on Soil-Water Transfer Due to Rainfall Interception and Root-Water Uptake. Hydrol. Process. 2008, 22, 4723–4735. [Google Scholar] [CrossRef]
  21. Long, R.; Anderson, J. Establishing Hedgerows on Farms in California; University of California Agriculture and Natural Resources: Richmond, CA, USA, 2010; ISBN 978-1-60107-662-5. [Google Scholar]
  22. Morandin, L.; Long, R.; Pease, C.; Kremen, C. Hedgerows Enhance Beneficial Insects on Farms in California’s Central Valley. Calif. Agric. 2011, 65, 197–201. [Google Scholar] [CrossRef] [Green Version]
  23. Morandin, L.A.; Long, R.F.; Kremen, C. Pest Control and Pollination Cost–Benefit Analysis of Hedgerow Restoration in A Simplified Agricultural Landscape. J. Econ. Entomol. 2016, 109, 1020–1027. [Google Scholar] [CrossRef] [PubMed] [Green Version]
  24. Heath, S.K.; Long, R.F. Multiscale Habitat Mediates Pest Reduction by Birds in an Intensive Agricultural Region. Ecosphere 2019, 10, e02884. [Google Scholar] [CrossRef] [Green Version]
  25. Smukler, S.M.; Sánchez-Moreno, S.; Fonte, S.J.; Ferris, H.; Klonsky, K.; O’Geen, A.T.; Scow, K.M.; Steenwerth, K.L.; Jackson, L.E. Biodiversity and Multiple Ecosystem Functions in an Organic Farmscape. Agric. Ecosyst. Environ. 2010, 139, 80–97. [Google Scholar] [CrossRef]
  26. Long, R.; Garbach, K.; Morandin, L. Hedgerow Benefits Align with Food Production and Sustainability Goals. Calif. Agric. 2017, 71, 117–119. [Google Scholar] [CrossRef] [Green Version]
  27. Falloon, P.; Powlson, D.; Smith, P. Managing Field Margins for Biodiversity and Carbon Sequestration: A Great Britain Case Study. Soil Use Manag. 2006, 20, 240–247. [Google Scholar] [CrossRef]
  28. Drexler, S.; Gensior, A.; Don, A. Carbon Sequestration in Hedgerow Biomass and Soil in the Temperate Climate Zone. Reg. Environ. Change 2021, 21, 74. [Google Scholar] [CrossRef]
  29. Zheng, Y.; Wang, H.; Qin, Q.; Wang, Y. Effect of Plant Hedgerows on Agricultural Non-Point Source Pollution: A Meta-Analysis. Environ. Sci. Pollut. Res. 2020, 27, 24831–24847. [Google Scholar] [CrossRef]
  30. Pardon, P.; Reubens, B.; Reheul, D.; Mertens, J.; De Frenne, P.; Coussement, T.; Janssens, P.; Verheyen, K. Trees Increase Soil Organic Carbon and Nutrient Availability in Temperate Agroforestry Systems. Agric. Ecosyst. Environ. 2017, 247, 98–111. [Google Scholar] [CrossRef]
  31. Cardinael, R.; Guenet, B.; Chevallier, T.; Dupraz, C.; Cozzi, T.; Chenu, C. High Organic Inputs Explain Shallow and Deep SOC Storage in a Long-Term Agroforestry System—Combining Experimental and Modeling Approaches. Biogeosciences 2018, 15, 297–317. [Google Scholar] [CrossRef]
  32. Walter, C.; Merot, P.; Layer, B.; Dutin, G. The Effect of Hedgerows on Soil Organic Carbon Storage in Hillslopes. Soil Use Manag. 2003, 19, 201–207. [Google Scholar] [CrossRef]
  33. Lorenz, K.; Lal, R. Soil Organic Carbon Sequestration in Agroforestry Systems. A Review. Agron. Sustain. Dev. 2014, 34, 443–454. [Google Scholar] [CrossRef] [Green Version]
  34. Cardinael, R.; Mao, Z.; Prieto, I.; Stokes, A.; Dupraz, C.; Kim, J.H.; Jourdan, C. Competition with Winter Crops Induces Deeper Rooting of Walnut Trees in a Mediterranean Alley Cropping Agroforestry System. Plant Soil 2015, 391, 219–235. [Google Scholar] [CrossRef]
  35. Biffi, S.; Chapman, P.J.; Grayson, R.P.; Ziv, G. Soil Carbon Sequestration Potential of Planting Hedgerows in Agricultural Landscapes. J. Environ. Manag. 2022, 307, 114484. [Google Scholar] [CrossRef] [PubMed]
  36. Canadell, J.; Jackson, R.B.; Ehleringer, J.B.; Mooney, H.A.; Sala, O.E.; Schulze, E.-D. Maximum Rooting Depth of Vegetation Types at the Global Scale. Oecologia 1996, 108, 583–595. [Google Scholar] [CrossRef]
  37. Upson, M.A.; Burgess, P.J. Soil Organic Carbon and Root Distribution in a Temperate Arable Agroforestry System. Plant Soil 2013, 373, 43–58. [Google Scholar] [CrossRef] [Green Version]
  38. Thorup-Kristensen, K.; Halberg, N.; Nicolaisen, M.; Olesen, J.E.; Crews, T.E.; Hinsinger, P.; Kirkegaard, J.; Pierret, A.; Dresbøll, D.B. Digging Deeper for Agricultural Resources, the Value of Deep Rooting. Trends Plant Sci. 2020, 25, 406–417. [Google Scholar] [CrossRef] [Green Version]
  39. Jobbágy, E.G.; Jackson, R.B. The Vertical Distribution of Soil Organic Carbon and Its Relation to Climate and Vegetation. Ecol. Appl. 2000, 10, 423–436. [Google Scholar] [CrossRef]
  40. Rasmussen, C.; Throckmorton, H.; Liles, G.; Heckman, K.; Meding, S.; Horwath, W.R. Controls on Soil Organic Carbon Partitioning and Stabilization in the California Sierra Nevada. Soil Syst. 2018, 2, 41. [Google Scholar] [CrossRef] [Green Version]
  41. Kögel-Knabner, I.; Amelung, W. Soil Organic Matter in Major Pedogenic Soil Groups. Geoderma 2021, 384, 114785. [Google Scholar] [CrossRef]
  42. Laganière, J.; Angers, D.A.; Paré, D. Carbon Accumulation in Agricultural Soils after Afforestation: A Meta-Analysis. Glob. Change Biol. 2010, 16, 439–453. [Google Scholar] [CrossRef]
  43. Doetterl, S.; Stevens, A.; Six, J.; Merckx, R.; Van Oost, K.; Casanova Pinto, M.; Casanova-Katny, A.; Muñoz, C.; Boudin, M.; Zagal Venegas, E.; et al. Soil Carbon Storage Controlled by Interactions between Geochemistry and Climate. Nat. Geosci. 2015, 8, 780–783. [Google Scholar] [CrossRef]
  44. Wiesmeier, M.; Urbanski, L.; Hobley, E.; Lang, B.; von Luetzow, M.; Marin-Spiotta, E.; van Wesemael, B.; Rabot, E.; Liess, M.; Garcia-Franco, N.; et al. Soil Organic Carbon Storage as a Key Function of Soils—A Review of Drivers and Indicators at Various Scales. Geoderma 2019, 333, 149–162. [Google Scholar] [CrossRef]
  45. Robins, P.; Holmes, R.B.; Laddish, K. Bring Farm Edges back to Life! Yolo County RCD: Woodland, CA, USA, 2001. [Google Scholar]
  46. Brodt, S.; Klonsky, K.; Jackson, L.; Brush, S.B.; Smukler, S. Factors Affecting Adoption of Hedgerows and Other Biodiversity-Enhancing Features on Farms in California, USA. Agrofor. Syst. 2009, 76, 195–206. [Google Scholar] [CrossRef]
  47. Suddick, E.C.; Scow, K.M.; Horwath, W.R.; Jackson, L.E.; Smart, D.R.; Mitchell, J.; Six, J. The Potential for California Agricultural Crop Soils to Reduce Greenhouse Gas Emissions: A Holistic Evaluation. Adv. Agron. 2010, 107, 123–162. [Google Scholar]
  48. Hayhoe, K.; Cayan, D.; Field, C.B.; Frumhoff, P.C.; Maurer, E.P.; Miller, N.L.; Moser, S.C.; Schneider, S.H.; Cahill, K.N.; Cleland, E.E.; et al. Emissions Pathways, Climate Change, and Impacts on California. Proc. Natl. Acad. Sci. USA 2004, 101, 12422–12427. [Google Scholar] [CrossRef] [Green Version]
  49. Romanyà, J.; Rovira, P. An Appraisal of Soil Organic C Content in Mediterranean Agricultural Soils. Soil Use Manag. 2011, 27, 321–332. [Google Scholar] [CrossRef]
  50. Muñoz-Rojas, M.; Jordán, A.; Zavala, L.M.; De la Rosa, D.; Abd-Elmabod, S.K.; Anaya-Romero, M. Organic Carbon Stocks in Mediterranean Soil Types under Different Land Uses (Southern Spain). Solid Earth 2012, 3, 375–386. [Google Scholar] [CrossRef] [Green Version]
  51. Williams, J.N.; Hollander, A.D.; O’Geen, A.T.; Thrupp, L.A.; Hanifin, R.; Steenwerth, K.; McGourty, G.; Jackson, L.E. Assessment of Carbon in Woody Plants and Soil across a Vineyard-Woodland Landscape. Carbon Balance Manag. 2011, 6, 11. [Google Scholar] [CrossRef] [Green Version]
  52. Andrews, W.F. Soil Survey of Yolo County, California; US Department of Agriculture, Soil Conservation Service: Washington, DC, USA, 1972.
  53. Culman, S.W.; Young-Mathews, A.; Hollander, A.D.; Ferris, H.; Sánchez-Moreno, S.; O’Geen, A.T.; Jackson, L.E. Biodiversity Is Associated with Indicators of Soil Ecosystem Functions over a Landscape Gradient of Agricultural Intensification. Landsc. Ecol. 2010, 25, 1333–1348. [Google Scholar] [CrossRef]
  54. Earnshaw, S. Hedgerows for California Agriculture; Community Alliance for Family Farmers: Davis, CA, USA, 2004. [Google Scholar]
  55. Garbach, K.; Long, R.F. Determinants of Field Edge Habitat Restoration on Farms in California’s Sacramento Valley. J. Environ. Manag. 2017, 189, 134–141. [Google Scholar] [CrossRef] [PubMed]
  56. Yolo County. Yolo County Climate Action Plan: A Strategy for Smart Growth Implementation, Greenhouse Gas Reduction, and Adaptation to Global Climate Change; Yolo County Board of Supervisors: Woodland, CA, USA, 2011. [Google Scholar]
  57. Series Extent Explorer, Soil Web. California Soil Resource Lab. 2017. Available online: https://casoilresource.lawr.ucdavis.edu/see/ (accessed on 20 September 2021).
  58. O’Geen, A.; Walkinshaw, M.; Beaudette, D. SoilWeb: A Multifaceted Interface to Soil Survey Information. Soil Sci. Soc. Am. J. 2017, 81, 853–862. [Google Scholar] [CrossRef]
  59. Schoeneberger, P.J.; Wysocki, D.A.; Benham, E.C. Field Book for Describing and Sampling Soils; Government Printing Office: Washington, DC, USA, 2012; ISBN 978-0-16-091542-0.
  60. Lee, K.E. Earthworms: Their Ecology and Relationships with Soils and Land Use; Academic Press: London, UK, 1985. [Google Scholar]
  61. Blake, G.R.; Hartge, K.H. Particle Density. In Methods of Soil Analysis; John Wiley & Sons, Ltd.: Hoboken, NJ, USA, 1986; pp. 377–382. ISBN 978-0-89118-864-3. [Google Scholar]
  62. Miller, R.O.; Kissel, D.E. Comparison of Soil PH Methods on Soils of North America. Soil Sci. Soc. Am. J. 2010, 74, 310–316. [Google Scholar] [CrossRef]
  63. Gavlak, R.; Horneck, D.; Miller, R.O. Soil, Plant and Water Reference Methods for the Western Region. Western Region Extension Publication (WREP-125). WERA-103 Technical Committee; University of Alaska: Fairbanks, AK, USA, 2005. [Google Scholar]
  64. Blair, G.J.; Lefroy, R.D.B.; Lisle, L. Soil Carbon Fractions Based on Their Degree of Oxidation, and the Development of a Carbon Management Index for Agricultural Systems. Aust. J. Agric. Res. 1995, 46, 1459–1466. [Google Scholar] [CrossRef]
  65. Hedges, J.; Stern, J. Carbon and Nitrogen Determinations of Carbonate-Containing Solids. Limnol. Oceanogr. 1984, 29, 657–663. [Google Scholar] [CrossRef]
  66. Batjes, N.H. Total Carbon and Nitrogen in the Soils of the World. Eur. J. Soil Sci. 2014, 65, 10–21. [Google Scholar] [CrossRef]
  67. Pinheiro, J.C.; Bates, D.M.; DebRoy, S.; Sarkar, D.; R Core Team. nlme: Linear and Nonlinear Mixed Effects Models. R Package Version 3.1; R Core Team: Vienna, Austria, 2008; pp. 1–89. [Google Scholar]
  68. Wickham, H. Manipulating Data. Ggplot2; Springer: New York, NY, USA, 2002; pp. 157–175. [Google Scholar]
  69. Oksanen, J. Constrained Ordination: Tutorial with R and Vegan. R-Packace Vegan 2012, 1, 1–10. [Google Scholar]
  70. Jolliffe, I.T. Principal Components in Regression Analysis. In Principal Component Analysis; Springer: New York, NY, USA, 2002; pp. 167–198. [Google Scholar]
  71. NASS National Agricultural Statistics Service. California Production Data. 2021. Available online: https://www.nass.usda.gov/ (accessed on 1 August 2021).
  72. Laura, V.V.; Bert, R.; Steven, B.; Pieter, D.F.; Victoria, N.; Paul, P.; Kris, V. Ecosystem Service Delivery of Agri-Environment Measures: A Synthesis for Hedgerows and Grass Strips on Arable Land. Agric. Ecosyst. Environ. 2017, 244, 32–51. [Google Scholar] [CrossRef]
  73. Lim, S.-S.; Baah-Acheamfour, M.; Choi, W.-J.; Arshad, M.A.; Fatemi, F.; Banerjee, S.; Carlyle, C.N.; Bork, E.W.; Park, H.-J.; Chang, S.X. Soil Organic Carbon Stocks in Three Canadian Agroforestry Systems: From Surface Organic to Deeper Mineral Soils. For. Ecol. Manag. 2018, 417, 103–109. [Google Scholar] [CrossRef]
  74. Viaud, V.; Kunnemann, T. Additional Soil Organic Carbon Stocks in Hedgerows in Crop-Livestock Areas of Western France. Agric. Ecosyst. Environ. 2021, 305, 107174. [Google Scholar] [CrossRef]
  75. Young-Mathews, A.; Culman, S.W.; Sánchez-Moreno, S.; Toby O’Geen, A.; Ferris, H.; Hollander, A.D.; Jackson, L.E. Plant-Soil Biodiversity Relationships and Nutrient Retention in Agricultural Riparian Zones of the Sacramento Valley, California. Agro for. Syst. 2010, 80, 41–60. [Google Scholar] [CrossRef] [Green Version]
  76. Stewart, C.E.; Paustian, K.; Conant, R.T.; Plante, A.F.; Six, J. Soil Carbon Saturation: Concept, Evidence and Evaluation. Biogeochemistry 2007, 86, 19–31. [Google Scholar] [CrossRef]
  77. West, T.O.; Six, J. Considering the Influence of Sequestration Duration and Carbon Saturation on Estimates of Soil Carbon Capacity. Clim. Change 2007, 80, 25–41. [Google Scholar] [CrossRef]
  78. Chander, K.; Goyal, S.; Nandal, D.P.; Kapoor, K.K. Soil Organic Matter, Microbial Biomass and Enzyme Activities in a Tropical Agroforestry System. Biol. Fertil. Soils 1998, 27, 168–172. [Google Scholar] [CrossRef]
  79. Ramos, H.M.N.; Vasconcelos, S.S.; Kato, O.R.; Castellani, D.C. Above- and Belowground Carbon Stocks of Two Organic, Agroforestry-Based Oil Palm Production Systems in Eastern Amazonia. Agrofor. Syst. 2018, 92, 221–237. [Google Scholar] [CrossRef]
  80. Lehmann, J.; Zech, W. Fine Root Turnover of Irrigated Hedgerow Intercropping in Northern Kenya. Plant Soil 1998, 198, 19–31. [Google Scholar] [CrossRef]
  81. Nair, P.R.; Nair, V.D.; Kumar, B.M.; Showalter, J.M. Carbon sequestration in agroforestry systems. Adv. Agron. 2010, 108, 237–307. [Google Scholar] [CrossRef]
  82. Sánchez, I.A.; Lassaletta, L.; McCollin, D.; Bunce, R.G.H. The Effect of Hedgerow Loss on Microclimate in the Mediterranean Region: An Investigation in Central Spain. Agrofor. Syst. 2010, 78, 13–25. [Google Scholar] [CrossRef]
  83. Kanzler, M.; Böhm, C.; Mirck, J.; Schmitt, D.; Veste, M. Microclimate Effects on Evaporation and Winter Wheat (Triticum Aestivum L.) Yield within a Temperate Agroforestry System. Agrofor. Syst. 2019, 93, 1821–1841. [Google Scholar] [CrossRef]
  84. Veste, M.; Littmann, T.; Kunneke, A.; du Toit, B.; Seifert, T. Windbreaks as Part of Climate-Smart Landscapes Reduce Evapotranspiration in Vineyards, Western Cape Province, South Africa. Plant Soil Environ. 2020, 66, 119–127. [Google Scholar] [CrossRef] [Green Version]
  85. Clinch, R.L.; Thevathasan, N.V.; Gordon, A.M.; Volk, T.A.; Sidders, D. Biophysical Interactions in a Short Rotation Willow Intercropping System in Southern Ontario, Canada. Agric. Ecosyst. Environ. 2009, 131, 61–69. [Google Scholar] [CrossRef]
  86. Dubbert, M.; Mosena, A.; Piayda, A.; Cuntz, M.; Correia, A.C.; Pereira, J.S.; Werner, C. Influence of Tree Cover on Herbaceous Layer Development and Carbon and Water Fluxes in a Portuguese Cork-Oak Woodland. Acta Oecologica 2014, 59, 35–45. [Google Scholar] [CrossRef]
  87. Allison, S.D.; Wallenstein, M.D.; Bradford, M.A. Soil-Carbon Response to Warming Dependent on Microbial Physiology. Nat. Geosci. 2010, 3, 336–340. [Google Scholar] [CrossRef]
  88. Frey, S.D.; Lee, J.; Melillo, J.M.; Six, J. The Temperature Response of Soil Microbial Efficiency and Its Feedback to Climate. Nat. Clim. Change 2013, 3, 395–398. [Google Scholar] [CrossRef]
  89. Mérot, P. The Influence of Hedgerow Systems on the Hydrology of Agricultural Catchments in a Temperate Climate. Agronomie 1999, 19, 655–669. [Google Scholar] [CrossRef] [Green Version]
  90. Ilstedt, U.; Bargués Tobella, A.; Bazié, H.R.; Bayala, J.; Verbeeten, E.; Nyberg, G.; Sanou, J.; Benegas, L.; Murdiyarso, D.; Laudon, H.; et al. Intermediate Tree Cover Can Maximize Groundwater Recharge in the Seasonally Dry Tropics. Sci. Rep. 2016, 6, 21930. [Google Scholar] [CrossRef] [Green Version]
  91. Germon, A.; Cardinael, R.; Prieto, I.; Mao, Z.; Kim, J.; Stokes, A.; Dupraz, C.; Laclau, J.-P.; Jourdan, C. Unexpected Phenology and Lifespan of Shallow and Deep Fine Roots of Walnut Trees Grown in a Silvoarable Mediterranean Agroforestry System. Plant Soil 2016, 401, 409–426. [Google Scholar] [CrossRef]
  92. Kaiser, K.; Kalbitz, K. Cycling Downwards—Dissolved Organic Matter in Soils. Soil Biol. Biochem. 2012, 52, 29–32. [Google Scholar] [CrossRef]
  93. Toosi, E.R.; Doane, T.A.; Horwath, W.R. Abiotic Solubilization of Soil Organic Matter, a Less-Seen Aspect of Dissolved Organic Matter Production. Soil Biol. Biochem. 2012, 50, 12–21. [Google Scholar] [CrossRef]
  94. Wilkinson, M.T.; Richards, P.J.; Humphreys, G.S. Breaking Ground: Pedological, Geological, and Ecological Implications of Soil Bioturbation. Earth-Sci. Rev. 2009, 97, 257–272. [Google Scholar] [CrossRef]
  95. Rovira, A.D.; Smettem, K.R.J.; Lee, K.E. Effect of Rotation and Conservation Tillage of Earthworms in a Red-Brown Earth under Wheat. Aust. J. Agric. Res 1987, 38, 829–834. [Google Scholar] [CrossRef]
  96. Briones, M.J.I.; Schmidt, O. Conventional Tillage Decreases the Abundance and Biomass of Earthworms and Alters Their Community Structure in a Global Meta-Analysis. Glob. Change Biol. 2017, 23, 4396–4419. [Google Scholar] [CrossRef] [PubMed]
  97. Errouissi, F.; Ben Moussa-Machraoui, S.; Ben-Hammouda, M.; Nouira, S. Soil Invertebrates in Durum Wheat (Triticum Durum L.) Cropping System under Mediterranean Semi Arid Conditions: A Comparison between Conventional and No-Tillage Management. Soil Tillage Res. 2011, 112, 122–132. [Google Scholar] [CrossRef]
  98. Rasmussen, P.E.; Albrecht, S.L.; Smiley, R.W. Soil C and N Changes under Tillage and Cropping Systems in Semi-Arid Pacific Northwest Agriculture. Soil Tillage Res. 1998, 47, 197–205. [Google Scholar] [CrossRef]
  99. Guo, L.B.; Gifford, R.M. Soil Carbon Stocks and Land Use Change: A Meta Analysis. Glob. Change Biol. 2002, 8, 345–360. [Google Scholar] [CrossRef]
  100. Ghimire, R.; Machado, S.; Rhinhart, K. Long-Term Crop Residue and Nitrogen Management Effects on Soil Profile Carbon and Nitrogen in Wheat–Fallow Systems. Agron. J. 2015, 107, 2230–2240. [Google Scholar] [CrossRef]
  101. Akinremi, O.O.; McGinn, S.M.; McLean, H.D.J. Effects of Soil Temperature and Moisture on Soil Respiration in Barley and Fallow Plots. Can. J. Soil. Sci 1999, 79, 5–13. [Google Scholar] [CrossRef] [Green Version]
  102. Fernandez, R.; Quiroga, A.; Noellemeyer, E.; Funaro, D.; Montoya, J.; Hitzmann, B.; Peinemann, N. A Study of the Effect of the Interaction between Site-Specific Conditions, Residue Cover and Weed Control on Water Storage during Fallow. Agric. Water Manag. 2008, 95, 1028–1040. [Google Scholar] [CrossRef]
  103. Mitchell, J.P.; Shrestha, A.; Irmak, S. Trade-Offs between Winter Cover Crop Production and Soil Water Depletion in the San Joaquin Valley, California. J. Soil Water Conserv. 2015, 70, 430–440. [Google Scholar] [CrossRef] [Green Version]
  104. Mathieu, J.A.; Hatté, C.; Balesdent, J.; Parent, É. Deep Soil Carbon Dynamics are Driven More by Soil Type than by Climate: A Worldwide Meta-Analysis of Radiocarbon Profiles. Glob. Change Biol. 2015, 21, 4278–4292. [Google Scholar] [CrossRef]
  105. Torres-Sallan, G.; Creamer, R.E.; Lanigan, G.J.; Reidy, B.; Byrne, K.A. Effects of Soil Type and Depth on Carbon Distribution within Soil Macroaggregates from Temperate Grassland Systems. Geoderma 2018, 313, 52–56. [Google Scholar] [CrossRef] [Green Version]
  106. Follain, S.; Walter, C.; Legout, A.; Lemercier, B.; Dutin, G. Induced Effects of Hedgerow Networks on Soil Organic Carbon Storage within an Agricultural Landscape. Geoderma 2007, 142, 80–95. [Google Scholar] [CrossRef]
  107. California Air Resources Board. AB 32 Climate Change Scoping Plan. 2017. Available online: https://ww2.arb.ca.gov/sites/default/files/classic/cc/scopingplan/scoping_plan_2017.pdf (accessed on 5 September 2021).
  108. US Census Bureau (MCD): Cheryl Cornish, S.C. Characteristics of New Housing. 2011. Available online: https://www.census.gov/construction/chars/highlights.html (accessed on 12 August 2021).
  109. Goldstein, B.; Gounaridis, D.; Newell, J.P. The Carbon Footprint of Household Energy Use in the United States. Proc. Natl. Acad. Sci. USA 2020, 117, 19122–19130. [Google Scholar] [CrossRef] [PubMed]
  110. Asmus, P. Technologies and Policies to Consider for Reducing GHG Emissions in California; Economic and Technology Advancement Advisory Committee: Sacramento, CA, USA, 2008.
  111. Aertsens, J.; De Nocker, L.; Gobin, A. Valuing the Carbon Sequestration Potential for European Agriculture. Land Use Policy 2013, 31, 584–594. [Google Scholar] [CrossRef]
  112. Kravchenko, A.N.; Robertson, G.P. Whole-Profile Soil Carbon Stocks: The Danger of Assuming Too Much from Analyses of Too Little. Soil Sci. Soc. Am. J. 2011, 75, 235–240. [Google Scholar] [CrossRef]
Figure 1. Map of 21 sampling locations across Yolo County, California; designated by soil series, including Yolo silt loam (n = 6), Brentwood clay loam (n = 6), Capay silty clay (n = 6), and Corning loam (n = 3).
Sustainability 14 12901 g001
Figure 2. Sampling design for measuring soil properties across a 100 m transect within and 50 m away in adjacent cultivated fields. Hedgerow samples were collected as close to the base of the woody shrubs as possible. H = hedgerow, C = crop.
Sustainability 14 12901 g002
Figure 3. Mean soil organic carbon stocks by soil type (1 m depth) in hedgerows and adjacent cultivated fields (two−way ANOVA). One−way ANOVA refers to SOC stocks across sites by hedgerow and cultivated fields. Number at the top of each column indicates the sample mean; bars indicate standard error. Letters a and b indicate significant differences between soil types (n = 12, except Corning n = 6), while letters x and y indicate significant differences between hedgerows (n = 21) and cultivated fields (n = 21) with Tukey means comparisons at p < 0.05. Asterisks indicate significant differences between hedgerows and cultivated fields within soil types (*** = p < 0.001).
Sustainability 14 12901 g003
Figure 4. Proportion of whole-profile SOC stocks (0–100 cm) situated in each sampling depth by soil type. For a given sampling depth, asterisks represent significant differences between hedgerows and cultivated fields within a given soil type (* = p < 0.05), while letters show significant differences across soil types within a given system (lowercase letters (a or b) for hedgerows (H); uppercase letters (A or B) for cultivated fields (C)) at p < 0.05.
Sustainability 14 12901 g004
Figure 5. Principal Component Analysis biplots of soil physical properties and biological characteristics from soil pit descriptions in (a) surface (0–20 cm) and (b) subsurface (20–100 cm). Weighted averages of measured data collected at 0–10 cm and 10–20 cm depths were used for 0–20 cm values and from samples collected at 20–50 cm, 50–75 cm, and 75–100 cm for 20–100 cm values. Variable units are described in the Materials and Methods and in Table S2 in the Supplementary Materials.
Sustainability 14 12901 g005
Table 1. Site information for 21 hedgerows and adjacent cultivated fields in Yolo County, California. Compost, cover crop, and vegetative cover represent the typical management (in cultivated fields) for the past five years, while crop refers to the current crop in the rotation.
SiteSoil TypeSoil
Textural Class 1
Hedgerow Age (yrs)Compost (Tons
ha−1 yr−1)
CropCover CropVegetative Cover (Months)
1YoloSilt loam200wheatN6
2YoloSilt loam230tomatoN7.5
3YoloSilt loam110tomatoN5
4YoloSilt loam1024diverse 2Y10
5YoloSilt loam190tomatoN5
6YoloLoam104tomatoN5
7BrentwoodClay loam1312diverse Y10
8BrentwoodClay loam106tomatoY10
9BrentwoodClay loam106tomatoY10
10BrentwoodClay loam140tomatoN7.5
11BrentwoodClay loam164wheatN6
12BrentwoodClay loam230tomatoN7.5
13CapaySilty clay200tomatoN7.5
14CapaySilty clay200tomatoN7.5
15CapaySilty clay250ryeN9
16CapaySilty clay250ryeN9
17CapaySilty clay200wheatN7.5
18CapaySilty clay150wheatN7.5
19CorningLoam250poppiesN9
20CorningLoam100grapesN8
21CorningLoam110oat hayN10
1 in the surface horizon; 2 cultivating more than one species at the same time. Yolo = Mollic Xerofluvent, Brentwood = Typic Haploxerept, Capay = Typic Haploxerert. Corning = Typic Palexeralf.
Table 2. Soil organic carbon concentrations and stocks by soil type in hedgerows and cultivated fields at 5 distinct depths from 0 to 100 cm for 21 sites in Yolo County, CA, USA.
Soil Organic Carbon (g kg−1)Soil Carbon Stocks (kg m−2)
HedgerowCultivatedHedgerowCultivated
Soil Type0–10 cm
Yolo2.62(0.27)1.36(0.14)***a3.27(0.22)1.74(0.17)***a
Brentwood2.52(0.16)1.30(0.08)***a3.26(0.17)1.57(0.08)***a
Capay2.51(0.16)1.03(0.09)***a3.63(0.21)1.47(0.15)***a
Corning2.47(0.30)1.01(0.12)***a3.01(0.35)1.48(0.20)***a
10–20 cm
Yolo1.42(0.16)1.15(0.13)nsa2.05(0.19)1.66(0.19)*a
Brentwood1.29(0.08)1.20(0.10)nsa1.80(0.11)1.66(0.13)nsa
Capay1.29(0.1)0.90(0.07)***a2.18(0.16)1.45(0.11)***a
Corning1.01(0.13)0.70(0.06)*a1.53(0.23)1.03(0.08)*a
20–50 cm
Yolo0.82(0.08)0.77(0.05)nsa3.53(0.27)3.53(0.29)nsa
Brentwood0.99(0.07)0.90(0.06)nsa4.48(0.29)4.17(0.27)nsa
Capay1.03(0.07)0.75(0.07)***a5.32(0.38)3.94(0.37)***a
Corning0.43(0.02)0.33(0.02)***b2.17(0.14)1.58(0.13)***b
50–75 cm
Yolo0.64(0.03)0.54(0.03)*a2.34(0.12)2.01(0.12)*a
Brentwood0.88(0.05)0.72(0.05)***a3.25(0.17)2.53(0.17)***a
Capay0.77(0.07)0.60(0.05)***a3.44(0.31)2.68(0.25)***a
Corning0.24(0.03)0.14(0.02)***b1.01(0.13)0.56(0.08)***b
75–100 cm
Yolo0.60(0.04)0.47(0.03)***a2.09(0.15)1.75(0.14)*a
Brentwood0.76(0.04)0.63(0.04)***a2.68(0.16)2.25(0.17)***a
Capay0.67(0.05)0.49(0.04)***a2.93(0.23)2.19(0.17)*a
Corning0.21(0.06)0.08(0.01)***b0.89(0.27)0.29(0.02)***b
Within a column, for each depth, values for soil type followed by the same letter are not significantly different at p < 0.05. Asterisks indicate significant difference between hedgerows and cultivated fields (* = p < 0.05, ** = p < 0.01, *** = p < 0.001). Numbers in parentheses indicate standard error (n = 21), except 75–100 cm (n = 18).
Table 3. Estimated state-wide potential of soils in established hedgerows along farm edges to contribute towards California’s annual GHG reduction goals. Estimates based on total number of farms in the state, the perimeter of an average farm size, and 5-m wide hedgerow plantings.
Adoption RateSoil Organic Carbon (Tg)CO2 Equivalents (MMT)(%) of GHG Goals
50%2.9610.87
80%4.7317.312
Publisher’s Note: MDPI stays neutral with regard to jurisdictional claims in published maps and institutional affiliations.

