1. Introduction
With the rapid increase in the human population throughout the globe on one hand (68% of the world population will be in cities by 2050) [
1], and their concentration in large cities and urban settlements on the other hand, which consumes 60% [
1] of world energy, the need for energy and resources to build and operate these settlements will grow exponentially. While the negative impact of human activity to date due to large emissions of greenhouse gases and wastes has resulted in grave environmental consequences from climate change, extinction of species, and life-sustaining habitats.
Fortunately, remedies for these challenges exist in the form of renewable sources of energy and the technology to harness them from one side, and a range of possible infrastructures to accommodate the ever-increasing numbers of the population on the other. The most ubiquitous source of renewable energy is solar energy, which has great potential and is readily available within the built environment. Bioclimatic tall buildings [
2,
3] present viable solutions to accommodate the ever-increasing urban population.
In the pursuit to achieve a more sustainable built environment, careful integrations need to be studied between renewable energy technologies and tall building technologies [
4] to arrive at favorable conditions for both.Building-integrated photovoltaics/thermal (BIPV/T) have versatile benefits and integration prospects into tall buildings [
5]. They come as an improvement to BIPV by removing excess heat from photovoltaic panels [
6]. This process of heat removal comes in the form of working fluid such as air [
7,
8], water [
9], or any refrigerant such as phase-changing materials [
10,
11].
Table 1 below gives a brief description of the advantages and disadvantages of some notable BIPV/T system designs in facades and roofs.
2. Previous Related Work
This paper continues the investigation of a ducted photovoltaic façade unit cooling by air in its previous parts; part I [
12] cooling with buoyancy in a practical experiment. The target was optimization to ‘duct depth’ (i.e., mentioned as width in [
12] due to 2-dimensional illustrations) behind the photovoltaic panel, thus providing maximum buoyancy-driven cooling for the photovoltaic panel whilst operating. Duct depths ranging between 5 and 50 cm were examined, forming a typical facade unit. The maximum calculated heat removed from the duct was reported for a duct 45 cm deep, while a duct 50 cm deep had the lowest cell-operating temperature (i.e., the largest duct depth tested). The temperature difference between inlets and outlets ΔT, ranged from 5.47 °C to 12.32 °C for duct depths of 5–50 cm, respectively. The module’s efficiency was enhanced by 12.69% as a result of lowering the photovoltaic mean temperature by 27 °C to 73 °C. (i.e., the initial status of the experiment operation was 100 °C). In total, 529 W is the maximum obtained recovered heat from the ducted photovoltaic facade unit. That constitutes 48.98% of the incident radiation in the experiment. The combined heat and power (i.e., heat recovered and power enhanced) by the ducted photovoltaic façade unit is 61.67%. Specifications of photovoltaic panels are listed in
Table 2.
Part II [
15], a computational fluid dynamic CFD simulation of cooling by buoyancy for the experiment presented in [
15], was undertaken by the first author. Optimization of duct depth was pursued (i.e., mentioned as width in [
12] due to 2-dimensional illustrations in that publication) that allowed for maximum cooling due to buoyancy for the photovoltaic panel. Duct depths ranging between 5 and 50 cm are simulated. The maximum heat removed was reported for a duct depth of 40 cm; however, a duct width of 50 cm had the lowest cell operating temperature. The temperature deference ΔT between the ducts’ inlets and outlets was reported at 5.47–12.32 °C for duct widths of 5 to 50 cm, respectively. Airflow circulation inside the duct is revealed and determined by reference to Grashof, Nusselt, and Prantel numbers as well as CFD simulations. These studies explain that the flow inside the ducts is fully developed - turbulent with gradual transmission of heat within the ducts. With low duct depth, the flow increases in velocity but still has a low mass flow rate due to the small cross-section of ducts. However, with larger ducts, the flow reduces in velocity but there is an increase in mass flow rate due to the increase in cross-sectional area.
A further enhancement to this experiment is possible with the addition of forced convection heat extraction as presented in this paper.
The design of this unit is conducive to both energy generations from the PV panels and the usually vertical facades in buildings. Furthermore, the addition of cooling to the PV panel can enhance both the generation of energy and the building’s need for heating and/or ventilation. In addition, PV panels would be integrated within well-established curtain wall systems that follow standardized tests for climatic controls.
The novelty of the work lies with the genuine integration of PV modules within curtain wall systems of tall buildings that ensures enhanced efficiency, thermal performance, and safety to PV and façade unit alike. Where a single floor height can accommodate three of these units stacked on top of each other. And with the economy of scale, every saving in power generated and heat extracted from a single unit can be multiplied by the height of buildings (i.e., over hundreds of times in hundreds of stories in a single tall building).
3. Literature Review
When referring to previous research in the last five years or so that is specifically devoted to forced convection cooling in building integrated photovoltaics, very few results have emerged. Obviously, this excludes any buoyancy or natural convection cases. This reveals the scarcity of this application.
Madadnia, J. et al. [
16] studied a BIPV façade with double and triple-glazing skin. Further, the influence of natural convection, forced convection, and heat radiation of the skin’s layers on PV conversion efficiencies and operating temperatures were studied. Some recommendations to the layers of the building skin were issued. However, their study is part of an adaptable façade of an actual building.
Mirzaei, P.A., Carmeliet, J. [
17] They studied slopped BIPV modules with cavities and a range of irradiance and velocities under combined natural-forced convection in a wind tunnel. The study employed a range of technologies to report the data, such as infrared cameras, thermocouples, and thermopiles. The study concluded that higher cooling for PV modules occurs with a stepped arrangement. Higher cavities have greater effects with higher air velocities and, therefore, better cooling.
Both studies touched upon the subject of forced convection in photovoltaic modules, but the whole extent of its suitability as compared to natural convection is not presented. In fact, both studies have no differentiation between natural and forced convection scenarios. In the present work, the research clearly identifies both scenarios (as we have whole separate papers investigating each of them), thus providing the possibility for the building to operate on either of them as the situation requires. In addition, the prototype presented in this paper provides a whole set of suitability and adaptability to typical vertical façade curtain wall systems prevalent in the tallest buildings throughout the world’s cities.
If we expand the literature outside of a five-year span (i.e., from 2010 to 2021), we find some notable research into forced convection of ducted PV, as we can see below.
Maghrabie et al. [
18] studied forced convection cooling for a PV panel in Egypt’s weather from April to July. The process has improved the PV electrical power yield to PV panels by 3.3%, 4.3%, 4.5%, and 6.1% for the above-tested months. The maximum average thermal efficiency for July is 37% and the maximum overall average thermal efficiency in April is 48.7%.
Gökhan [
19] experimented with a ducted PV panel with fins (between 54 and 108 fins) at the back of the PV panel under forced convection velocities of (3.3, 3.9, and 4.5 m/s). The maximum forced convection velocity-maintained PV efficiency close to maximum efficiency when it was about half of full efficiency without cooling.
Zogou and Stapountzis [
20] investigated building integrated photovoltaic with a ventilated duct in both natural and forced convection under the natural climatic conditions in Greece. It is a system similar to what is present in our study, however, the approach and outcomes are totally different. We can quantify and compare the effects of natural and forced convection more clearly in our study. More insight into the different roles of the duct under natural and forced convection is evident in our research.
Fterich, M. et al. [
21] used forced convection cooling for a PV panel added to a tomato drying unit. Where the heat removed from the panel is introduced into a drying chamber. The system achieved better drying results compared to conventional drying processes. They reported an improvement in PV output with an increase in mass flow rate that produced more cooling for the PV panel.
4. Methodology
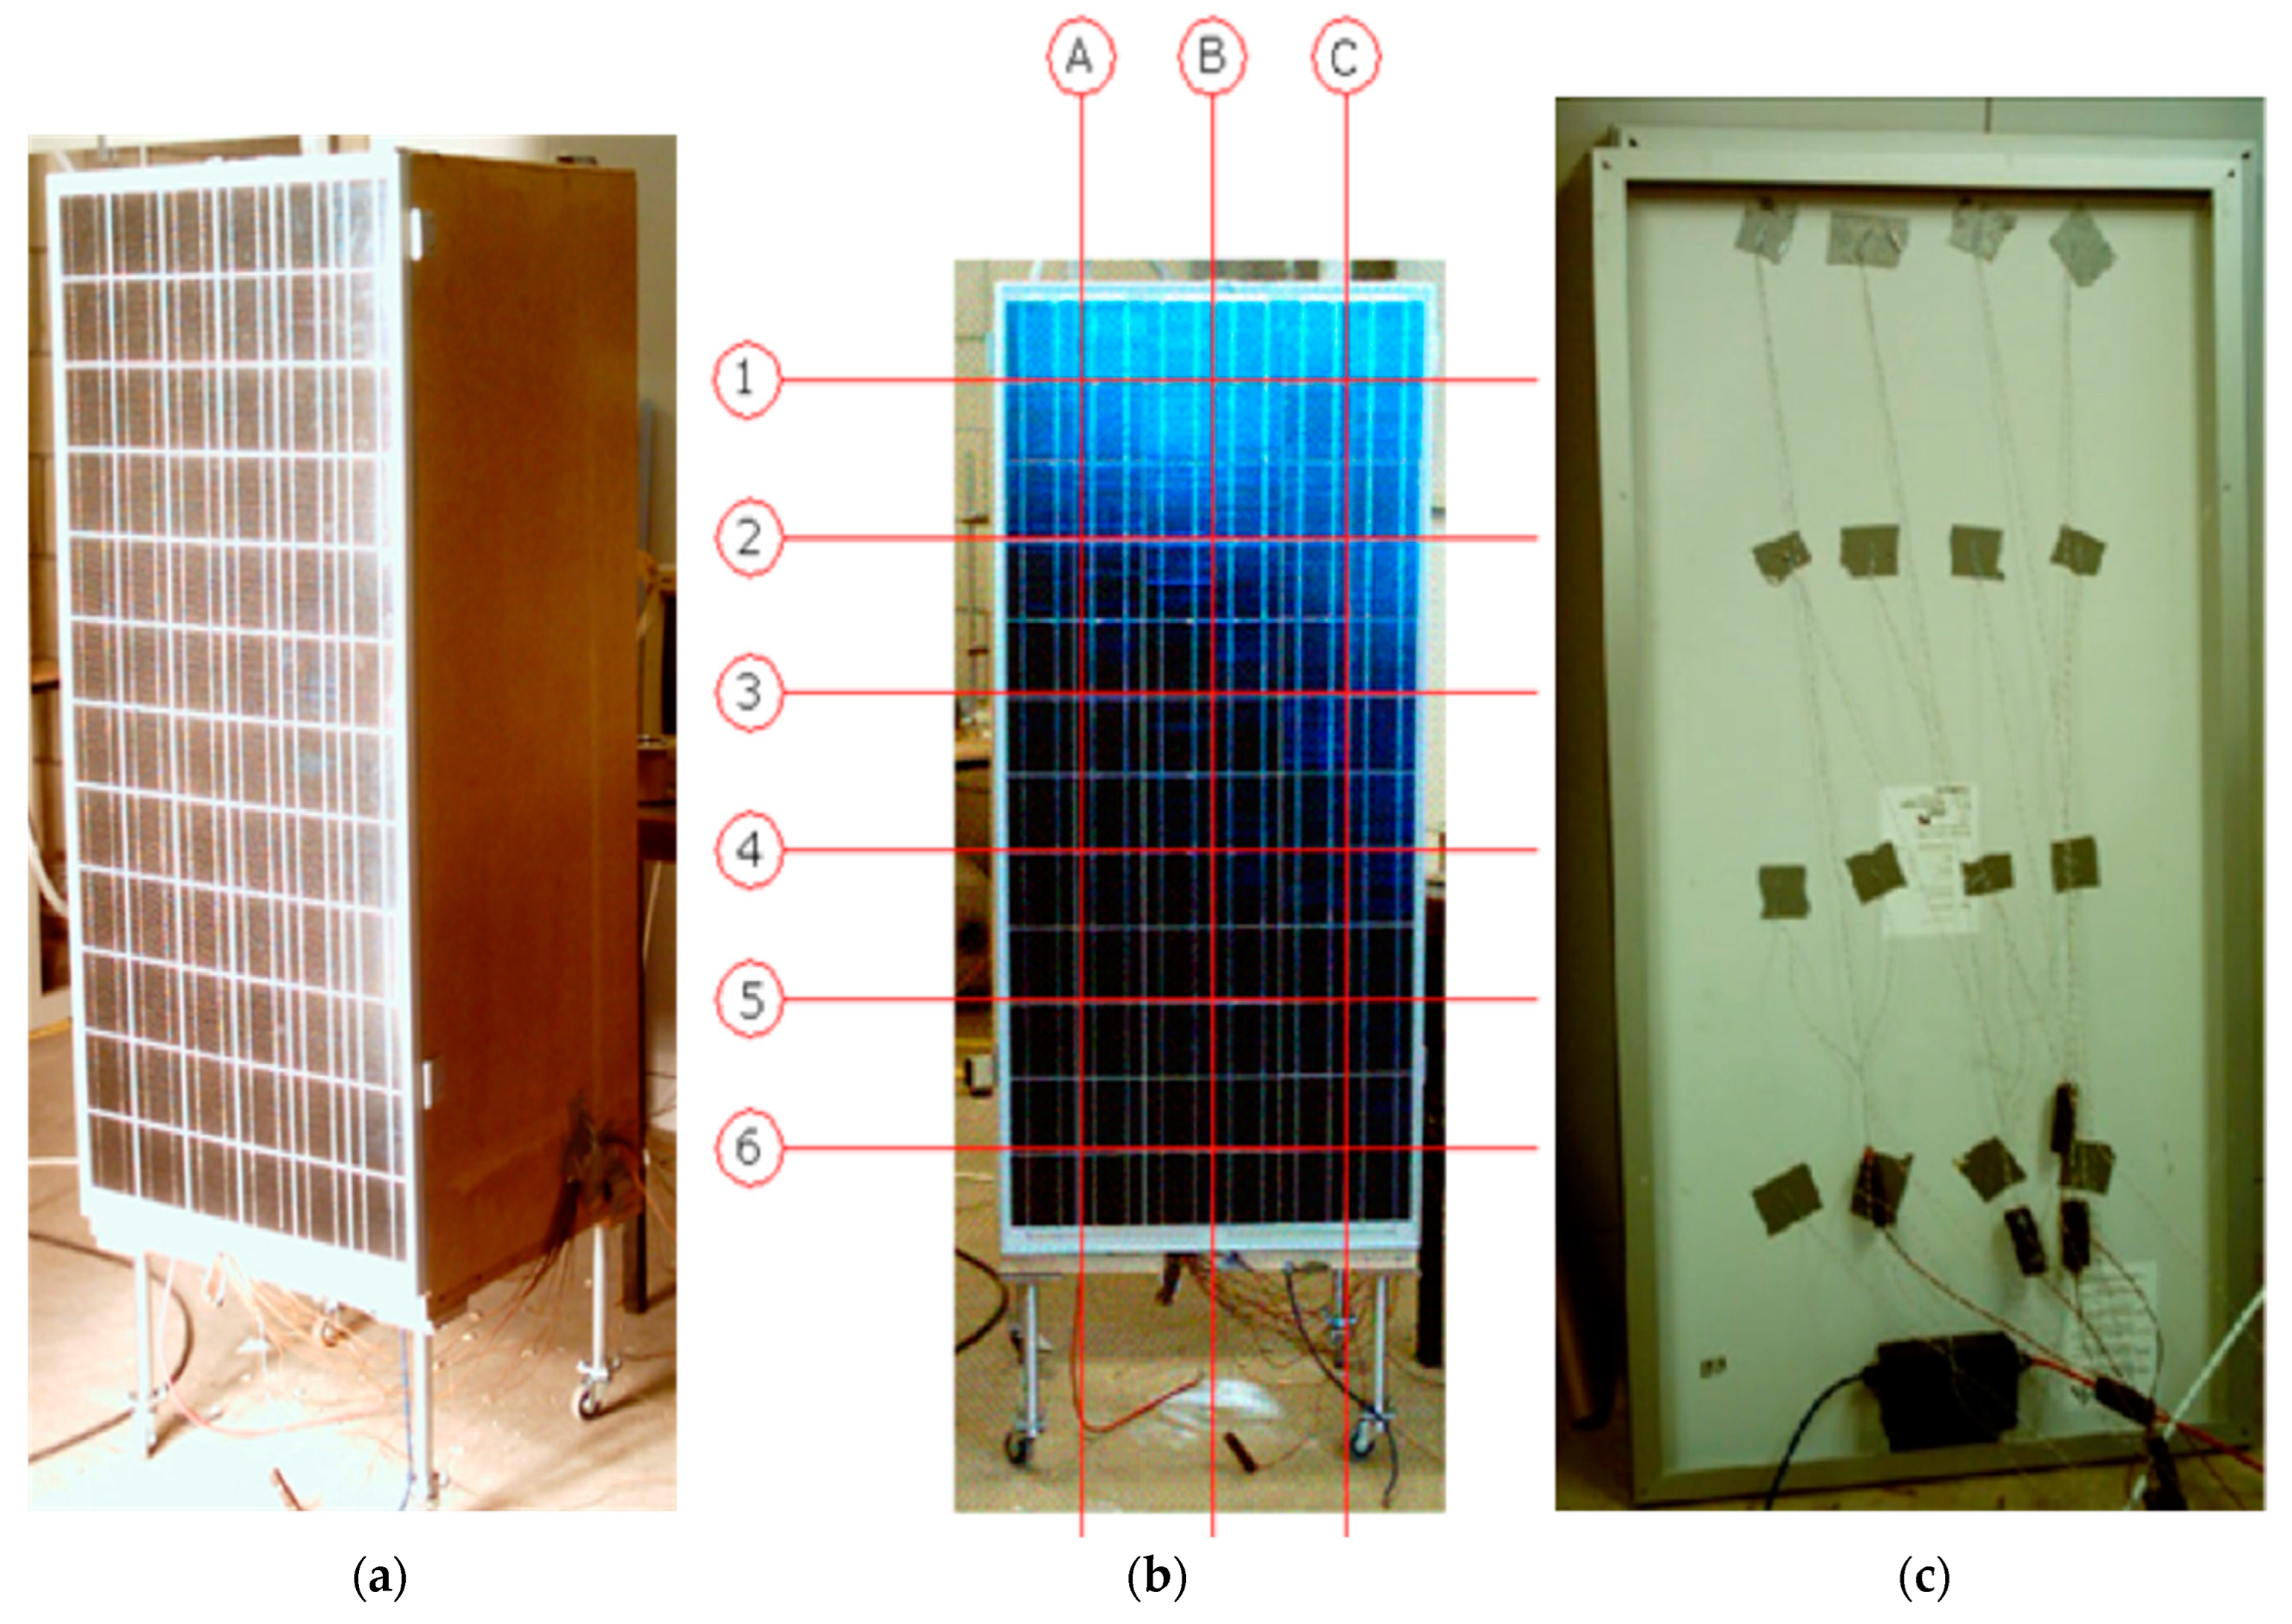
A forced convection scenario for the ducted PV unit examined and presented in [
12] can be investigated by introducing a fan into the duct
Figure 1,
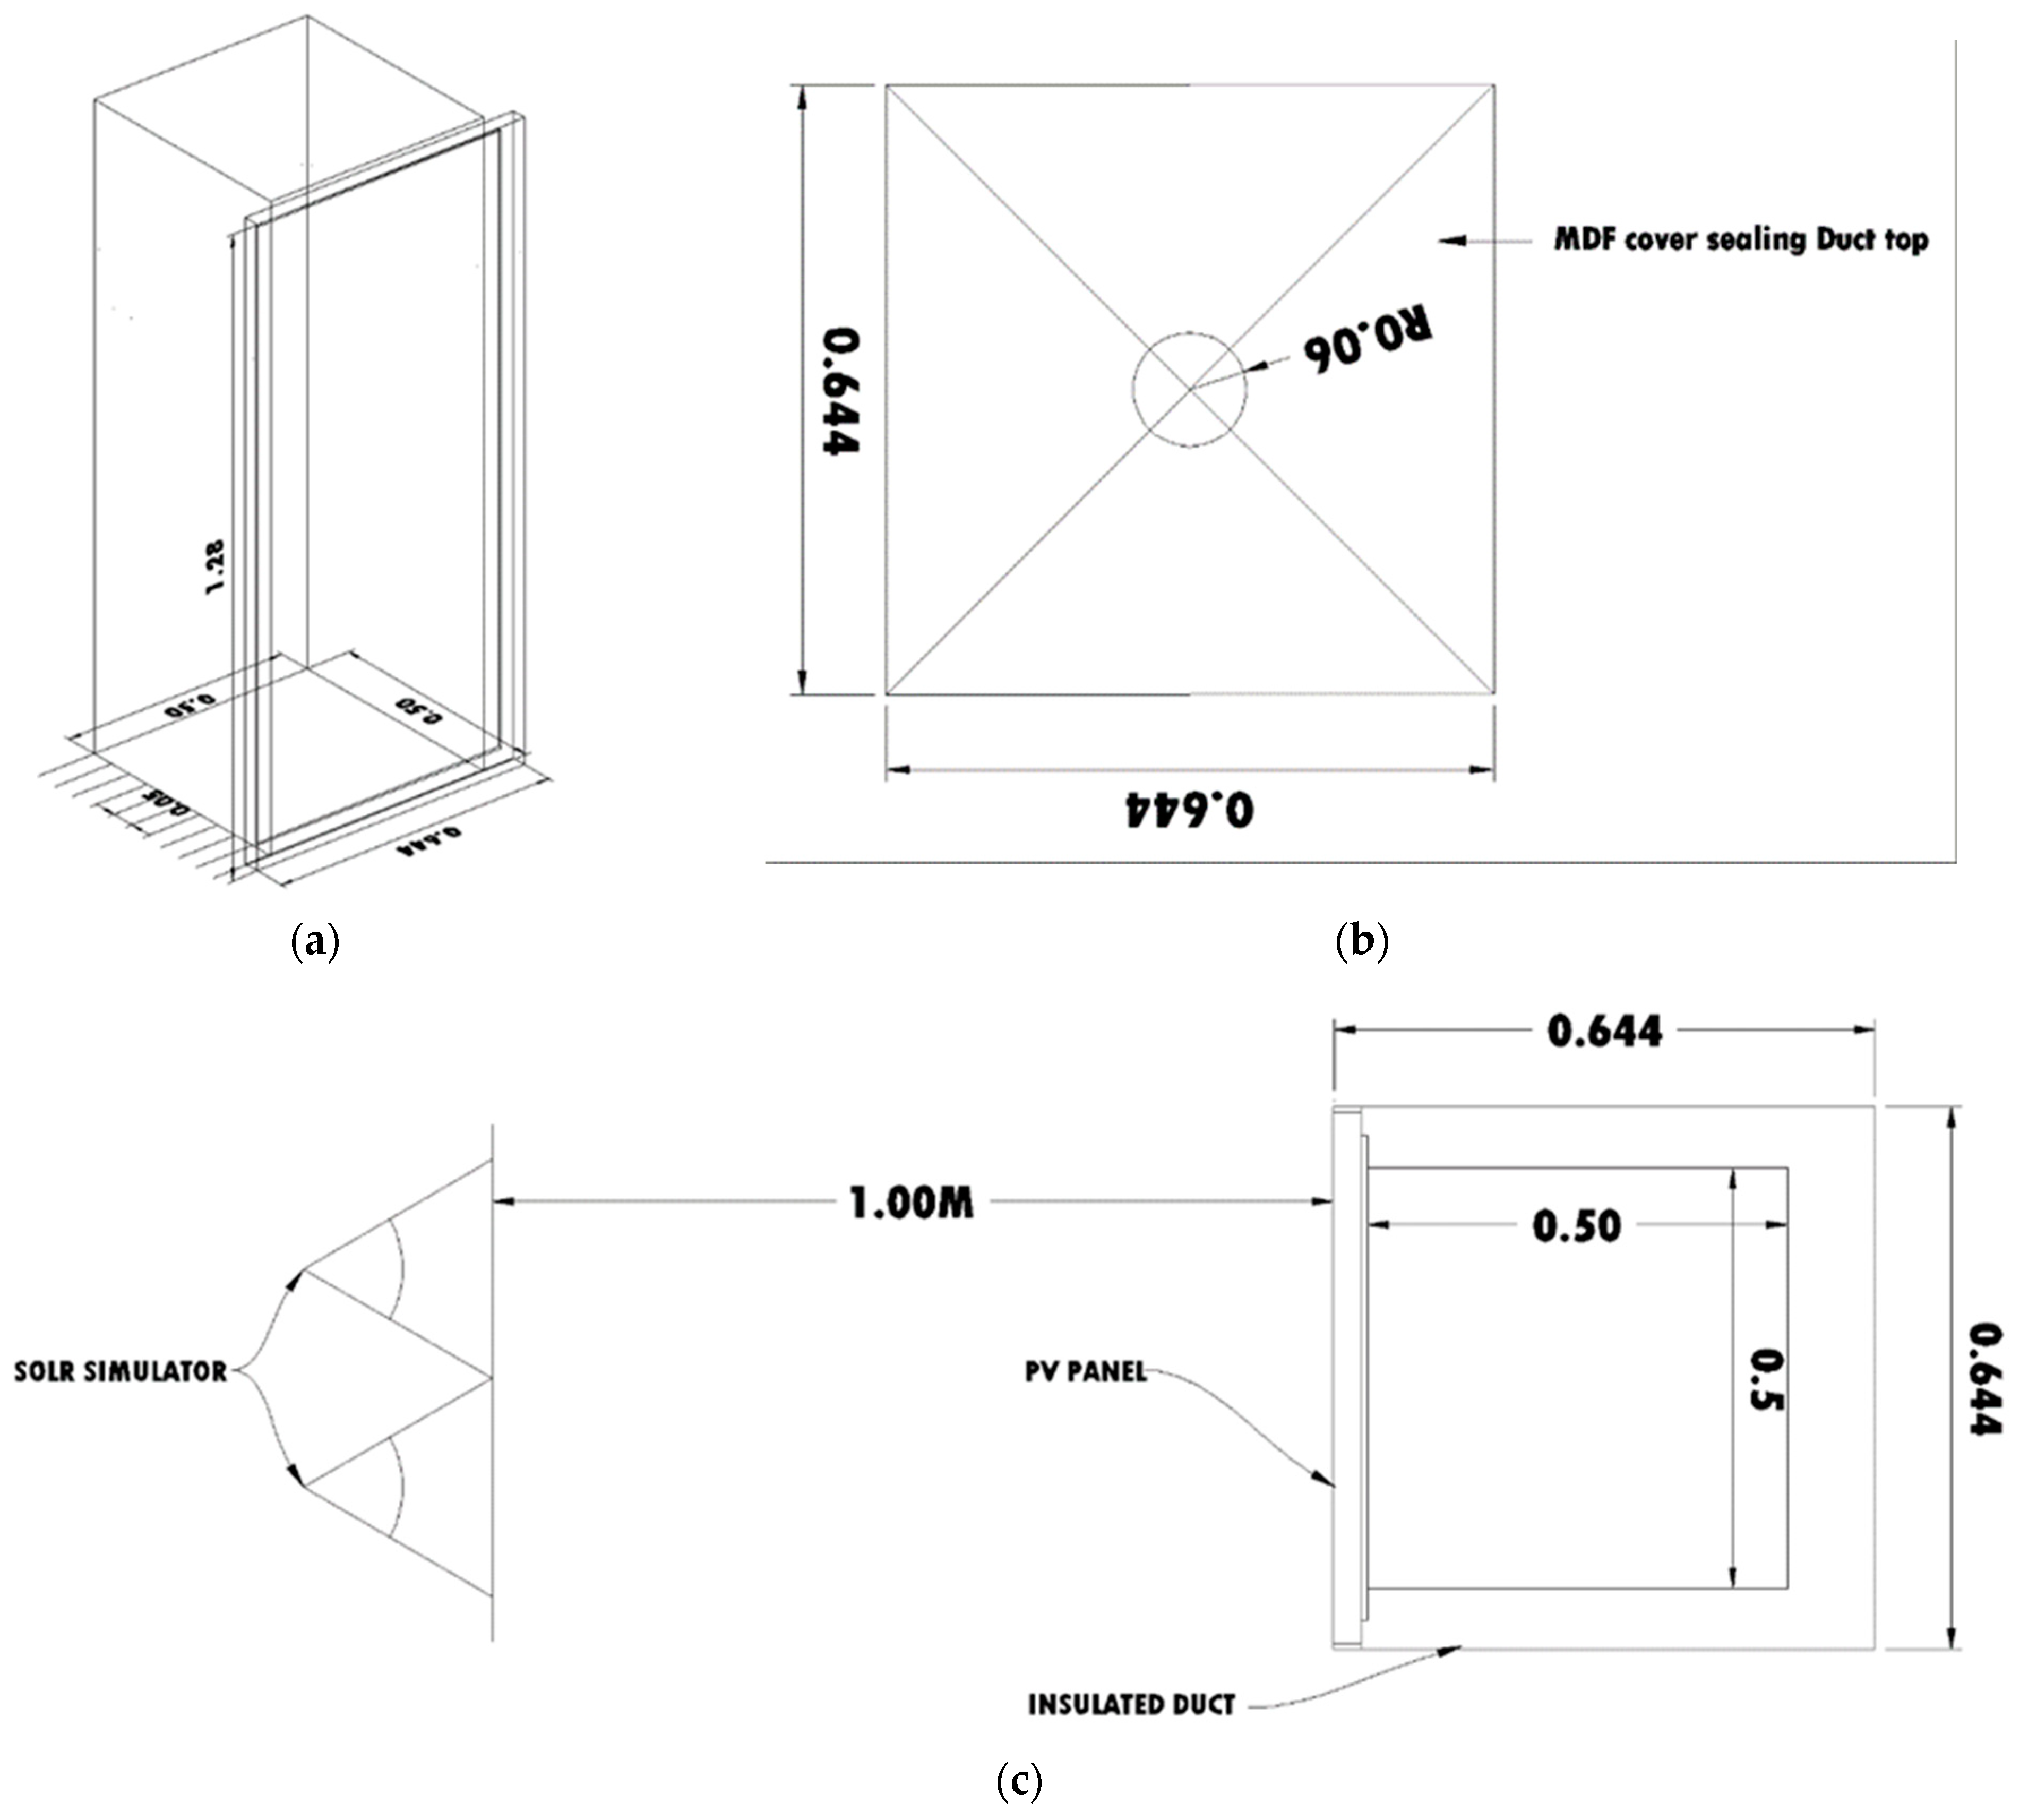
Figure 2 and
Figure 3. This would presumably accelerate air mass flow rate passing behind photovoltaic panel and, therefore increase the cooling potential for the PV panel.
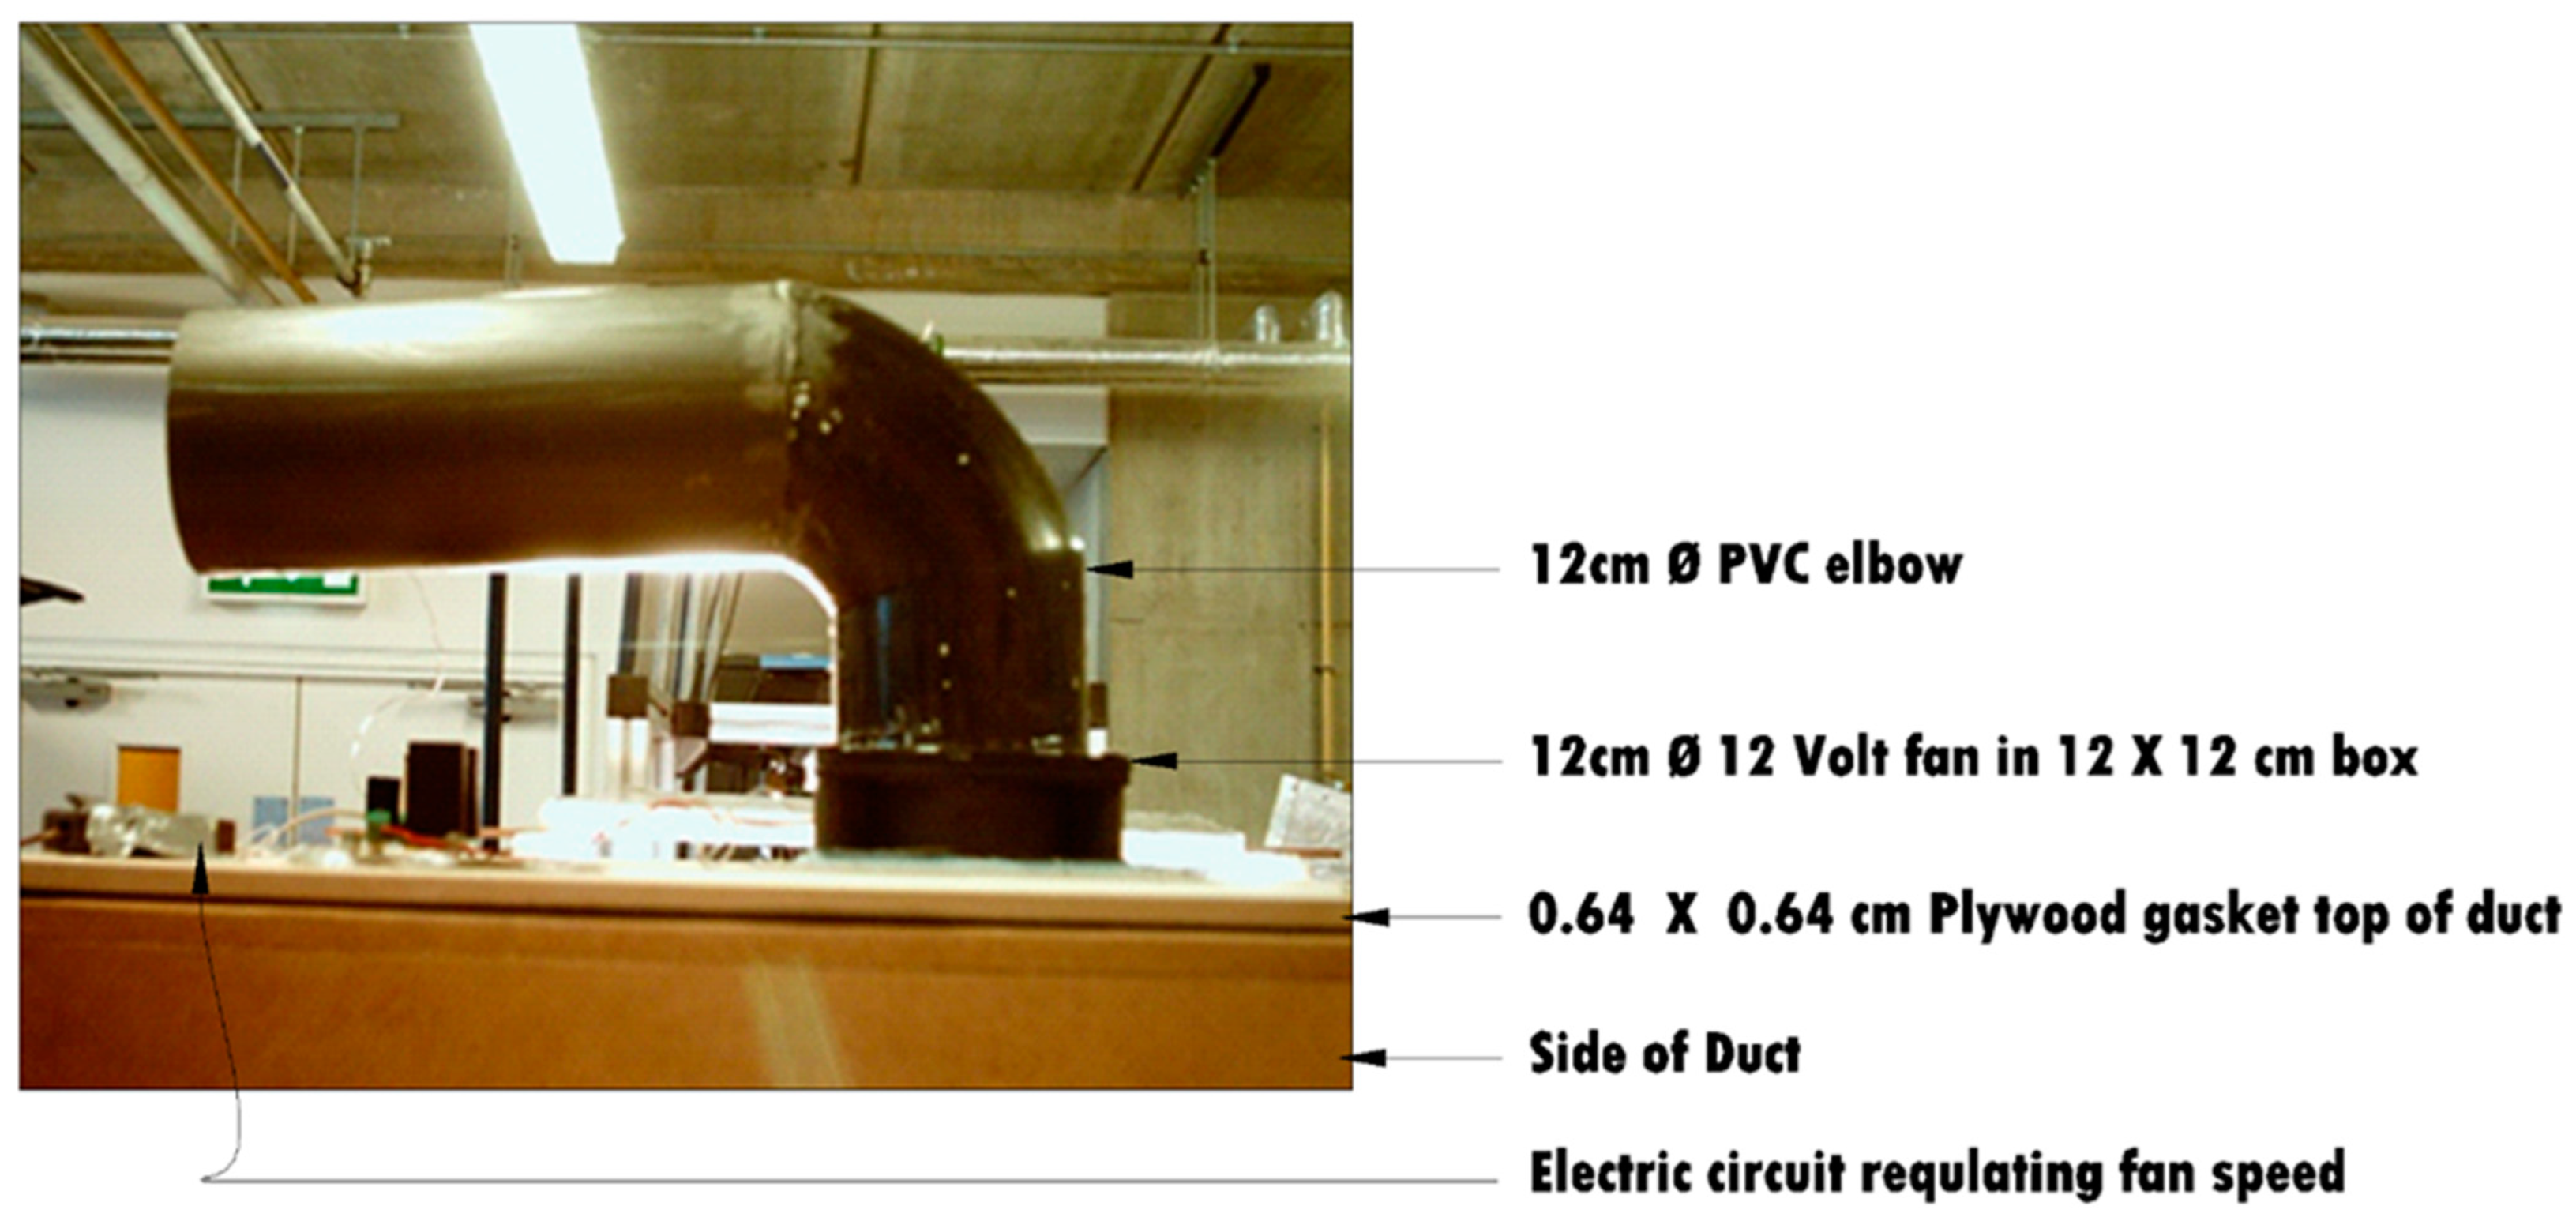
A small fan of 12 cm diameter, 12 V powered was fixed at the top of the duct by means of gasket bolted into a plywood cover with the dimensions of the duct sealing its top,
Figure 2 and
Figure 3b. This arrangement is made so that the effect of air drawn up by the fan would cover all the volume of the duct through the fan and out through an elbow tube. The fan is powered by a fraction of the PV power output. A bigger fan (to fit the duct size 50 × 50 cm) needs a [
1,
2,
3] phase electric power supply, which is way above what the PV panel could generate, and obviously would neither be economical nor practical if we want to be independent of main’s grid. It is worth mentioning here that two other duct outlet treatments involved a cone shape housing the fan at the top. However, the cooling result was insignificant, neither did the effect of varying fan speed. So only the configuration described in
Figure 1,
Figure 2 and
Figure 3 was successful.
Considering duct dimensions and the ensued aspect ratios, [
23] pointed out that the influence of aspect ratio is little on photovoltaic modules operating temperatures when it is under forced convection. Therefore, a fixed aspect ratio was chosen to investigate a range of forced convection velocities’ effect on PV operating temperatures. Thus, largest duct width of 50 cm with aspect ratio of 0.4 is selected. This would have the largest volume of all the ducts studied previously in parts I and II, and therefore has the maximum mass flow rate and expected cooling potential [
24].
4.1. System Description
The ducted PV façade unit formed with a photovoltaic model manufactured by SCHOTT under code-name ASE-100-GT-FT and dimensions 0.644 × 1.282 m delineating main face of the duct, see
Figure 1a. A medium-density fiberboard (MDF) backing formed the other three sides of the duct. A 5-cm-thick polyethylene insulation is added to the inside of MDF. It had bottom and top equal size openings. In order to eliminate flow resistance at the inlet, the duct raised 50 cm from ground,
Figure 1b. The top opening sealed with plywood board that has a 10 cm diameter opening in the middle accommodating a fan,
Figure 2 and
Figure 3. The fan is equipped with a special electrical circuit enabling gradual acceleration of its speed. Moreover, enabling it to maintain speed at previously set points (i.e., at 1 m/s intervals). The fan fixed on 12 × 12 cm box that connects to a 90-degree elbow 12 cm diameter,
Figure 2. Radiation from solar simulator (8-Hologen Flood Lamps 500 W each) is measured at fixed 18 points on a grid along the face of PV panel using a pyranometer model ISM400 from RS, UK. Accuracy of readings ±5%. Average of radiation readings is 1080 W/m
2.
Type (T) thermocouples on 16 locations at the back surface of the module at center of cells to measure cell’s temperature. All sensors connected to data logger (i.e., DATATAKER 50) have accuracy above 0.15% of full scale. A hot-wire anemometer by TESTO-425 with fixed flow velocity probe is used to measure velocity at outlet position with accuracy ± 0.03 m/s, 5%. (all accuracy figures are manufactures’ provided and calibrated figures). The duct under investigation here is the 50 cm depth behind the PV module (i.e., the largest duct depth investigated in the buoyancy scenario Part I). This depth is referred to in the previous research [
12,
15] and as ‘duct’s width’, as it appeared in a 2D, two-dimensional sections across the PV and the duct. Overall estimated accuracy of equipment is ±3.75%.
4.2. Governing Equations
Heat extracted from the PV panel given by the following:
where
(kW) = heat from PV,
= mass flow rate [
11],
= specific heat (J/kg°C),
= outlet temperature (°C).
= Inlet temperature (°C).
Thermal efficiency of the collector given by the following:
where
= heat from PV (W),
= heat removal efficiency (%),
A, panel area [
25],
G = radiation falling on panel (W/m
2).
4.3. Running the Test
The test is conducted by switching on the light simulator for a period of 1–2 h until an appreciable build-up of heat is reached in the duct. (i.e., temperature of PV ≈ 100 °C, outlet temperature about 46 °C). The fan then operated at a cascade of speeds increasing by 1 m/s each at a time. The Mean PV temperature reported for a period of two hours of operation. The resulting cooling effect presented in
Table 3 below.
5. Results and Discussion
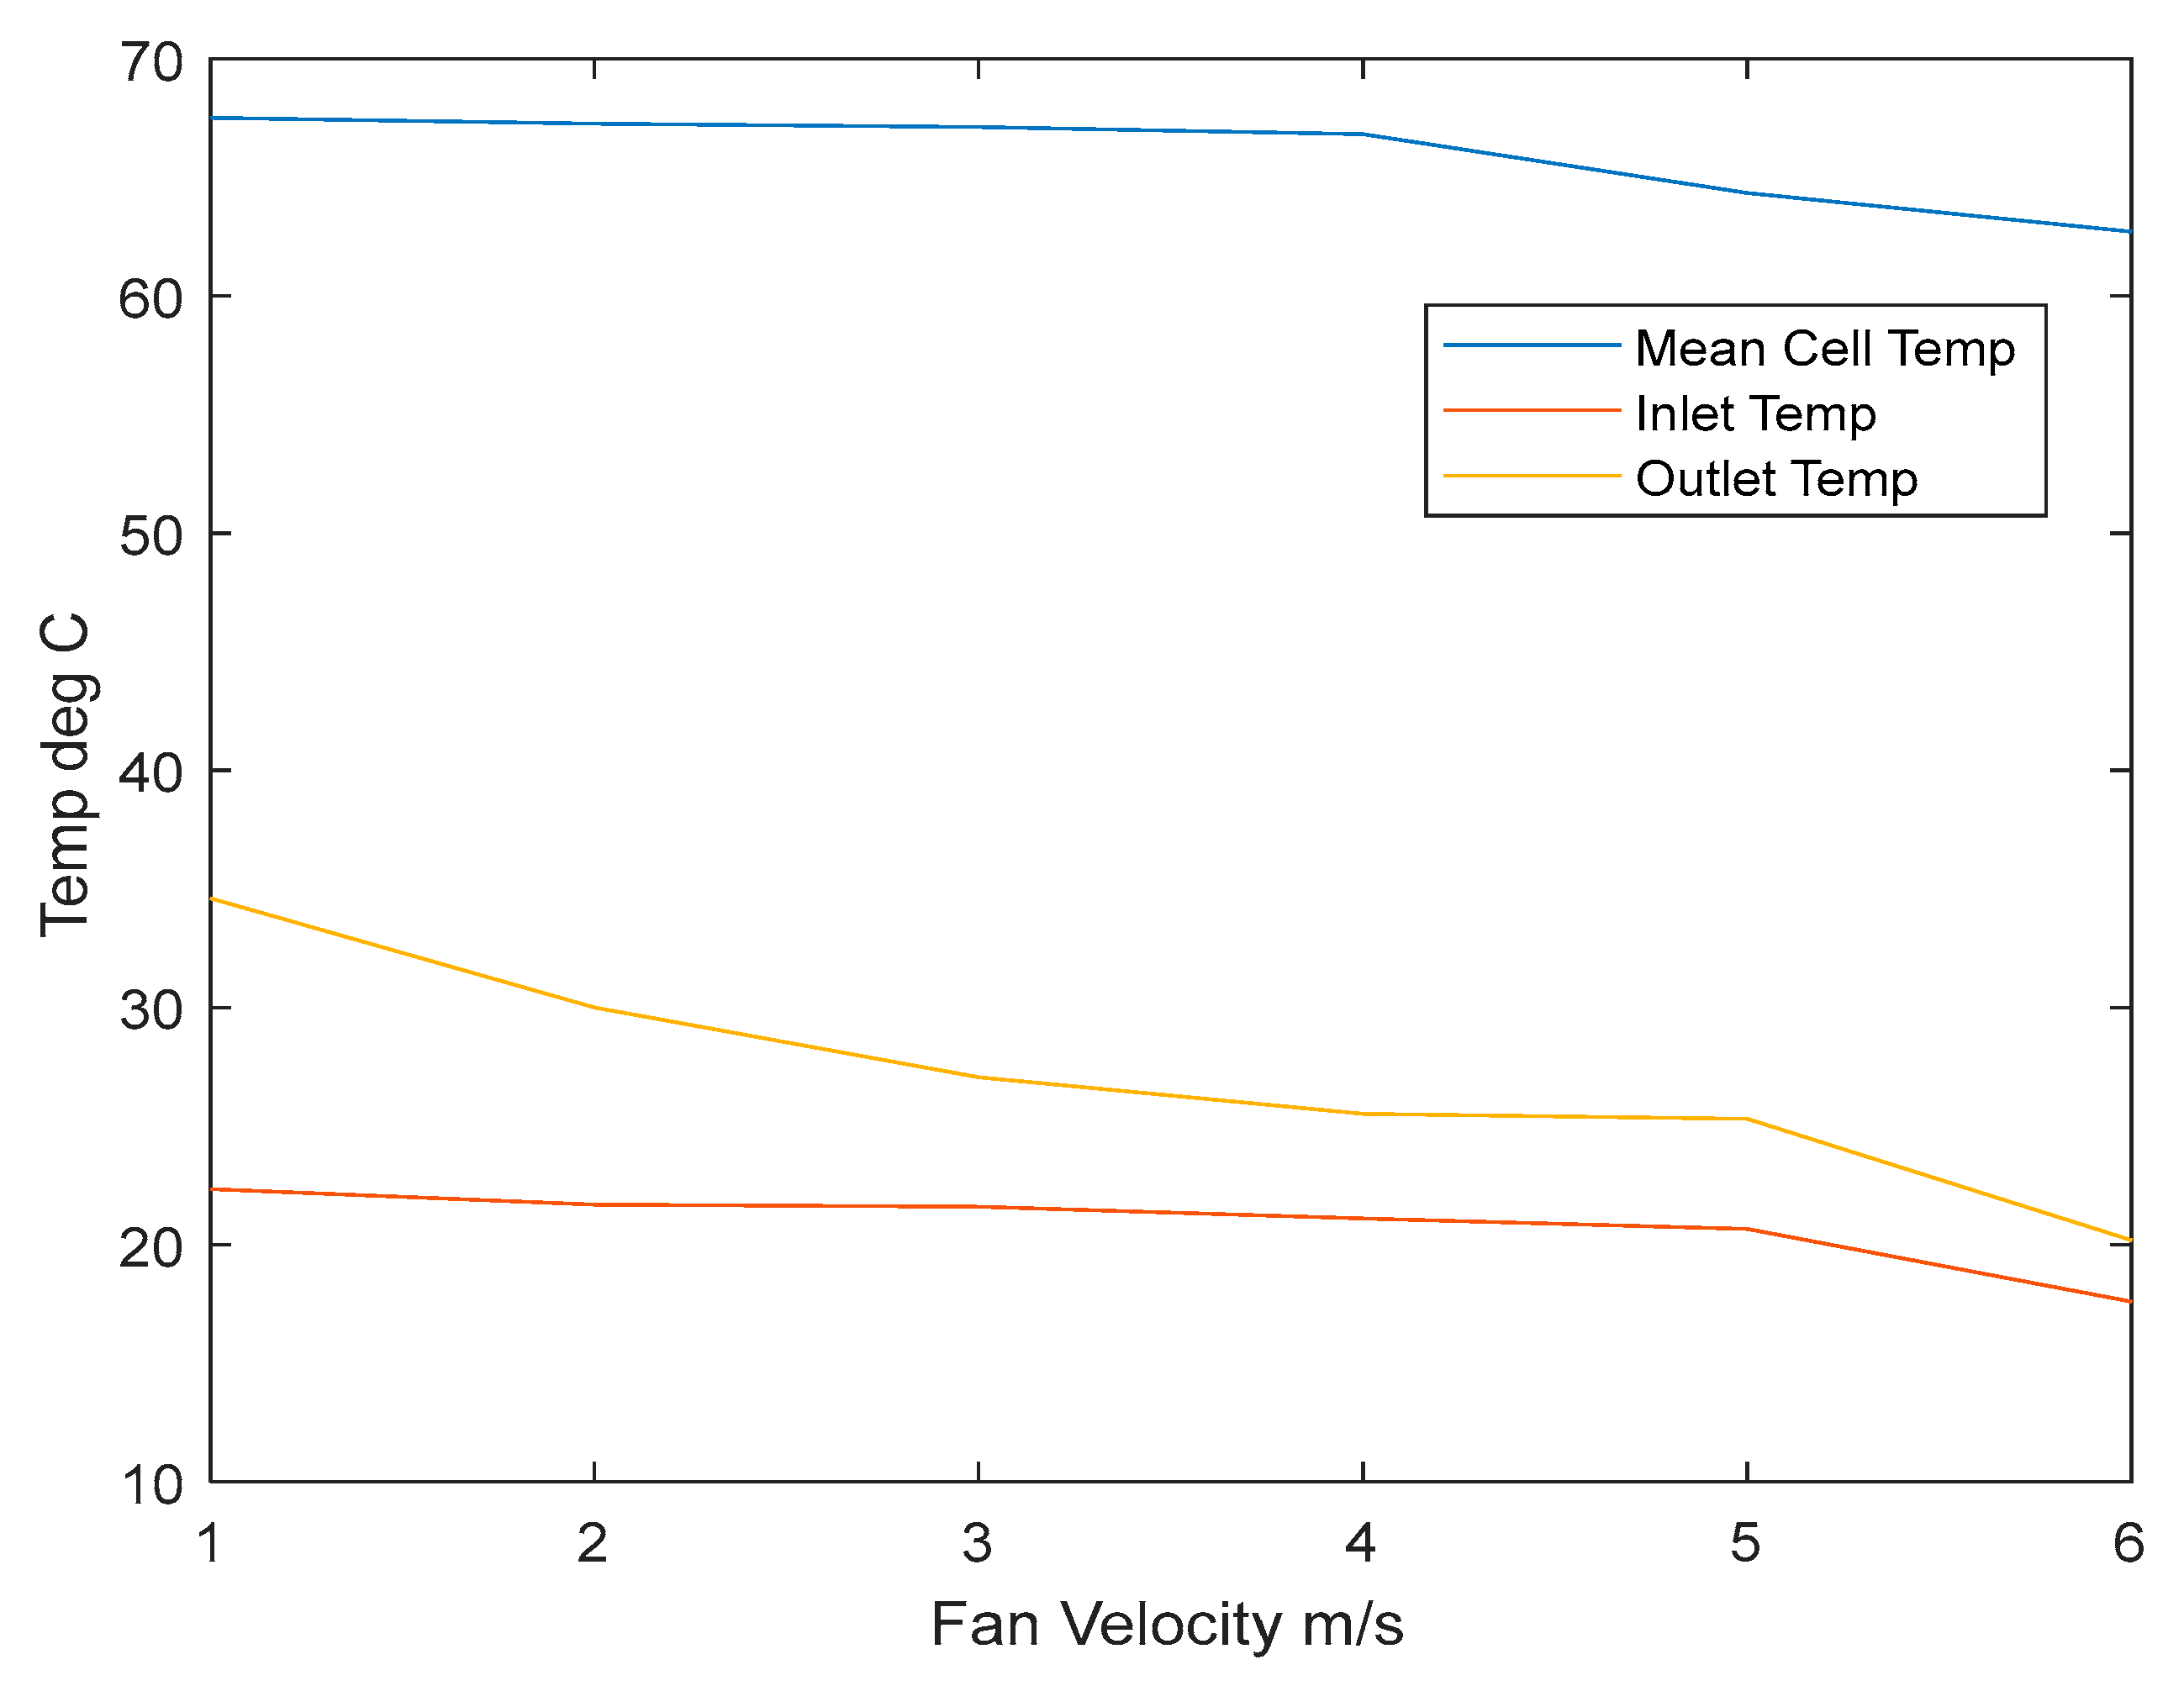
Table 3 above and
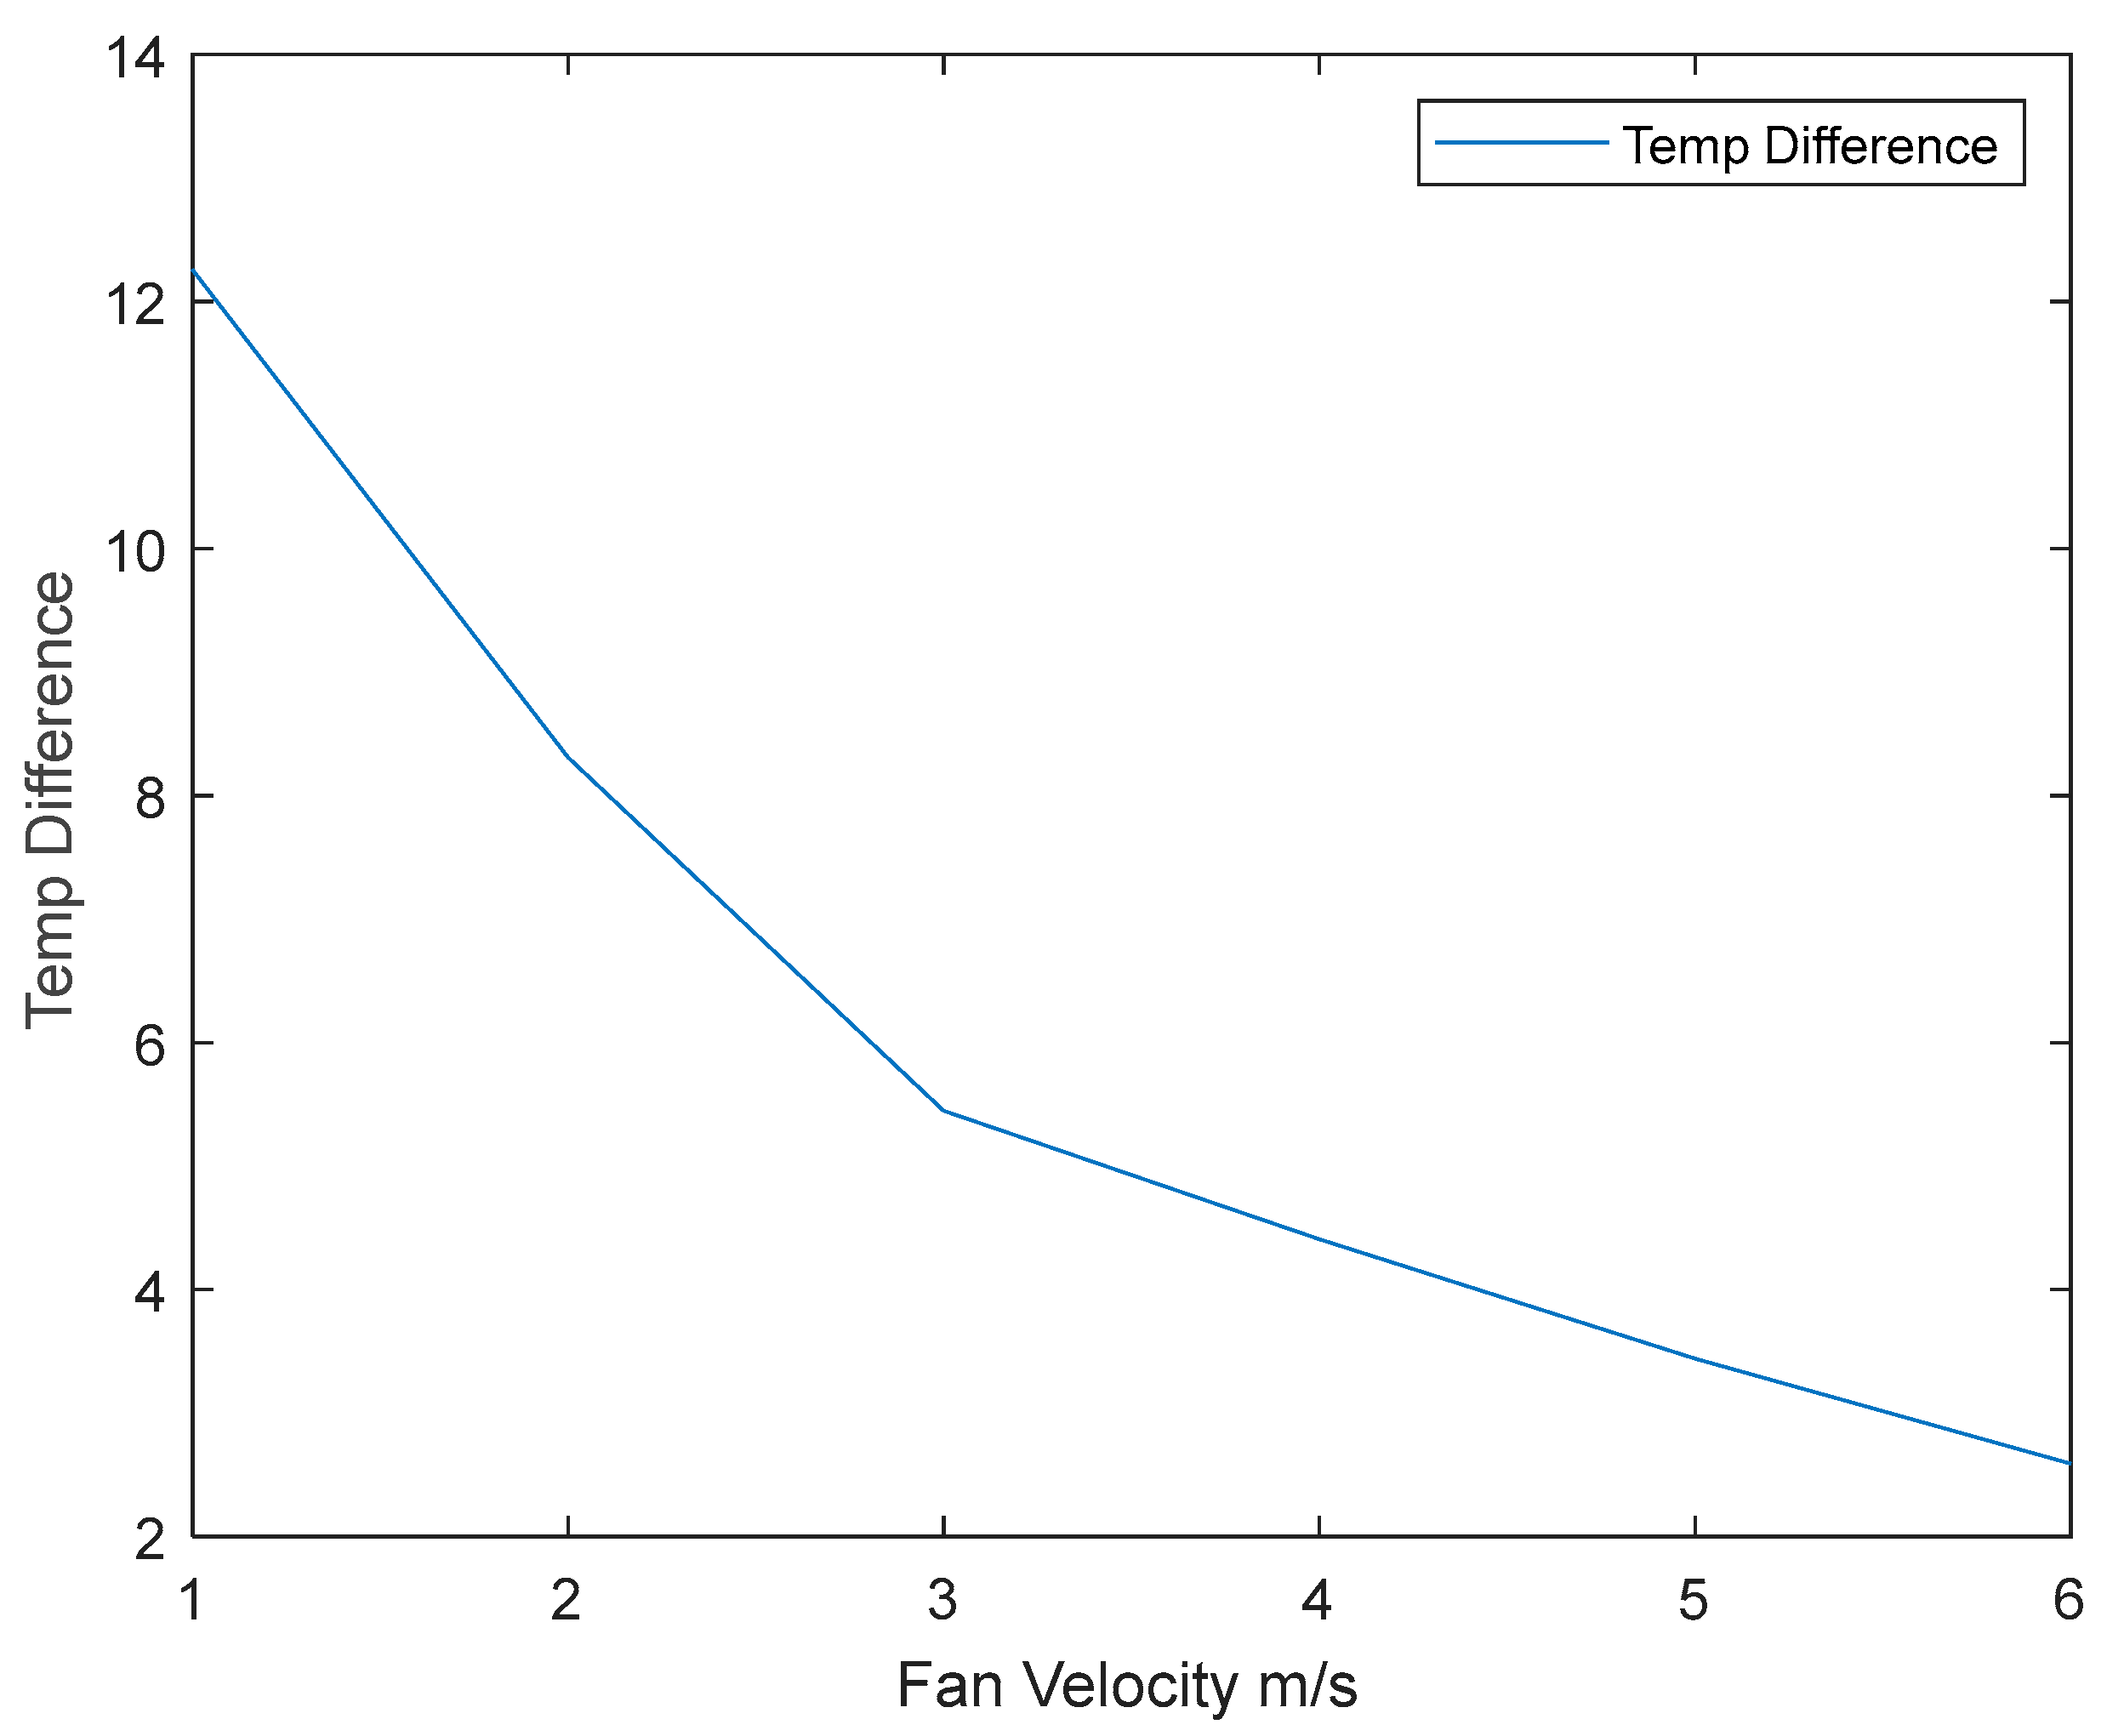
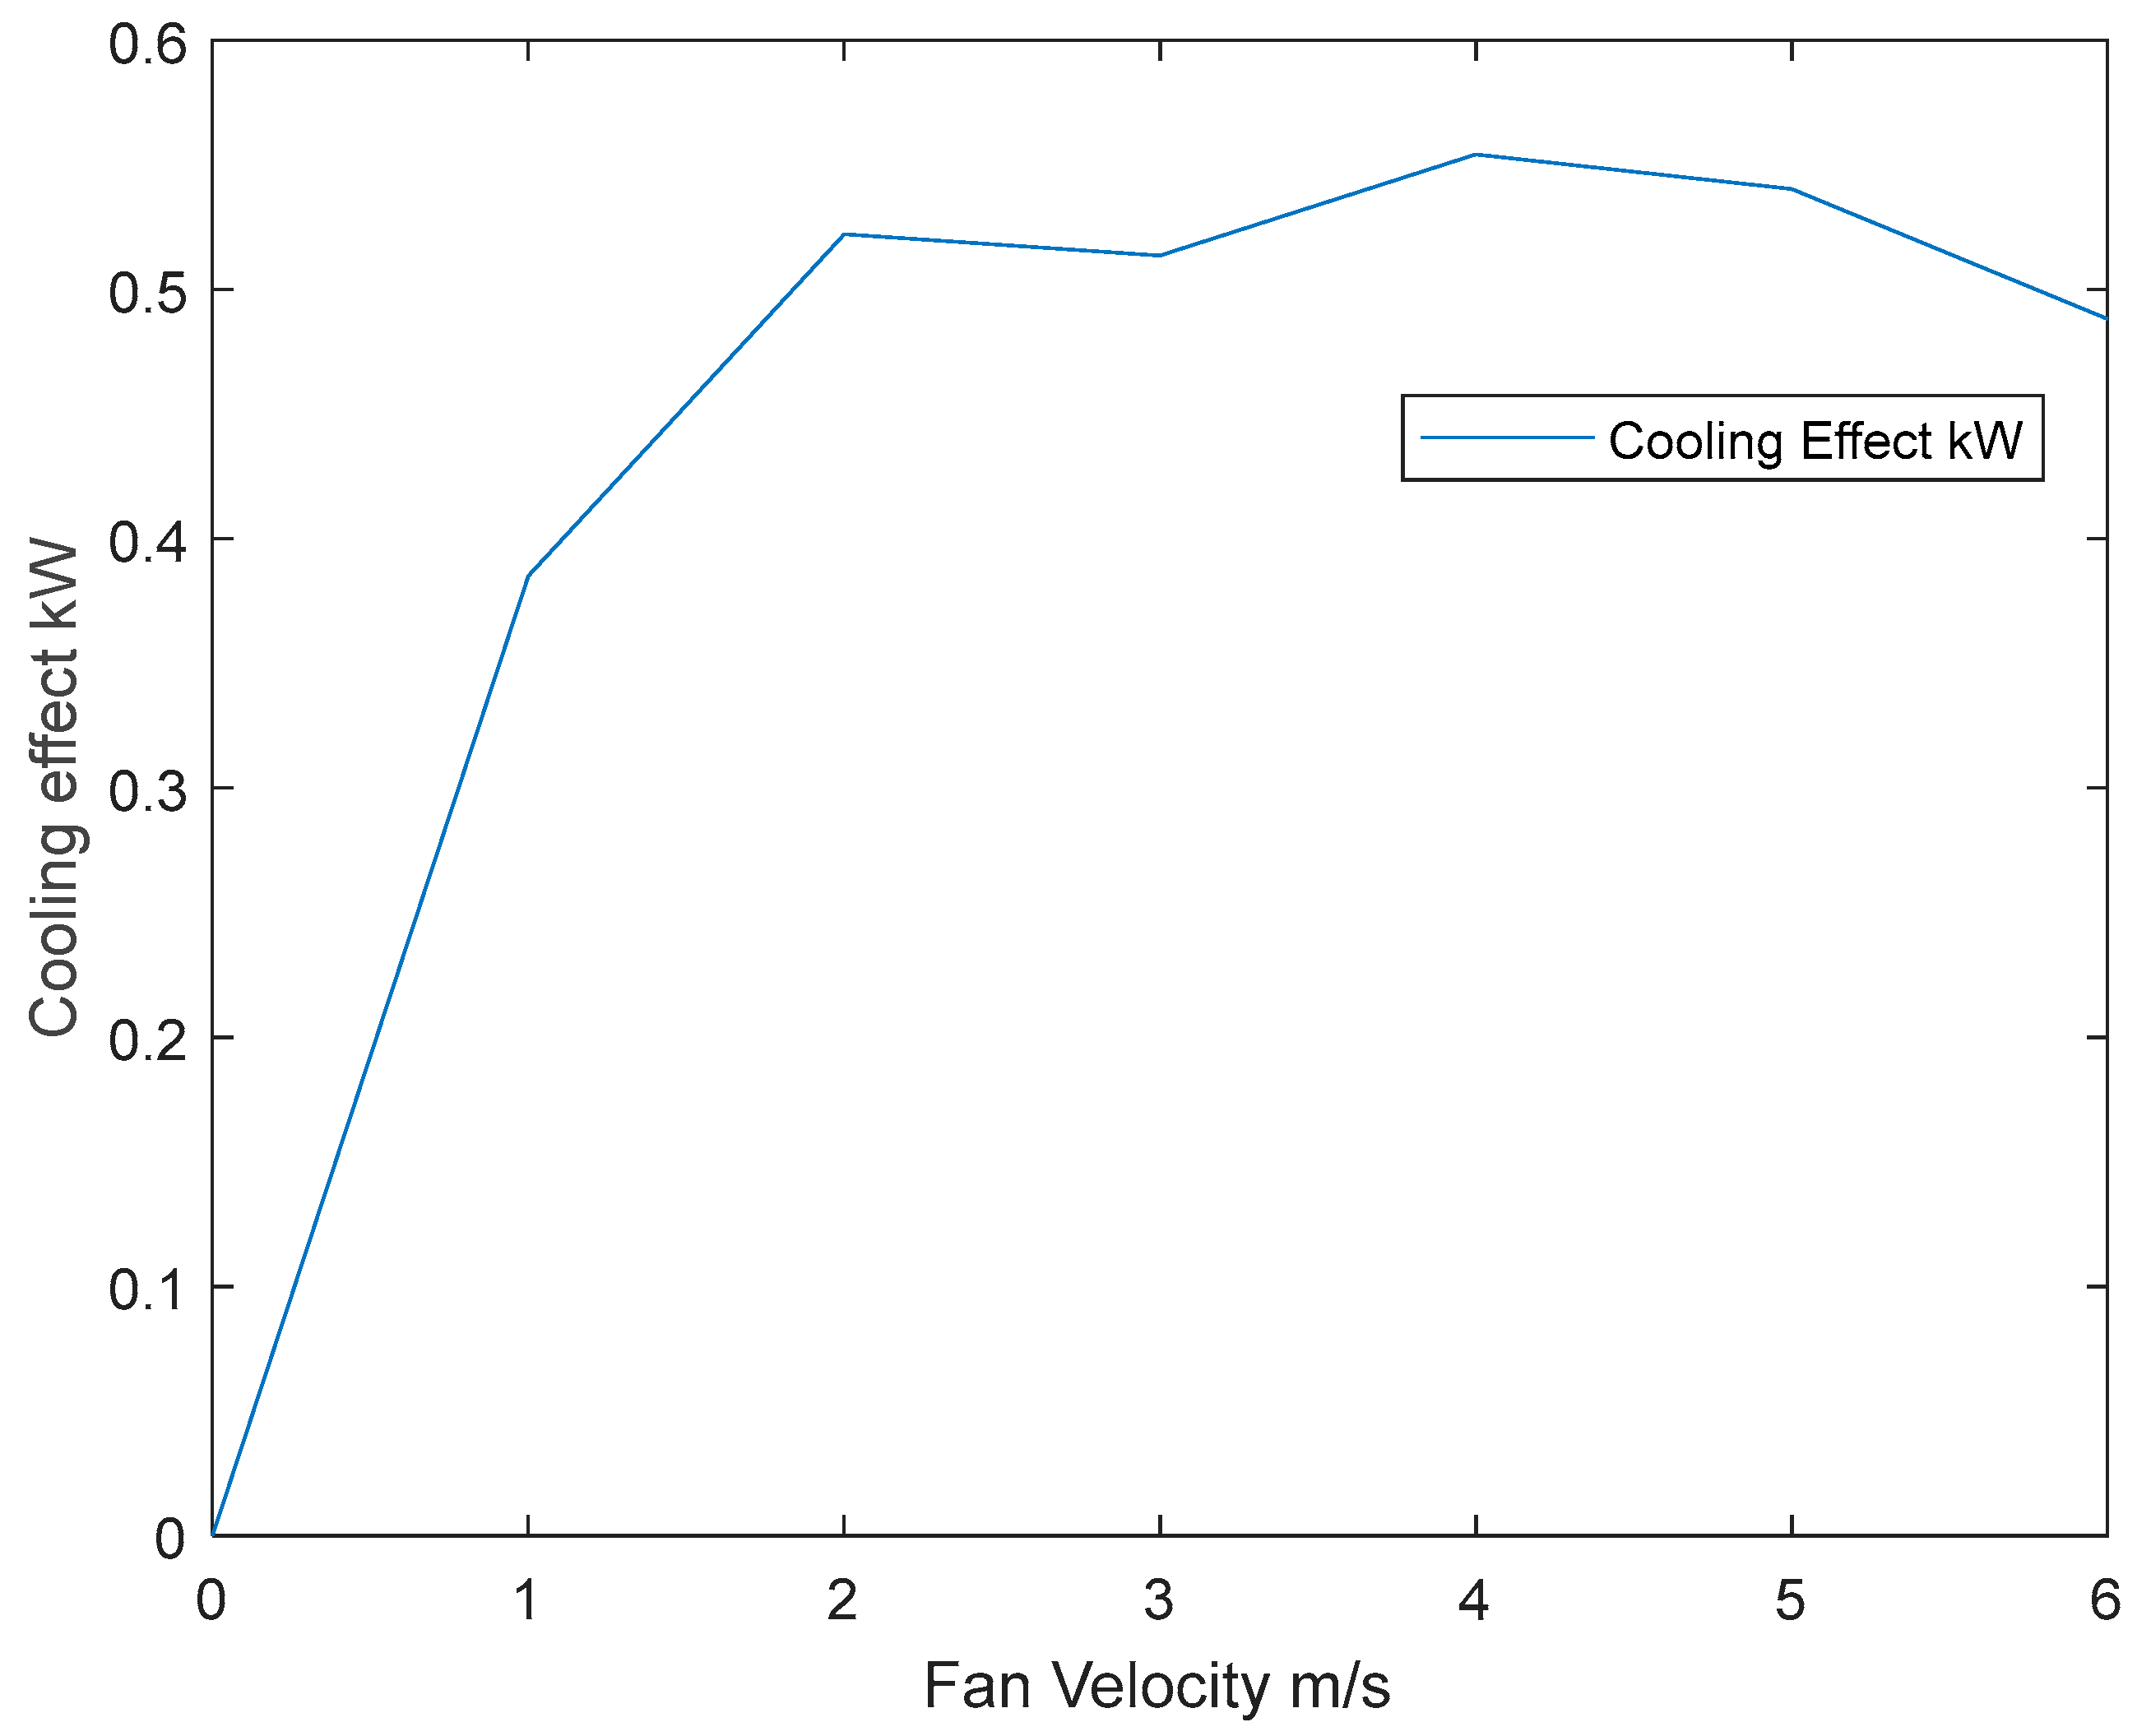
Figure 4,
Figure 5 and
Figure 6 below show the results of the experiments of the ducted PV when integrating a fan. During the test, the inlet temperature remained almost constant at just above 20 °C, except for the last tested fan speed of 6 m/s, which was 17.59 °C. The mean PV temperature was decreasing with the increase in fan speed. So that the highest PV mean temperature was 68.54 °C when the fan was on halt. While it was 62.71 °C when the airspeed from the fan was 6 m/s, which was the highest tested air speed,
Figure 2.
Inlet and outlet temperature differences reduce rapidly with the increase in air velocity as
Figure 4 illustrates. The cooling exerted on PV using forced convection has also been calculated from the product of the temperature difference between the inlet and outlet and mass flow rate as depicted by Equation (1). The calculated cooling potential was increasing with the increase of an air velocity up to air velocity of 4 m/s; however, a slowdown in cooling was reported at air speeds of 5 m/s and 6 m/s (
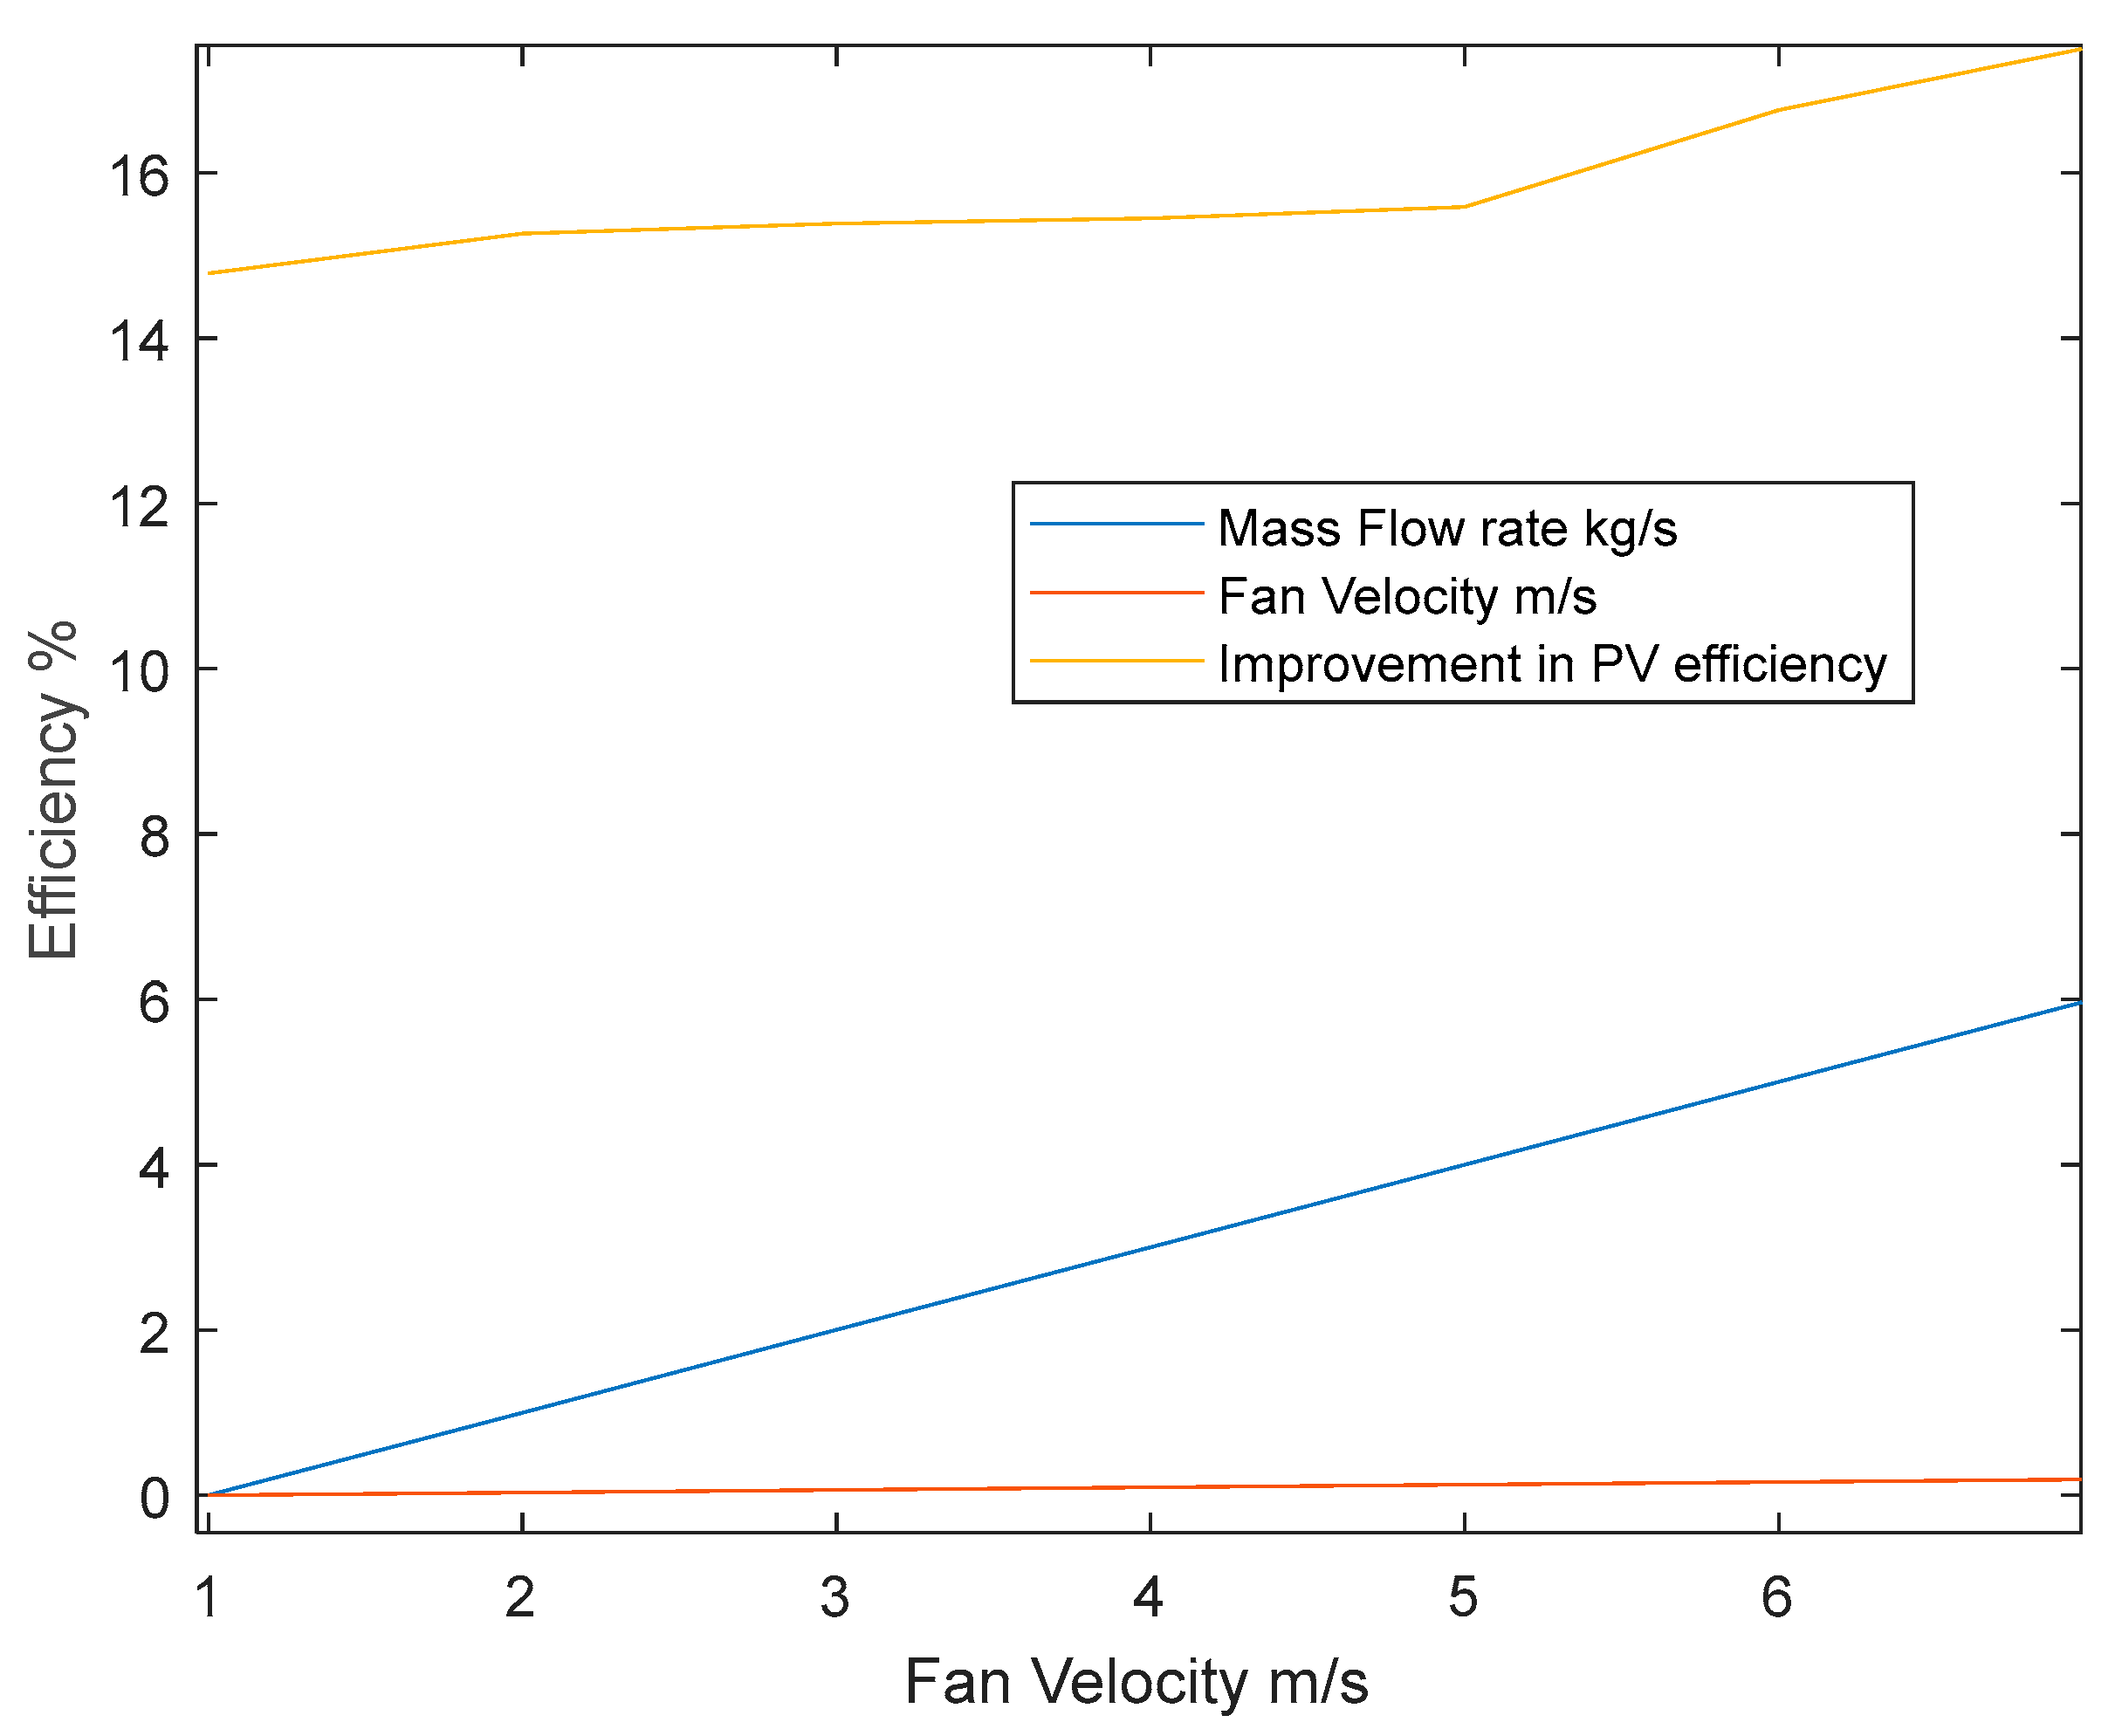
Table 3). However, the lowest PV mean temperature was not experienced in the case where maximum cooling potential was calculated, but rather with the maximum air velocity and mass flow rate. On the other hand, the mass flow rate has increased with the increase of air velocity, and the highest recorded mass flow rate was 0.19 kg/s under a fan velocity of 6 m/s (
Figure 7). This is reciprocated with the maximum increase in PV improvement efficiency of 17.53% as depicted in
Figure 7.
We know from the manufacturer’s specifications that the cells’ temperature coefficient is −0.47%/°C. Therefore, for every degree drop in temperature in the mean PV panel from the initial condition (i.e., PV temperature of 100 °C where there is no duct), we increase the panel efficiency by 0.47%. By multiplying the total reduction in mean temperature for each fan speed by 0.47, we arrive at the improvement in PV efficacy. Therefore, a fan speed of 6 m/s resulted in a 62.71 °C mean PV temperature. This is a 37.29 °C reduction from 100 °C. Therefore, the improvement in PV efficiency for this speed would be 37.29 × 0.47 = 17.53%,
Table 3.
This would increase PV efficacy from the previously obtained 7.12% [
12] to 9.12%. Thus, this increases power output by about 18.71 W.
From
Figure 7 and
Table 3, although the increase in mass flow rate was linear, only from fan speed of 4 m/s onwards there was an appreciable increase in mass flow. This is translated into the resulting improvement in efficiency with a more tapered curve in
Figure 7.
6. Comparison between Natural Convection and Forced Convection Results
The maximum cooling achieved with the fan was 550 W (
Table 4, below) with an efficiency of heat removal of 51%, while it was 529 W with an efficiency of 47.98% in the natural convection option as presented in [
12]. This led to a maximum improvement in PV efficiency of 17.53% for the forced convection case, as opposed to only 12.69% for the natural convection case.
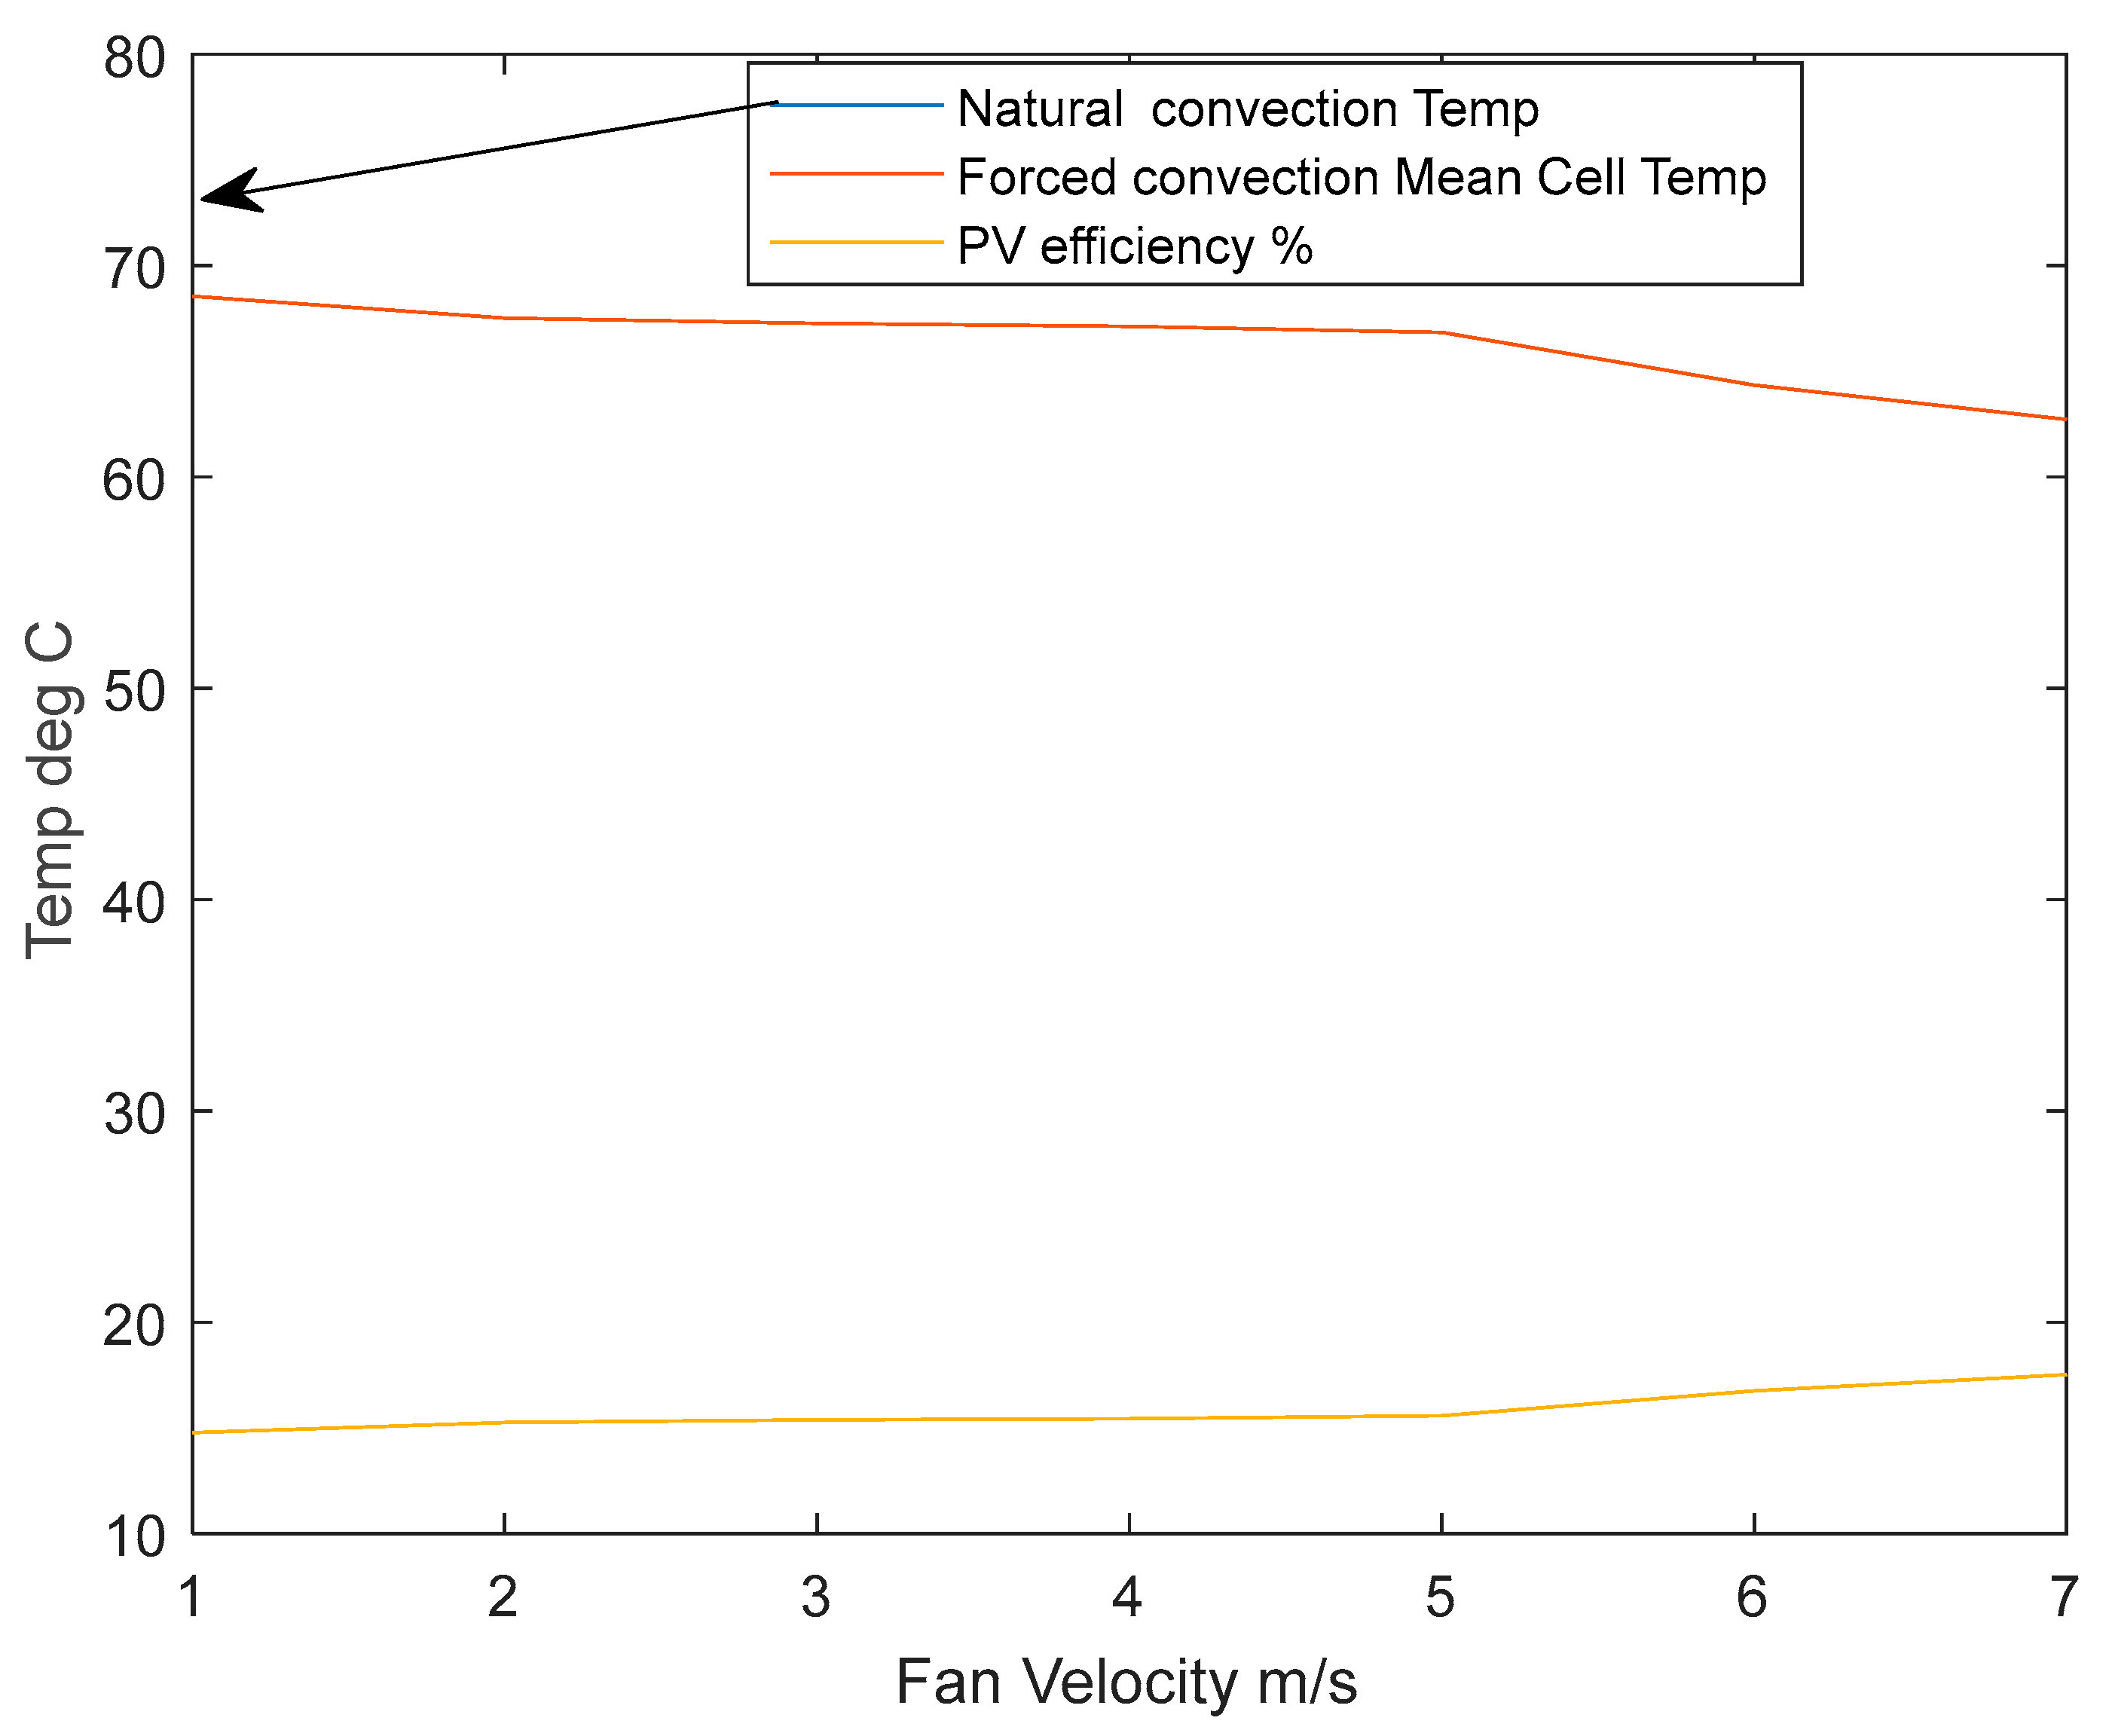
A full picture of improvements in PV efficiency under forced convection compared to the same duct of 50 cm depth but under natural convection is delineated in
Figure 8. The mean PV temperature was 73.31 °C in the natural convection case, which continued to decrease rapidly with the increase in fan speed from 67.52 °C to 62.71 °C in the forced convection cases.
On the other hand, the maximum temperature difference between inlets and outlets in both ducts of 50 cm depth in either the natural convection or forced convection, in fact, reported about the same amount, with the former scoring 12.32 °C and the latter having 12.26 °C. Yet the mass flow rate for the natural convection case was only 0.057 kg/s when it was 0.19 kg/s in the forced convection case. This is over a three-fold increase in mass flow rate, which yielded over 10 degrees’ reduction in PV mean temperature as expected.
7. Directions for Further Research
The design of this experiment originally was meant to utilize vertical ducts for their conduciveness to vertical air flow with minimal resistance. This very experiment is more specific to forced convections; however, both natural and forced convection can work hand in hand to accelerate the flow upwards, and therefore, more module cooling will result. Horizontal ducts would need to work on forced convection only, and in fact, buoyancy could be a resisting factor to flow here. The results of this experiment can be applied straight away to buildings’ façade designs with suitable exposure to sun radiation. High sun angles can be assisted with reflective surfaces aimed at the duct. Thus allowing for more energy generation. For future work, it is expected that with more ducted PV panels stacked vertically, such as in tall buildings, a faster natural convection air velocity would be produced due to buoyancy. It would be interesting to know where the point is where natural convection cooling of the duct would supersede forced convection cooling.
8. Conclusions
This paper reports on applying a forced convection scenario to the ducted photovoltaic façade unit investigated previously under natural convection in [
12,
15] This investigation has shown that a forced convection scenario of the ducted photovoltaic façade unit has removed 550 W of thermal energy with an efficiency of heat removal of 51%, while it was 529 W with an efficiency of 47.98% in the natural convection option. The fact that improved PV panel efficiency by 17.53% when the maximum improvement was 12.69% in natural convection. The total summation of heat recovered and energy enhanced by the ducted system was 68.53% for the former (i.e., forced convection), while it was 61.67% for the latter. Maximum cooling of the PV panel occurred with the highest mass flow rate, not with the maximum calculated thermal energy extraction. A 12 V DC fan with a variable speed electric circuit powered by a fraction of the PV generated power (i.e., 0.75 W) yielded better cooling that translates into nearly 19 W of additional energy generation.
Author Contributions
Conceptualization, A.R.E.; methodology, A.R.E.; software, A.M. validation, A.R.E.; formal analysis, A.R.E.; investigation, A.R.E.; resources, S.W.; data curation, S.W.; writing—original draft preparation, A.R.E.; writing—review and editing, A.R.E.; visualization, A.M.; supervision, S.W.; project administration, A.R.E.; funding acquisition, S.W. All authors have read and agreed to the published version of the manuscript.
Funding
This research received from Deanship of Scientific Research at King Saud University for funding this work through research group no. RG-1441-347.
Institutional Review Board Statement
Not applicable.
Informed Consent Statement
Not applicable.
Data Availability Statement
All the reported data for this experiment are presented in this paper. Data about other scenarios of the same experiment (i.e., Natural Convection scenario can be obtained from references [
12,
15]).
Acknowledgments
The authors extend their appreciation to the Deanship of Scientific Research at King Saud University for funding this work through research group no. RG-1441-347.
Conflicts of Interest
No conflict of interest are perceived at the time of preparing this work.
References
- UN-Habitat. Urbanization and Development; Report No.: HS/038/16E; UN-Habitat: Nairobi, Kenya, 2016. [Google Scholar]
- Lokman Hakim, I.; Magda, S.; Izudinshah Abdul, W. Bioclimatic Technology in High Rise Office Building Design: A Comparison Study for Indoor Environmental Condition. J. Sci. Technol. 1970, 3, 89–103. [Google Scholar]
- Elbakheit, A.R. Why Tall Buildings? The Potential of Sustainable Technologies in Tall Buildings. Int. J. High-Rise Build. 2012, 1, 117–123. [Google Scholar]
- Elbakheit, A. A framework towards enhanced sustainable systems integration into tall buildings design. Archnet-Ijar Int. J. Archit. Res. 2018, 12, 251–265. [Google Scholar] [CrossRef]
- Elbakheit, A.R. (Ed.) Effect of duct width in ducted photovoltaic facades. In Proceedings of the CTBUH 2008, 8th World Congress—Tall and Green: Typology for a Sustainable Urban Future, Congress Proceedings; Council of Tall Buildings and Urban Habitat: Chicago, IL, USA, 2008. [Google Scholar]
- Barone, G.; Buonomano, A.; Chang, R.; Forzano, C.; Giuzio, G.F.; Mondol, J.; Palombo, A.; Pugsley, A.; Smyth, M.; Zacharopoulos, A. Modelling and simulation of building integrated Concentrating Photovoltaic/Thermal Glazing (CoPVTG) systems: Comprehensive energy and economic analysis. Renew. Energy 2022, 193, 1121–1131. [Google Scholar] [CrossRef]
- Hegazy, A.A. Comparative study of the performances of four photovoltaic/thermal solar air collectors. Energy Convers. Manag. 2000, 41, 861–881. [Google Scholar]
- Hamed, T.A.; Alshare, A.; El-Khalil, H. Passive cooling of building-integrated photovoltaics in desert conditions: Experiment and modeling. Energy 2019, 170, 131–138. [Google Scholar] [CrossRef]
- Moradgholi, M.; Nowee, S.M.; Farzaneh, A. Experimental study of using Al2O3/methanol nanofluid in a two phase closed thermosyphon (TPCT) array as a novel photovoltaic/thermal system. Solar Energy 2018, 164, 243–250. [Google Scholar] [CrossRef]
- Ma, T.; Yang, H.X.; Zhang, Y.P.; Lu, L.; Wang, X. Using phase change materials in photovoltaic systems for thermal regulation and electrical efficiency improvement: A review and outlook. Renew. Sustain. Energy Rev. 2015, 43, 1273–1284. [Google Scholar] [CrossRef]
- Li, J.; Zhang, W.; Xie, L.; Li, Z.; Wu, X.; Zhao, O.; Zhong, J.; Zeng, X. A hybrid photovoltaic and water/air based thermal(PVT) solar energy collector with integrated PCM for building application. Renew. Energy 2022, 199, 662–671. [Google Scholar] [CrossRef]
- Elbakheit, A.R. A Ducted Photovoltaic Facade Unit with Buoyancy Cooling: Part I Experiment. Buildings 2019, 9, 88. [Google Scholar] [CrossRef]
- Kharchenko, V.; Panchenko, V.; Tikhonov, P.V.; Vasant, P. Cogenerative PV thermal modules of different design for autonomous heat and electricity supply. In Handbook of Research on Renewable Energy and Electric Resources for Sustainable Rural Development; IGI Global: Hershey, PA, USA, 2018; pp. 86–119. [Google Scholar]
- Panchenko, V.A. Solar Roof Panels for Electric and Thermal Generation. Appl. Sol. Energy 2018, 54, 350–353. [Google Scholar] [CrossRef]
- Elbakheit, A.R. A Ducted Photovoltaic Façade Unit with Buoyancy Cooling: Part II CFD Simulation. Buildings 2019, 9, 133. [Google Scholar] [CrossRef]
- Madadnia, J.; Park, M.H. Design of Compact BIPV Fac¸ ades for the Buildings at the University of Technology Sydney (UTS). In Proceedings of the Heat Transfer Summer Conference; ASME: New York, NY, USA, 2009; Volume 3, pp. 801–808. [Google Scholar]
- Mirzaei, P.A.; Carmeliet, J. Influence of the underneath cavity on buoyant-forced cooling of the integrated photovoltaic panels in building roof: A thermography study. Prog. Photovolt. 2015, 23, 19–29. [Google Scholar] [CrossRef]
- Maghrabie, H.M.; Mohamed, A.S.A.; Salem Ahmed, M. Experimental Investigation of a Combined Photovoltaic Thermal System via Air Cooling for Summer Weather of Egypt. J. Therm. Sci. Eng. Appl. 2020, 12, 041022. [Google Scholar] [CrossRef]
- Gökhan, Ö. Experimental and computational fluid dynamics analysis of a photovoltaic/thermal system with active cooling using aluminum fins. J. Photonics Energy 2017, 7, 1–16. [Google Scholar]
- Zogou, O.; Stapountzis, H. Experimental validation of an improved concept of building integrated photovoltaic panels. Renew. Energy 2011, 36, 3488–3498. [Google Scholar] [CrossRef]
- Fterich, M.; Chouikhi, H.; Bentaher, H.; Maalej, A. Experimental parametric study of a mixed-mode forced convection solar dryer equipped with a PV/T air collector. Sol. Energy 2018, 171, 751–760. [Google Scholar] [CrossRef]
- Suleiman, S.; Himmo, B. Direct comfort ventilation. Wisdom of the past and technology of the future (wind-catcher). Sustain. Cities Soc. 2012, 5, 8–15. [Google Scholar] [CrossRef]
- Kaiser, A.; Zamora, B.; Mazon, R.; Garcia, J.; Vera, F. Experimental study of cooling BIPV modules by forced convection in the air channel. Appl. Energy 2014, 135, 88–97. [Google Scholar] [CrossRef]
- DeBlois, J.; Bilec, M.; Schaefer, L. Design and zonal building energy modeling of a roof integrated solar chimney. Renew. Energy 2013, 52, 241–250. [Google Scholar] [CrossRef]
- Wei, C.; Pohorille, A. M2 Proton Channel: Toward a Model of a Primitive Proton Pump. Orig. Life Evol. Biosph. 2015, 45, 241–248. [Google Scholar] [CrossRef] [PubMed]
| Publisher’s Note: MDPI stays neutral with regard to jurisdictional claims in published maps and institutional affiliations. |
© 2022 by the authors. Licensee MDPI, Basel, Switzerland. This article is an open access article distributed under the terms and conditions of the Creative Commons Attribution (CC BY) license (https://creativecommons.org/licenses/by/4.0/).
