Article

Resilient and Sustainability Analysis of Flexible Supporting Structure of Expansive Soil Slope

1
School of Traffic & Transportation Engineering, Changsha University of Science & Technology, Changsha 410114, China
2
School of Civil Engineering, Hunan University of Science and Technology, Xiangtan 411201, China
3
China Railway Nanning Group Co., Ltd., Nanning 530029, China
*
Author to whom correspondence should be addressed.
Sustainability 2022, 14(19), 12813; https://doi.org/10.3390/su141912813
Submission received: 3 August 2022 / Revised: 25 September 2022 / Accepted: 27 September 2022 / Published: 8 October 2022

Abstract

:
In order to improve the ability of the flexible support structure to resist, recover and adapt to the failure of expansive soil slope, it is necessary to analyze and study its structural resilience systematically. Based on the long-term field monitoring test of expansive soil slope with flexible support along the south line of the Guinan key project, combined with the whole life cycle assessment (LCA), this paper discusses the theory and method of resilient design of expansive soil slope with a flexible support structure. The results show that the variation trend of geogrid strain is basically consistent with that of soil pressure at the side of the slope. It increases gradually with the increase in rainfall in the rainy season. When the rainfall decreases significantly in the dry season, the geogrid will shrink accordingly to realize the periodic regulation of lateral deformation of expansive soil. The life cycle assessment analysis shows that the carbon emission of the flexible support structure is 10% of that of the rigid support structure, and the resource and energy consumption of the flexible support structure is about 50% lower than that of the rigid support structure.

1. Introduction

Expansive soil contains a high proportion of hydrophilic mineral components, such as montmorillonite and illite, which are very sensitive to change the water content, and the volume of expansive soil changes with water absorption or loss [1,2]. Under the action of dry and wet cycles, the expansive soil slopes constantly swell and contract, and eventually, cracks will be formed. Further infiltration of rainfall will cause the strength of slope soil to decrease, leading to progressive shallow slope failures [3,4]. Sustainability of slope support structure is the key to ensuring the long-term stability of expansive soil slope [5]. The swelling deformation is entirely restrained when a rigid structure protects the slope. Under the circumstances, the expansive soil will produce a large lateral swelling pressure, causing the destruction of the structure [6,7]. As a flexible reinforced material, geogrid can make up for the above shortcomings of rigid structures. Nevertheless, the use of geogrid is limited to reinforcing sandy soils in many countries, and there are strict requirements for the particle size composition of the filler. In China, no strict restrictions are specified on the filler, but the filler is assumed to be uniform and non-cohesive in the design of geogrid-reinforced soil slopes. There are many practical cases of using geogrid to reinforce clayey soil slopes in China’s highway, railway, and water conservancy construction and other fields [8,9,10]. When reinforcing expansive soil slopes by geogrid, the long-term behavior is a big concern as desiccation cracks may appear in dry weather. Rainwater infiltration through the slope’s surface cracks would lessen the geotextile’s stability. Furthermore, the swelling of backfill materials will significantly impact the stability of the geotextile. As a result, a more in-depth understanding of the long-term behavior of geogrid-reinforced expansive soil slope is needed. Clarifying the interaction mechanism between expansive soil and geogrid in a long-term atmospheric environment is the basis for developing stability analysis methods for reinforced expansive soil slopes. The latter can provide a reference for the popularization and application of reinforced geogrid repair technology.
The existing research on geogrid reinforced expansive soil is mainly carried out from two aspects: local physical and mechanical properties of the reinforced element and the overall stability of the reinforced body [11,12,13,14]. Triaxial tests were performed to investigate the deformation and strength characteristics of geogrid-reinforced expansive soil. Studies have found that water content and distribution mode has a great influence on the strength of reinforced expansive soil [15,16]. It was found that the implant of reinforcement materials reduces soil structure’s contribution to the strength of reinforced expansive soil. An increase in moisture content causes obvious reductions in soil strength and angle of internal friction. The reinforced expansive soil with an equal spacing arrangement of reinforcement has higher strength and takes effect later, which is more suitable for reinforced soil engineering with larger deformation requirements. Unconfined compression tests and consolidated undrained shear tests were conducted on reinforced expansive soils. It was reported that the unreinforced expansive soil samples show strain-softening behavior, and the reinforcement can obviously improve the residual strength and peak strength of the samples [17]. The stress-strain softening degree of the samples decreases with an increasing number of reinforced layers. With an increase in the number of reinforced layers, the cohesion of the reinforced soil increases significantly, while the angle of internal friction decreases gradually. Similar results were obtained by consolidated and drained tests of reinforced expansive soil. The strain hardening degree of reinforced expansive soil increased significantly, and the angle of internal friction of geogrid-reinforced expansive soil did not change significantly [18,19,20]. In addition, the implant of geogrid would lead to a change of failure mode, and the effect of reinforcement on improving soil strength was obvious. It was also found that geogrid had a certain water conductivity, which would lead to an increase in consolidation displacement.
Compared with rigid support structures, geogrid flexible support can ensure the long-term stability of expansive soil slopes. However, exploring the advantages and disadvantages of the two in terms of resource and energy utilization efficiency and low carbon emission reduction is also an important topic to adhere to in the development of green railways. At present, many countries and organizations have applied the Life Cycle Assessment (LCA) method to evaluate and analyze the energy consumption and environmental impact of projects [21]. At first, this method was mainly focused on the fields related to housing construction engineering [22,23,24,25,26], and it was not until the last decade that relevant practice and research on roads and asphalt pavement began [27]. Chan [28] integrated LCA and LCCA (Life Cycle Assessment, Life Cycle Cost Assessment) to make a comparative analysis of three kinds of road surface, namely new road surface, reconstruction road surface, and regeneration road surface, and obtained that cement road surface has lower energy consumption than asphalt road surface, but its greenhouse gas emission is the largest. Chang et al. [29] analyzed the carbon emission distribution in a section of the California high-speed railway based on LCA. Frischknecht R. [30] compared the working principle of concrete reinforced retaining wall and geosynthetic-reinforced retaining wall, took a slope 1 m long and 3 m high as the test object, and applied LCA to conduct an environmental assessment of the two kinds of retaining wall. The results showed that the use of geosynthetic-reinforced retaining walls could reduce the environmental impact of the slope. Scholars mainly focus on the life cycle evaluation of subgrade and pavement and lack analysis of slope. Or the main body of test objects is small, and the data are mainly based on literature, which is not based on engineering practice, and the influence of results is weak.
In order to have a deeper understanding of the stability and reinforcement mechanism of expansive soil slopes under a long-term atmospheric impact, a geogrid-reinforced expansive soil was monitored. Water content probes, earth pressure cells, inclinometers, flexible displacement meters, rain gauges, thermometers, and hygrometers were used to collect stresses, strains, and displacements of the slope as well as meteorological data for a period of two years. Based on the monitored data, the effects of geogrid on the stability of the expansive soil slope and reinforcement mechanism were investigated. Taking LCA as the theoretical guidance, combined with the engineering example in the Nanning area, the environmental impact degree of flexible and rigid slope support structure during the construction period is calculated and analyzed. The two kinds of support structures are compared and evaluated from the perspectives of environment and economy, and some suggestions on the selection of expansive soil slope support schemes are put forward.
The objective of this paper is to prove that the flexible supporting structure can ensure the long-term stability of the slope in the complex atmospheric environment through on-site monitoring. It is a kind of ductile structure that can regulate the deformation of the slope through its own flexible deformation. Another objective is to prove through LCA analysis that the flexible supporting structures are more economical and environmentally friendly than traditional rigid structures in the treatment of expansive soil slopes.

2. Materials and Methods

2.1. Description of the Slope Site

The length of Guinan Railway is 2795 km. This area belongs to a humid subtropical monsoon climate, hot and humid, with abundant sunshine and rainfall. The annual average temperature is 22.6 degrees, the annual average rainfall is 1304.2 mm, and the average relative humidity is 79%. On the basis of fully collecting and utilizing existing geological data, surveying and mapping on the spot, the geological data along the line are obtained by means of comprehensive exploration methods such as drilling and laboratory tests. The bad geology in the section is mainly bedding, and the special rock and soil are expansive soil, expansive rock, and coal seam. The expansive soil is brown yellow, yellow, and brownish yellow, hard plastic to hard, distributed in the residual mound surface within the range of the survey area, generally 1–5 m thick, free expansion rate Fs = 38%–128%, montmorillonite content M = 4.49%–18.66%. The cation exchange capacity of dry soil is 115.3–280.5 mmol (NH4+) /kg, which is weak to medium expansive soil.
The case study is located on the right line of the Nan-Guizhou Railway. The pile number of the left side slope is GNYK 214 + 605–GNYK 214 + 870, with a length of 265 m. The slope is 15 m long, and the bottom side is 5 m long (see Figure 1). Nanning hub is located in Nanning Basin, which is in the typical distribution area of expansive soil. Its geological age is relatively new, and it is seriously affected by climate, and its physical and chemical weathering is obvious.
After the collapse of the slope, the depth and width of cracks at different positions of the slope were measured. The largest crack was located in the middle of the slope, with a depth of 1.5 m and a width of 12 mm. The field investigation found that the sliding surface was about 1.4 m–1.6 m deep from the surface. Based on the geological survey statistics, the local atmospheric influence deep is 2.5 m, and the depth of the significant atmospheric influence layer should be 2/3 of this depth, which is 1.67 m. The sliding surface is located within the significant influence zone of dry–wet cycles.
The continuous slope collapses resulted from the weak expansive soil with swelling and shrinkage characteristics. Because of the influence of atmospheric dry–wet cycles, the slope’s surface formed dense crack networks, and many 1–2 m deep cracks existed on the crest of the slope. Rainwater permeated along the cracks, resulting in the formation of perched water areas under the rainfall. As the shallow soil swelled after humidification, the shear strength and the effective cohesion were significantly reduced, and the effective internal friction angle declined slightly. At the same time, after rainwater infiltration, the pore water pressure of the shallow soil increased while the effective stress decreased. Accordingly, compared with the non-expansive soil slope, the expansive soil slope finally showed shallow collapses, although the slope ratio was 1(V):2.5(H).

2.2. Geogrid-Based Reinforcement of the Slope

Currently, two kinds of support and prevention technologies exist for expansive soil slopes. The traditional support methods often use rigid support structures such as gravity retaining walls, anti-side piles, and anchor frame beams to support and reinforce the expansive soil. As the expansive soil expands significantly after absorbing water, the rigid support structure cracks and destroys under long-term concentrated stress. They result in the unsatisfactory control effect of the expansive soil slope and potential severe safety hazards. Therefore, given the problems caused by traditional support and to prevent the failure of expansive soil slope, Chinese scholars proposed the flexible support technology of expansive soil. This structure is reinforced by geogrid and obtained that the tensile deformation of geogrid can effectively prevent the shallow failure of slope. Both the flexible support technology of geogrid and the rigid support technology can ensure the stability of expansive soil slopes and play the role of support and reinforcement. The flexible support technology of geogrid can ensure the stability of expansive soil slopes and play a role in support and reinforcement. At the same time, using geogrid to strengthen expansive soil can compact the reinforced soil layer to a sufficient thickness.
The survey results show that: <11–1> mudstone, argillaceous sandstone interbedded coal seam (N/23/): green gray, weathering brown yellow, gray yellow, sandy structure, layered structure, semi-consolidated diagenesis, poor diagenesis, soft rock, and locally interbedded with a small amount of thin layer lignite. Total weathering (W4) weathering is soil-like and sand-like, 4–20 m thick, belonging to class III hard soil; The core of strongly weathered (W3) is columnar and belongs to grade IV soft rock. Weak weathering (W2) borehole not revealed belongs to class IV soft rock. According to field investigation and test, this layer contains lignite, generally 0.1–0.2 m thick. Mudstone is expansive rock <11–2> mudstone, argillaceous sandstone (N/22/): green gray, brown yellow, gray yellow after weathering, sandy and argillaceous structure, layered structure, semi-consolidated diagenesis, poor diagenesis, soft rock. Total weathering (W4) weathering is soil-like and sand-like, belonging to class III hard soil; The core of strongly weathered (W3) is columnar and belongs to grade IV soft rock. Weak weathering (W2) borehole not revealed belongs to class IV soft rock. Mudstone is expansive rock (see Figure 2).
This type of structure has desirable advantages. On the one hand, the flexible retaining structure has a retaining effect on the excavated slope; on the other hand, it has an energy dissipation effect on the expansive soil slope through its deformation. The interaction between the geogrid and the soil, especially the connection and wrapping between the geogrid of different layers, plays frame and hoop roles in the reinforcement of expansive soil. This makes the reinforced body become an integral structure that can withstand certain deformations without damage. The deformation of the structure enables expansive soils to release swelling forces. As a result, overall or local collapses of the slope can be avoided due to the accumulation of swelling energy. Additionally, this structure isolates the rainwater on the slope surface and the slope crest and drains the groundwater inside the slope. In this way, great changes in soil moisture are avoided, and thus the swelling of expansive soils is mitigated.

2.3. Monitoring Scheme

The test area is 12 m long and 16 m wide on the slope surface. Various sensors were buried and the details are summarized in Table 1. Before installing the sensors, weeds were removed from the test area.
Figure 2 shows the layout scheme of monitoring sensors for the reinforced expansive soil slope. A small weather station containing a rain gauge, a thermometer, and a hygrometer was set at the crest of the slope to collect local meteorological data. Four water content probes (WC), six earth pressure cells, and four flexible displacement meters (FD) were installed on two different horizontal planes (I and II) at heights of 1.5 m and 3.5 m, respectively (see Figure 3). Additionally, four water content probes and four flexible displacement meters were buried on the third monitoring plane (III) at the height of 5.25 m.
The water content probes on each monitoring plane were arranged along the same cross-section at a distance of 1 m so that the water content change at different positions of the reinforced soil body could be obtained. Considering the influence between sensors, the spacing of each sensor is 1 m according to the layout of reference [1]. Since the vertical earth pressure and lateral earth pressure in the same area need to be measured simultaneously in the earth pressure cell, its spacing is reduced to 0.5 m.
The earth pressure cells can be grouped into the soil vertical pressure (SVP) cell and the soil lateral pressure (SLP) cell. In each group, three earth pressure cells were arranged along the same cross-section at a 1.5 m interval. The first cell was located in the geogrid envelope, which was 0.75 m away from the surface of the slope. Vertical and lateral earth pressure cells were buried at a distance of 1 m. Note that the earth pressure on the third monitoring plane (III) was not monitored because the overburden pressure on this plane is small.
On every monitoring plane, four flexible displacement meters were installed on the geogrid of longitudinal rib along the same cross-section. The spacing of the flexible displacement meters was 1 m. The purpose was to monitor the deformation of geogrid at different locations.
Inclinometer probes were installed in two inclinometer pipes at heights of 3.75 m and 5.25 m, and the two inclinometer pipes were located in the same cross-section. Five probes were installed at 3.75 m, and six probes were installed at 5.25 m to obtain the horizontal deformation of the reinforced body at different depths along the cross-section direction of the slope.

2.4. Monitoring Sensors

(1)
Water content probes
The water content probe is JMSF-6001 produced by JinMa Company in China. According to the functional relationship between the dielectric constant of the soil and the volumetric water content in the soil, the water content in the soil is indirectly obtained by measuring the dielectric constant of the soil using the standing wave technology.
(2)
Earth pressure cells
In order to monitor the vertical and horizontal earth pressure, three vibrating string earth pressure cells are arranged in the test area. The earth pressure cell realizes the percussive vibration through the pulse percussive vibration mode, and the testing speed is fast. When installing, the pressure film of the earth pressure cell shall be in the direction of pressure, the bottom of the earth pressure cell shall be smooth, and the earth pressure cell shall be installed horizontally with level control. The earth pressure cell should be filled with artificial bulldozing and small machine rolling within the range of 1 m to prevent the earth pressure cell and wire from being damaged by construction or natural factors.
(3)
Flexible displacement meter
In order to measure the change in lateral strain of geogrid in a long-term humid and hot environment, a flexible displacement meter was used to monitor the lateral strain at different positions of the single-layer geogrid. The displacement meter was stretched 5–10 mm so that it has a complete initial reading (Figure 3). A small electric drill or knife was used to open a hole in the geogrid. Then, the geogrid longitudinal rib was clamped between the installed base and the clip. After the displacement meter was installed, the distance between the bases at both ends should be recorded; that is, the measuring distance should be determined. According to the measured values, i.e., the initial reading and the measured distance, the strain and stress of the geogrid material can be calculated.
(4)
Stationary inclinometer
As shown in Figure 3, a stationary inclinometer was installed in a pipe. When the deformation occurred in the pipe, the inclinometer could measure the angle of the inclined pipe to the gravity direction.
The fixed inclinometer is composed of an angle sensor (biaxial inclination sensor) and an intelligent electronic chip. The vertical inclinometer pipes are PVC pipes with an inner diameter of 100 mm. The deep internal deformation of the slope can be obtained by measuring the tilt angle of the inclinometer inside the pipes. In order to facilitate observation and construction, the two probes are connected by an extended pipe of 23 cm length. The inclinometers are connected to the inclinometer pipe with equal spacing in turn to form multiple measuring points.

3. Monitoring Results and Analysis

3.1. Meteorological Data of the Reinforced Slope

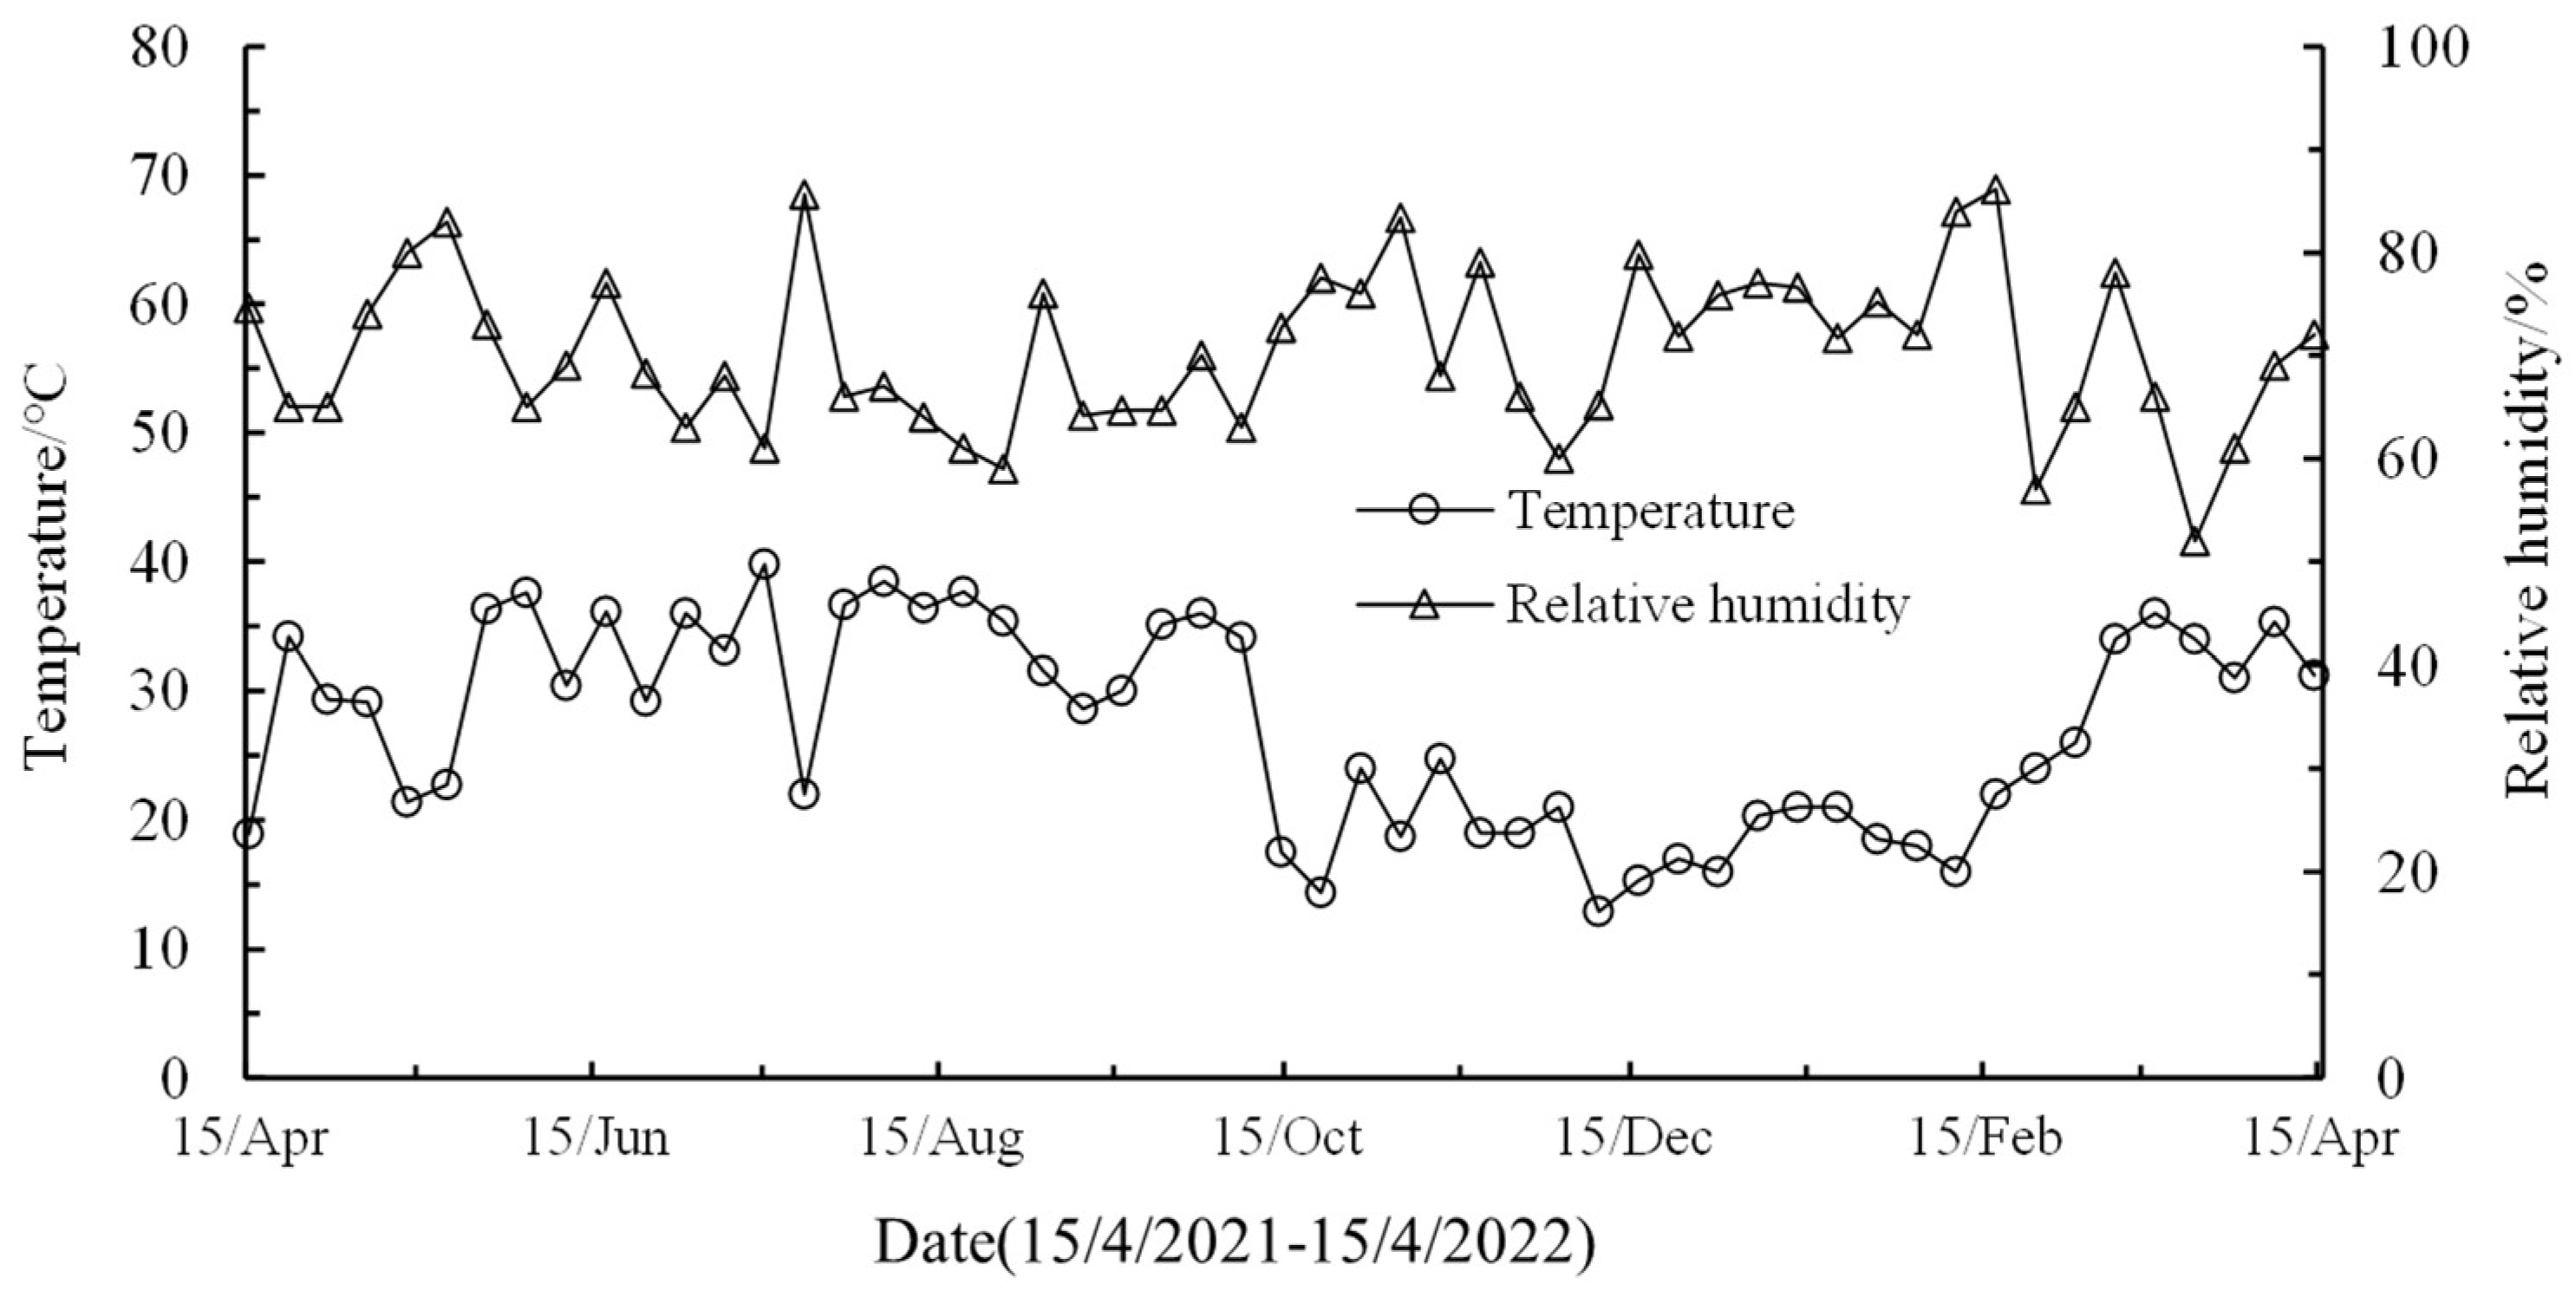
The changes in daily mean temperature and relative humidity during the monitoring period from April 2021 to April 2022 are shown in Figure 4. The highest daily mean temperature reached 41.3 °C, which occurred on 20 June 2021, and the lowest daily mean temperature was 12.7 °C, which occurred on 14 December 2021. The maximum relative humidity was 83.2%, which occurred on 17 July 2021, and the minimum relative humidity was 51.5%, which occurred on 17 March 2021. It can be seen from the change law of relative humidity and atmospheric temperature that they are negatively correlated. With the increase in daily average temperature, relative humidity decreases, obviously. During this period, the temperature in Nanning was basically stable at about 25 °C. Except for a few days when there was a small drop in temperature, the other times were relatively stable, and the relative humidity also fluctuated with the rise and fall of the temperature to a certain extent.
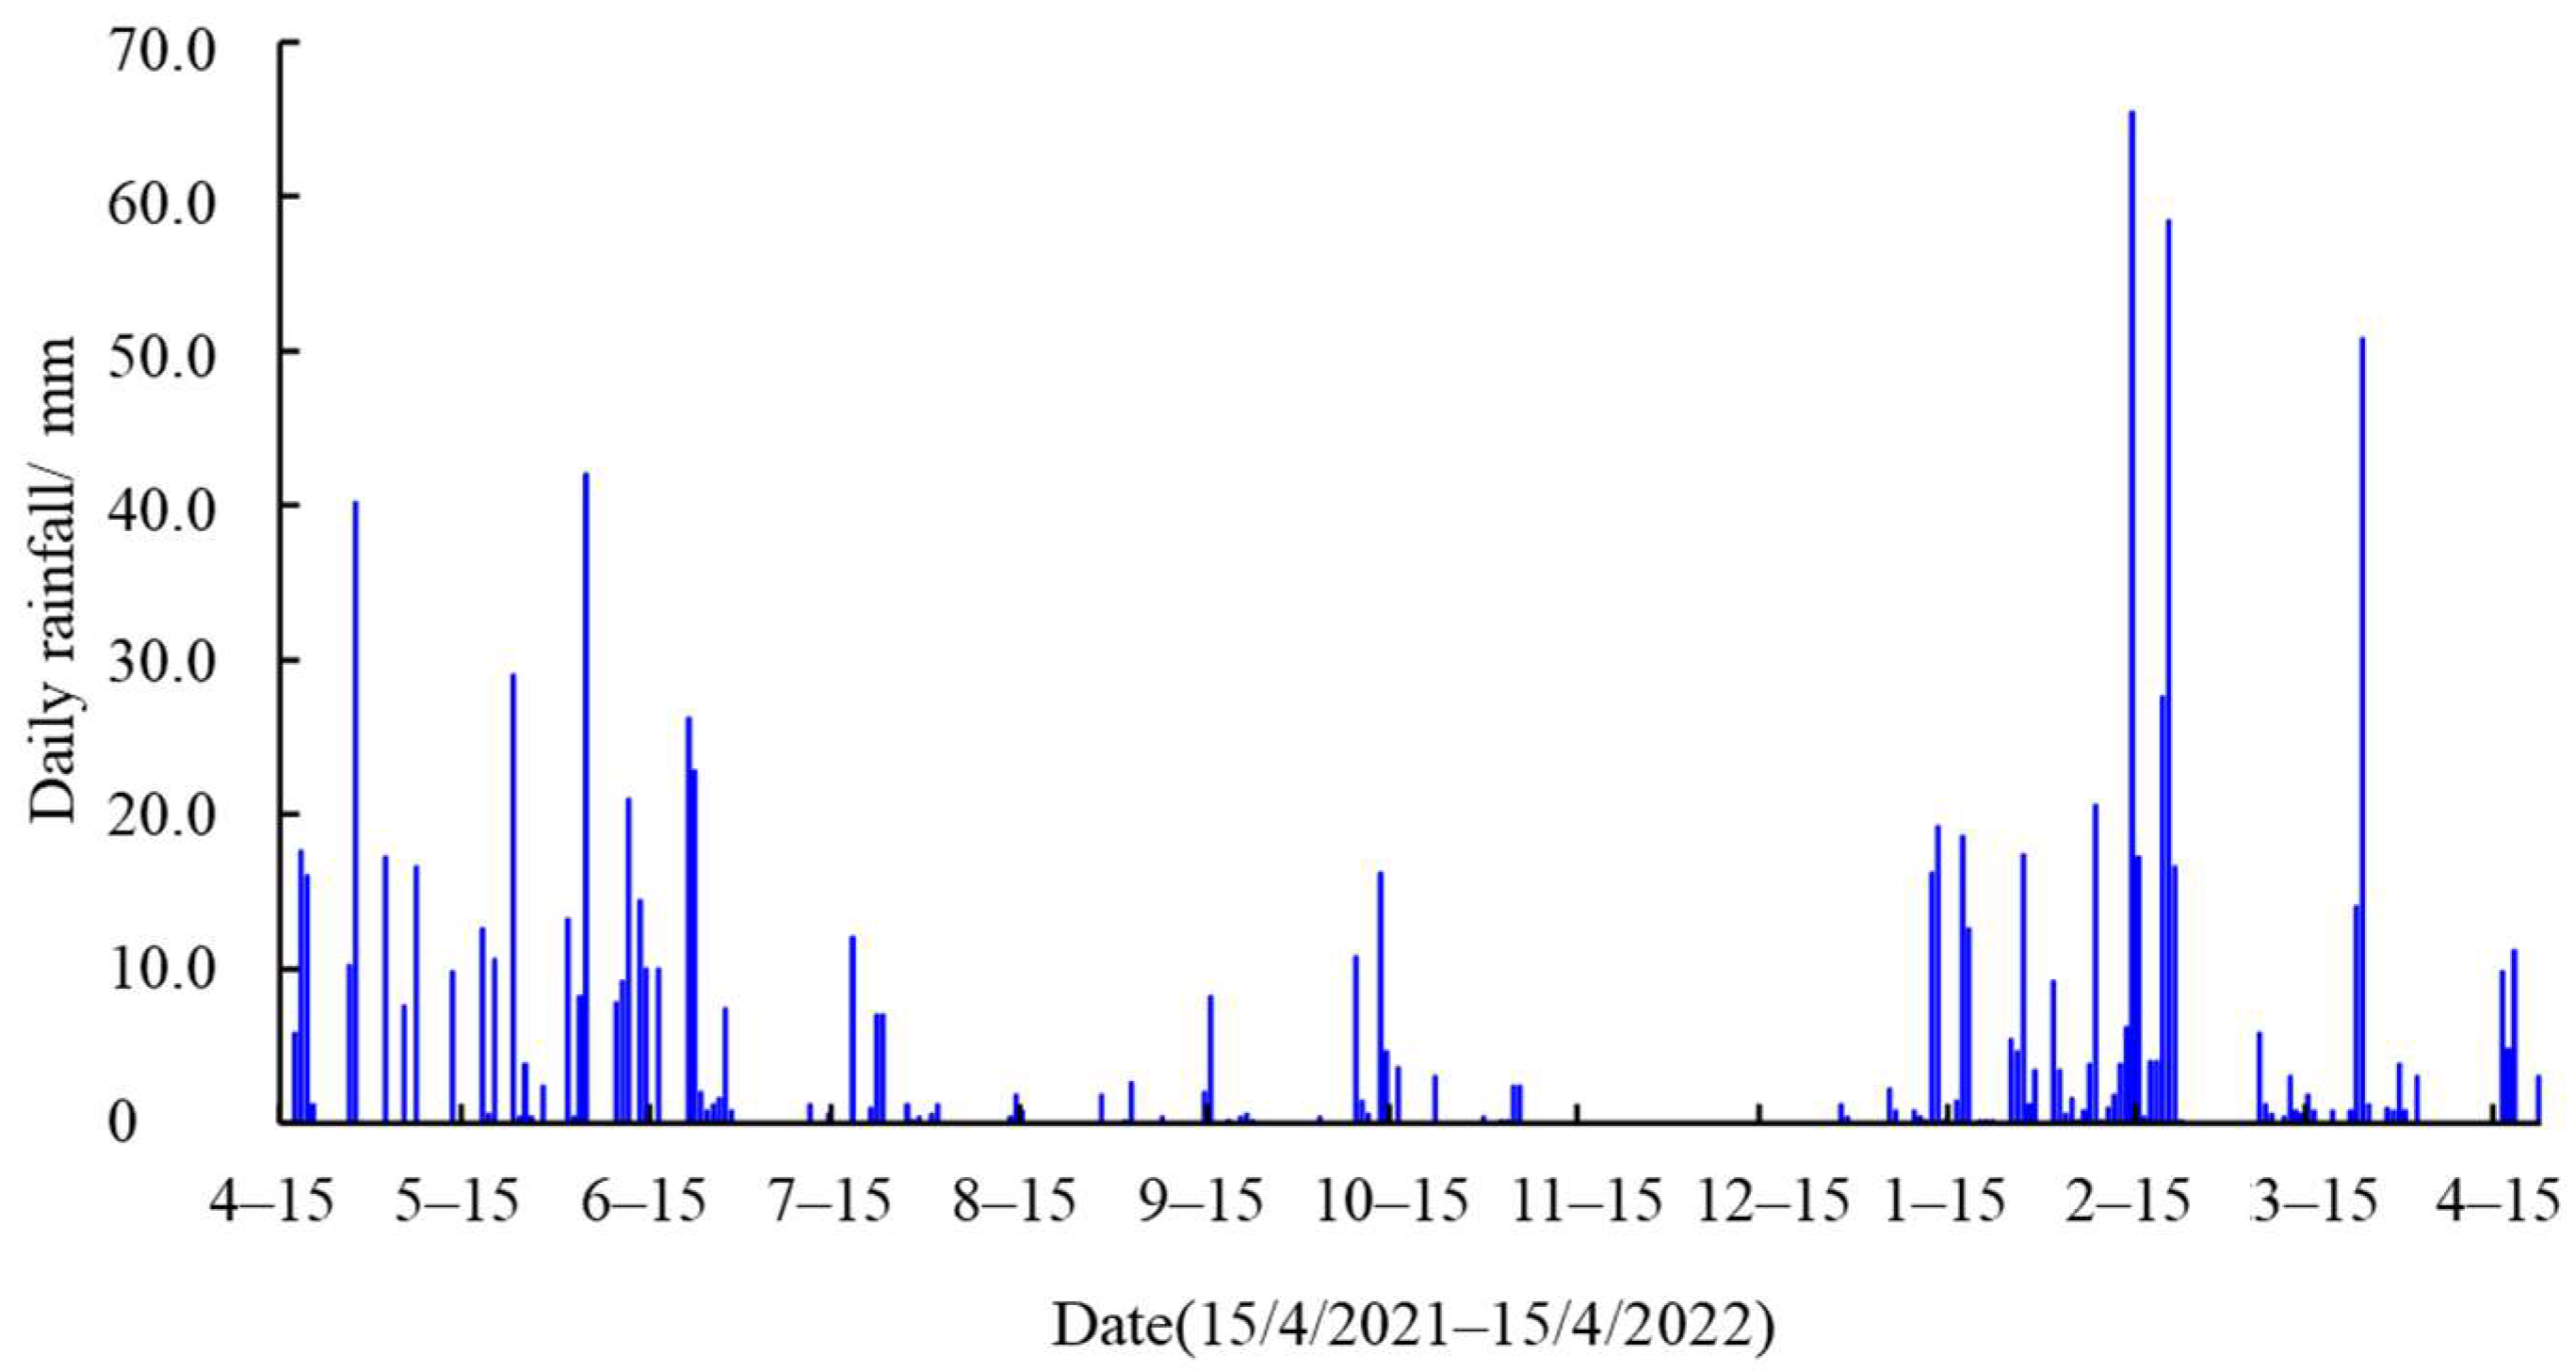
Monitoring during rain gauge to collect the total rainfall of the results as shown in Figure 5, 15 April 2021, to 15 April 2022 year the total rainfall of 1373.4 mm, monitoring of the slope is located in Guangxi Nanning municipal subtropical monsoon climate, the rainy season is mainly concentrated in the spring and summer, in the middle of January until the end of June the cumulative rainfall accounts for over 80% of the total rainfall. However, according to the meteorological data, from the end of July to the middle of October, Nanning has been dominated by sunny weather, rarely rainy, two and a half months of cumulative rainfall is only 72.4 mm, accounting for 5.3% of the total rainfall, seasonal wet and dry climate is significant.

3.2. Water Contents of the Reinforced Slope

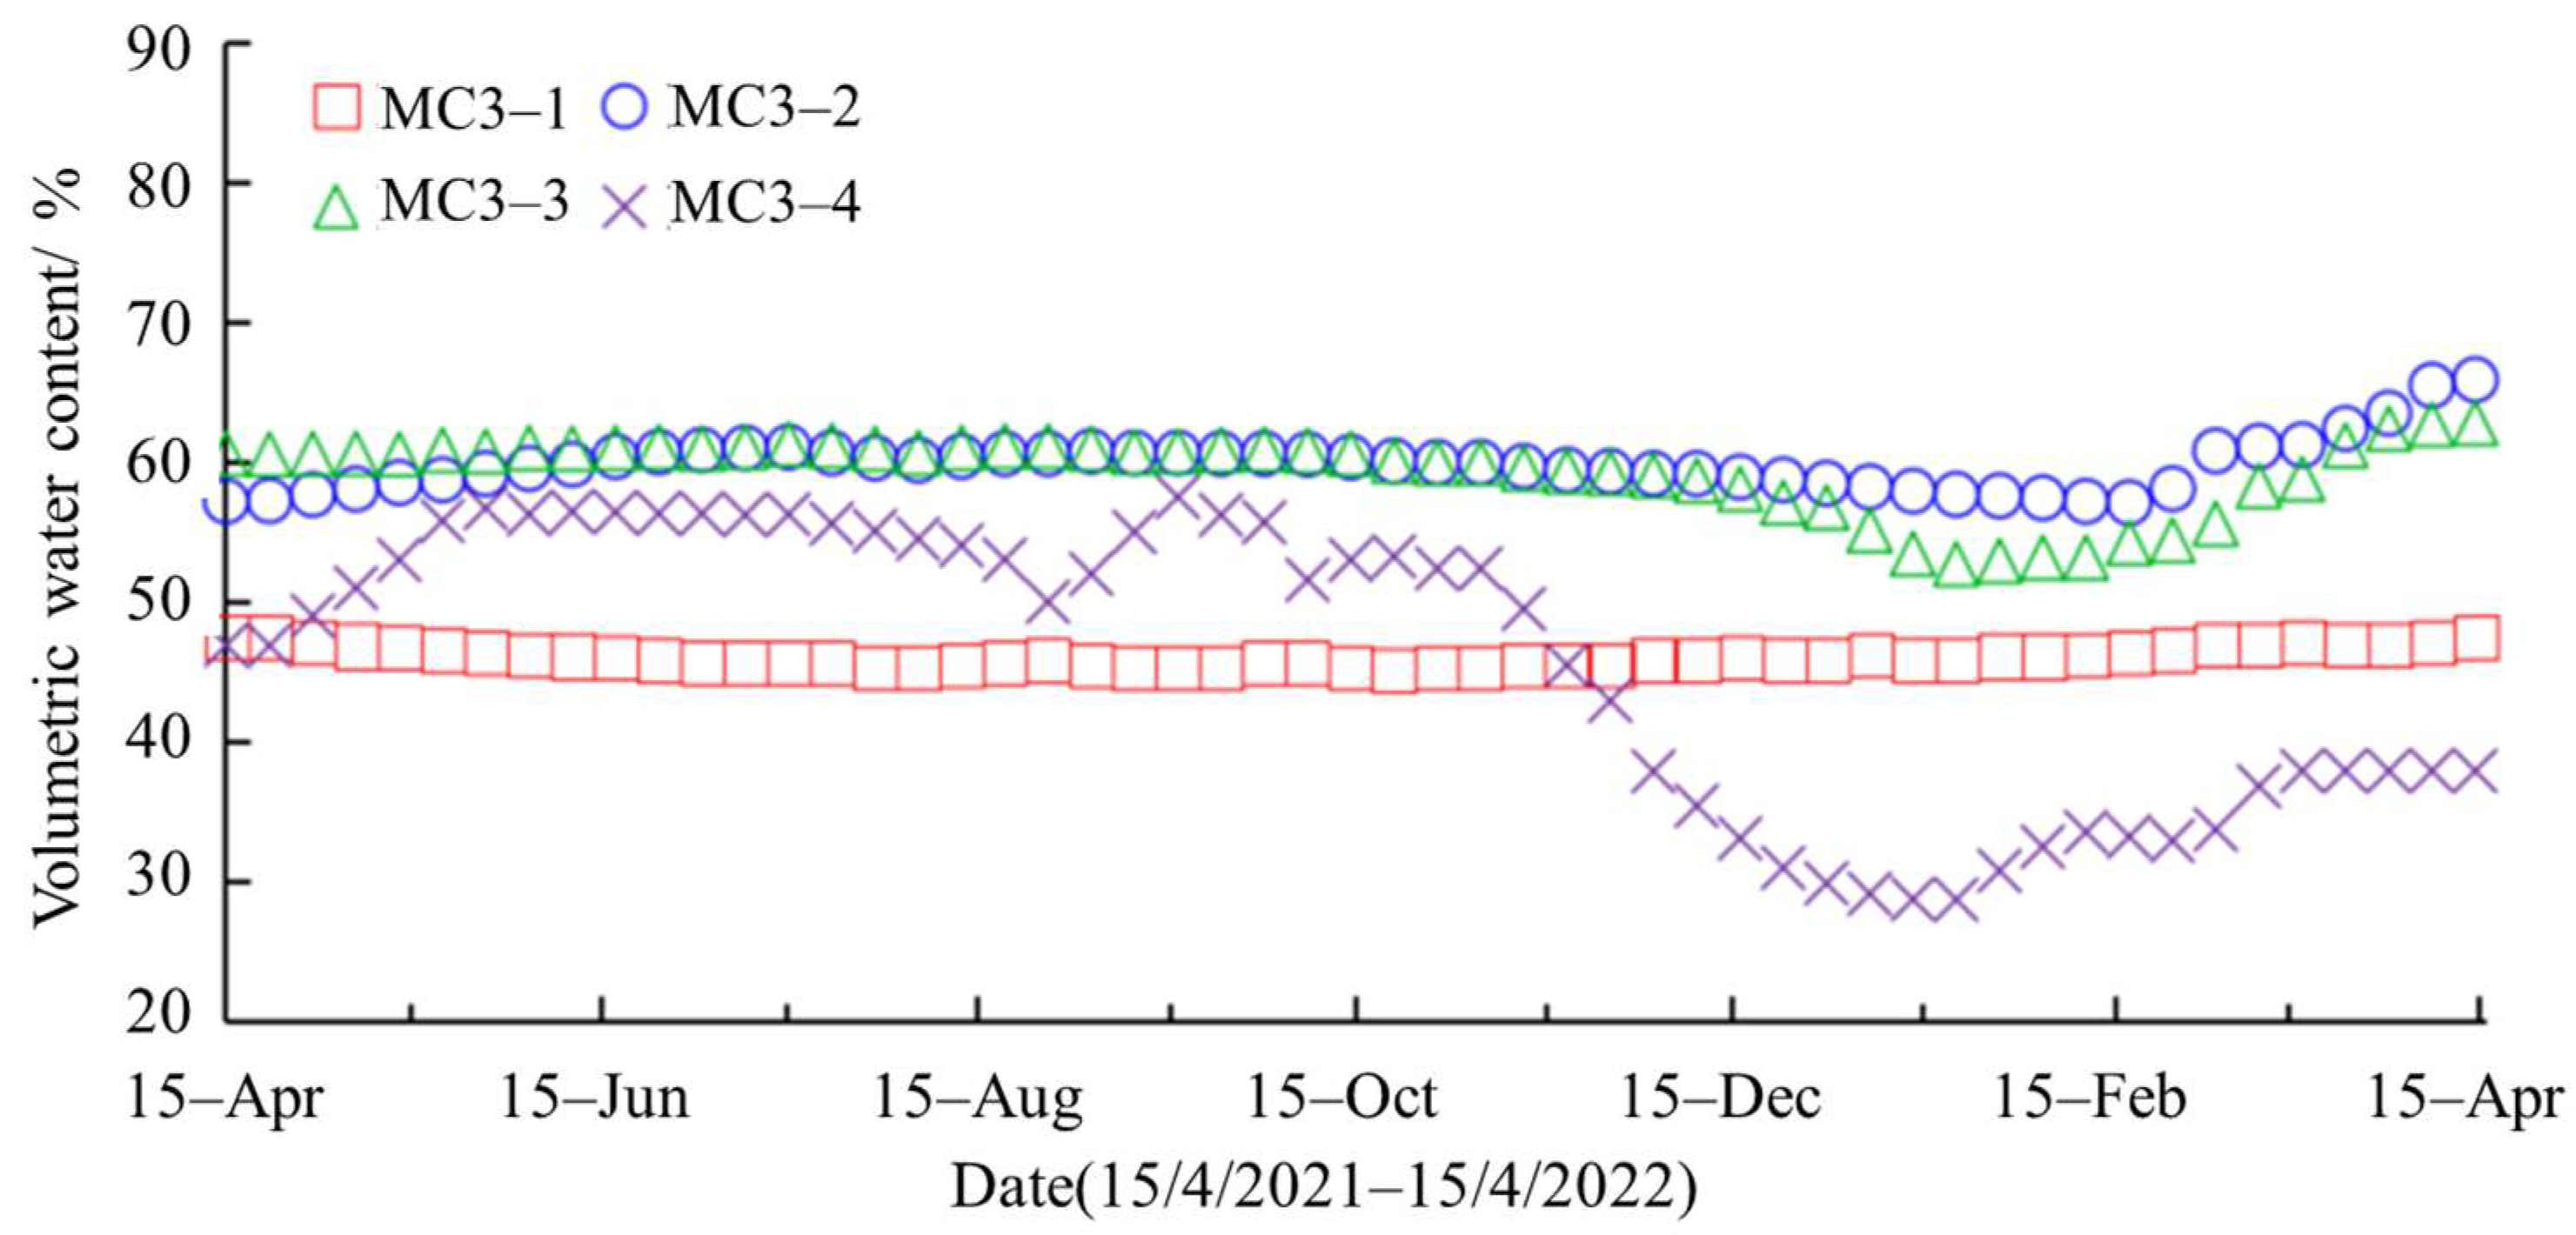
Figure 6, Figure 7 and Figure 8 respectively show the curves of volumetric water content with time obtained from twelve water content probes monitoring horizons I, II, and III. On the whole, all horizon sensor data are very stable most of the time, in addition to the affected by other factors such as heavy rainfall, close to the moisture content of the slope surface probe some mutations, other time the soil moisture content value is almost unchanged, in particular, every horizon near the slope inside two moisture content sensor, from beginning to end to keep near the initial moisture content. The image is approximately a horizontal straight line, which fully indicates that the soil in the anchorage zone is not affected by wetting and drying cycles. In addition, the data of the four water content probes wrapped in the middle layer II are very concentrated. The water content of the whole layer varies from 41% to 48%, which is much smaller than 10% to 63% of the first layer and 41% to 60% of the third layer, indicating that the soil in the middle layer is the least disturbed, which is the same as the actual situation.
In horizon I, the cause of the change of moisture content was obviously due to filling differences, leading to the initial moisture content and compaction degree, moisture content of the third probe data after the higher ranks, and synthetic comparison found that the third moisture content sensor and horizon III fourth moisture content sensor also had a small increase in this time; the reason is the front-end time continuous high-temperature weather, which lead to expansive soil surface cracks. On the same day, there was rain, which entered the slope along the cracks, leading to a sharp increase in Mc1-3 values. In addition, Mc3-4 also fluctuated greatly during the monitoring period. According to the preliminary analysis, it may be because this location is closest to the slope surface. At the beginning of the completion, the soil planting on the slope surface was too soft, and the heavy rainfall on that day caused the moisture content to decrease after the weather cleared.
The initial water contents of the soils on the monitoring planes I and II vary in the range of 48–62% and 46–65%, respectively. There is a difference of about 10% in the water content on each monitoring plane, but the initial water content of the two planes is very similar, which is caused by the difference in the initial water content and compactness of the filling in different positions. The analysis of probe data in different positions on the same monitoring plane shows that the soil of the two probes close to the slope surface maintains a high water content, and it takes a short time for rainfall to infiltrate into the slope and for evaporation of internal water during drying, which is affected by the atmosphere and sensitive to rainfall. For the two probes far away from the slope surface, the influence of the atmosphere is weak, the response to rainfall lags behind, and the soil water content is relatively small and changes gently.

3.3. Stresses of the Reinforced Slope

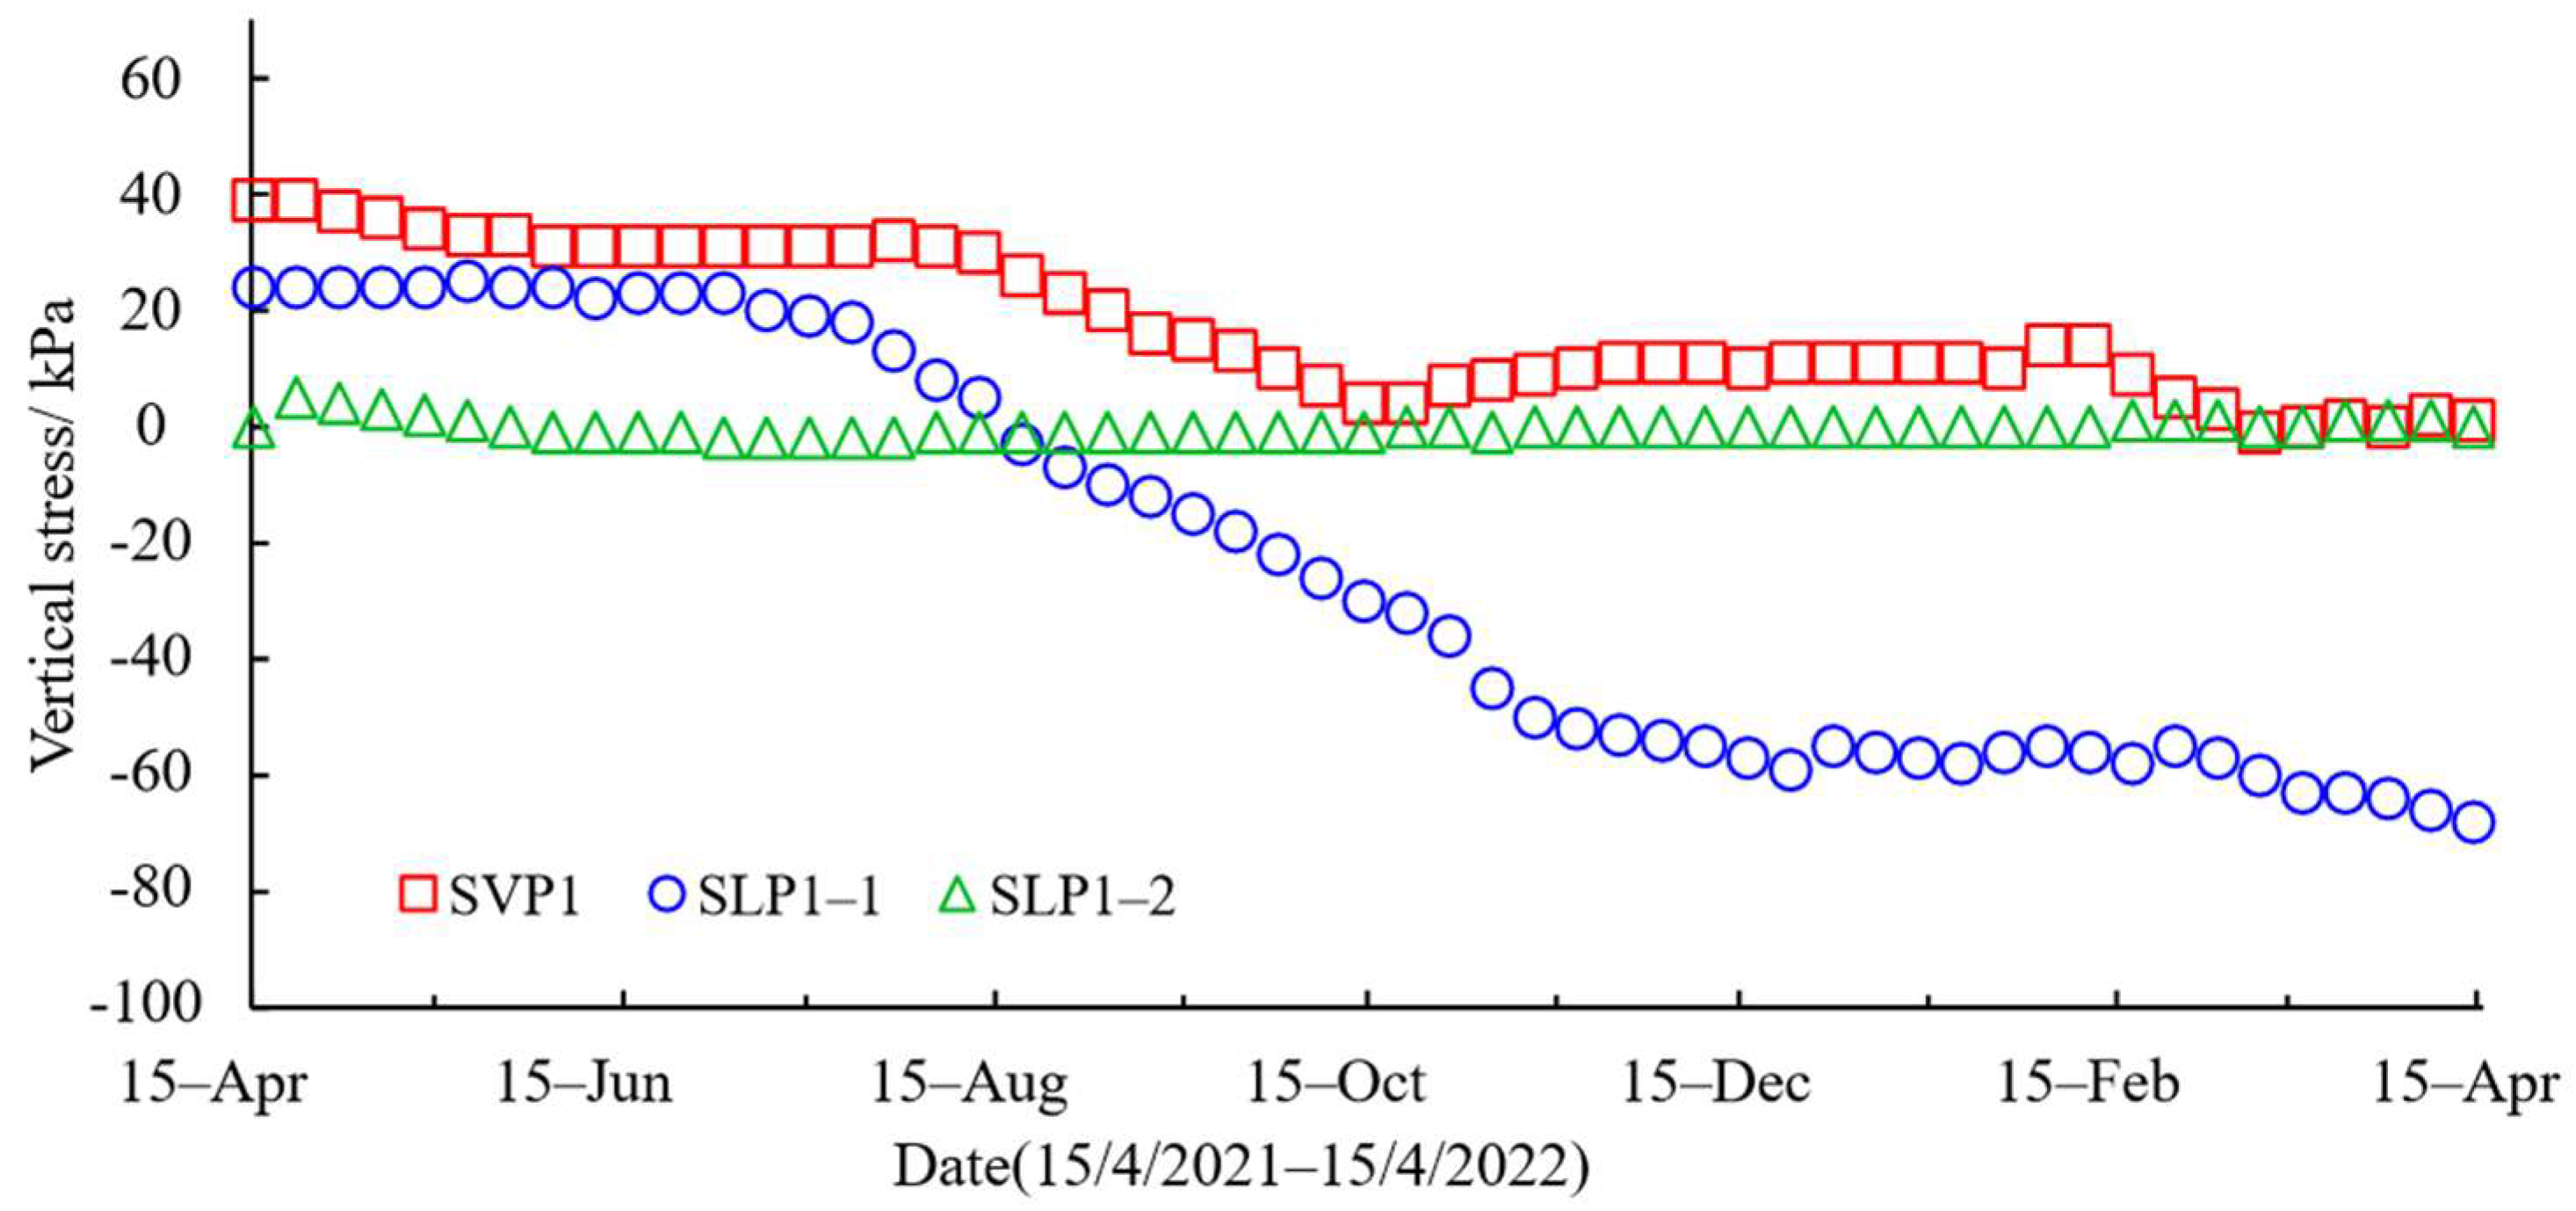
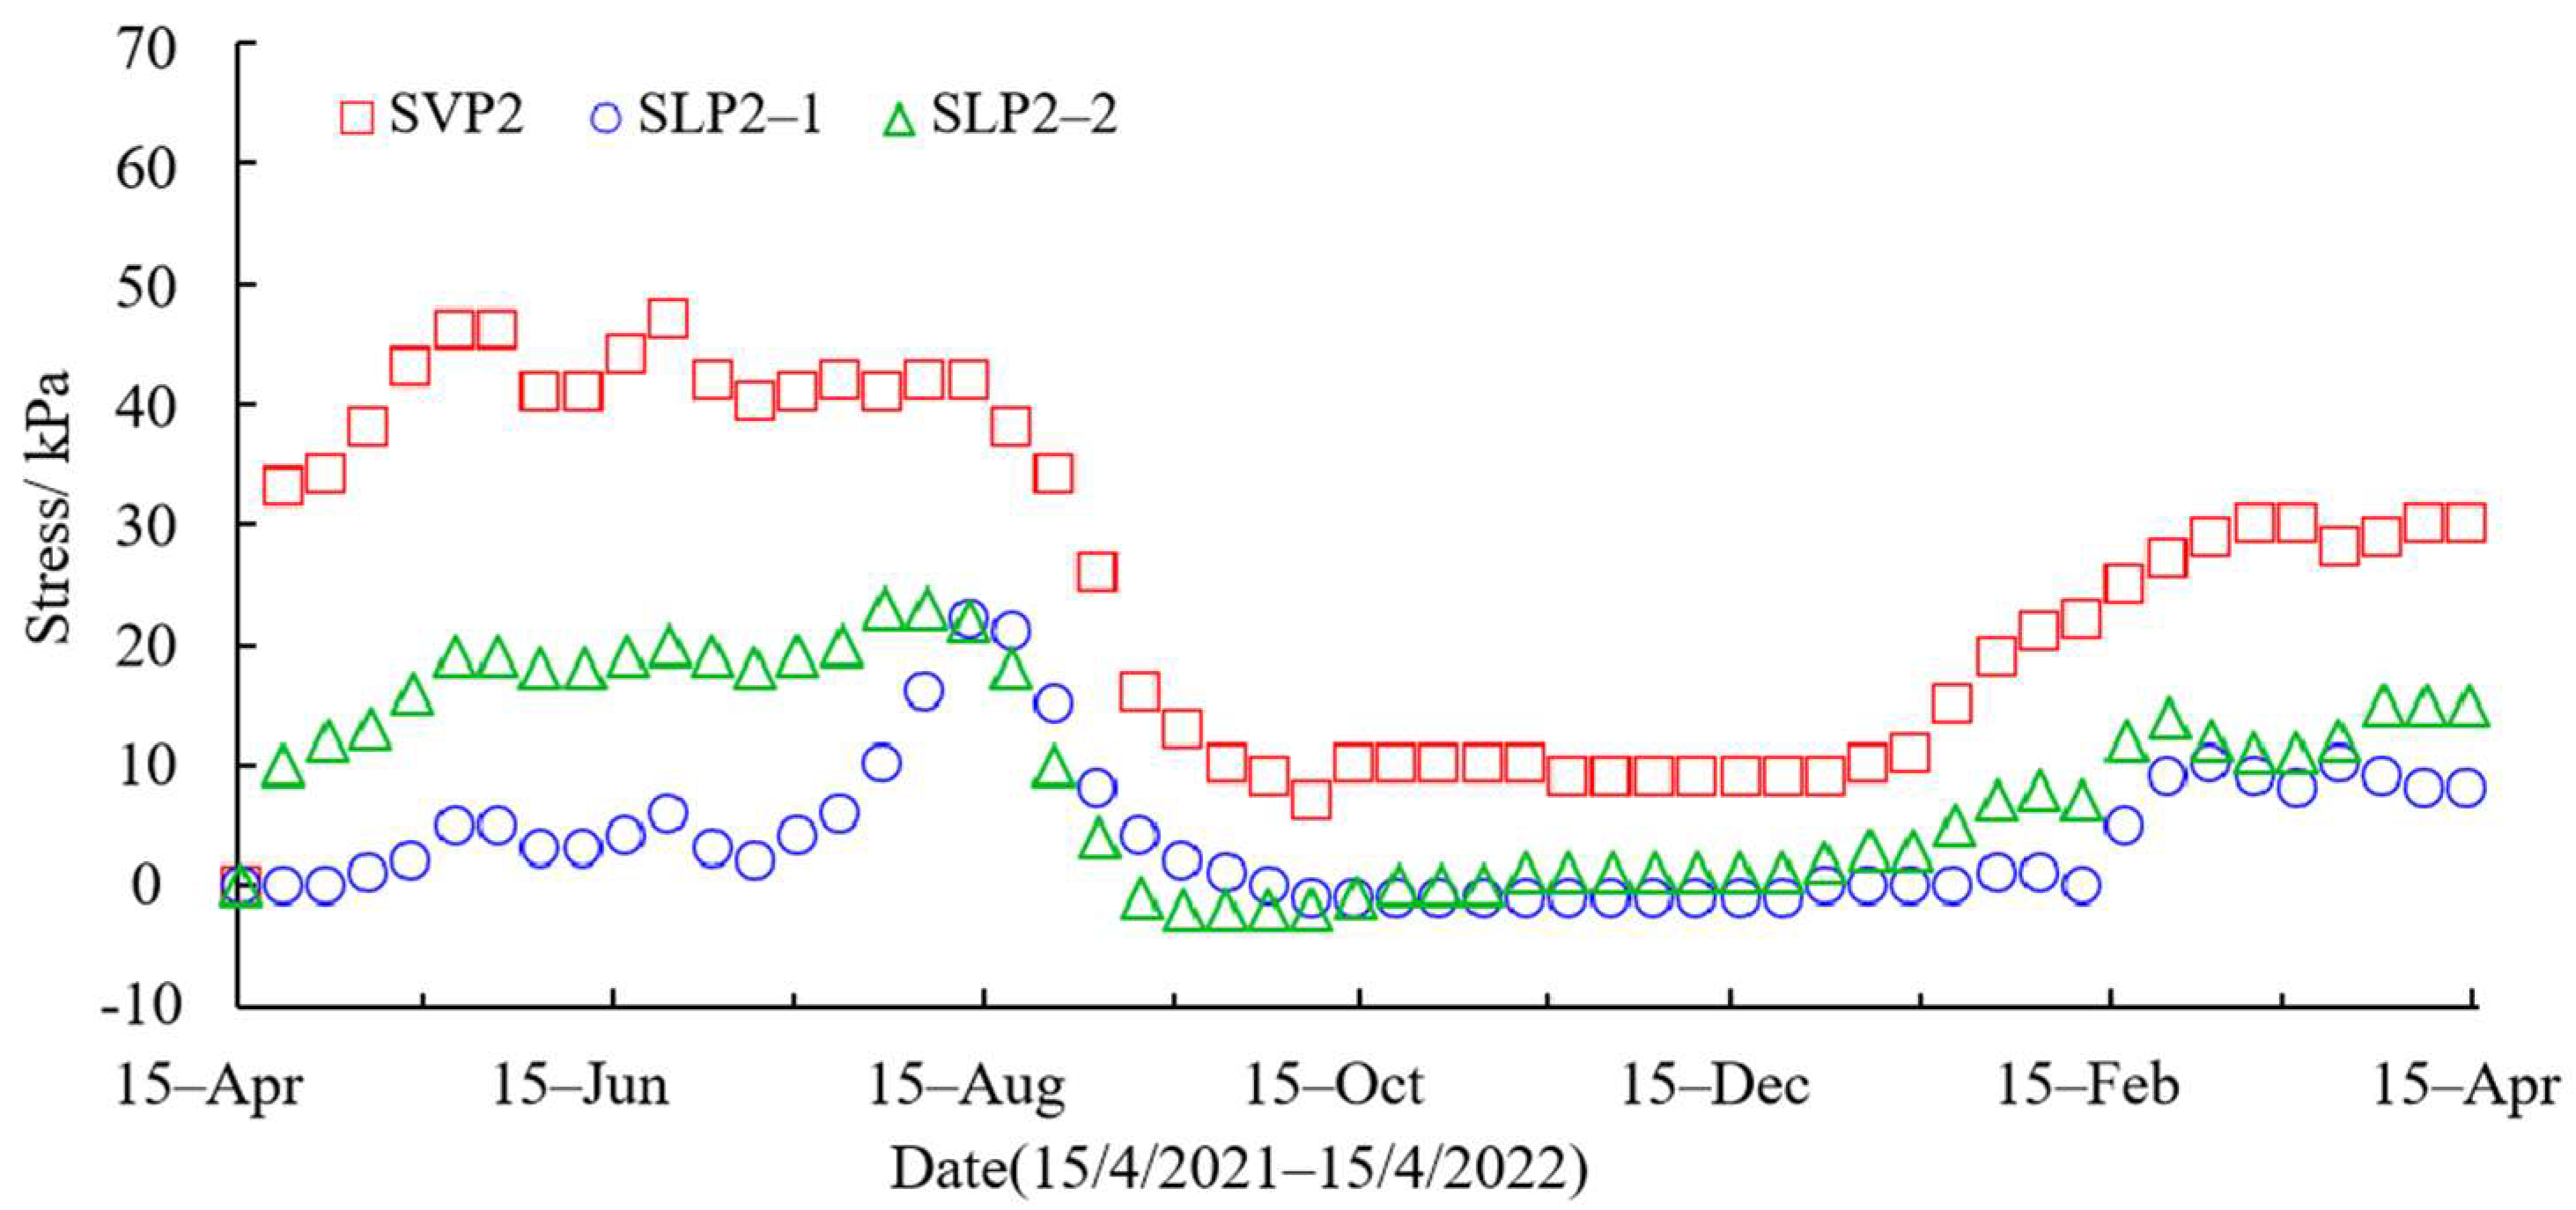
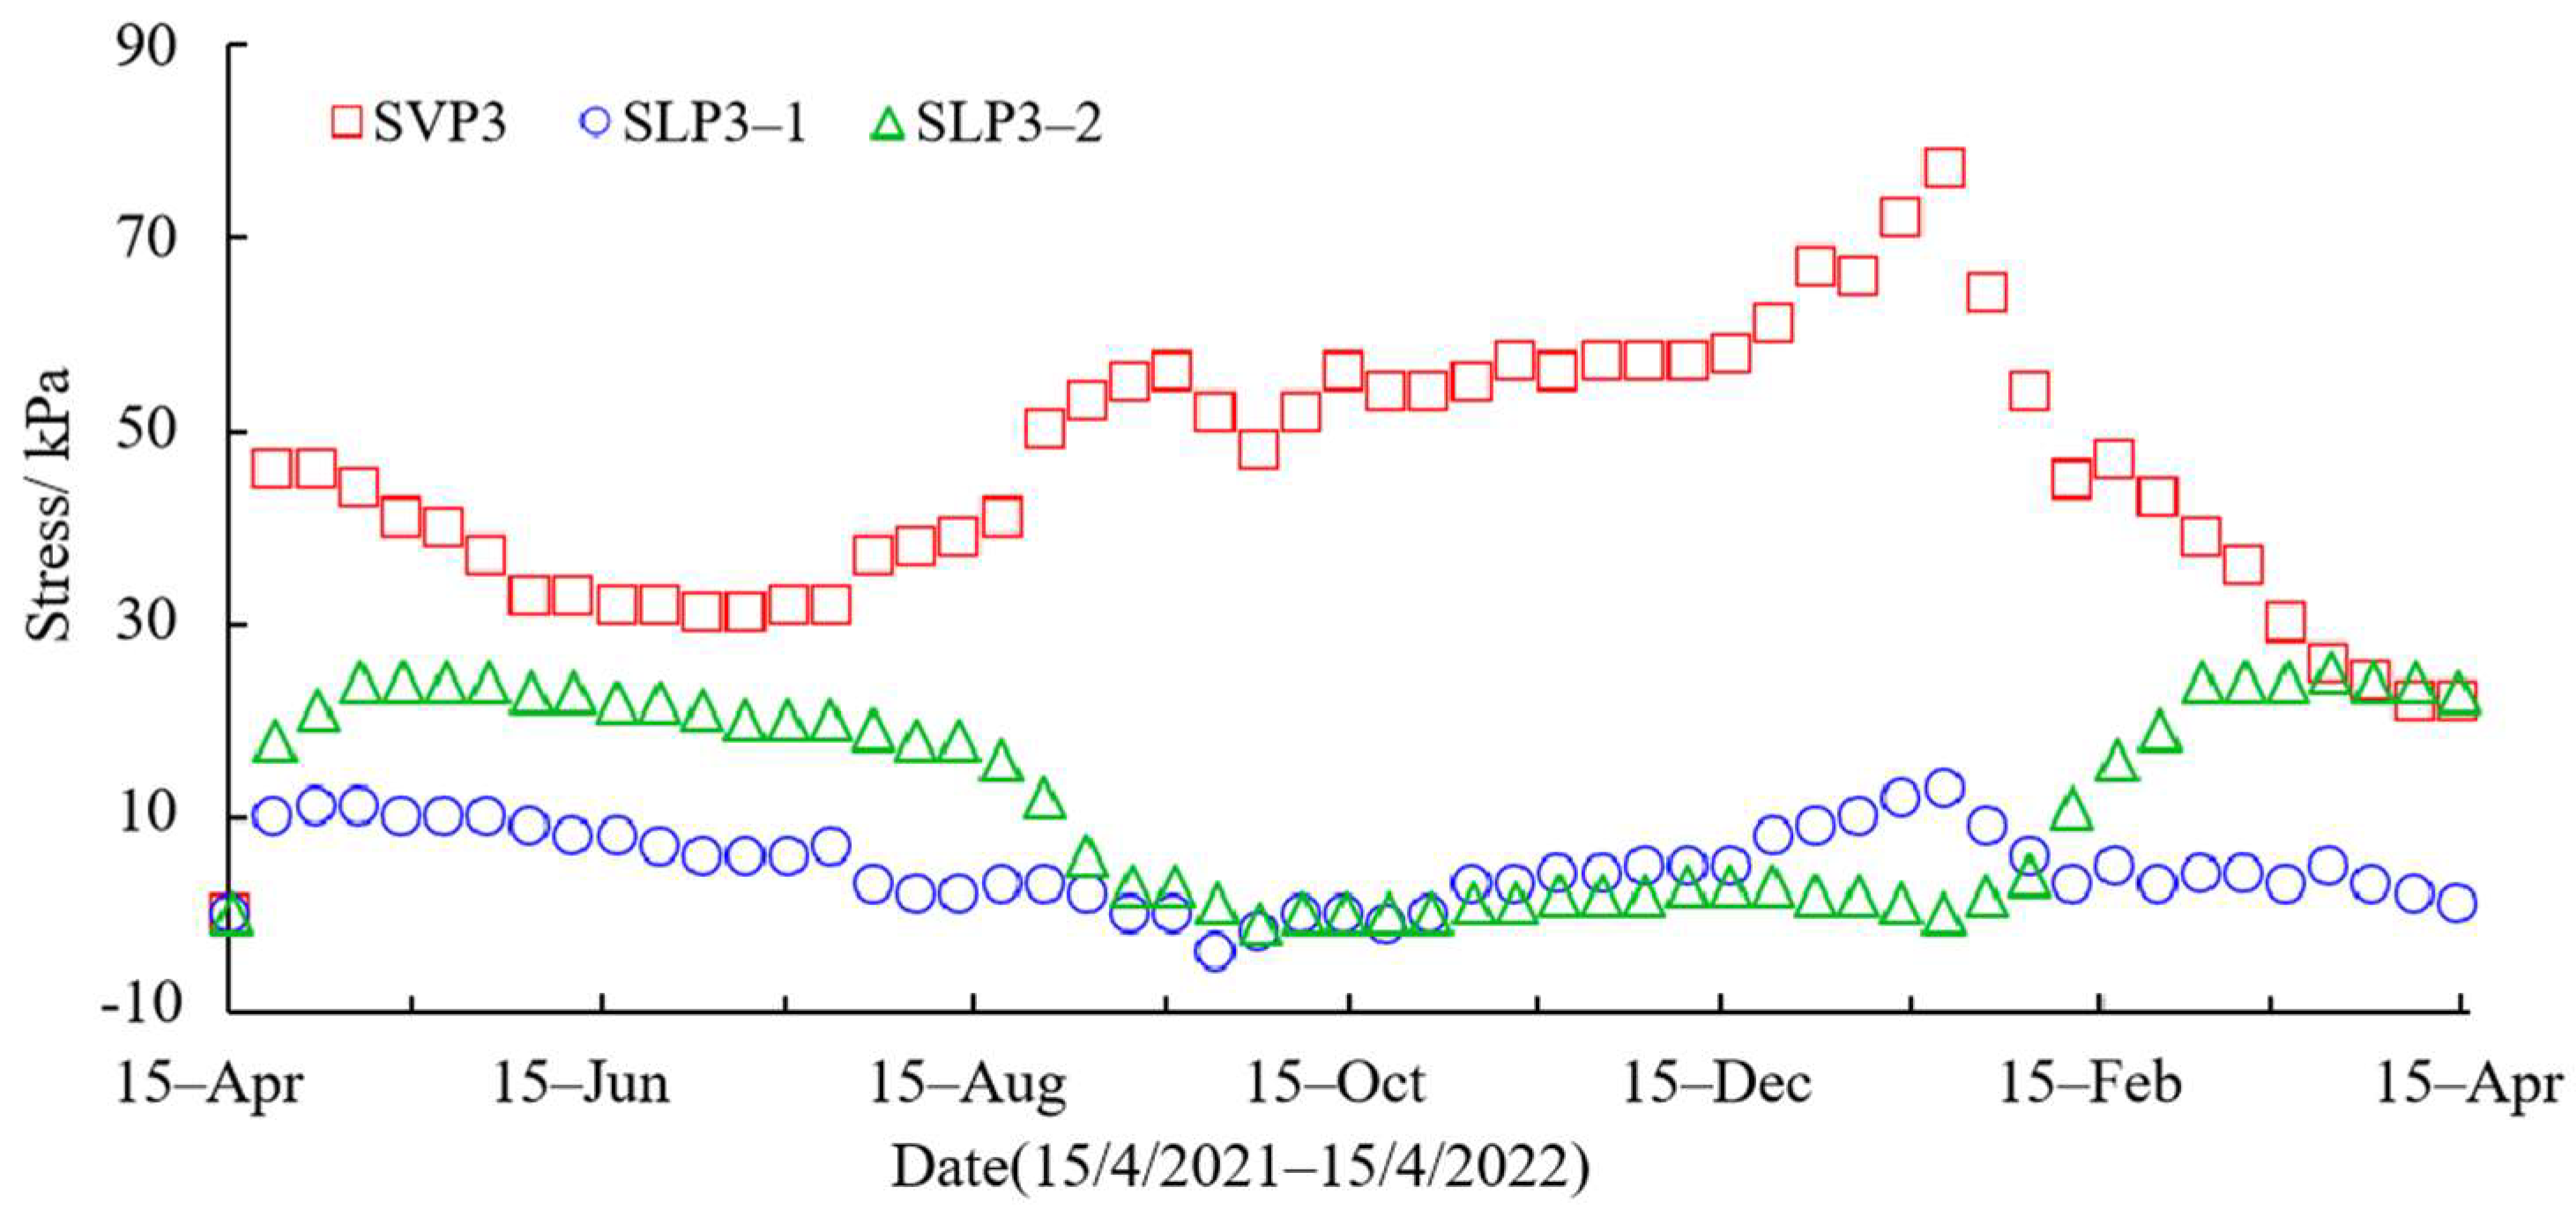
The soil near the two measuring points on the slope expands in water absorption and compresses the circular side of the vertical earth pressure cell, resulting in the tension of the cell, and the vertical stress decreases slightly. As rainy seasons arrived, rainwater infiltrated into the soil and gradually increased soil weight. Since the geogrid plays a lateral restraint role, the vertical stress begins to climb, and the response near the slope measurement point is faster, reaching the peak in mid-April. The response of measured points near the slope surface is obviously delayed, and the vertical stress increases slowly until the peak in early June. The lateral earth pressures at the three monitoring points increased significantly after the rainy season, which is mainly caused by the moisture absorption of expansive soil. The lateral swelling pressure went on declining with the tensile deformation of geogrid until the restraint force provided by geogrid was in equilibrium with the lateral earth pressure, at which the geogrid strain reached its peak. The slope goes through the dry and wet cycle repeatedly, and the soil keeps dry-shrinking and wet-swelling. The variation of expansive lateral pressure is the main factor leading to the variation of lateral earth pressure, but the change in soil pressure at the monitoring point near the slope surface is the most significant. The soil that is far from the slope surface has a longer rainfall infiltration path and a lower infiltration rate, and the change of soil stress at measured points is relatively small after rainfall.
The comparison of stresses on different monitoring planes shows that the horizontal stress changes with time in the two planes in a similar way, with a sharp climb to the peak after 2020. The peak values of the three measuring points are 38, 25, and 15 kPa, respectively, and the values of the measuring points near the slope surface are the smallest. The reason is that the soil at this point has already absorbed water and expanded and deformed before the arrival of the rainy season, while the geogrid is not fully stretched and does not provide lateral restraints. The swelling potential of the shallow soil is released in advance and not expressed in the form of swelling pressure. All the measuring points of layer II showed negative values under light rainfall, and the measuring points nearest to the slope showed more obvious negative values, which further indicated that some geogrid was stretched, leading to the tension of the earth pressure cell. With the further development of swelling deformation, the gratings entered the working state. It shows that in the process of reinforcement construction, fully stretching the geogrid is beneficial for the geogrid to enter the tensile state in advance so that the reinforcement soil can reach the equilibrium state as soon as possible. In this situation, soil stress can be redistributed to avoid sizeable swelling deformation of slope soil, which leads to the further swelling of the influence range of the atmospheric dry–wet cycles (Figure 9, Figure 10 and Figure 11).

3.4. Strains of Geogrids in the Reinforced Slope

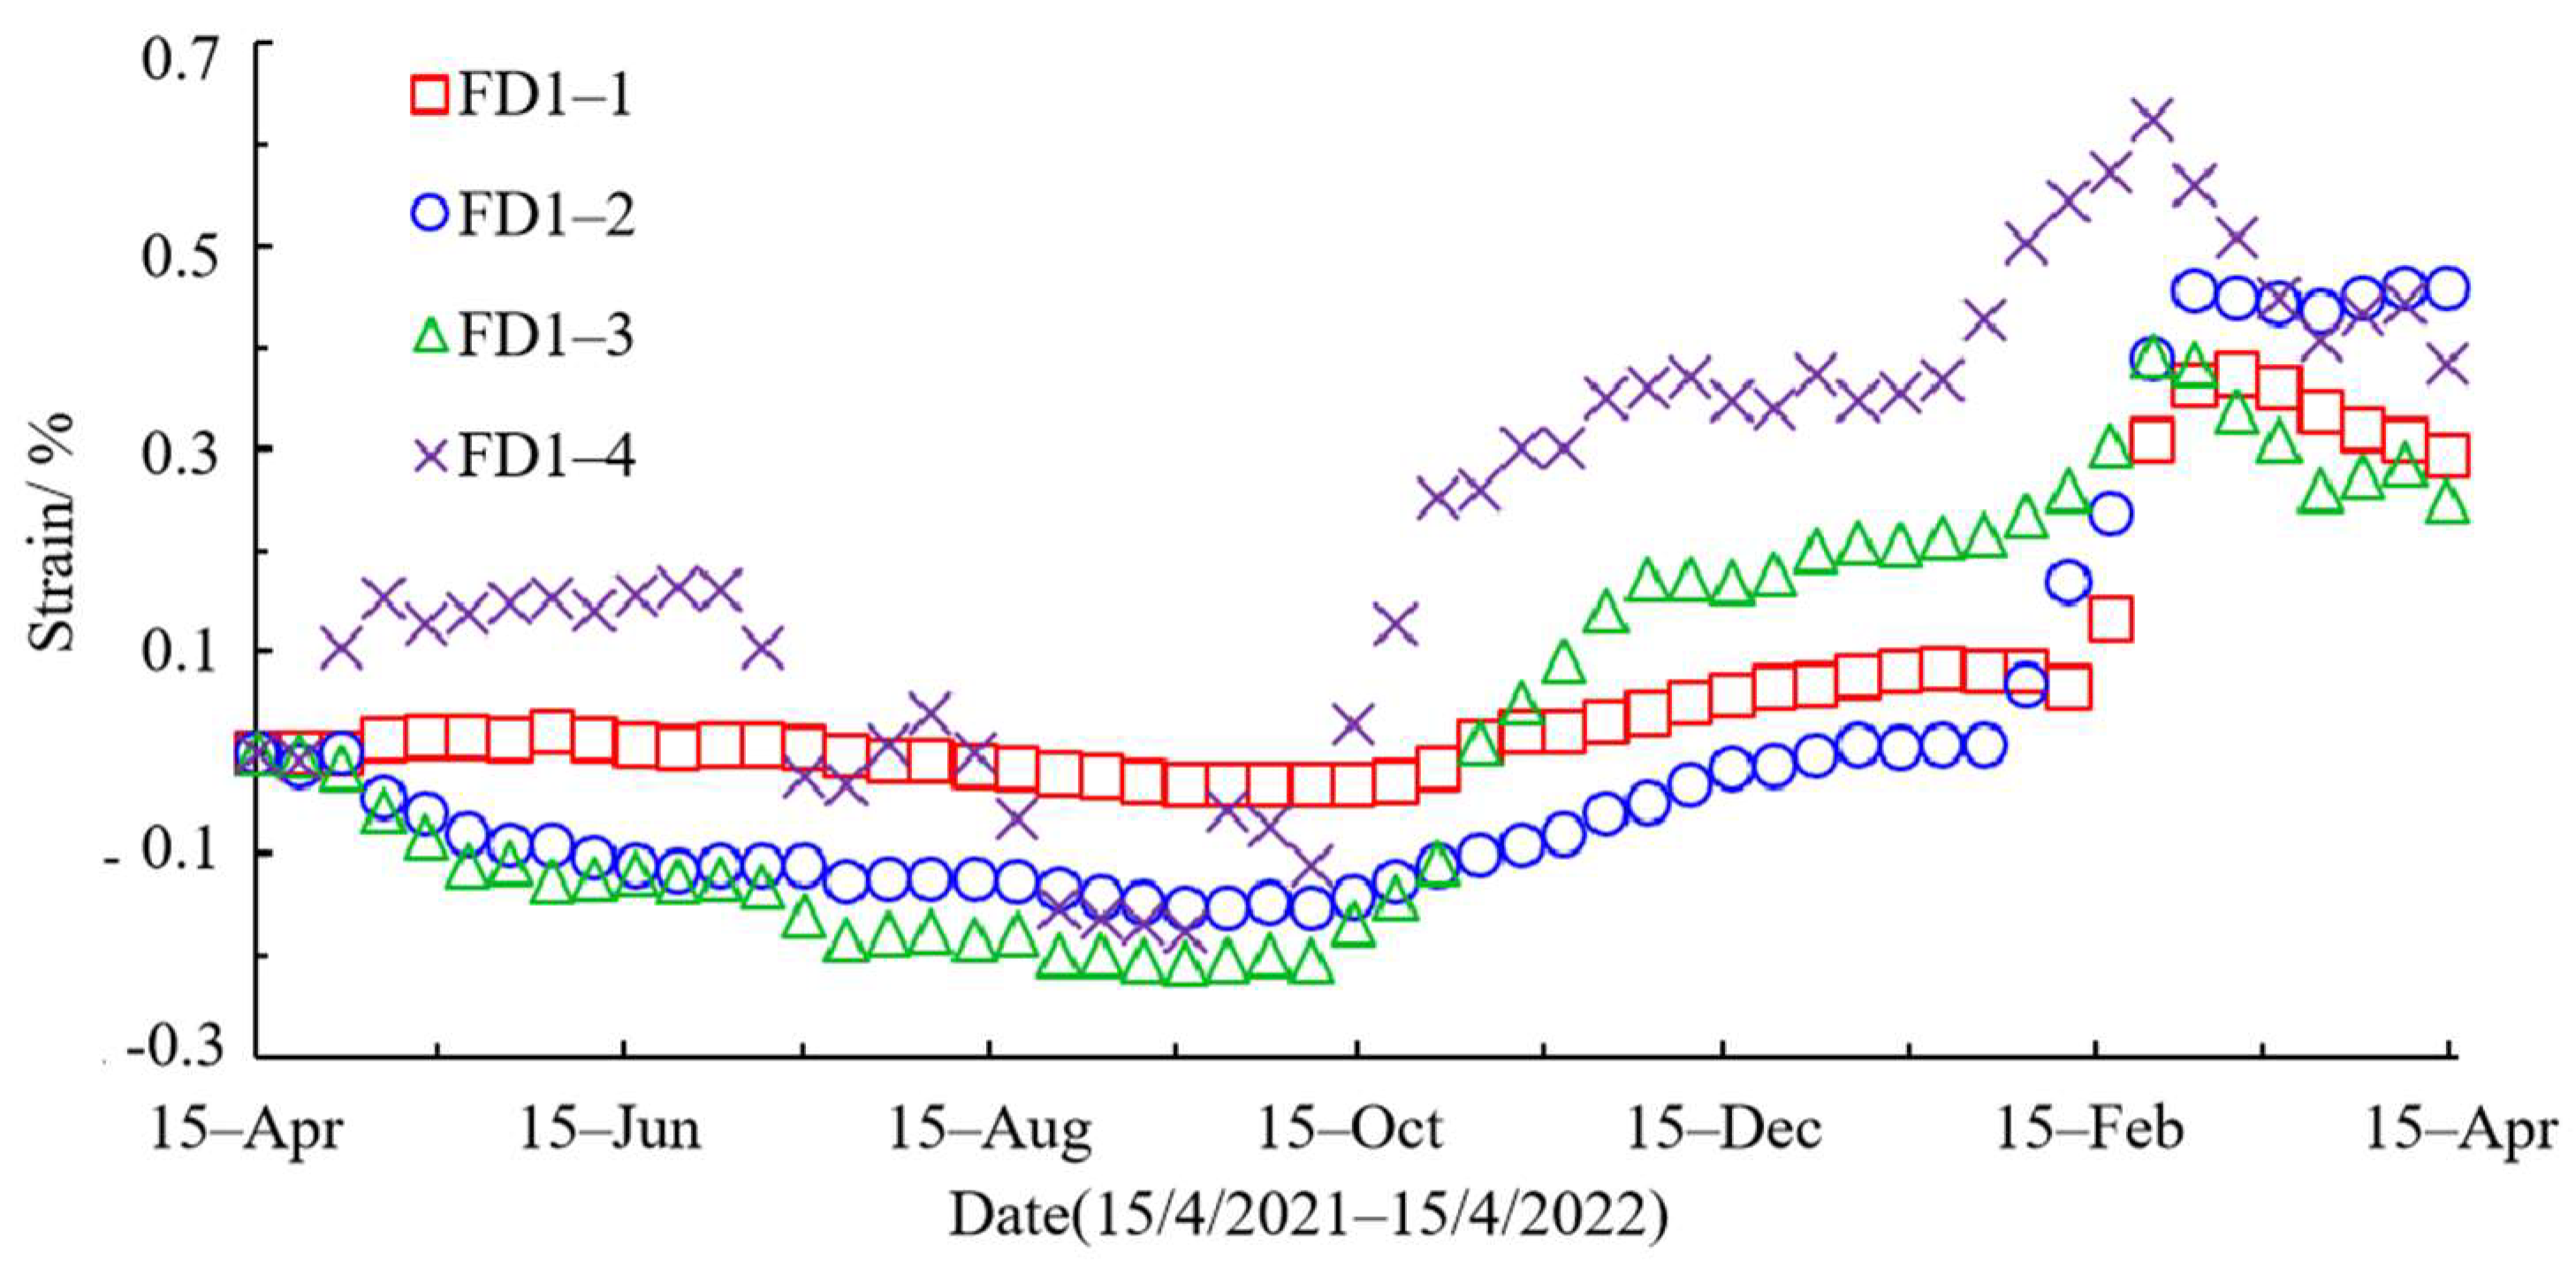
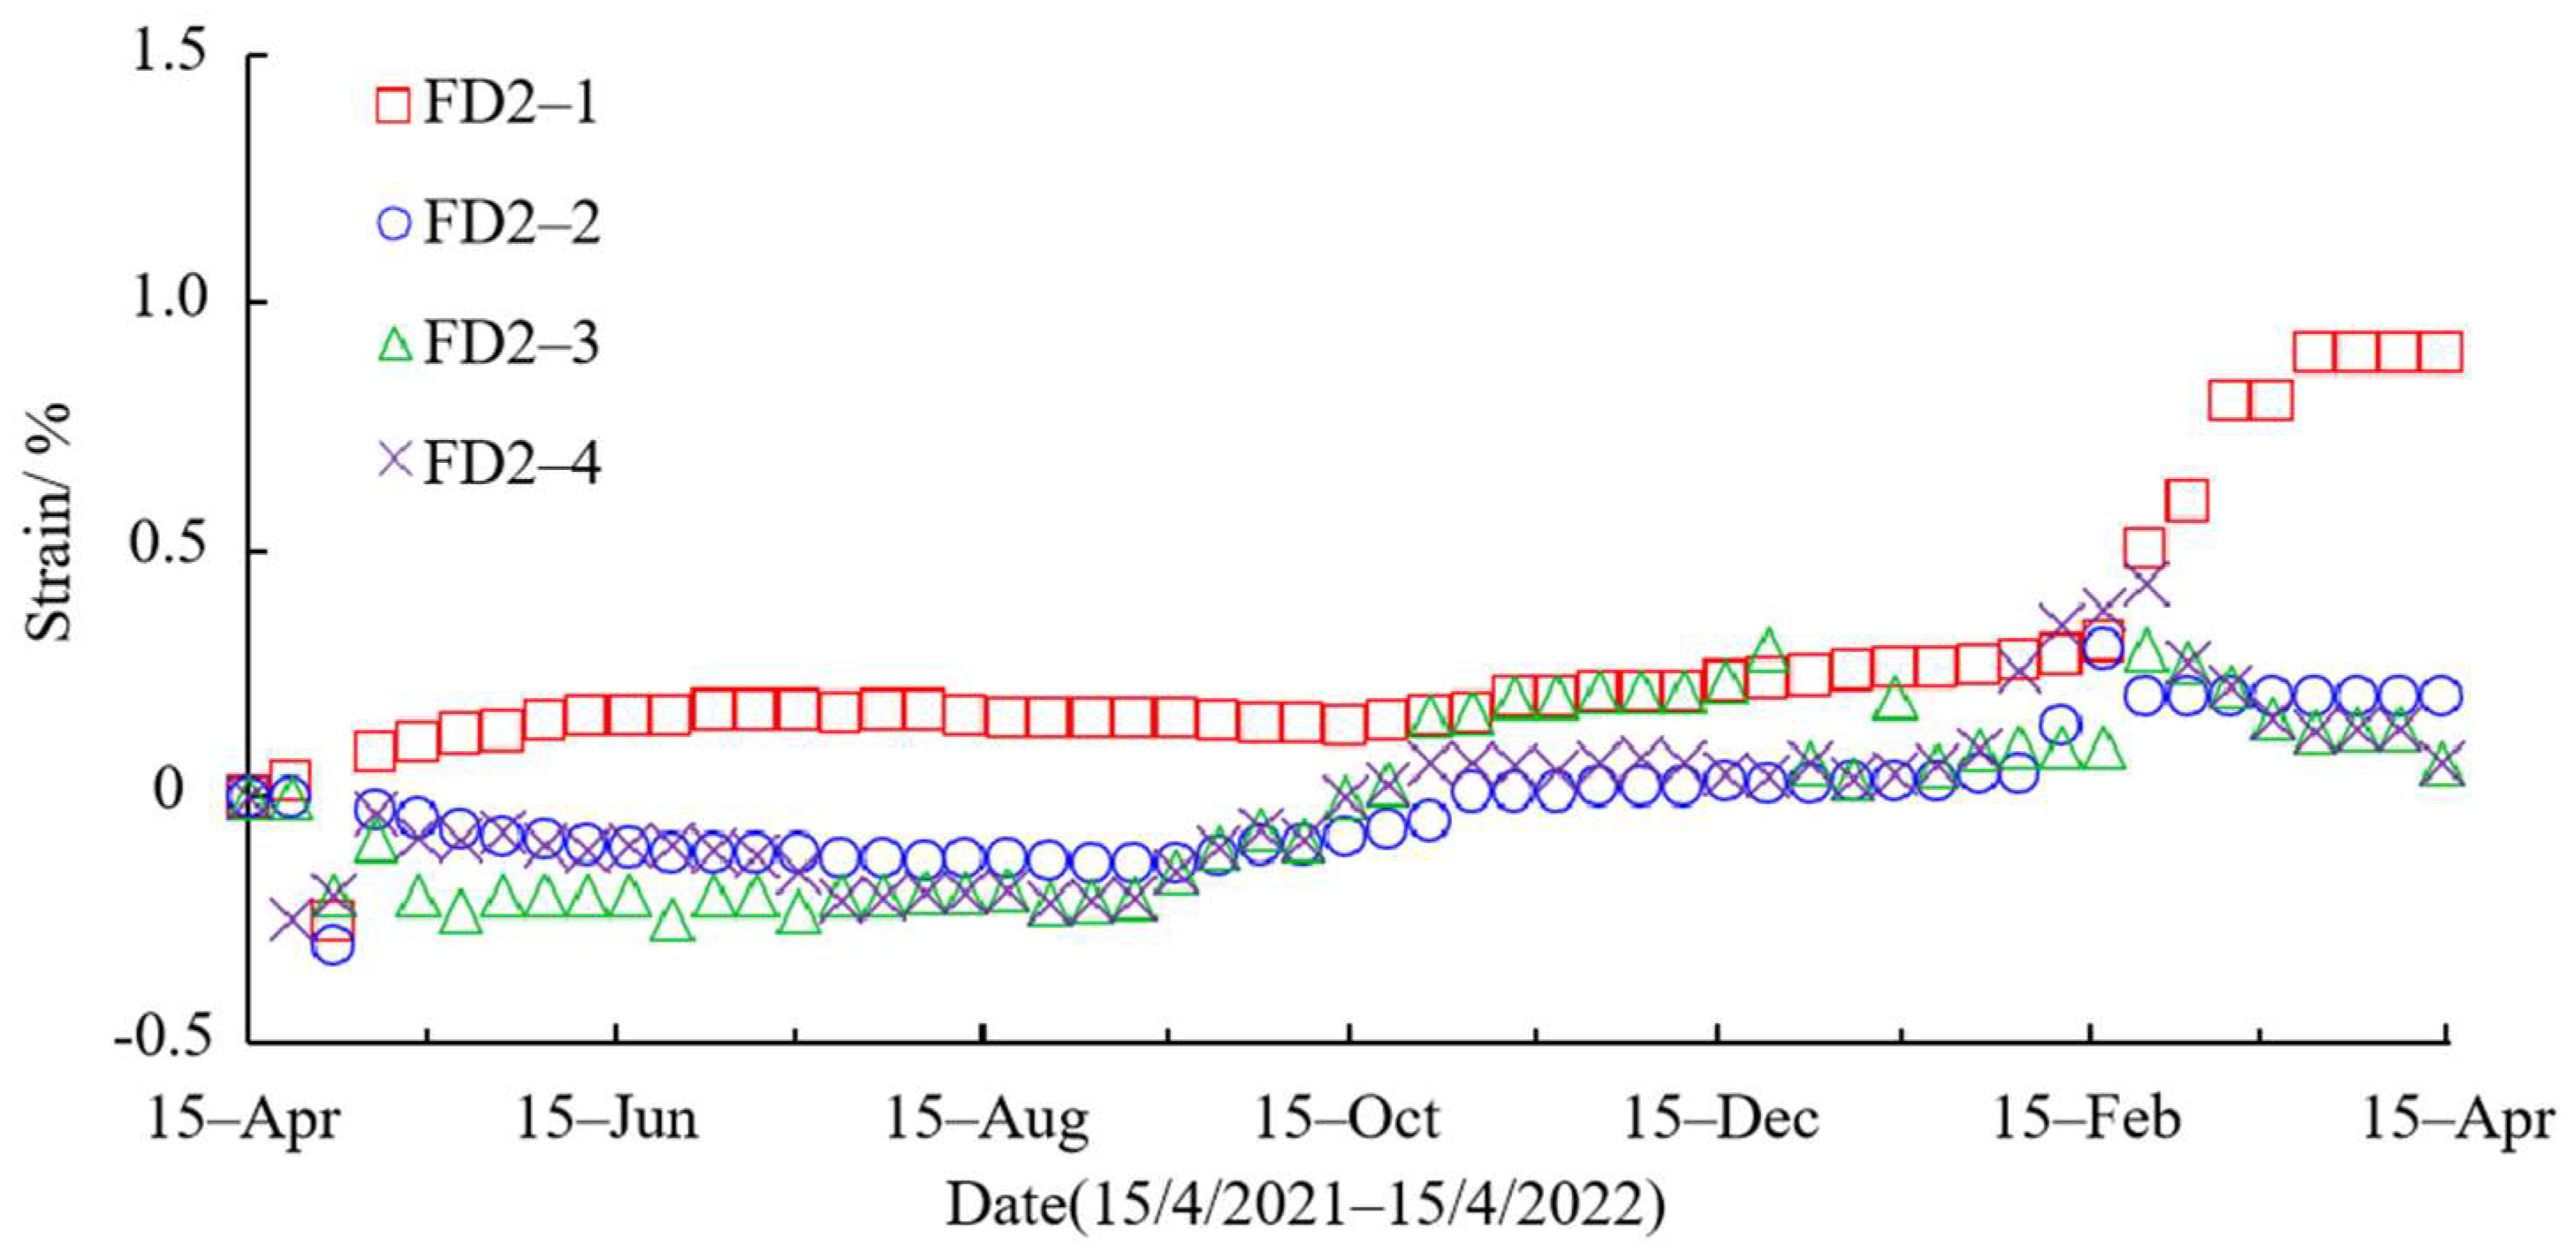
Figure 12, Figure 13 and Figure 14 respectively show the time-dependent variation curves of geogrid strain obtained by monitoring horizon I, II, and III flexible displacement meters. The maximum strain values of the geogrid at monitored layers I, II, and III are 0.22%, 0.69%, and 0.23%, respectively, which are far less than the ultimate tensile strain value of the geogrid by 8%, indicating that the geogrid is in normal working condition and the tension is far less than the designed tensile strength. The maximum strain value of each layer geogrid appears on the nearest measuring point to the slope surface, and the peak value of this measuring point is the earliest compared with other measuring points in the same layer and is significantly larger than the peak value of other measuring points in the same layer. This indicates that the depth of atmospheric influence is from shallow to deep, and the soil closer to the slope is more affected by the wetting and drying cycle, and the water slowly infiltrates from the slope to the slope. The moisture content of the soil near the slope changes first, and the soil swelling and deformation occur first, resulting in the earliest peak strain of the geogrid. Due to the small overburden of the nearest measuring point near the slope, it is not enough to suppress the swelling deformation of expansive soil, so the peak strain value of the measuring point geogrid is obviously larger than that of other measuring points in the same layer.
Monitor horizon I, III grille over time to create a common feature, the most flexible displacement meter near the slope surface is stretched, the inside of the other three appear negative retraction, the outermost layer soil due to prolonged rainfall infiltration process things quickly swell, geogrid tensile strain continues to grow, causing layer soil by extrusion, The geogrid tensile strain has a negative growth trend. In addition, under the influence of heavy rainfall at the end of April, the soil mass expanded, and the grille strain increased from −0.04% to 0.14%. Then, under the continuous high temperature in July, the soil mass contracted seriously, and the strain appeared to cliff-like slide, which again indicated that the grille strain was closely related to the rainfall.
In addition, as monitoring plane III is closest to the crest of the slope, the water content increases greatly with the acceleration of rainfall infiltration after the rainy season. The geogrid strains of all measuring points in this plane increased rapidly, and the strain peaks of each measuring point are also larger than those of other measuring points in the points on the same monitoring plane. The geogrid in each plane showed obvious shrinkage with time, and the variation trend of geogrid strain on plane I and plane II was very similar. The geogrid strain amplitude measured in plane III is larger than that in planes I and II. After one year, the gratings continued to be stretched. Due to the continuous infiltration of rainfall, the soil went on swelling, and the tensile strain of the geogrid increased continuously. Accordingly, the lateral swelling pressure of the soil decreased continuously until the reinforcement reached the equilibrium state and the tensile strain of the geogrid reached the peak. On the one hand, the soil-swelling potential is released, and the soil stress is redistributed after a certain tensile deformation of the geogrid, and there is not enough lateral swelling pressure to keep the geogrid in a tensile state. On the other hand, the interface friction between the geogrid and the soil gradually weakens with further wetting. Geogrid is an elastic material in a particular strain range, so the friction between the geogrid and soil is not large enough to prevent the geogrid from shrinking. Due to the effect of wet and dry cycles, the geogrid will return to its initial state in the process of multiple retractions and stretching, and the flexible displacement meter will be compressed by the soil to produce negative values.

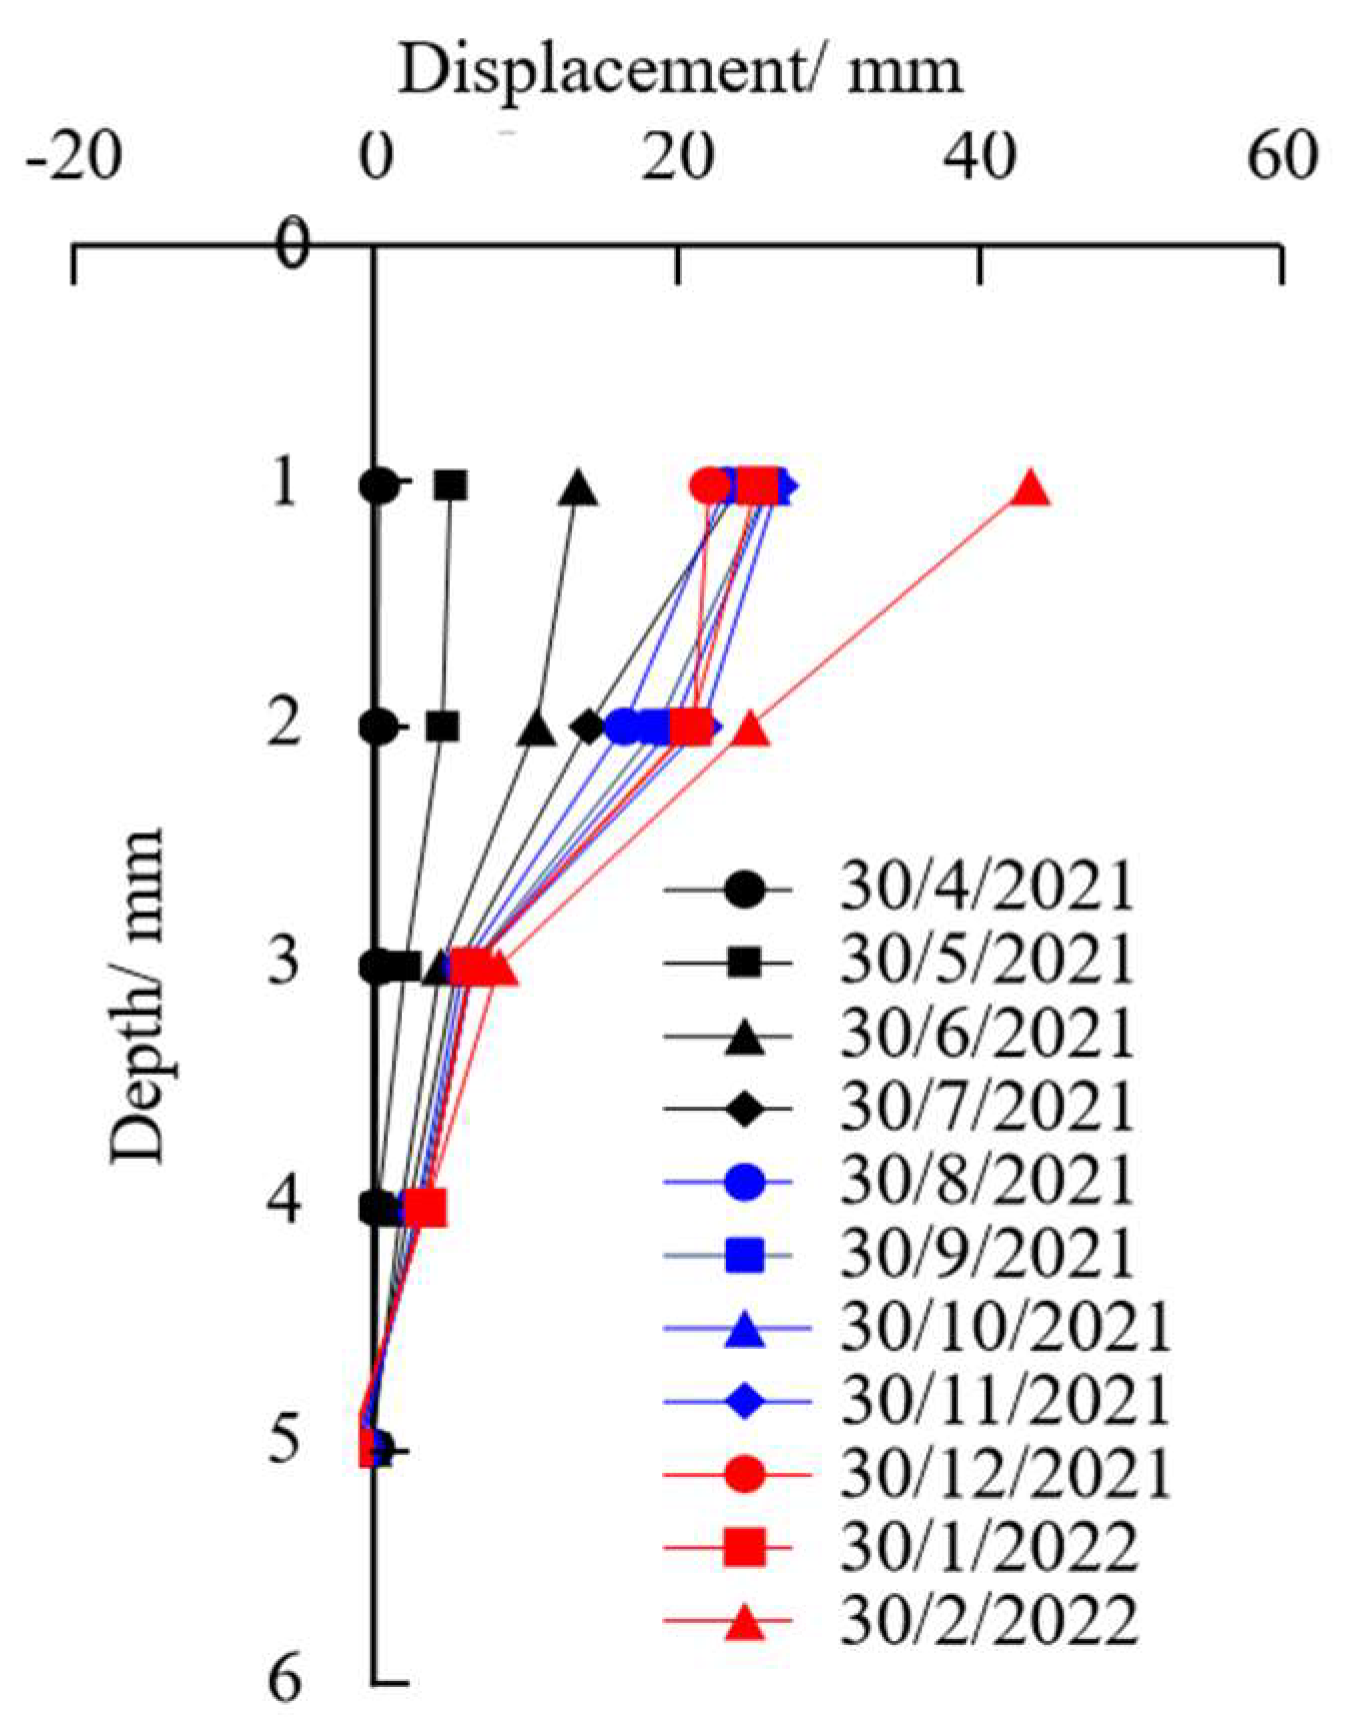
3.5. Horizontal Displacements of the Reinforced Slope

The horizontal displacement in the figure is calculated by taking the displacement measured one day before the formal data collection as the reference zero. The horizontal displacement to the south (i.e., towards the route direction) is defined as positive. With the change of seasons in the atmospheric environment, horizontal displacement of soil in the south direction occurs. The horizontal displacement values measured by two different inclinometer piles and their changes with time are very similar. The horizontal displacement of the soil layer under 1.5 m depth is much larger than that under 1.5 m depth, and the influence depth of the atmospheric drying-wetting cycle is mainly within 2 m depth. During the monitoring period, the variation of slope soil horizontal displacement along depth is similar to the swelling deformation of expansive soil under different water content along the depth direction. It shows that the horizontal displacement of the slope is mainly affected by the swelling deformation of expansive soil under humidification conditions. Due to the high water content of shallow soil, the expansive soil will produce a large expansion deformation after humidification, which causes the slope soil to move towards the open surface of the slope. As the permeability coefficient of expansive soil is small, only a small part of rainwater penetrates into the deep soil with the increase in depth. The deeper the soil is, the less the water content increases and the smaller the expansion deformation is. At the same time, it also shows from the side that geogrid-reinforced flexible support structure can prevent groundwater or water from entering the reinforced soil body through the drainage layer at the bottom, avoid the swelling and contraction deformation of expansive soil caused by water content fluctuation, and ensure the stability of slope to a certain extent (Figure 15 and Figure 16).
It can be seen that both inclined pipes have a tendency to incline towards the surface. After the first rainfall in September, both of them began to incline to the outside of the slope, and the horizontal displacement gradually increased with time. This is because there is a certain gap between the pipe wall and the hole wall after the drilling installation of the inclined pipe. Due to the incomplete filling of the gap by fine sand, rainwater will infiltrate along the gap, and the soil will absorb water and expand during rainfall. The positions of the measuring points at different depths of the inclined pipe were changed accordingly, leading to the fluctuation of all the measured data at the same time. The horizontal displacement decreases with increasing depth. This may be because the water content of slope soil decreases with the increase in depth, resulting in larger swelling deformation of shallow soil than deep soil. The horizontal displacement of slope soil increases due to the lateral expansion deformation, but the horizontal displacement is very small under the constraint of geogrid. The horizontal displacements of the two inclined pipes are less than 0.8 mm, indicating that the slope has no sliding risk. Therefore, the effectiveness of geogrid in reinforcing expansive soil slopes is verified.

4. Life Cycle Assessment

Life cycle assessment (LCA) is a method used to analyze the environmental factors and potential impacts in the whole process of products, from raw material acquisition to final treatment [31]. It has become one of the mainstream methods for scholars to quantify ecological impacts, mainly consisting of purpose and scope determination, inventory analysis, impact assessment, and interpretation of results. In this study, based on the actual project and actual data, GaBi Education software was used to model the two kinds of support structures, compared the list analysis data of flexible and rigid slope support technology during the construction period, and then conducted the characterization, standardization, and normalization analysis of the two models, replacing the qualitative analysis with the quantitative results. It directly reflected the environmental impact of the two life cycles and provided comparative data, and referenced for the follow-up exploration and optimization of slope support schemes.

Characterizing Environmental Impacts

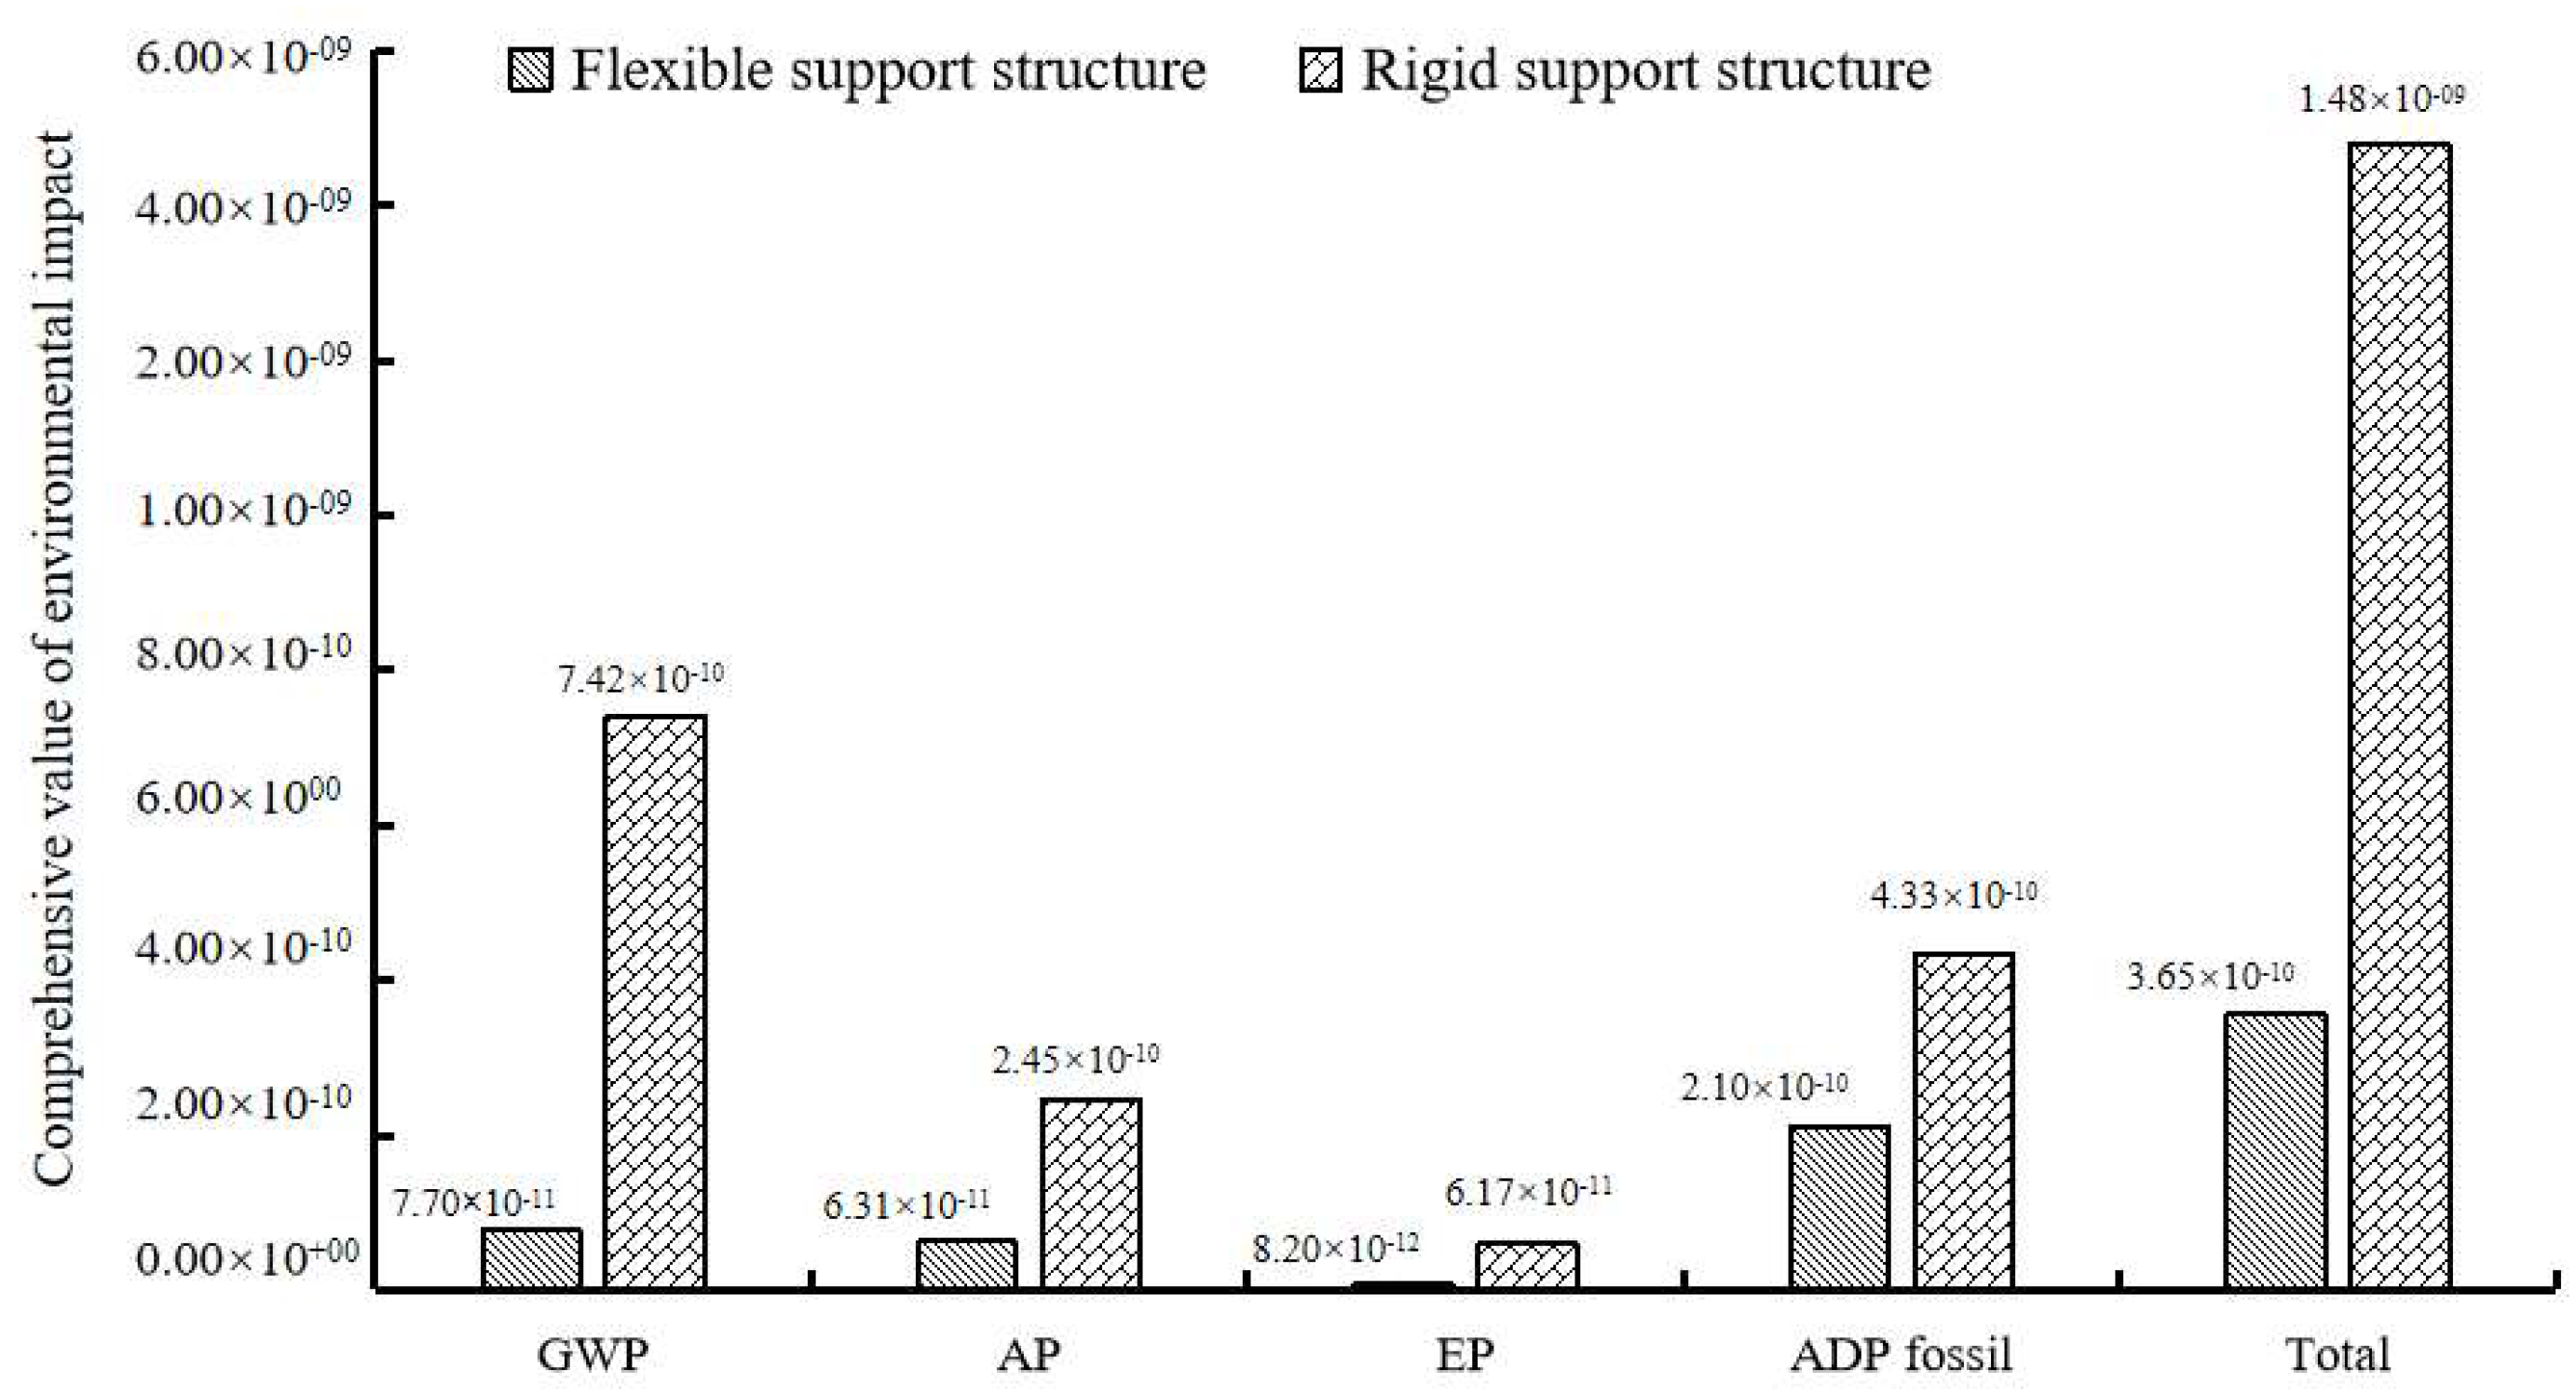
GaBi Education software was used to calculate the environmental emissions of flexible and rigid support structures during their life cycle. The life cycle method of CML2001 is adopted for this impact assessment. Four environmental impact types were selected, Global Warming Potential (GWP), Acidification Potential (AP), Eutrophication Potential (EP), and Abiotic Depletion Potential Fossil (ADP fossil), which were used to characterize, standardize, and normalize the data. According to the method in literature [32], the comprehensive environmental indicators of flexible and rigid support structures per unit area (1000 m2) were obtained (Table 2) and the relative proportion comparison diagram (see Figure 17).
As can be seen from Table 2, for the flexible support structure, the life cycle environment comprehensive index value is 3.56 × 10⁻¹⁰. Among the four types of environmental impact, ADP fossil is the most harmful one, with a value of 2.08 × 10⁻¹⁰, accounting for 58.43% of the comprehensive index. It can be seen that fossil energy consumption is the most important and direct type of environmental impact of the flexible support structure because the production of geogrades needs to consume a large amount of fossil energy. Secondly, a large amount of CO2, CH4, NOx, and other gases will be released in the process of geogrid production and transportation of gravel and other materials, resulting in a high degree of damage to GWP and AP, which are 7.69 × 10⁻¹¹ and 6.26 × 10⁻¹¹, respectively, accounting for 21.6% and 17.58%. In contrast, the effect of flexible support on water quality deterioration is the least; EP only accounts for 2.31% of the comprehensive index. For rigid support structure, the total environmental impact value is 1.48 × 10⁻⁹, among which GWP (7.42 × 10⁻¹⁰) accounts for 50.07%, ADP FOSSIL and AP contribute more, accounting for 29.05% and 16.55%, while EP contributes the least, only 4.17%.
According to Figure 17, the rigid support structure is 4.16 times the flexible support structure affected by the total environment. During the whole life cycle of flexible support structure per unit area, GWP, AP, EP, ADP fossil, and other environmental comprehensive indexes are all smaller than those of rigid support structure, and the difference values are all more than 50%. The difference in GWP was the largest (89.64%), while the difference in ADP fossil (fossil energy consumption potential) was the smallest (51.63%).
According to the analysis of Table 2 and Figure 17, the carbon emission generated by the rigid support structure in its life cycle is 9.68 times that of the flexible support structure, and the main culprit is concrete production and use in the concrete construction stage of the rigid support structure. In addition, the diesel fuel consumption and carbon emission during transportation of geogrid and gravel in flexible support are much lower than the energy consumption of concrete in rigid support. During the construction period of the rigid support structure, a large amount of concrete is used, and it needs to be transported back and forth many times, which leads to the total transportation volume of rigid support construction being far more than the total transportation distance of flexible support construction [25]. Thus, in the process of slope support, the carbon emission intensity of rigid support structure construction is much higher than that of flexible support structure construction.
Rigid supporting structure for acidification potential (AP), the comprehensive value is 7.5 times of flexible supporting structure, because in addition to the car exhaust in the process of transport of acidic pollutants, rigid supporting structure during construction of cement, lime, etc. The process of production of raw materials emit a large number of acid gases, and facilities of the building damage, corrosion the environment, and endanger human body health. Compared with the other three environmental impact types, the eutrophication value (EP) generated during the construction period of flexible and rigid support structures is the least. The eutrophication source of flexible support is mainly the production of crushed stone, while the concrete construction stage of rigid support structures contributes more to eutrophication.
According to preliminary calculations, although the difference between flexible and rigid support structures on ADP fossils is relatively small, the proportion of ADP fossils in the life cycle of the two can not be ignored. During the construction period of the flexible support structure, the production of raw materials geogrid is the main cause of fossil energy consumption, followed by the consumption of diesel during the transport of crushed stone. The cement concrete and steel used in the construction period of rigid support structures are important building materials for energy consumption [26]. In addition, the transportation times of construction materials are many, and the total distance is much longer than that of flexible support, so the energy consumption caused by transportation is also extremely serious [33]. To sum up, replacing pile sheet walls and anchor frame beams with geogrid for slope protection can control energy consumption, reduce the environmental load from two aspects of the material production process, and reduce the energy consumption of engineering material production.
It can be seen from Table 3 above that under the condition of the slope with the same area, the cost of the flexible support structure is USD 0.204 million, the cost of the rigid support structure is USD 0.973 million, the cost of the flexible support structure is 1/5 of the rigid one, and the total saving is USD 0.769 million. According to the information provided by the construction unit, the unit price of HDPE unidirectional geogrids used in the flexible support structure, which can play a good role in “hoop”, is USD 1.627/m2, while the unit price of bolt frame beam and pile wall which play the same role in the rigid support is USD 277.57/m3 and USD 133.42/m3, respectively. The cost of soft geogrid is much lower than the cost of cement concrete. In addition, the rigid support slope construction process is complicated, the construction period is long, and the required mechanical equipment is much, while the flexible support structure construction is simple, the construction period is short, and most of the procedures can choose the manual way. Therefore, the flexible support structure of expansive soil slope has a good economic effect and certain cost advantages compared with the rigid support structure.

5. Conclusions

The long-term response of an expansive soil slope reinforced with geogrid was monitored. A series of sensors were buried in the expansive soil slope, and the changes in soil stress, water content, geogrid strain, and slope displacement were monitored during the monitoring period of two years. The following conclusions can be drawn:
(1) The geogrid flexible support structure can use its own flexible deformation to control the deformation of the slope under different atmospheric environments. During rainfall, the flexible support structure of geogrid allows the slope surface to expand to a certain extent through its elastic deformation so as to release the expansion potential of the expansive soil. When dry, the structure can shrink with the soil shrinkage to ensure that the soil structure will not produce excessive cracks due to the wetting and drying cycle, giving full play to the resilient function of the structure to ensure the stability of the slope.
(2) The closer it is to the slope surface, the faster the geogrid strain changes and the earlier the peak appears. This is because the effects of the wetting and drying cycles go from shallow to deep. Even when the expansive soil reaches saturation, the permeability coefficient is very small, and the time for rainwater to penetrate into the slope is longer.
(3) The variation range of vertical and lateral earth pressure is small in the early stage of monitoring. The horizontal stress increases sharply after entering the rainy season. Afterward, it decreases rapidly after reaching the peak and then changes steadily. The vertical stress shows similar variation trends, but its response relatively lags. Because the geogrid is not fully tensioned, the swelling of the wet, shallow soil pushes the reinforced body towards the free face. This causes slight tension of the earth pressure cell and a negative horizontal and vertical stress ratio at the initial stage of monitoring. With further rainwater infiltration, soil swelling is restricted to produce a large lateral swelling pressure, and the stress ratio increases to the peak.
(4) The rigid support structure per unit area is 4.16 times that of the flexible support structure with total environmental impact. During the whole life cycle of the flexible support structure, GWP, AP, EP, and ADP fossils are more than 50% worse than those of the rigid support structure. Among them, GWP has the largest difference (89.64%). The carbon emission generated by a flexible support structure during its life cycle is 1/10 of that of the rigid support structure, which can reduce 245 tons of CO2 emission. The ADP fossil difference is 51.63%, indicating that the flexible support structure reduces the energy consumption of the rigid support structure by half. Therefore, using a flexible support structure instead of the rigid support structure to support expansive soil slopes can control energy consumption, reduce environmental load, and achieve the goal of green and low-carbon transformation of the transportation industry.

Author Contributions

All authors contributed equally to this study. Conceptualization, R.Z., Z.L. and T.L.; methodology, R.Z. and T.L.; formal analysis, R.Z., S.L. and T.L.; data curation, R.Z. and T.L.; writing—original draft preparation, R.Z. and T.L.; writing—review and editing, R.Z., P.T. and T.L.; visualization, R.Z., P.T., T.L., Z.L. and S.L.; supervision, T.L. All authors have read and agreed to the published version of the manuscript.

Funding

This work was supported by the National Natural Science Foundation of China (Grant No. 51978085), the Research and Development Program of China National Railway Group Co. Ltd (Grant No. K2020G036).

Institutional Review Board Statement

Not applicable.

Informed Consent Statement

Not applicable.

Data Availability Statement

Not applicable.

Conflicts of Interest

The authors declare no conflict of interest.

Abbreviations

LCAlife cycle assessment
LCCAlife cycle cost assessment
GWPglobal warming potential
APacidification potential
EPeutrophication potential
ADPfossil abiotic depletion potential fossil

References

  1. Ng, C.W.W.; Zhan, L.-T.; Bao, C.-G.; Fredlund, D.G.; Gong, B.-W. Performance of an unsaturated expansive soil slope subjected to artificial rainfall infiltration. Géotechnique 2003, 53, 143–157. [Google Scholar] [CrossRef]
  2. Tiwari, N.; Satyam, N.; Sharma, M. Micro-mechanical performance evaluation of expansive soil biotreated with indigenous bacteria using MICP method. Sci. Rep. 2021, 11, 10324. [Google Scholar] [CrossRef] [PubMed]
  3. Puppala, A.; Congress, S.; Banerjee, A. Research advancements in expansive soil characterization, stabilization and geoinfrastructure monitoring. Front. Geotech. Eng. 2019, 15–29. [Google Scholar] [CrossRef]
  4. Chehade, H.; Dias, D.; Sadek, M.; Jenck, O.; Chehade, F.H. Seismic analysis of geosynthetic-reinforced retaining wall in cohesive soils. Geotext. Geomembr. 2019, 47, 315–326. [Google Scholar] [CrossRef]
  5. Tiwari, N.; Satyam, N.; Puppala, A.J. Strength and durability assessment of expansive soil stabilized with recycled ash and natural fibers. Transp. Geotech. 2021, 29, 100556. [Google Scholar] [CrossRef]
  6. Zhang, R.; Long, M.-X.; Lan, T.; Zheng, J.-L.; Geoff, C. Stability analysis method of geogrid reinforced expansive soil slopes and its engineering application. J. Cent. South Univ. 2020, 27, 1965–1980. [Google Scholar] [CrossRef]
  7. Korini, O.; Bost, M.; Rajot, J.P.; Bennani, Y.; Freitag, N. The influence of geosynthetics design on the behavior of reinforced soil embankments subjected to rockfall impacts. Eng. Geol. 2021, 286, 106054. [Google Scholar] [CrossRef]
  8. Araújo, G.; Palmeira, E.; Macêdo, í.L. Comparisons between predicted and observed behavior of a geosynthetic reinforced abutment on soft soil. Eng. Geol. 2012, 147–148, 101–113. [Google Scholar] [CrossRef]
  9. Lei, D.; Chen, L. Study on Runoff and Infiltration for Expansive Soil Slopes in Simulated Rainfall. Water 2020, 12, 222. [Google Scholar] [CrossRef] [Green Version]
  10. Xiao, J.; Yang, H.-P.; Zhang, J.-H.; Tang, X.-Y. Surficial failure of expansive soil cutting slope and its flexible support treatment technology. Adv. Civ. Eng. 2018, 2018, 1609608. [Google Scholar] [CrossRef]
  11. Zhan, L.; Chen, R.; Ng, C.W.W. Wetting-induced softening behavior of an unsaturated expansive clay. Landslides 2014, 11, 1051–1061. [Google Scholar] [CrossRef]
  12. Schulz, W.H.; Smith, J.B.; Wang, G.-H.; Jiang, Y.; Roering, J.J. Clayey Landslide Initiation and Acceleration Strongly Modulated by Soil Swelling. Geophys. Res. Lett. 2018, 45, 1888–1896. [Google Scholar] [CrossRef]
  13. Liu, Y.; Vanapalli, S.K. Influence of lateral swelling pressure on the geotechnical infrastructure in expansive soils. J. Geotech. Geoenviron. Eng. 2017, 10, 1943–5606. [Google Scholar] [CrossRef]
  14. Papagiannakis, A.; Bin-Shafique, S.; Lytton, R. Retaining structures in expansive clays. Geotech. Geol. Eng. 2014, 10, 103–124. [Google Scholar] [CrossRef]
  15. Lade, P.V. The mechanics of surficial failure in soil slopes. Eng. Geol. 2010, 114, 57–64. [Google Scholar] [CrossRef]
  16. Zhang, R.; Liu, Z.-N.; Zheng, J.-L.; Zhang, J.-L. Experimental Evaluation of Lateral Swelling Pressure of Expansive Soil Fill behind a Retaining Wall. J. Mater. Civ. Eng. 2020, 32, 04019360.1–04019360.11. [Google Scholar] [CrossRef]
  17. Khan, M.S.; Hossain, S.; Ahmed, A.; Faysal, M. Investigation of a shallow slope failure on expansive clay in Texas. Eng. Geol. 2017, 219, 118–129. [Google Scholar] [CrossRef]
  18. Qi, S.; Vanapalli, S.K. Influence of swelling behavior on the stability of an infinite unsaturated expansive soil slope. Comput. Geotech. 2016, 76, 154–169. [Google Scholar] [CrossRef]
  19. Pathak, Y.P.; Alfaro, M.C. Wetting-drying behavior of geogrid reinforced clay under working load conditions. Geosynth. Int. 2010, 17, 144–156. [Google Scholar] [CrossRef]
  20. Lan, T.; Zhang, R.; Yang, B.-Y.; Meng, X. Influence of Swelling on Shear Strength of Expansive Soil and Slope Stability. Front. Earth Sci. 2022, 10, 849046. [Google Scholar] [CrossRef]
  21. Murat, K.; Omer, T. Ecologically based hybrid life cycle analysis of continuously reinforced concrete and hot-mix asphalt pavement. Transp. Res. Part D Transp. Environ. 2012, 17, 86–90. [Google Scholar]
  22. Chinyere, D.; Caroline, H. Evaluation of low-impact modular housing using energy optimization and life cycle analysis. Energy Ecol. Environ. 2019, 4, 286–299. [Google Scholar]
  23. Nässén, J.; Holmberg, J.; Wadeskog, A.; Nyman, M. Direct and indirect energy use and carbon emissions in the production phase of buildings: An input–output analysis. Energy 2007, 32, 1593–1602. [Google Scholar] [CrossRef]
  24. Asdrubali, F.; Baldassarri, C.; Fthenakis, V. Life cycle analysis in the construction sector: Guiding the optimization of conventional Italian buildings. Energy Build. 2013, 64, 73–89. [Google Scholar] [CrossRef]
  25. Thong, J.; Ho, C.; Noor, Z. Assessment of embodied energy and global warming potential of building construction using life cycle analysis approach: Case studies of residential buildings in Iskandar Malaysia. Energy Build. 2015, 93, 295–302. [Google Scholar]
  26. Santos, J.; Bryce, J.F.; Lintsch, G. A life cycle assessment of in-place recycling and infrastructure and maintenance practices. Struct. Infrastruct. Eng. 2014, 11, 1199–1217. [Google Scholar] [CrossRef]
  27. Huang, Y.; Roger, B.; Oliver, H. Development of a life cycle assessment tool for construction and maintenance of asphalt pavements. J. Clean. Prod. 2009, 17, 283–296. [Google Scholar] [CrossRef]
  28. Chan, A. Economic and Environmental Evaluations of Life Cycle Cost Analysis Practice: A Case Study of Michigan DOT Pavement Projects. Mater’s Thesis, Mater of Science Thesis in Natural Resource and Environment, University of Michigan, Ann Arbor, MI, USA, 2007. [Google Scholar]
  29. Chang, B.; Kendalla, A. Life Cycle Greenhouse Gas Assessment of Infrastructure for California’s High-speed Rail System. Transp. Res. Part D Transp. Environ. 2011, 16, 429–434. [Google Scholar] [CrossRef]
  30. Frischknecht, R.; Büsser-Knöpfel, S.; Itten, R. Comparative Life Cycle Assessment of Geosynthetics versus Concrete Retaining Wall. In Proceedings of the 18th International Conference on Soil Mechanics and Geotechnical Engineering, Paris, France, 2–6 September 2013; pp. 1979–1982. [Google Scholar]
  31. ISO.14040; Environmental Management—Life Cycle Assessment—Principles and Framework. British Standards Institution: London, UK, 2006.
  32. Cays, J. An Environmental Life Cycle Approach to Design; Springer Nature Switzerland AG: Cham, Switzerland, 2021. [Google Scholar]
  33. Chen, Y.-S.; Yang, Y.-P.; Li, X.; Dong, H.-B.; Bai, R.-B. Life Cycle Resource Consumption of Automotive Power Seats. Int. J. Environ. Stud. 2014, 17, 449–462. [Google Scholar] [CrossRef]
Figure 1. Engineering supported slope (22°84′ N, 108°39′ E).
Sustainability 14 12813 g001
Figure 2. Side view and monitoring planes of the slope reinforced by geogrid. (Unit: m).
Sustainability 14 12813 g002
Figure 3. Monitoring sensors on three horizontal planes. (Unit: m).
Sustainability 14 12813 g003
Figure 4. Daily average temperature and relative humidity during the monitoring period.
Sustainability 14 12813 g004
Figure 5. Changes in average daily rainfall during the monitoring period.
Sustainability 14 12813 g005
Figure 6. Curves of volumetric water contents of soil on monitoring plane I (H = 2 m).
Sustainability 14 12813 g006
Figure 7. Curves of volumetric water contents of soil on monitoring plane II (H = 4 m).
Sustainability 14 12813 g007
Figure 8. Curves of volumetric water contents of soil on monitoring plane III (H = 6 m).
Sustainability 14 12813 g008
Figure 9. Curves of soil stresses of soil on monitoring plane I (H = 2 m).
Sustainability 14 12813 g009
Figure 10. Curves of stresses of soil on monitoring plane I (H = 4 m).
Sustainability 14 12813 g010
Figure 11. Curves of stresses of soil on monitoring plane II (H = 6 m).
Sustainability 14 12813 g011
Figure 12. Curves of strains of geogrid on monitoring plane I (H = 2 m).
Sustainability 14 12813 g012
Figure 13. Curves of strains of geogrid on monitoring plane II (H = 4 m).
Sustainability 14 12813 g013
Figure 14. Curves of strains of geogrid on monitoring plane III (H = 6 m).
Sustainability 14 12813 g014
Figure 15. Curves of horizontal displacements measured by inclinometer 1.
Sustainability 14 12813 g015
Figure 16. Curves of horizontal displacements measured by inclinometer 2.
Sustainability 14 12813 g016
Figure 17. Comparison of environmental comprehensive indexes of flexible and rigid support structures per unit area (1000 m2).
Sustainability 14 12813 g017
Table 1. Summary of monitoring sensors.
ParameterSensorQuantityRangeAccuracy
Soil moistureWater content probe120–100%±2%
Soil stressEarth pressure cell90–300 kPa0.1 kPa
Geogrid strainFlexible displacement meter120–30 mm0.01 mm
Slope displacementInclination probe11Between −15° and 15°±0.05% FS
Amount of rainfallRain gauge1≤4 mm/min±4%
TemperatureThermometer1Between −30 ℃ and 120 ℃±0.5 ℃
HumidityHygrometer11–100%±1%
Table 2. Comprehensive environmental index of flexible and rigid support structure per unit area (1000 m2).
TypesGWPAPEPADP FossilTotal
Flexible support structure7.69 × 10−116.26 × 10−118.21 × 10−122.08 × 10−103.56 × 10⁻¹⁰
Rigid support structure7.42 × 10−102.45 × 10−106.17 × 10−114.33 × 10−101.48 × 10⁻⁹
Table 3. Comparison of comprehensive costs of flexible and rigid support structures (Unit: USD 1000).
ProjectsRigid Support StructureRigid Support Structure
HDPE one-way geogrid45.92\
Gravel filter layer21.46\
Waterproof geotextile4.16\
Permeable geomembrane14.53\
Anchor frame beam\238.38
Ecological bag\66.39
slab-pile wall\433.64
Others (transportation, labor, etc.)104.38234.58
Total204.46972.99
Publisher’s Note: MDPI stays neutral with regard to jurisdictional claims in published maps and institutional affiliations.