Article

Research on the Influencing Factors for the Use of Green Building Materials through the Number Growth of Construction Enterprises Based on Agent-Based Modeling

1
School of E-Commerce and Logistics, Beijing Technology and Business University, Beijing 100048, China
2
BUCG The Eighth Construction Development Co., Ltd., Beijing 100012, China
3
School of Computer Science and Engineering, Beijing Technology and Business University, Beijing 100048, China
*
Author to whom correspondence should be addressed.
Sustainability 2022, 14(19), 12773; https://doi.org/10.3390/su141912773
Submission received: 14 September 2022 / Revised: 30 September 2022 / Accepted: 3 October 2022 / Published: 7 October 2022

Abstract

:
As the concept of green building is increasingly promoted worldwide, the use of green building materials has also attracted great attention. In order to improve the utilization rate of green building materials in construction projects, this paper tries to explore influencing factors based on the method of agent-based modeling (ABM), which is well-suited to the study of complex systems and their emergent behaviors. There are two types of agents being set, named, respectively, greedy construction enterprises and selective construction enterprises. Meanwhile, the construction unit’s intention to use green building materials is treated as the criterion. Two types of construction enterprises compete for projects to obtain profits. In order to reveal the mechanism of the evolutionary path of the macro system, the movement step, project unit profit, project cost and expansion cost are adopted as the independent variables and the number of enterprises is the dependent variable. Then, the experiment was performed with the NetLogo simulation platform. The simulation results show that, it is not beneficial for the selective construction enterprises when the movement step in selecting projects is too long and the project units are too profitable. However, when the project cost and expansion cost become higher, there is a significant advantage for selective construction enterprises to go for a long-term development. Therefore, after a comprehensive evaluation of project costs and unit profits, an optimal strategy can be formulated to ensure the quantitative scale of construction enterprises in the construction industry. This behavior can indirectly improve the intention of construction units to use green building materials and further promote the utilization rate of green building materials.

1. Introduction

Construction, industry and transportation are the three globally recognized energy-consuming fields. As one of them, the construction industry contributes significantly to national economic output, while its environmental pollution and carbon emission problems cannot be ignored [1,2]. About 30% of the world’s natural resources are used by the construction industry, which also generates 25% of solid waste [3]. Therefore, the decarbonization, greening and reproducibility of the construction industry are particularly important and green building as a new concept has also emerged, as the times require. Green buildings refer to those that can minimize the negative impact on the environment and protect natural resources during the design, construction and operation phases [4]. For the management of green buildings, some scholars have explored the main factors of their success and failure [5] and shown the results of green building applications by country, region or even industry [6], using evaluation models to measure their development as well as the efficiency of their promotion [7,8]. There are also some scholars who even used point cloud and other technologies to collect data and 3D reconstructions of green buildings [9,10,11]. Artificial neural networks can be used as well, to predict the factors influencing the adoption of green development behaviors by construction enterprises [12]. Green building is integrated into every aspect of a complete building project, from design and procurement to construction and operation. For example, the collaborative operation of design and construction is used as an effective management tool to enhance the cost control of green buildings [13]. Exploring the main factors which influence the development of the green building industry from a project life cycle and stakeholder perspective will provide a clearer view of its future development [14,15]. If the market for green building is analyzed according to the dimensions of design companies and contractors, the historical stages of transformation and group characteristics of its development trends are again identified, providing academics and related practitioners with an overall perception of the green building market [16]. For projects that have been certified as green buildings, the key focus of the evaluation system is still on the design and construction phases and the importance of the operation phase is ignored, so the absences in the evaluation system are improved to make it more perfect and reasonable [17].
Building materials can usually account for 50–60% of the project cost [18]. As an important part of green buildings, their environmental friendliness largely determines the success of green buildings. Therefore, green building materials are also considered as one of the key indicators to assess the sustainability of green buildings [19,20]. Green building materials are new building materials that have fundamentally changed traditional building materials as well as construction methods through the use of new technologies. They improve the use of new energy and reduce carbon emissions. In this way, the issues of building energy saving, environmental protection, and pollution control have been well integrated [21,22]. It is an important material basis for promoting the development of green buildings as well as the basis for building energy efficiency [21,23]. In the supply chain of green building materials, if the green building materials suppliers, construction enterprises and government departments coordinate their operations, it will certainly bring maximum benefits of multiple parties in the game [24,25]. However, different agents focus on different concerns. For construction enterprises, as the main buyers of green building materials, they are responsible for promoting the development of green building materials [26]. The ultimate goal of construction enterprises is to pursue maximum benefits, so they need to obtain more construction projects on this basis. However, construction units need to control costs as well as respond to government and other relevant policies for the use of green building materials.
It has been pointed out that stakeholders have a positive role in the procurement and use of green building materials [27]. For example, the procurement process would like to minimize waste [28] and even develop relevant procedures to monitor carbon emissions in combination with BIM (Building Information Modeling) technology [29,30]. These measures can achieve the goal of cost optimization and green building for construction enterprises. Some scholars have also explored the extent of suppliers’ compliance with green standards to urge the successful implementation and promotion of green standards [31]. However, most of the previous studies are based on the implementation of projects that have already been undertaken. There are relatively few studies on the stage of selecting projects to undertake, and even fewer studies comparing different types of construction enterprises. The selection of projects to be undertaken with criterion is the basis of whether the utilization rate of green building materials can be increased. Therefore, it plays a vital role in subsequent projects. Usually, in the bidding phase of the project, the construction unit will obtain a planned use of green building materials according to the design of the project. Therefore, construction enterprises and their evolutionary process in number growth are regarded as a composite system. The intention of construction units to use green materials is the attribute and decision-making base of the system. Construction enterprises need to judge whether to undertake a current project through the criterion. This behavior can establish an evolutionary process of different types of construction enterprises and seek out the optimal number. By this means, the utilization rate of green building materials in the construction industry could be greatly improved.
In view of the above mentioned, different types of construction enterprises and their adaptive learning abilities contribute to a dynamic system. It is so complex that it cannot be described clearly by simple linear mathematical relationships. As a bottom-up modeling approach, the agent-based modeling (ABM) technique offers the possibility to reveal the non-linear relationship between the global state and the interaction of the agents [32]. It is an effective tool for studying complex adaptive systems and their emergence [33,34,35], which provides a reliable theoretical aid for decision makers. This method has been widely used in various fields such as supply chain management, environmental management, ecology, and sociology [36,37,38,39,40,41]. Therefore, using an agent-based modeling technique to research the influencing factors for the use of green building materials is significant and possible.

2. Experimental Model Design

2.1. Basic Modeling

The experimental model contains two types of agents, namely, selective construction enterprises and greedy construction enterprises. Both types of construction enterprises will compete for contract orders to achieve profitability through the projects that exist in the construction industry. The use of green building materials obtained by the construction unit according to the design stage is abstracted into the use intention as well as the judgment criterion. The selective construction enterprises will only accept projects with the use intention of green building materials higher than a certain threshold value. The purpose of this behavior is to ensure that the government policies are met and the construction market is operational, which is more conducive to the long-term development of the company. Meanwhile, the greedy construction enterprises are not bound by the criterion and always try their best to strive for the existing projects in the current market to achieve the purpose of profitability. At the same time, the two types of construction enterprises follow the life course of expansion and demise depending on their assets. The interaction between the construction enterprises and the projects is shown in Figure 1.

2.2. Experimental Assumptions

Based on the above model structure, the following assumptions are made in this paper.
Assumption 1.
Construction enterprises are only distinguished as selective construction enterprises and greedy construction enterprises. In reality, construction enterprises have different abilities to undertake projects due to scale, enterprise nature and enterprise qualifications, etc. In order to control the single variable of the model, other factors are, therefore, ignored, and the default construction enterprises are in business with sufficient ability to complete the projects.
Assumption 2.
The construction unit can clearly quantify the intention value for the use of green building materials, and follow the principle of obedience for the selection of construction enterprises.
Assumption 3.
There is no distinction between size and construction difficulty of the existing projects in the current construction industry. It is also believed that once the construction enterprises accept the project, it will inevitably bring a certain amount of profit for the enterprises, regardless of the actual loss.
Assumption 4.
When the total profits of both construction enterprises reach a certain threshold, they will expand the enterprise and produce a new construction enterprise of the same nature. Similarly, if the amount of profit is negative, the enterprises face extinction. Thus, the optimal number of various types of construction enterprises existing in the construction industry can be explored.

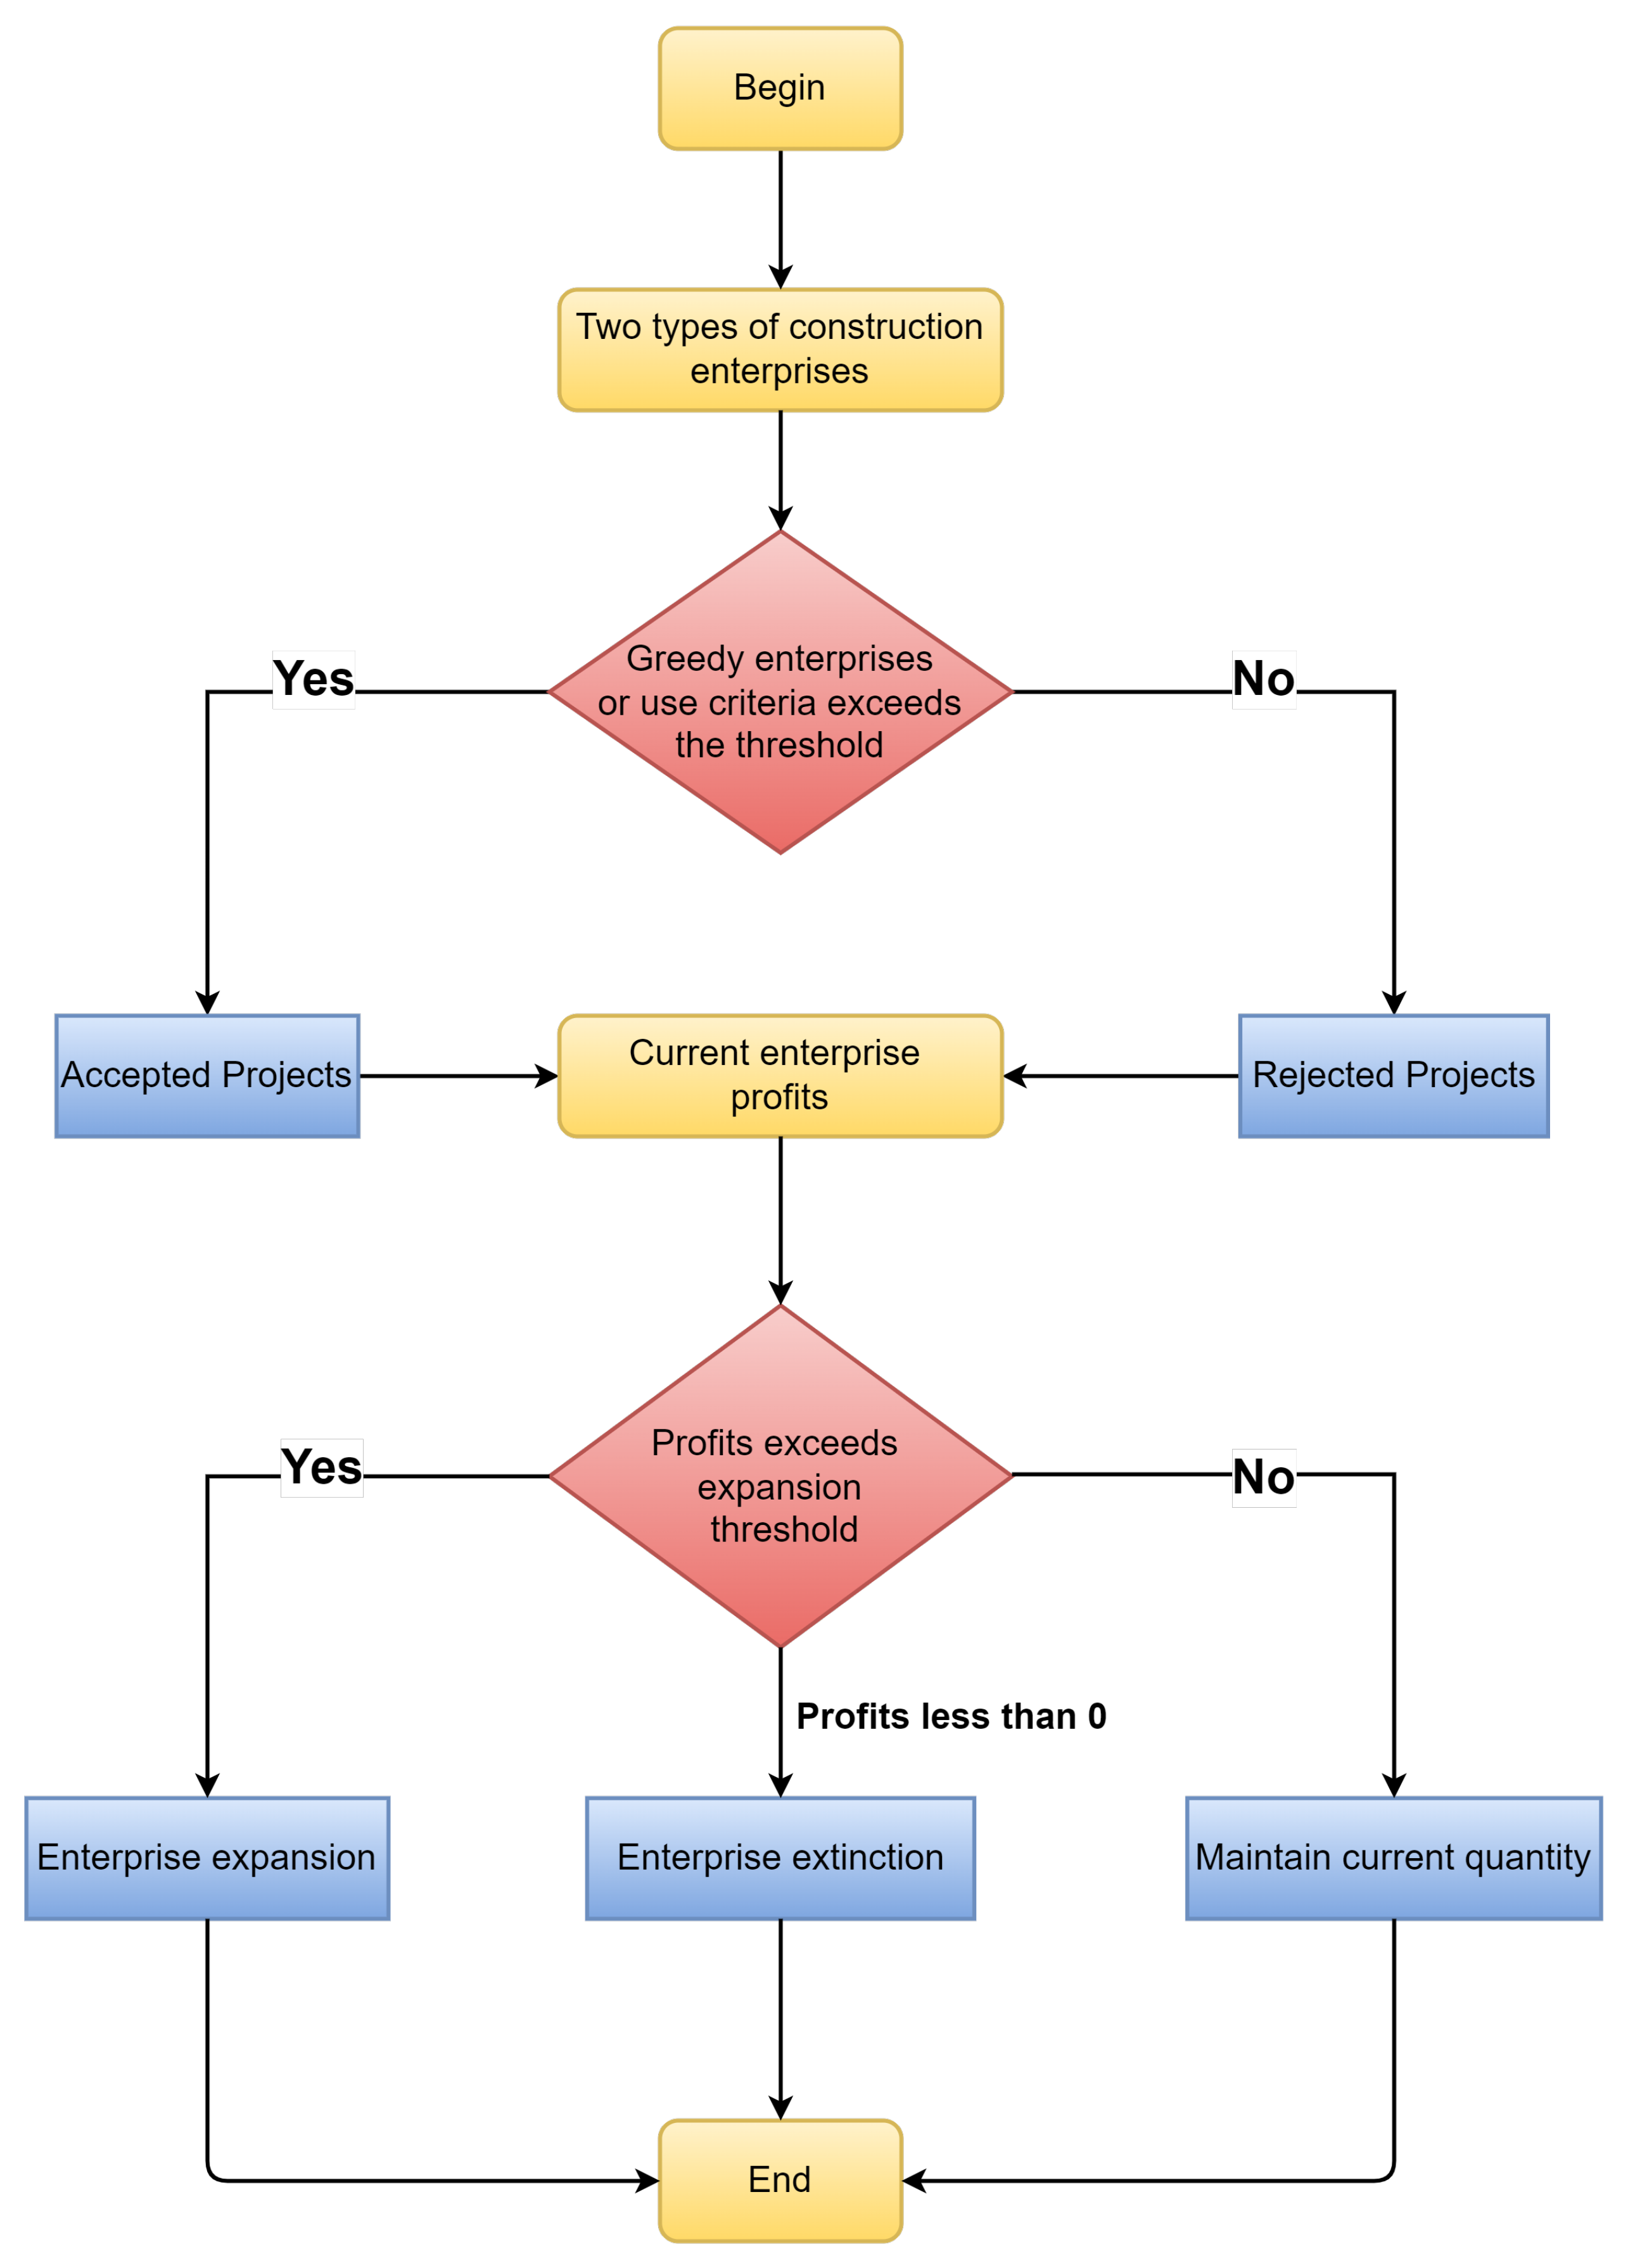
2.3. Agent of Construction Enterprise

As the main agent of the model, the number growth of construction enterprises can reflect the attitude of the construction industry towards the use of green building materials. The ultimate goal of construction enterprises is to pursue profit maximization, so it takes profit as its attribute and runs through the model running cycle. The main agent also has autonomous dynamics. In this model, construction enterprises can move to find projects (movement), accept projects (getting) and expand the behavior of the enterprise (reproduction).

2.3.1. Calculate the Initial Number of Construction Enterprises

The initial number of construction enterprises is assumed to be a certain total number, denoted by N 0 . The probability of becoming a selective construction enterprise is μ and the probability of becoming a greedy construction enterprise is 1 μ . Therefore, the initial number of both types of construction enterprises can be expressed as:
N 0 i = N 0 × μ N 0 j = N 0 × ( 1 μ )
In this formula, i denotes selective construction enterprises and j indicates greedy construction enterprises.

2.3.2. The Behavior of Movement

The construction enterprise moves to find projects in the construction industry. Each movement generates a project cost, noted as C s . When the value of profit (noted as π ) minus project cost is negative, this construction enterprise is considered to be in a state of extinction, noted as φ . Therefore, in the mth operating cycle, the profit of the construction enterprise can be expressed as:
π m = π m 1 C s , π m 0 π m = φ , π m < 0
The movement step can be defined during the moving, denoted by L. The following relationship between the step length and the final evolutionary quantity of the construction enterprises can be expressed as:
N = f ( x ) × L
In this formula, f ( x ) is the rule followed in the evolution of the agent, which can be reflected in the simulation experiment.

2.3.3. The Behavior of Getting

Regarding the selection of projects, the behaviors of the two types of construction enterprises are different. Taking the construction unit’s intention to use green building materials as the criterion, selective construction enterprises will choose projects higher than this criterion to accept and projects lower than this criterion will not be accepted. On the contrary, greedy construction enterprises will accept all of them without standard restrictions. If the project is accepted, it will bring P units of profit for the construction enterprises. I indicates the construction unit’s intention threshold for the use of green building materials. ω 1 is adopted to indicate whether a project is accepted. There are two values of ω 1 , 0 and 1, where 0 means accept the project and 1 means reject the project. When the project is accepted, it means that this time the agent is a greedy construction enterprise or a selective construction enterprise whose criterion exceeds the threshold. Of course, if the agent is a selective construction enterprise and its criterion does not exceed the threshold, the project is rejected. Combined with Equation (2), the profit of the construction enterprise of the mth operation cycle can be expressed as follows:
π m = π m 1 C s + 1 ω 1 × P , ω 1 = 0 , 1
It can be seen from the above formula that when ω 1 = 0, the project is accepted and P units of profit are added on the basis of deducting the cost. When ω 1 = 1, the project is rejected and the profit remains unchanged.
For patches, when a project is accepted, their quantities can be expressed as:
S m + 1 = S m 1 , ω 1 = 0
S represents the number of existing projects in the construction industry and the number of projects decreases correspondingly when the projects are accepted.

2.3.4. The Behavior of Reproduction

When the profit of the construction enterprise reaches a certain threshold, the enterprise can expand. It means a homogeneous new enterprise is generated and the cost of expanding the enterprise can be reduced at the same time. V p r o d represents the profit threshold to be reached by the construction enterprise expansion and ω 2 to represent the result of the enterprise expansion, where 0 represents expansion and 1 represents maintenance of the original state. C p r o d represents the cost required for the construction enterprise expansion, so the value of ω 2 can be expressed as:
ω 2 = 0 , π m > V p r o d 1 , π m V p r o d
The profit of the construction enterprise in the ( m + 1 ) th operating cycle can be expressed as:
π m + 1 = π m 1 ω 2 × C p r o d , ω 2 = 0 , 1
The number of construction enterprises after the expansion can be expressed as:
N m + 1 = N m + 1 , ω 2 = 0
That is, the construction enterprise reduces certain costs and the quantity subsequently increases.

2.4. Patch of Construction Industry Projects

In the model, the number of projects in the construction industry is not constant but follows a certain pattern of continuous emergence. It is assumed that when the construction unit’s intention to use green building materials is higher than the threshold, more projects will appear due to other realistic incentives and the growth rate is α . On the contrary, when the intention to use is lower than the threshold, the growth rate of projects will be significantly lower, which is represented by β and there is a relation that α > β . Therefore, the number of projects in the ( m + 1 ) th cycle can be expressed as follows:
S m + 1 = S m 1 + S m × ( 1 + α ) , ω 1 = 0 S m + 1 = S m + S m × ( 1 + β ) , ω 1 = 1

3. Simulation Experiment

3.1. Simulation Platform

NetLogo is a mainstream simulation platform to research agent-based modeling, which can simulate the behavioral evolution of various complex objects in nature and society so as to emerge their intrinsic laws [42,43]. It represents each agent with a turtle and divides the environment in which the agent is located into a grid and represents it as a patch. Both turtles and patches have their own attributes. They form a world and are observed from the perspective of an observer [44].
The number growth of construction enterprises is a complex process that evolves over time and there is a game relationship between two different types of construction enterprises, which are often influenced by complex factors that are abstract and difficult to describe by other methods. NetLogo is well-suited to meet the simulation needs of this process.

3.2. Parameter Setting

Combined with the above model analysis, the construction enterprises find projects by moving their locations. Each move is a simulation cycle and the length of each move is called the movement step. The moving process will consume the project cost, but if the project is selected, it will also bring the corresponding project unit profit. The enterprises can be expanded when it reaches a certain threshold. Therefore the movement step, project unit profit, project cost and expansion cost can be defined as independent variables and their values are changeable. The number of two types of construction enterprises is defined as a dependent variable and can be obtained by changing the values of independent variables, so as to indirectly promote the increase in the intention of the construction unit for the use of green building materials in the construction industry. In addition, four control variables are also set, namely, the expansion profit threshold of construction enterprises, the use intention threshold of green building materials, the high-speed growth value and the low-speed growth value of the project. The specific meanings and values are shown in Table 1.

4. Experimental Results and Analysis

The experimental results are shown in the form of axes. The horizontal axis represents the simulation time and the vertical axis represents the number of two types of construction enterprises. The value displayed on the vertical axis represents the maximum number of enterprises reached during the simulation time. Since different values of the parameters affect the evolutionary speed, the time required to reach the evolutionary equilibrium state is not the same either. In order to make the evolutionary behavior more obvious, different simulation periods after reaching the equilibrium state are chosen. The specific experimental results and analysis are as follows.

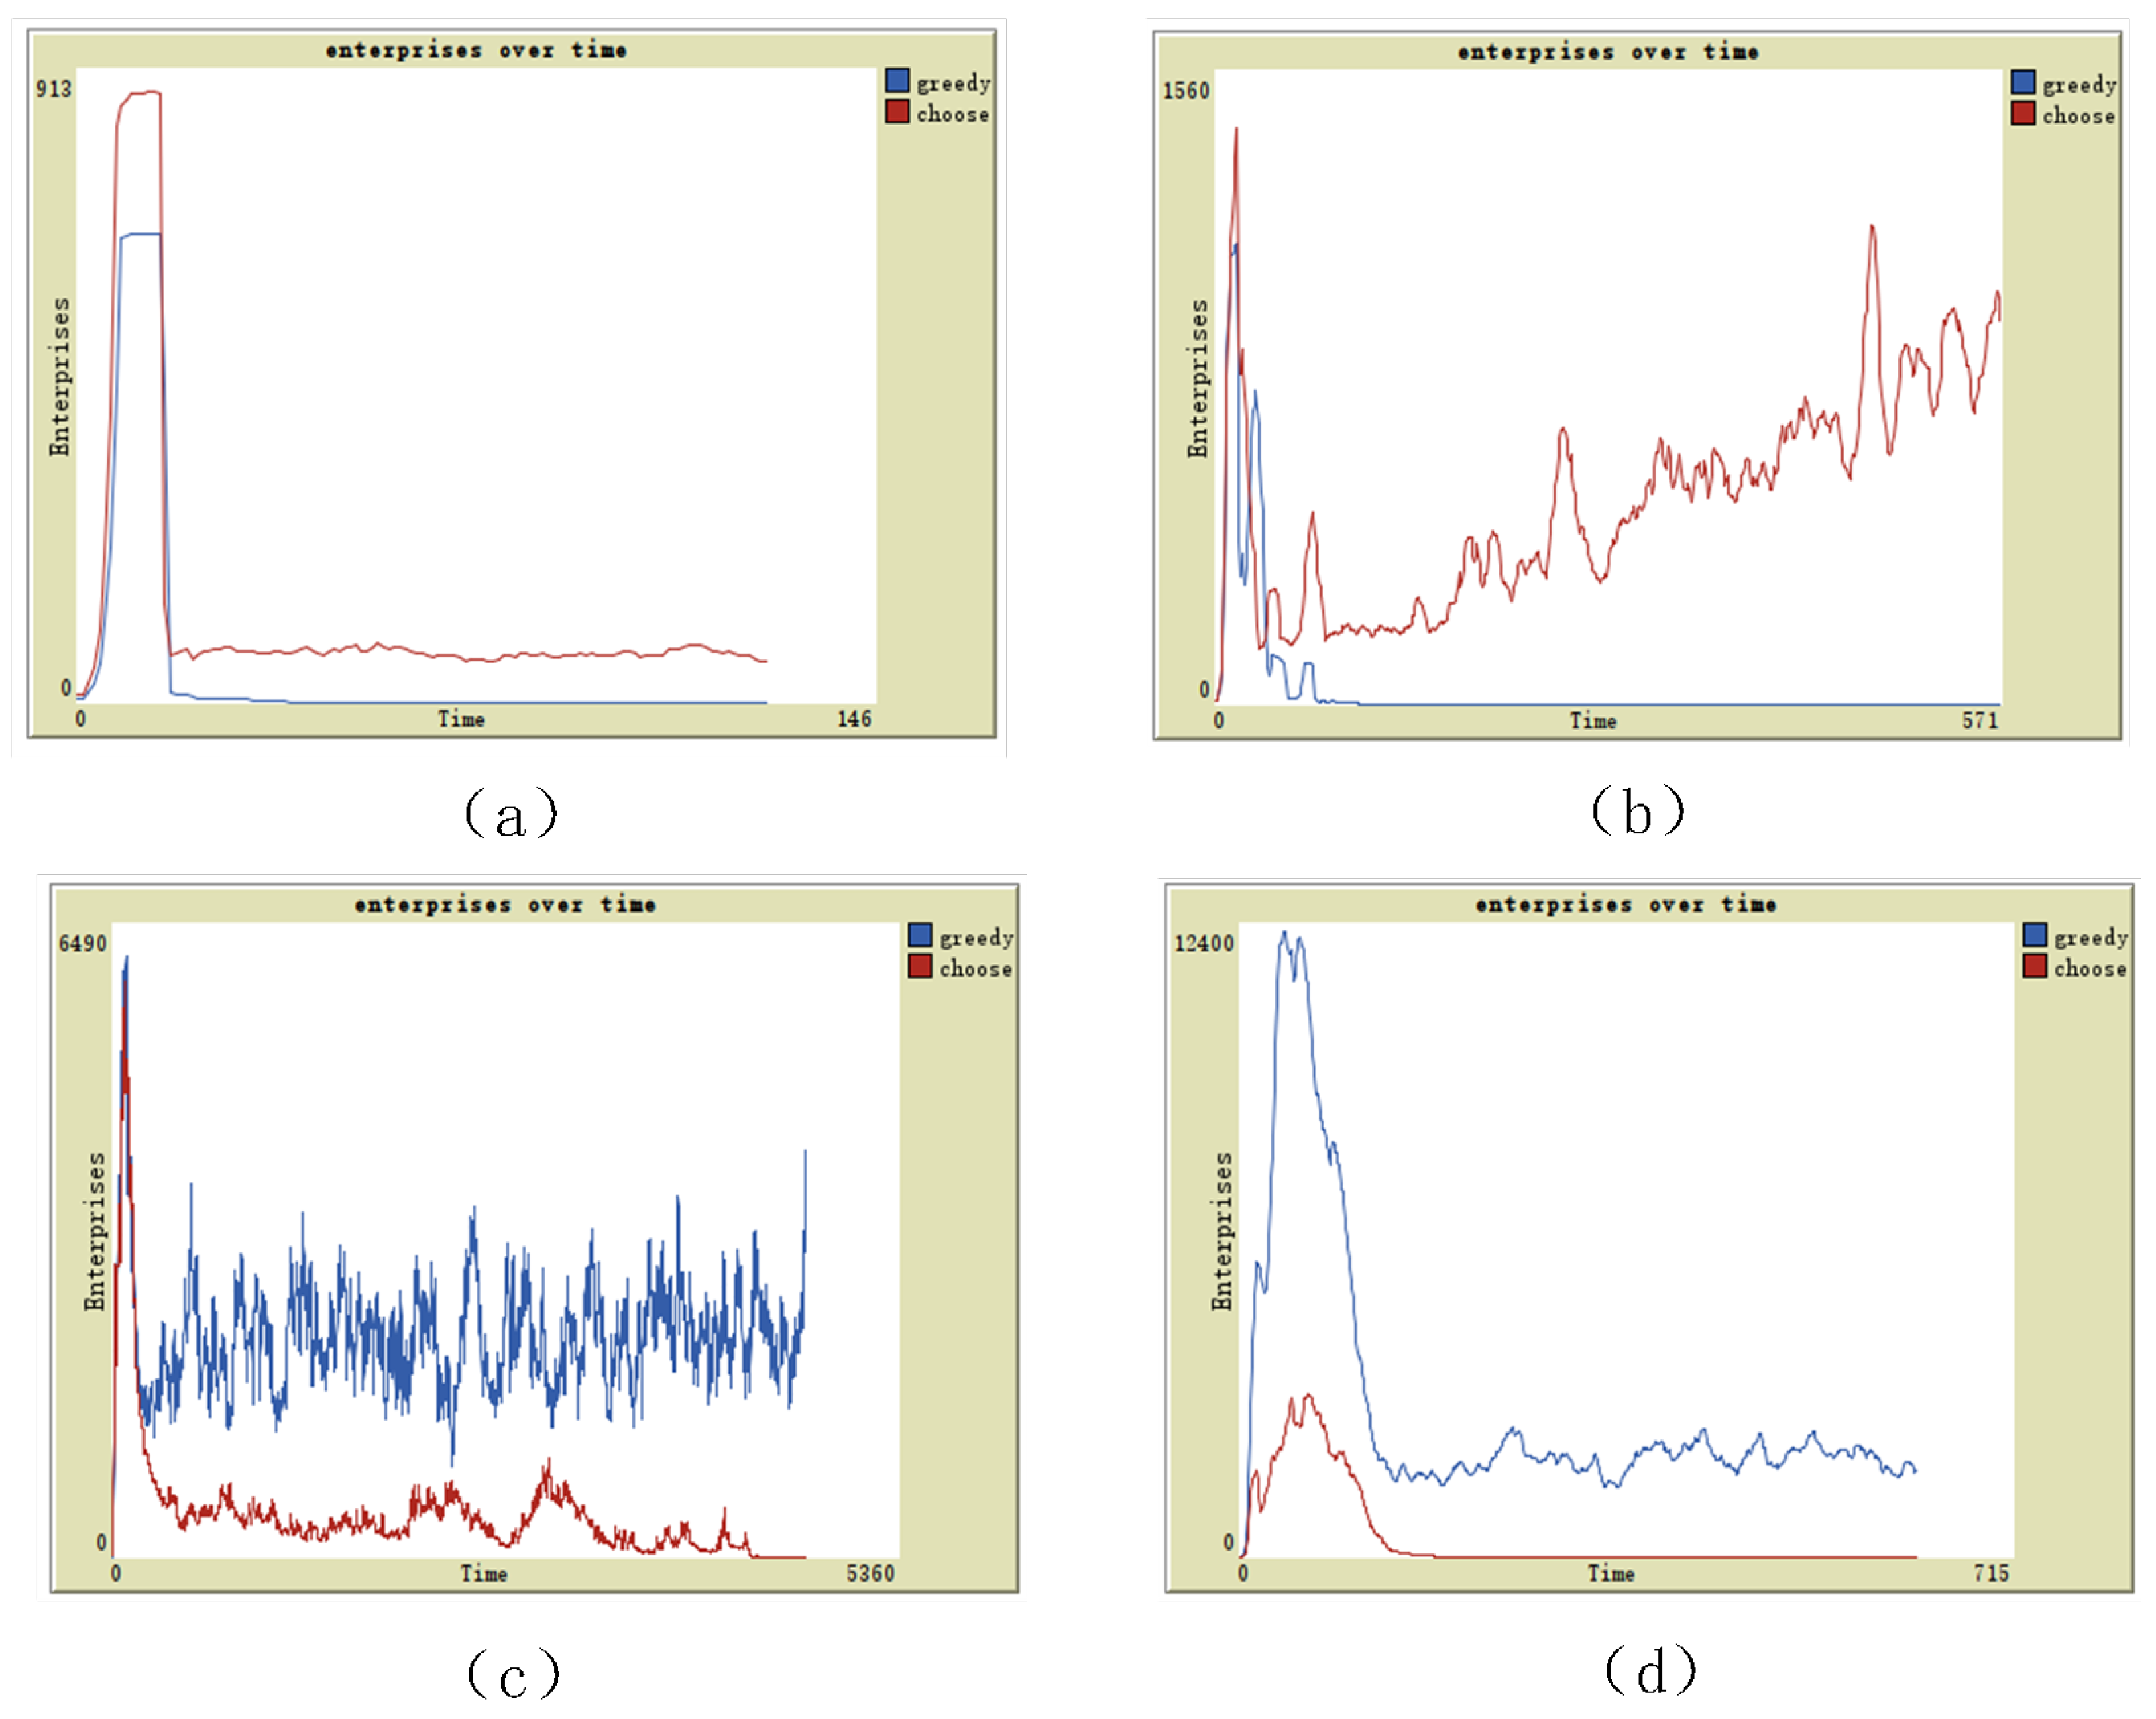
4.1. The Quantitative Evolutionary Behavior of Two Construction Enterprises under Different Movement Steps

The movement step represents the distance that each agent moves in patches. When there is no range of activities at the beginning, greedy construction enterprises will accept the projects they currently have. Since the growth rate of projects is lower than the rate of being accepted, the greedy construction enterprises will eventually all die out. While the selective construction enterprises are the ones that will keep the projects below the threshold of using green building materials. In the long run, the number of selective construction enterprises will remain within a certain range, as shown in Figure 2a. When the movement step begins to increase, although the number of greedy construction enterprises that exist for a short time increases, they all ultimately die out. On the contrary, selective construction enterprises benefit from the principle of reservation for some projects, which makes the advantages outstanding and eventually establishes the project market, as shown in Figure 2b. When the movement step is 0.13, the number of greedy construction enterprises starts to overtake that of selective construction enterprises and the number of both remains relatively stable for a period of time. As the evolutionary cycle increases, the advantage of selective construction enterprises eventually disappears, as shown in Figure 2c. When the movement step is greater than 0.13, the number of greedy construction enterprises is much higher than that of selective construction enterprises, because greedy construction enterprises can continuously expand the range of accepted projects as a way to obtain more profits. While selective construction enterprises are constantly choosing and as the evolutionary cycle increases, the profits obtained eventually do not cover the costs and the enterprises die out, as shown in Figure 2d.
According to the above analysis, conclusion 1 can be drawn: when the movement step exceeds a certain value, it is not conducive to the survival of selective construction enterprises and it is impossible to urge the construction unit to adjust its intention to use green building materials.

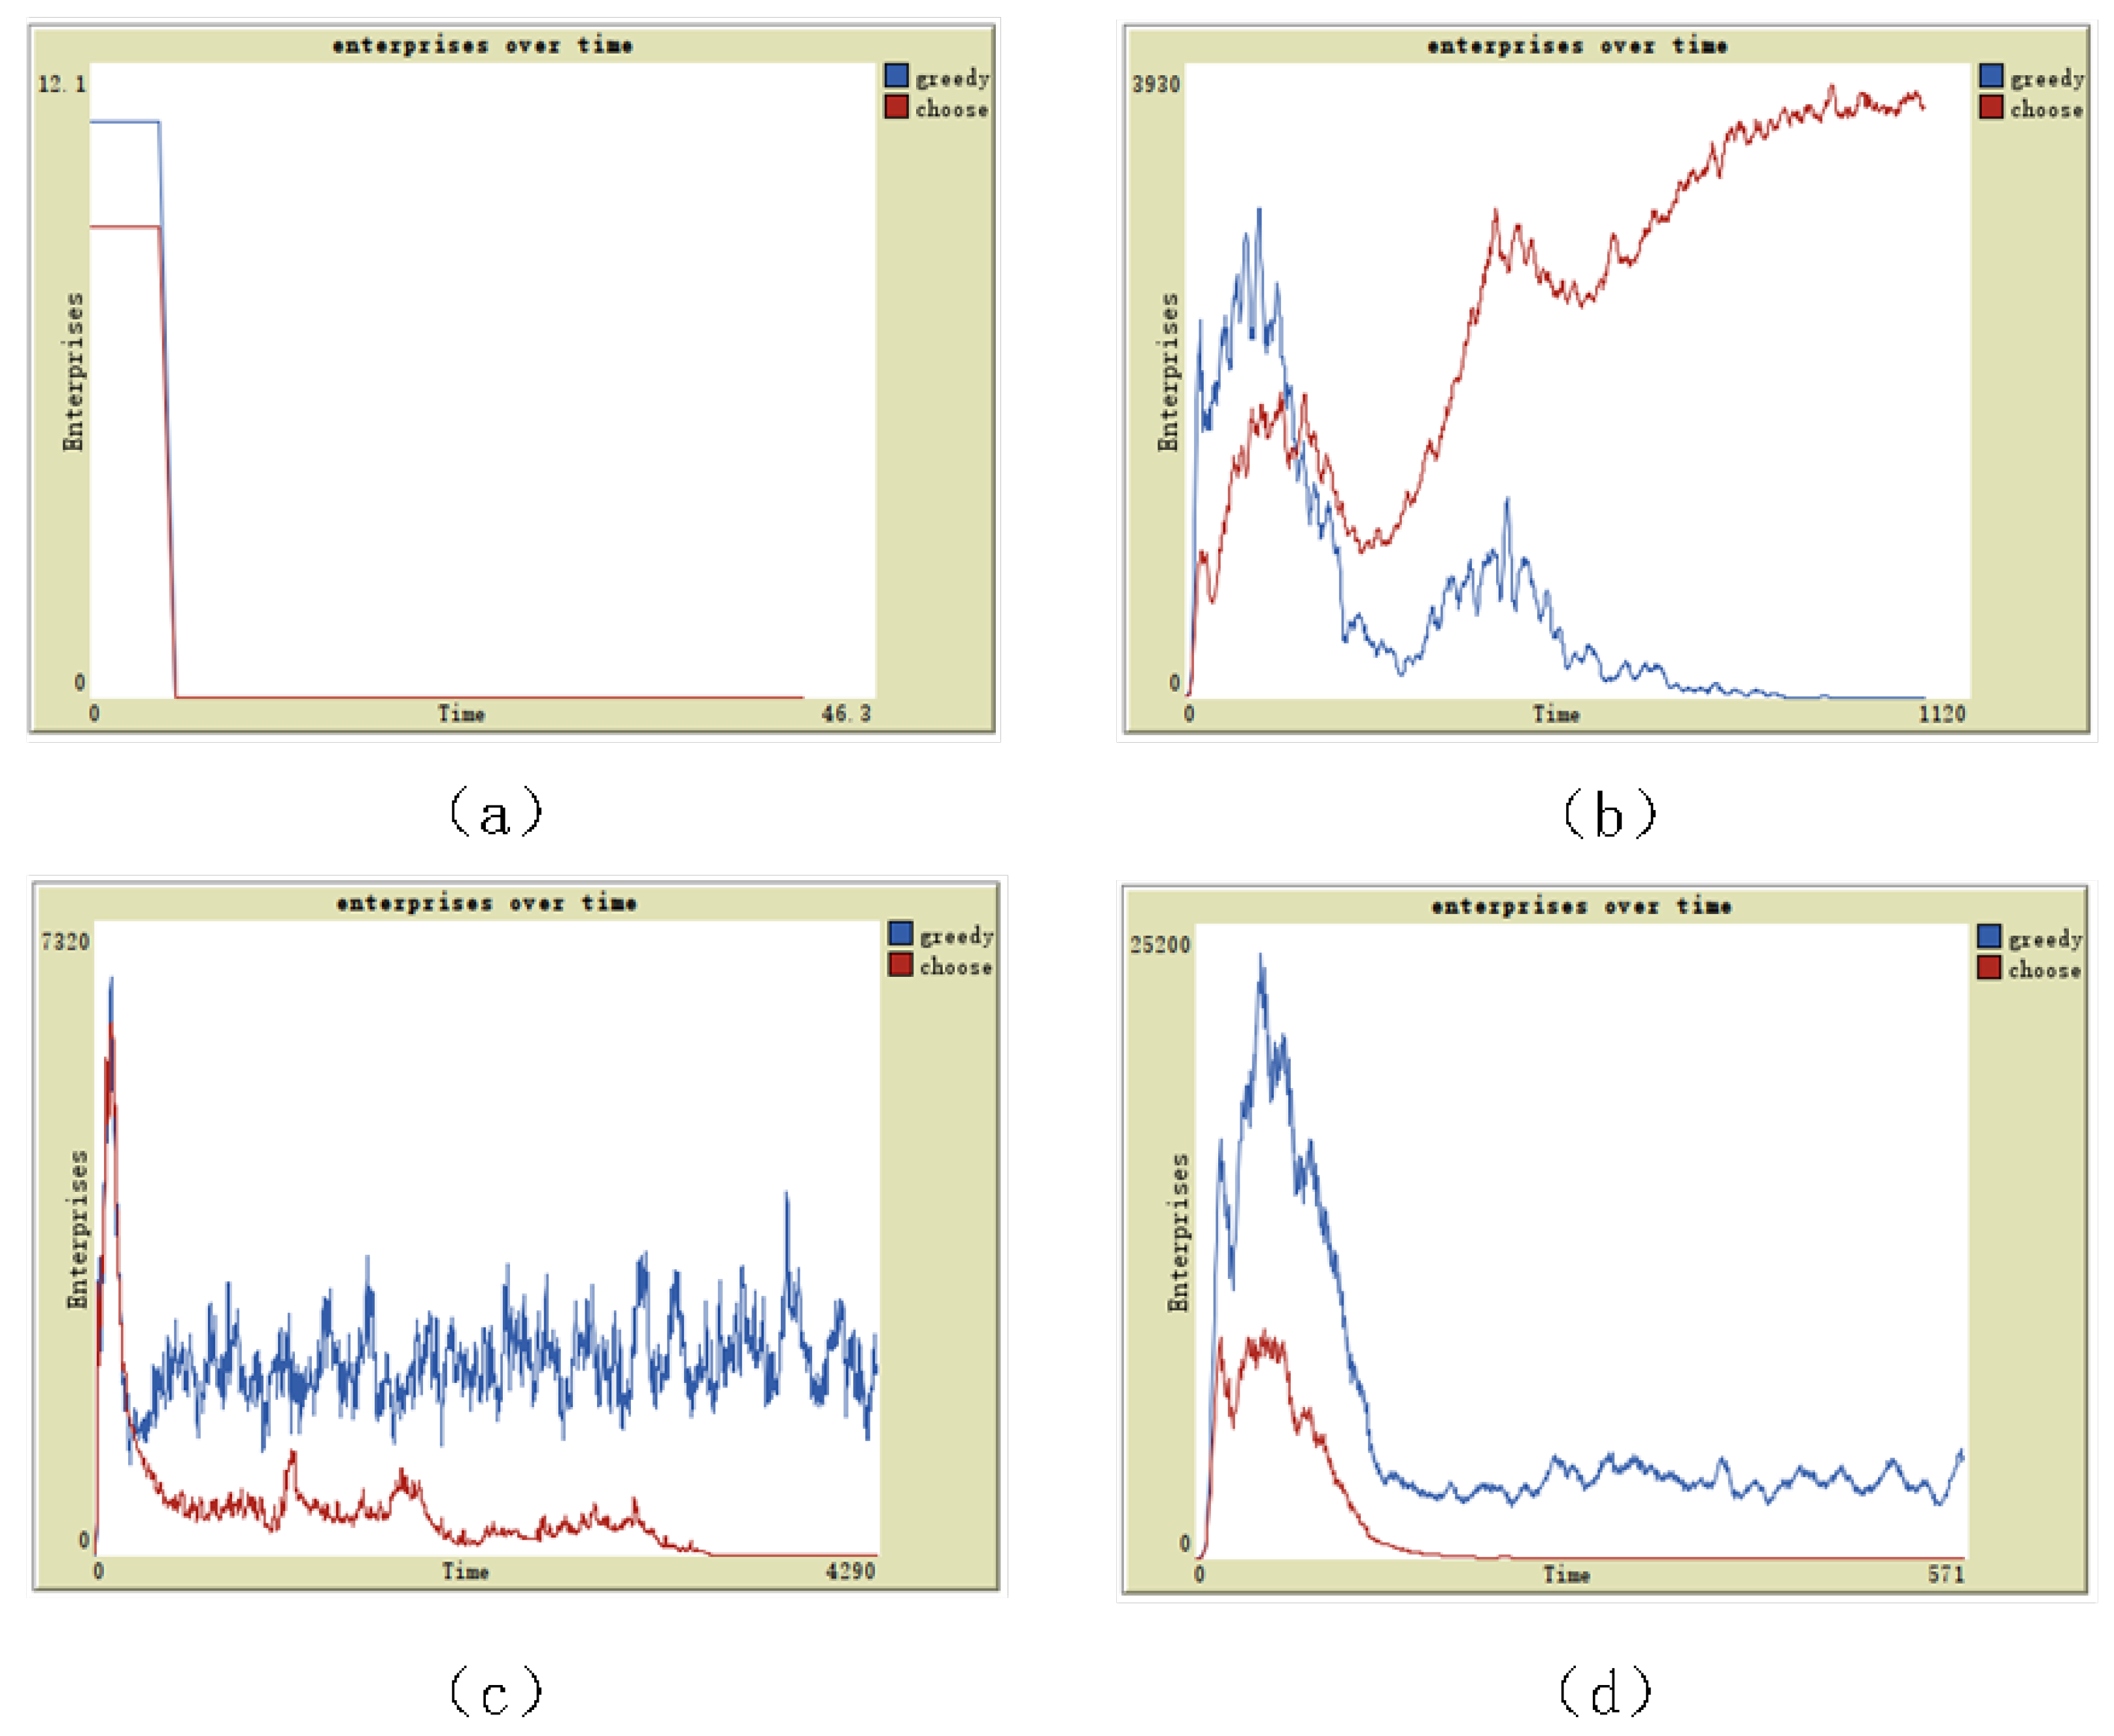
4.2. The Quantitative Evolutionary Behavior of Two Construction Enterprises with a Different Intake of Unit Profit

Profit is the fundamental factor that supports the survival of a construction enterprise. When the profit intake of a construction enterprise is less than the project cost, the enterprise will eventually exhaust its initial assets and die out, as shown in Figure 3a. When the profit of the enterprise is sufficient to cover the project cost, the enterprise starts to develop. In the initial stage, there is a transient overtaking in the number of enterprises because greedy enterprises have no standard for the acceptance of projects. However, the decision of selective enterprises is more conducive to long-term development, so eventually greedy construction enterprises die out and selective construction enterprises possess an absolute advantage, as shown in Figure 3b. As the unit profit value of the project continues to increase to 50, the number of greedy construction enterprises begins to exceed that of selective construction enterprises and the two remain relatively balanced for a long period of time. Eventually, the advantage of selective construction enterprises disappears, as shown in Figure 3c. When the unit profit value of the project is higher than 50, greedy construction enterprises expand with an absolute advantage, while selective projects eventually cease to exist, as shown in Figure 3d.
According to the above analysis, conclusion 2 can be drawn: when the unit project profit is within a reasonable range, selective construction enterprises can play a certain advantage, which is conducive to the long-term development of enterprises.

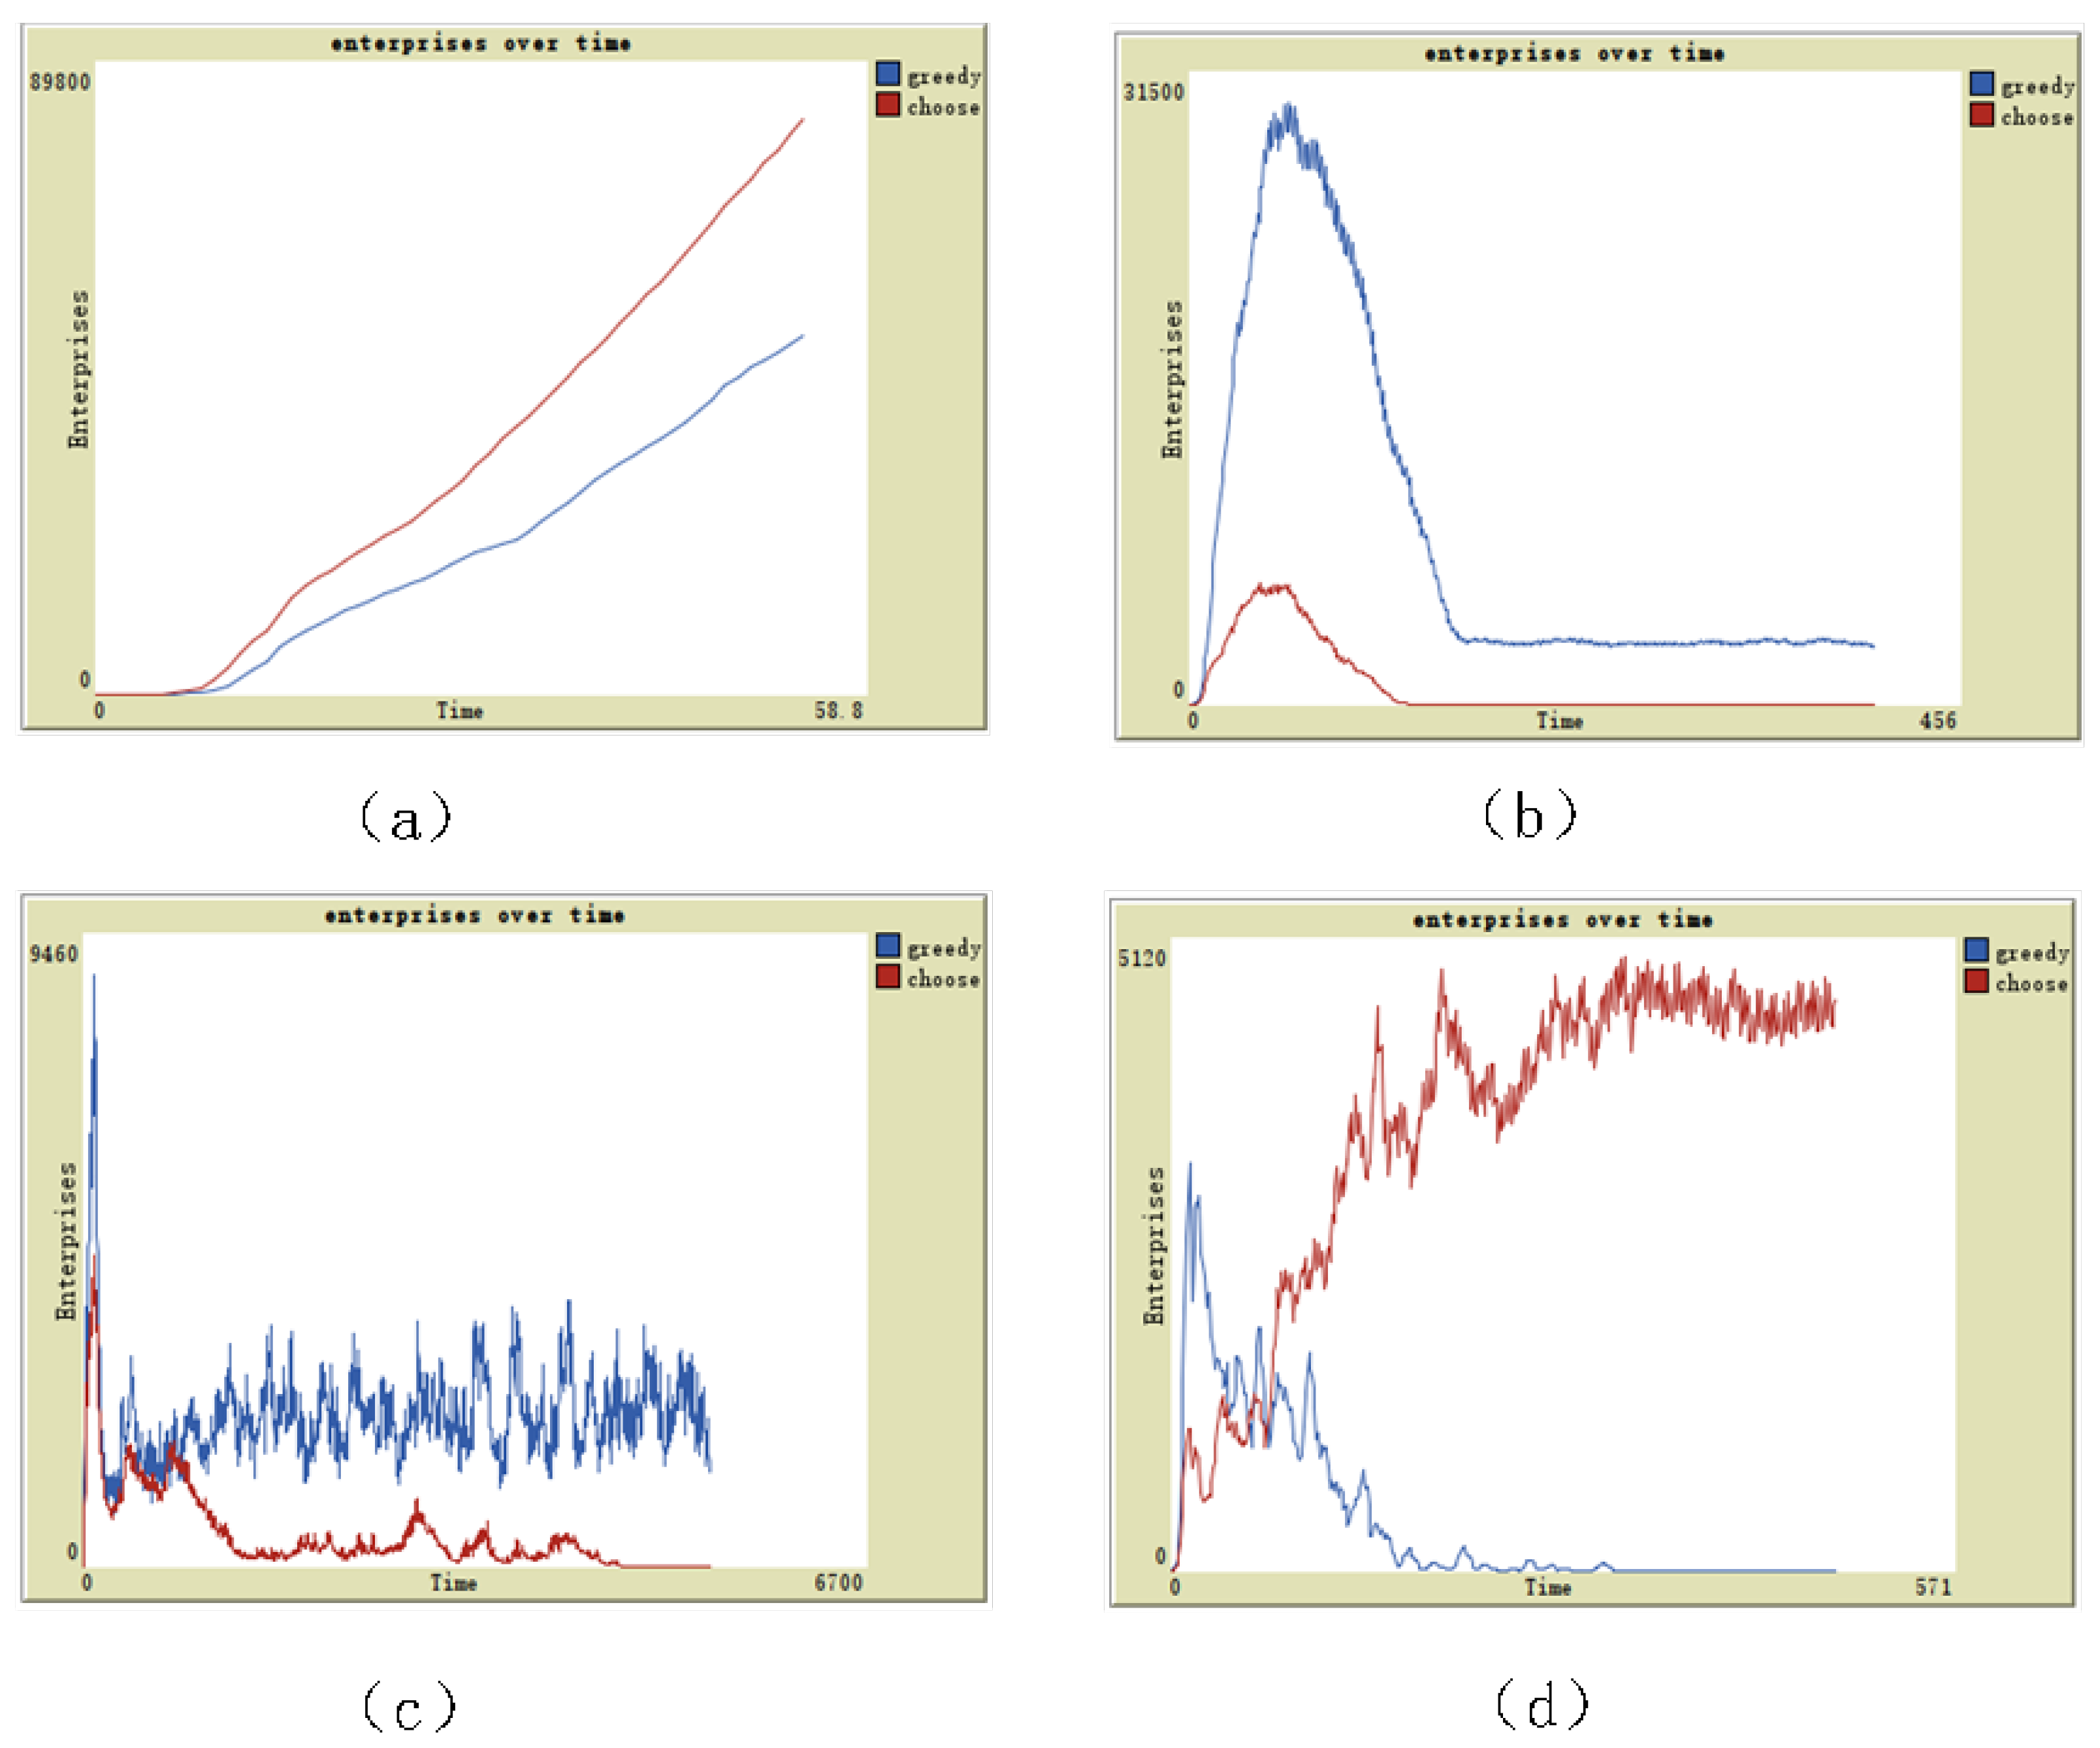
4.3. The Quantitative Evolutionary Behavior of Two Construction Enterprises under Different Project Costs

The project cost determines the final situation of the project profit. When the project cost is 0, only the profit obtained by the project is accepted without expenditure, which is an ideal state, so the number of two types of enterprises all can increase, as shown in Figure 4a. When project costs increase slightly, the number of greedy enterprises increases much faster than selective enterprises at this time, and then tends to become a stable state, while selective construction enterprises show an increase followed by extinction, as shown in Figure 4b. When the project cost increases to about 10, the two types of enterprises tend to be relatively stable after the crossover in the early stage and the number of greedy construction enterprises occupies most of the project market. Eventually, all selective construction enterprises die out, as shown in Figure 4c. When the project cost is greater than 10, the number of selective construction enterprises with prominent advantages shows a rapid growth trend, while the number of greedy construction enterprises finally withdraws from the construction project market after a short period of growth, as shown in Figure 4d.
According to the above analysis, conclusion 3 can be drawn: as the project cost increases, selective construction enterprises can accept more projects and have the potential to occupy the project market when it exceeds a certain range; therefore, the project cost plays a positive role in the development of selective construction enterprises.

4.4. The Quantitative Evolutionary Behavior of Two Construction Enterprises under Different Expansion Costs

Expansion cost is the necessary cost expenditure to be paid for growth in the number of enterprises. When the expansion cost is 0, both types of construction enterprises are in the state of costless growth, so the number rises sharply and the number of greedy construction enterprises will be higher than that of selective construction enterprises in the case of the same initial number of both types of construction enterprises, as shown in Figure 5a. With a small increase in expansion costs, both types of construction enterprises show a trend of increasing and then decreasing before stabilizing. However, at this time, the advantages of selective construction enterprises are not obvious and finally die out after surviving for a period of time with lower numbers, as shown in Figure 5b. When the production cost increases to about 37, the number of construction enterprises of both types begins to fluctuate crosswise and the number is relatively smooth, as shown in Figure 5c. When the expansion cost is greater, the project profit minus the project cost is not enough to support the number of enterprises to continue to increase because the greedy construction enterprises do not consider future development. As a result, the greedy construction enterprises can only gradually go towards extinction. Meanwhile, the selective construction enterprises reflect the obvious survival advantage when the expansion cost is higher, as shown in Figure 5d.
According to the above analysis, conclusion 4 can be drawn: the higher the expansion cost, the less conducive to the development of greedy construction enterprises and the more advantageous it is for selective construction enterprises.

5. Conclusions

By studying the game factors of two different types of construction enterprises accepting projects to gain profits, the number growth behavior of enterprises is obtained. With the idea of agent-based modeling and taking the construction unit’s intention to use green building materials as the criterion, a strategy which is more favorable to the long-term development of selective construction enterprises can be derived. From the overall perspective, it is conducive to increase the use of green building materials in the construction industry. According to the above-mentioned simulation experiment, this paper believes that, regarding the actual status of the current construction industry, if the market can determine an appropriate project acceptance range, set a reasonable project profit target, and control the project cost as well as the enterprise expansion cost, the most favorable strategy for the survival of selective construction enterprises can be selected. This strategy can not only improve the construction unit’s intention for the use of green building materials but also ensure the reasonability of the overall number of construction enterprises. Therefore, the construction enterprises can reasonably plan indicators according to their own conditions, and the construction units should also take the initiative to use green building materials. At the same time, they can also increase some external stimulation, such as the soundness of the government’s reward and punishment policy on the use of green building materials, so as to improve the green building materials market in the construction industry in many ways.
Due to the simplification of the model, the following issues remain to be studied: (1) This paper only considers the intention of construction units to use green building materials as the criterion to explore the growth of the number of the two types of enterprises and whether the trend caused by the influencing factors remains consistent if other criteria are added. (2) In this model, the moving range of the enterprise is used to change the behavior of the enterprise, and what other variables will have such an impact. (3) If the behavior of construction enterprises is fixed, what will be the game result for two types of construction enterprises if they learn independently through the construction project generation situation of the construction industry. Therefore, how to improve the market share of green building materials with more influencing factors and closer to the actual situation will be the next research direction.

Author Contributions

Conceptualization, Y.L., Y.S. and C.Z.; methodology, Y.S. and Y.G.; software, Y.S.; validation, Y.L., Y.S. and C.Z.; formal analysis, Y.L., Y.S. and J.L.; investigation, Y.S. and C.Z.; resources, Y.S. and C.Z.; data curation, Y.S.; writing—original draft preparation, Y.S.; writing—review and editing, Y.L., Y.S., C.Z. and J.L.; visualization, Y.S.; supervision, Y.L., C.Z. and J.L.; funding acquisition, Y.L. and H.L. All authors have read and agreed to the published version of the manuscript.

Funding

This research was funded by the Key R & D Plan of National Science and Technology Program Application Center grant number 2019YFC1605306, Beijing Natural Science Foundation and Fengtai Rail Transit Frontier Research Joint Fund grant number L191009, the Scientific Research Program of Beijing Municipal Education Commission grant number KZ202110011017, National Natural Science Foundation of China grant number 61877002.

Institutional Review Board Statement

Not applicable.

Data Availability Statement

The code used during the simulation study are available in the file “SY_building” in the author’s GitHub repository: https://github.com/DissertationResources/SY_building.git (accessed on 12 September 2022).

Conflicts of Interest

The authors declare no conflict of interest.

References

  1. Pham, A.D.; Nguyen, Q.T.; Luong, D.L.; Truong, Q.C. The Development of a Decision Support Model for Eco-Friendly Material Selection in Vietnam. Sustainability 2020, 12, 2769. [Google Scholar] [CrossRef] [Green Version]
  2. Li, X.W.; Li, J.R.; Huang, Y.C.; He, J.R.; Liu, X.; Dai, J.C.; Shen, Q. Construction enterprises’ adoption of green development behaviors: An agent-based modeling approach. Humanit. Soc. Sci. Commun. 2022, 9, 244. [Google Scholar] [CrossRef]
  3. Benachio, G.L.F.; Freitas, M.D.D.; Tavares, S.F. Circular economy in the construction industry: A systematic literature review. J. Clean. Prod. 2020, 260, 121046. [Google Scholar] [CrossRef]
  4. Shen, Y.Y.; Faure, M. Green building in China. Int. Environ. Agreem.-Politics Law Econ. 2021, 21, 183–199. [Google Scholar] [CrossRef]
  5. Venkataraman, V.; Cheng, J.C.P. Critical Success and Failure Factors for Managing Green Building Projects. J. Archit. Eng. 2018, 24, 04018025. [Google Scholar] [CrossRef]
  6. Richter, T.J.; Soliva, E.; Haase, M.; Wrase, I. Corporate real estate and green building: Prevalence, transparency and drivers. J. Corp. Real Estate 2011. [Google Scholar] [CrossRef]
  7. Chen, L.Y.; Chan, A.P.C.; Darko, A.; Gao, X. Spatial-temporal investigation of green building promotion efficiency: The case of China. J. Clean. Prod. 2022, 362, 132299. [Google Scholar] [CrossRef]
  8. Chen, L.Y.; Gao, X.; Gong, S.T.; Li, Z. Regionalization of Green Building Development in China: A Comprehensive Evaluation Model Based on the Catastrophe Progression Method. Sustainability 2020, 12, 5988. [Google Scholar] [CrossRef]
  9. Li, H.; Zheng, Y.; Wu, X.; Cai, Q. 3D Model Generation and Reconstruction Using Conditional Generative Adversarial Network. Int. J. Comput. Intell. Syst. 2019, 12, 697–705. [Google Scholar] [CrossRef] [Green Version]
  10. Zeng, G.; Li, H.; Wang, X.; Li, N. Point cloud up-sampling network with multi-level spatial local feature aggregation. Comput. Electr. Eng. 2021, 94, 107337. [Google Scholar] [CrossRef]
  11. Zheng, Y.; Zeng, G.; Li, H.; Cai, Q.; Du, J. Colorful 3D reconstruction at high resolution using multi-view representation. J. Vis. Commun. Image Represent. 2022, 85, 103486. [Google Scholar] [CrossRef]
  12. Li, X.W.; He, J.R.; Huang, Y.C.; Li, J.R.; Liu, X.; Dai, J.C. Predicting the factors influencing construction enterprises’ adoption of green development behaviors using artificial neural network. Humanit. Soc. Sci. Commun. 2022, 9, 238. [Google Scholar] [CrossRef]
  13. Lung, L.; Shaurette, M. Working collaboratively in design and construction to encourage green building construction for Peru. Rev. Ing. De Constr. 2018, 33, 183–192. [Google Scholar] [CrossRef] [Green Version]
  14. Gomez, C.P.; Yung, G.T.T. Housing Industry Readiness Factors and Indicators to Implement Green Building Development. Int. J. Sustain. Constr. Eng. Technol. 2018, 9, 44–57. [Google Scholar] [CrossRef]
  15. Huang, N.; Bai, L.B.; Wang, H.L.; Du, Q.; Shao, L.; Li, J.T. Social Network Analysis of Factors Influencing Green Building Development in China. Int. J. Environ. Res. Public Health 2018, 15, 2684. [Google Scholar] [CrossRef] [Green Version]
  16. Han, Y.L.; He, T.Z.; Chang, R.D.; Xue, R. Development Trend and Segmentation of the US Green Building Market: Corporate Perspective on Green Contractors and Design Firms. J. Constr. Eng. Manag. 2020, 146, 05020014. [Google Scholar] [CrossRef]
  17. Ding, Z.K.; Fan, Z.; Tam, V.W.Y.; Bian, Y.; Li, S.H.; Illankoon, I.; Moon, S. Green building evaluation system implementation. Build. Environ. 2018, 133, 32–40. [Google Scholar] [CrossRef]
  18. Kar, S.; Jha, K.N. Assessing criticality of construction materials for prioritizing their procurement using ANP-TOPSIS. Int. J. Constr. Manag. 2022, 22, 1852–1862. [Google Scholar] [CrossRef]
  19. Wang, S.; Tae, S.; Kim, R. Development of a Green Building Materials Integrated Platform Based on Materials and Resources in G-SEED in South Korea. Sustainability 2019, 11, 6532. [Google Scholar] [CrossRef] [Green Version]
  20. Wang, H.; Chiang, P.C.; Cai, Y.; Li, C.; Wang, X.; Chen, T.L.; Wei, S.; Huang, Q. Application of Wall and Insulation Materials on Green Building: A Review. Sustainability 2018, 10, 3331. [Google Scholar] [CrossRef]
  21. Liu, Z.R.; Guo, A. Application of Green Building Materials and Multi-objective Energy-Saving Optimization Design. Int. J. Heat Technol. 2021, 39, 299–308. [Google Scholar] [CrossRef]
  22. Echeverria, C.A.; Ozkan, J.; Pahlevani, F.; Willcox, M.; Sahajwalla, V. Effect of hydrothermal hot-compression method on the antimicrobial performance of green building materials from heterogeneous cellulose wastes. J. Clean. Prod. 2021, 280, 124377. [Google Scholar] [CrossRef]
  23. Ji, Y. Insulation effect evaluation model of green building materials under ecological environment. Glob. Nest J. 2020, 22, 623–631. [Google Scholar] [CrossRef]
  24. Jiang, H.Y. Research on ecological green building supply chain management model. Fresenius Environ. Bull. 2021, 30, 1749–1755. [Google Scholar]
  25. Zeng, X.C.; Li, S.C.; Yin, S.; Xing, Z.Y. How Does the Government Promote the Collaborative Innovation of Green Building Projects? An Evolutionary Game Perspective. Buildings 2022, 12, 1179. [Google Scholar] [CrossRef]
  26. Yang, S.; Su, Y.; Wang, W.; Hua, K. Research on Developers’ Green Procurement Behavior Based on the Theory of Planned Behavior. Sustainability 2019, 11, 2949. [Google Scholar] [CrossRef] [Green Version]
  27. Bohari, A.A.M.; Skitmore, M.; Xia, B.; Teo, M.; Khalil, N. Key stakeholder values in encouraging green orientation of construction procurement. J. Clean. Prod. 2020, 270, 122246. [Google Scholar] [CrossRef]
  28. Ajayi, S.O.; Oyedele, L.O. Waste-efficient materials procurement for construction projects: A structural equation modelling of critical success factors. Waste Manag. 2018, 75, 60–69. [Google Scholar] [CrossRef] [PubMed]
  29. Jalaei, F.; Masoudi, R.; Guest, G. A framework for specifying low-carbon construction materials in government procurement: A case study for concrete in a new building investment. J. Clean. Prod. 2022, 345, 131056. [Google Scholar] [CrossRef]
  30. Khahro, S.H.; Kumar, D.; Siddiqui, F.H.; Ali, T.H.; Raza, M.S.; Khoso, A.R. Optimizing Energy Use, Cost and Carbon Emission through Building Information Modelling and a Sustainability Approach: A Case-Study of a Hospital Building. Sustainability 2021, 13, 3675. [Google Scholar] [CrossRef]
  31. Ishak, N.I.; Kamal, E.M.; Yusof, N. The Green Manufacturer’s Compliance With Green Criteria Throughout the Life Cycle of Building Material. Sage Open 2017, 7, 2158244017725446. [Google Scholar] [CrossRef]
  32. Zhao, A.; Wang, J.; Sun, Z.; Guan, H. Research on the Evolutionary Path of Eco-Conservation and High-Quality Development in the Yellow River Basin Based on an Agent-Based Model. Systems 2022, 10, 105. [Google Scholar] [CrossRef]
  33. Revay, P.; Cioffi-Revilla, C. Survey of evolutionary computation methods in social agent-based modeling studies. J. Comput. Soc. Sci. 2018, 1, 115–146. [Google Scholar] [CrossRef]
  34. Jager, G. Replacing Rules by Neural Networks A Framework for Agent-Based Modelling. Big Data Cogn. Comput. 2019, 3, 51. [Google Scholar] [CrossRef] [Green Version]
  35. Choi, T.; Park, S. Theory building via agent-based modeling in public administration research: Vindications and limitations. Int. J. Public Sect. Manag. 2021, 34, 614–629. [Google Scholar] [CrossRef]
  36. Hunter, E.; Mac Namee, B.; Kelleher, J. A Hybrid Agent-Based and Equation Based Model for the Spread of Infectious Diseases. Jasss- J. Artif. Soc. Soc. Simul. 2020, 23, 14. [Google Scholar] [CrossRef]
  37. Cheng, L.H.; Guo, H.M.; Lin, H.F. Evolutionary model of coal mine safety system based on multi-agent modeling. Process Saf. Environ. Prot. 2021, 147, 1193–1200. [Google Scholar] [CrossRef]
  38. Delcea, C.; Cotfas, L.A.; Bradea, I.A.; Bolos, M.I.; Ferruzzi, G. Investigating the Exits’ Symmetry Impact on the Evacuation Process of Classrooms and Lecture Halls: An Agent-Based Modeling Approach. Symmetry 2020, 12, 627. [Google Scholar] [CrossRef] [Green Version]
  39. Carbo, J.; Sanchez-Pi, N.; Molina, J.M. Agent-based simulation with NetLogo to evaluate ambient intelligence scenarios. J. Simul. 2018, 12, 42–52. [Google Scholar] [CrossRef]
  40. Antczak, T.; Weron, R.; Zabawa, J. Data-Driven Simulation Modeling of the Checkout Process in Supermarkets: Insights for Decision Support in Retail Operations. IEEE Access 2020, 8, 228841–228852. [Google Scholar] [CrossRef]
  41. Ionescu, S.; Nica, I.; Chirita, N. Cybernetics Approach Using Agent-Based Modeling in the Process of Evacuating Educational Institutions in Case of Disasters. Sustainability 2021, 13, 277. [Google Scholar] [CrossRef]
  42. Wang, Y.R.; Yao, X.C.; Song, L.; Zhang, S.J. The Behaviour and Influence Mechanism of the Subject of IUR Collaborative Innovation: A Simulation Study Based on NetLogo. Discret. Dyn. Nat. Soc. 2022, 2022, 5863533. [Google Scholar] [CrossRef]
  43. Raoufi, M.; Fayek, A.R. Fuzzy Agent-Based Modeling of Construction Crew Motivation and Performance. J. Comput. Civ. Eng. 2018, 32, 04018035. [Google Scholar] [CrossRef]
  44. Zhao, N.; Chong, H.Y.; Li, Q. Agent-based modelling of helping behaviour diffusion in project teams as an evolutionary process. J. Simul. 2022. [Google Scholar] [CrossRef]
Figure 1. The interaction between the construction enterprise and the project.
Sustainability 14 12773 g001
Figure 2. The quantitative evolutionary behavior of two construction enterprises under different movement steps. The values of the independent variables for each graph are taken as follows: (a) L = 0 ; (b) L = 0.05 ; (c) L = 0.13 ; and (d) L = 0.17 .
Sustainability 14 12773 g002
Figure 3. The quantitative evolutionary behavior of two construction enterprises with a different intake of unit profit. The values of the independent variables for each graph are taken as follows: (a) P = 7 ; (b) P = 35 ; (c) P = 50 ; and (d) P = 60 .
Sustainability 14 12773 g003
Figure 4. The quantitative evolutionary behavior of two construction enterprises under different project costs. The values of the independent variables for each graph are taken as follows: (a) C s = 0 ; (b) C s = 7 ; (c) C s = 10 ; and (d) C s = 13 .
Sustainability 14 12773 g004
Figure 5. The quantitative evolutionary behavior of two construction enterprises under different expansion costs. The values of the independent variables for each graph are taken as follows: (a) C p r o d = 0 ; (b) C p r o d = 35 ; (c) C p r o d = 37 ; and (d) C p r o d = 47 .
Sustainability 14 12773 g005
Table 1. Parameter setting.
Parameter SettingMeaningValueAssignment Rule
N 0 Total number of initial businesses[0, 100]Initialize settings, N 0 = 20
μ The possibility of becoming a selective construction enterprise[0, 1]Initialize settings, μ = 0.5
C s Project costs[0, 99]Depends on the experimental situation
LMove step length[0, 0.3]Depends on the experimental situation
PUnit profit of the project for the enterprise[0, 200]Depends on the experimental situation
IThreshold of construction unit’s intention to use green building materials[0, 99]Initialize settings, I = 30
V p r o d Profit thresholds to be reached for construction company expansion[0, 200]Initialize settings, V p r o d = 100
C p r o d Construction enterprise expansion costs[0, 99]Depends on the experimental situation
α High rate of project growth[0, 99]Initialize settings, α = 80
β Low rate of project growth[0, 99]Initialize settings, β = 20
Publisher’s Note: MDPI stays neutral with regard to jurisdictional claims in published maps and institutional affiliations.

