Article

Metabolomic and Transcriptomic Analyses of Lycium barbarum L. under Heat Stress

1
Wolfberry Science Institute, Ningxia Academy of Agriculture and Forestry Sciences, National Wolfberry Engineering Research Center, Yinchuan 750002, China
2
College of Life Sciences, Northwest A&F University, Yangling 712100, China
*
Authors to whom correspondence should be addressed.
Sustainability 2022, 14(19), 12617; https://doi.org/10.3390/su141912617
Submission received: 3 August 2022 / Revised: 21 September 2022 / Accepted: 30 September 2022 / Published: 4 October 2022
(This article belongs to the Section Air, Climate Change and Sustainability)

Abstract

:
Heat stress has a strong and detrimental effect on plant growth and yield. Goji berry or wolfberry (Lycium barbarum L.) is a dual-purpose medicinal and food plant but an increase in high temperatures has caused a serious decline in wolfberry yield and quality. In this study, we first explored the heat stress responses of Goji berry, and found that heat stress adaptation mechanisms fluctuated over 48 h. Moreover, L. barbarum 1402 was more heat resistant while L. barbarum Ningqi No. 7 (N7) was sensitive to high temperatures, in which amino acids and alkaloids played key roles; expression and accumulation timing was also crucial. That is, 1402 responded to heat stress rapidly starting at 1 h under high temperature, activated related genes, and accumulated metabolites earlier in the amino acid metabolic pathway compared to N7, which responded to heat stress starting at 3 h under high temperature. Thus, 1402 resisted high temperatures much earlier and better compared to N7. Furthermore, joint transcriptome and metabolome analysis results showed that L-phenylalanine, L-tyrosine, N-benzylformamide, N-benzylmethylene isomethylamine, lysoPC 19:1, and N-acetyl-D-glucosamine-1-phosthate, as well as their related genes, were higher in content, or earlier in expression, in 1402 compared to N7 under heat treatment. This study initially elucidates that Goji berry 1402 has a better tolerance to heat stress than N7 for earlier and higher expression or accumulation of amino acids and alkaloids when related to high temperatures.

1. Introduction

Global temperatures are rising constantly as the climate continues to change, thus causing global warming. Resultantly, the global mean air temperature is expected to increase by 4–6 °C by the year 2100 and many areas are likely to experience temperatures higher than this global average [1,2,3]. High temperatures can severely affect crop productivity, which is perceived as an imminent threat to agricultural crops [4,5].
Plants are unable to move to different environments to avoid or escape eco-environmental stresses [6]. Therefore, plants have to be affected by abiotic stress, such as high temperatures, during their life [7]. Heat stress can induce strong negative impacts in plants at any point during their lifecycle [8,9]. A wide range of physiological functions are affected by high temperature, such as photosynthesis, transpiration, chlorophyll biosynthetic inhibition, membrane thermostability, and ion and osmotic homeostasis [10,11,12,13]. Heat stress disturbs biochemical development, alters enzymatic and non-enzymatic defense systems, and disrupts the general stability of metabolic mechanisms; thus, it ultimately causes an over-production of reactive oxygen species and oxidative stress [14,15,16]. Additionally, short-term exposure to extremely high temperatures (e.g., 45 °C) can release cytochrome c, induce caspase-like enzyme production, and ultimately cause programmed cell death (PCD) [17,18].
During their evolutionary history, plants have developed defense mechanisms to withstand stressful conditions [19]. The accumulation of metabolites, such as sugars, amino acids, and betaines is an important strategy to cope with high temperatures [20]. For example, phenylalanine synthesis is inhibited by high temperatures in cowpea cells, since one or more phenylalanine biosynthetic pathway enzymes are thermolabile. Simultaneously, the first enzyme in the Escherichia coli histidine biosynthesis pathway is 10 times more sensitive to feedback inhibition at 20 °C than at 37 °C [21]. It is conceivable that heat shock results in histidine biosynthetic pathway feedback control relaxation in cowpea cells [22]. At the model plant transcriptional level, heat stress response mechanisms have gradually been outlined [23]. For instance, a succession of heat shock protein (HSP) and heat shock transcription factor (HSF) genes are expressed when plants are subjected to heat stress. Both HSFs and HSPs play central roles in heat stress responses, and HSFs and HSPs therefore act synergistically to confer heat stress resistance, in contrast to the overexpression of a single HSF or HSP gene, which weakly influence thermotolerance [24,25].
Over the last decade, plant heat stress response mechanisms have mostly been studied in model plants, for example, Arabidopsis, tomato, rice, and maize. However, research about non-model plants are rarely studied, including forestry trees and agricultural crops. All the while, high temperatures have resulted in devastating crop yield damage. Therefore, non-model plant studies are urgently needed to enhance our current understanding of heat stress regulation networks [24,26,27,28].
Wolfberry, L. barbarum, a woody genus of the Solanaceae family, which is distributed among the northern and southern hemispheres, is a dual-purpose medicinal and food plant, with effects that include nourishing the liver to improve visual acuity, enhancing immunity, and anti-tumor and antioxidant effects, and its global demand has increased [29,30]. However, high temperatures have caused a decline in wolfberry yield and quality, and have caused a more frequent occurrence of pests and diseases, which have seriously affected wolfberry development. The molecular mechanism underpinning heat stress resistance in wolfberry is still unclear. Therefore, studying wolfberry high-temperature stress resistance mechanisms has important theoretical significance for improving wolfberry heat resistance, which is urgently needed in the development of the wolfberry industry. In this study, we choose L. barbarum Ningqi No. 7 (N7) and 1402 as research materials, to explore the transcriptome- and metabolome-level differences between the two wolfberry cultivars when exposed to heat stress. Moreover, N7 and 1402 are both developed by Qin ken. N7 was developed in 2010, which has the advantages of self-cross affinity, large fruit size, easy drying, good color, and quality. The 1402 cultivar was developed in 2018, with excellent advantages of heat tolerance, ease of flowering, large fruit, good taste, and high yield. The differentially expressed genes and metabolites were analyzed and filtered in response to heat stress in N7 and 1402. With these results, the mechanism of resistance to high temperatures in wolfberry could be revealed for the first time, as well as simultaneously identifying the key players, both of which will improve our understanding of tolerance to heat stress in wolfberry.

2. Materials and Methods

2.1. Plant Materials and Growth Conditions

L.barbarum N7 and 1402 seedlings were used in the experiments and were cultured from wolfberry twig tissues. The wolfberry twigs were placed into the substrate, which consisted of a soil and vermiculite mix. Hereafter, twigs were transferred into an artificial climate chamber with a 10 h light/14 h dark photoperiod; the temperature was held constant at 25 °C.

2.2. Phenotype Characterization

The high temperature tolerance of each wolfberry cultivar (N7 and 1402) was experimentally determined after the twigs acclimatized for a few days. The N7 and 1402 seedlings were placed in different artificial climate chambers with different temperatures, namely 25 °C for the control group and 42 °C for the experimental group. The temperature was chosen according to that which has previously been used for maize studies. Hereafter, samples and pictures were taken at different times [31].

2.3. Chlorophyll Content Measurement

A chlorophyll extract solution was prepared in advance, consisting of an aqueous solution containing 95% acetone/ethanol (2:1 [v/v]). Sample chlorophyll content was determined by firstly dispensing 1 mL of the solution into a 1.5 mL EP tube for use. Hereafter, leaves were ground into a powder with liquid nitrogen and about 100 mg of plant tissue was weighed and added to the 1.5 mL EP tube, followed by thorough mixing. The extract was then centrifuged at 12,000 r/min for 1 min, after which the absorbance of the supernatant was measured at 645 nm and 663 nm, indicating the concentration of chlorophyll A and chlorophyll B, respectively. Finally, chlorophyll content was calculated per unit of fresh leaf weight. The formula used was the chlorophyll content (mg/g FW) = (20.21 × A645 + 8.02 × A663) × volume of extraction liquid × dilution ratio/sample quality [32].

2.4. RNA Extraction

Total RNA was extracted from detached leaves by using the Trizol reagent (Invitrogen, USA) according to the manufacturer’s instructions. The extracted total RNA was treated with RNase-free DNase I (Thermo Scientific, Waltham, MA, USA) to remove any trace amounts of DNA contamination. Next, the extracted RNA quality and quantity were checked using a NanoPhotometer® spectrophotometer (IMPLEN, Los Angeles, CA, USA).

2.5. Transcriptome Detection and Measurement

Total RNA was first quantified and qualified, after which a library was prepared for transcriptome sequencing. The volume of RNA is 1 µg, which was used as input material of every sample. In detail, poly-T oligo-attached magnetic beads were used to purify total RNA to mRNA. Fragmentation was then carried out in a NEB Next First Strand Synthesis Reaction Buffer (5×) using divalent cations under an elevated temperature. Next, first strand cDNA was synthesized by a M-MuLV Reverse Transcriptase (RNase H-) and a random hexamer primer. Second strand cDNA synthesis was subsequently performed by DNA Polymerase I and RNase H. After adenylation of 3′ DNA fragment ends, NEBNext Adaptors with hairpin loop structures were ligated in preparation for hybridization. Library fragments were purified with an AMPure XP system (Beckman Coulter, Beverly, USA) to preferentially select cDNA fragments of 250–300 bp in length. Hereafter, an Agilent Bioanalyzer 2100 system was used in PCR product purification (AMPure XP system, Beckman, Brea, CA, USA) and library quality assessment.
The original data were filtered using Fast v 0.19.3, mainly to remove reads with adapters. Paired reads were removed if the N content in any sequencing read exceeded 10% of the base number of the reads. Paired reads were also removed, if the number of low-quality (Q ≤ 20) bases in reads exceeded 50% of the read bases. All subsequent analyses were based on clean reads. The reference genome and its annotation files were downloaded from the designated website and the index was conducted using HISAT v2.1.0 and compared to the clean reads of the reference genome. StringTie was used to apply network streaming algorithms and optional de novo to splice transcripts. The gene alignment was calculated by Feature Counts v1.6.2 and the FPKM of each gene was calculated based on gene length. The gene expression levels was estimated through FPKM. p values were corrected using the Benjamini and Hochberg method. The threshold for significantly different expressions was based on the corrected p and |log2 foldchange| values. The hypergeometric test proceeded to conduct the enrichment analysis. The hypergeometric distribution test was carried out for KEGG with the unit of pathway.

2.6. Metabolome Detection and Measurement

A vacuum freeze dryer (Scientz-100F, Ningbo, China) was used in biological sample freeze drying. Freeze-dried samples were crushed using a mixer mill (MM 400, Retsch, Haan, Germany) with a zirconia bead for 1.5 min at 30 Hz. The 100 mg lyophilized powder was dissolved in a 70% methanol solution (1.2 mL), vortexed for 30 s every 30 min for a total of six repetitions, whereafter samples were placed in a refrigerator at 4 °C overnight, following centrifugation at 12,000 rpm for 10 min. Sample extracts were then analyzed using a UPLC-ESI-MS/MS system (Shim-pack UFLC SHIMADZU CBM30A system, www.shimadzu.com.cn (Accessed on 2 August 2022); MS, Applied Biosystems. 6500 Q TRAP, www.appliedbiosystems.com.cn (Accessed on 2 August 2022)). Moreover, the flow velocity was set to 0.35 mL per minute; the column oven was set to 40 °C; and the injection volume was 4 μL. The ESI source operation parameters were as follows: ion source was turbo spray; source temperature was set 550 °C; ion spray voltage (IS) was set to 5500 V (positive ion mode)/−4500 V (negative ion mode). Identified metabolites were annotated and then mapped using the KEGG database (http://www.kegg.jp/kegg/compound/, http://www.kegg.jp/kegg/pathway.html (Accessed on 2 August 2022)).

2.7. Statistical Analysis

All experiments were independent and at least carried out in triplicate, and yielded similar results. All values are presented as mean ± SD. Statistical significance was based on unpaired two-sample Student’s t-tests, as determined in the Sigmaplot 10 software. PCAs (principal component analysis) were performed on all data sets. Unsupervised PCA was performed using the R software package (www.r-project.org (Accessed on 2 August 2022)). The data were unit-variance-scaled before the unsupervised PCA.

3. Results

3.1. Thermotolerant and Thermosensitive Wolfberry Plant Phenotypes under High Temperature Stress

Seedlings of the two L. barbarum cultivars N7 and 1402 were treated in an artificial climate chamber and divided into two groups. The control group temperature was 25 °C, while the experimental group temperature was 42 °C. The treatments lasted for 1 h, 6 h, 24 h, and 48 h. The seedlings were photographed at different time points as shown in Figure 1A. After 24 h and 48 h of high temperature treatment, wilting and curling occurred, and this was accompanied by a gradual senescence of green leaves, which was significantly more serious in N7 compared to 1402. The leaf chlorophyll content was then measured. As the high temperature treatment time extended, the leaf chlorophyll content gradually decreased in N7 but recovered in 1402 at the 48 h time period. Therefore, this preliminarily indicated that the heat tolerance of N7 was weaker compared to 1402 (Figure 1B).

3.2. Statistical Summary of DEGs

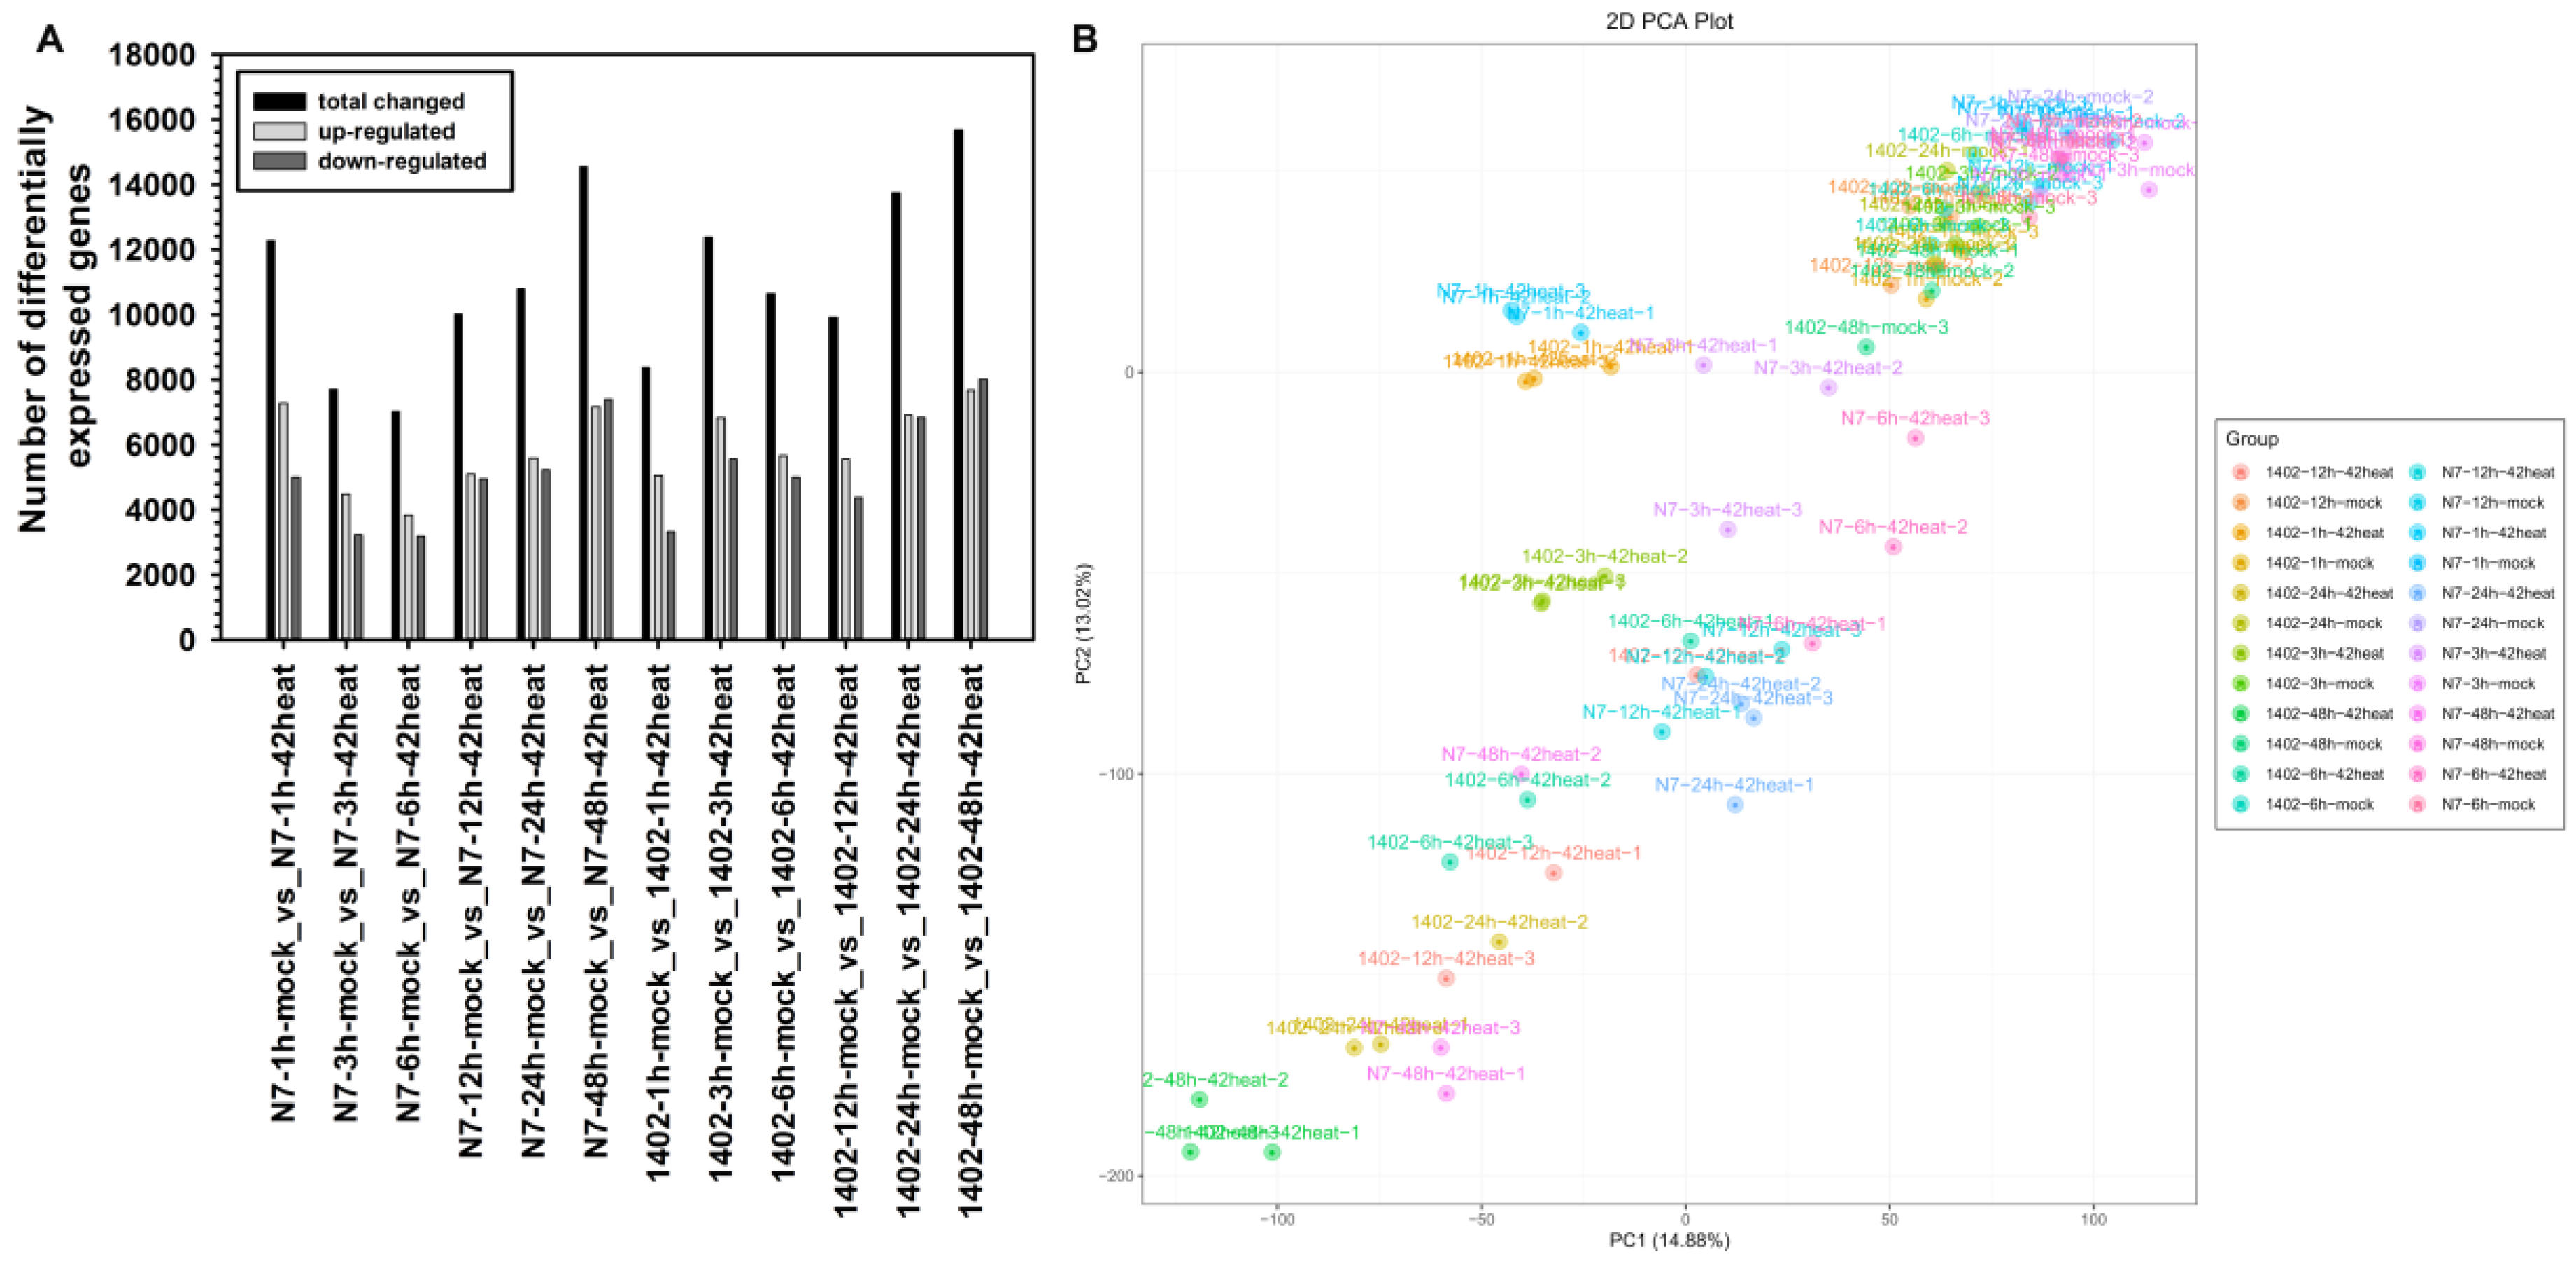
To better understand the molecular basis of wolfberry thermotolerance, we carried out transcriptome sequencing and analyzed differentially expressed genes (DEGs) in the two L. barbarum lines, Ningqi No. 7 (N7) and 1402, under control (25 °C) and high temperature (42 °C) conditions. We selected multiple time points for sampling and analysis, including 1 h, 3 h, 6 h, 12 h, 24 h, and 48 h after heat treatment. The number of DEGs changed over time (Figure 2A). The total DEGs in N7 under high temperature stress were 12264, 7688, 7004, 10021, 10800, and 14549 sequentially at the 1 h, 3 h, 6 h, 12 h, 24 h, and 48 h time points, respectively, in which 7272, 4469, 3827, 5082, 5580, and 7155 genes were up-regulated, and 4992, 3219, 3177, 4939, 5220, and 7394 genes were down-regulated at these different time points, respectively. The total DEGs in 1402 under high temperature conditions were sequentially 8365, 12372, 10652, 9916, 13737, and 15666 at the 1 h, 3 h, 6 h, 12 h, 24 h, and 48 h time points, respectively, in which 5040, 6822, 5658, 5551, 6906, and 7658 genes were up-regulated, and 3325, 5550, 4994, 4365, 6831, and 8008 genes were down-regulated at these different time points, respectively. According to changing trends during the heat processing time, the DEG numbers in N7 reached the first peak at 1 h, and then dropped between 3 h and 6 h, whereafter it increased again between 12 h and 48 h, and finally reached a second peak at 48 h. However, this was different in 1402, where the DEG numbers increased between 1 h and 3 h and reached the first peak at 3 h, whereafter it dropped between 6 h and 12 h, but increased between 24 h and 48 h, and finally reached the second peak at 48 h. The changing DEG number trends were consistent in total, up-regulated, and down-regulated. Furthermore, N7 and 1402 were similar since their up-regulated DEG numbers were higher than the down-regulated genes between 1 h and 24 h but were opposite at 48 h after heat treatment. PCA was performed on the genes of the two wolfberry lines under control and heat treatment conditions at different time points. The first two principal components (PC1 and PC2) showed a clear separation, where different cultivars were represented along PC1 and different treatment time points were represented along PC2 (Figure 2B).

3.3. KEGG Analysis of Co- and Differentially Expressed DEGs

The co- and differentially expressed DEGs between L. barbarum N7 and 1402 under heat stress at different treatment time points were analyzed by KEGG pathway enrichment (Figure 3). Firstly, the co-expressed DEGs between N7 and 1402 at 1 h, 3 h, 6 h, 12 h, 24 h and 48 h were analyzed. The most significant pathways successively included the following: ‘RNA transport’, ‘protein processing in endoplasmic reticulum’, and ‘circadian rhythm’ at 1 h; ‘RNA transport’, ‘protein processing in endoplasmic reticulum’, ‘carbon metabolism’, and ‘carbon fixation in photosynthetic organisms’ at 3 h; ‘protein processing in endoplasmic reticulum’, ‘pentose phosphate’, ‘glyoxylate and dicarboxylate metabolism’, ‘carbon metabolism’, and ‘carbon fixation in photosynthetic organisms’ at 6 h; ‘photosynthesis antenna proteins’, ‘photosynthesis’, ‘carbon metabolism’, carbon fixation in photosynthetic organisms’, biosynthesis of amino acids’, and ‘alanine, aspartate, and glutamate metabolism’ at 12 h; ‘plant hormone signal transduction’, ‘MAPK signaling pathway’, ‘carbon metabolism’, and ‘carbon fixation in photosynthetic organisms’ at 24 h; and, finally, ‘MAPK signaling pathway’, ‘oxidative phosphorylation’, ‘carbon metabolism’, ‘starch and sucrose metabolism’, and ‘tyrosine metabolism’ at 48 h after heat treatment.
The differentially expressed DEGs in N7 or 1402 at different time points under heat stress were also analyzed. The ‘ribosome’ and ‘homologous recombination’ pathways were significantly enriched in N7 while the ‘starch and sucrose metabolism’, ‘MAPK signaling pathway’, and ‘cysteine and methionine metabolism’ pathways were enriched in 1402 at 1 h. The ‘ribosome’, ‘starch and sucrose metabolism’, and ‘cysteine and methionine metabolism’ pathways were significantly enriched in N7 and the ‘plant hormone signal transduction’ and ‘MAPK signaling’ pathways were enriched in 1402 at 3 h. The ‘ribosome’ and ‘citrate cycle’ pathways were significantly enriched in N7 while the ‘tyrosine metabolism’, ‘phenylalanine, tyrosine, and tryptophan biosynthesis’, and ‘isoquinoline alkaloid biosynthesis’ pathways were enriched in 1402 at 6 h. The ‘plant hormone signal transduction’, ‘MAPK signaling pathway’, and ‘starch and sucrose metabolism’ pathways were significantly enriched in N7 while the ‘phagosome’ pathway was enriched in 1402 at 12 h. The ‘glycerophospholipid metabolism’ pathway was enriched in N7 while the ‘starch and sucrose metabolism’ and ‘alanine, aspartate, and glutamate metabolism’ pathways were enriched in 1402 at 24 h. The ‘phagosome’ pathway was enriched in N7 while the ‘pyruvate metabolism’ and ‘alanine, aspartate, and glutamate metabolism’ pathways were enriched in 1402 at 48 h.
Moreover, different major metabolic pathways responded to heat stress at different time points. The common metabolic pathways in N7 and 1402 were mainly enriched in ‘carbon metabolism’, ‘starch and sucrose metabolism’, ‘MAPK signaling’, and ‘biosynthesis of amino acids’. The difference between N7 and 1402 was that some of the shared pathways were enriched earlier in 1402, such as the ‘starch and sucrose metabolism’, ‘MAPK signaling pathway’, and ‘plant hormone signal transduction’ pathways, while some were enriched earlier in N7, such as the ‘biosynthesis of amino acids’ pathway.

3.4. Dynamic Transcriptome Analysis in Response to Heat Stress

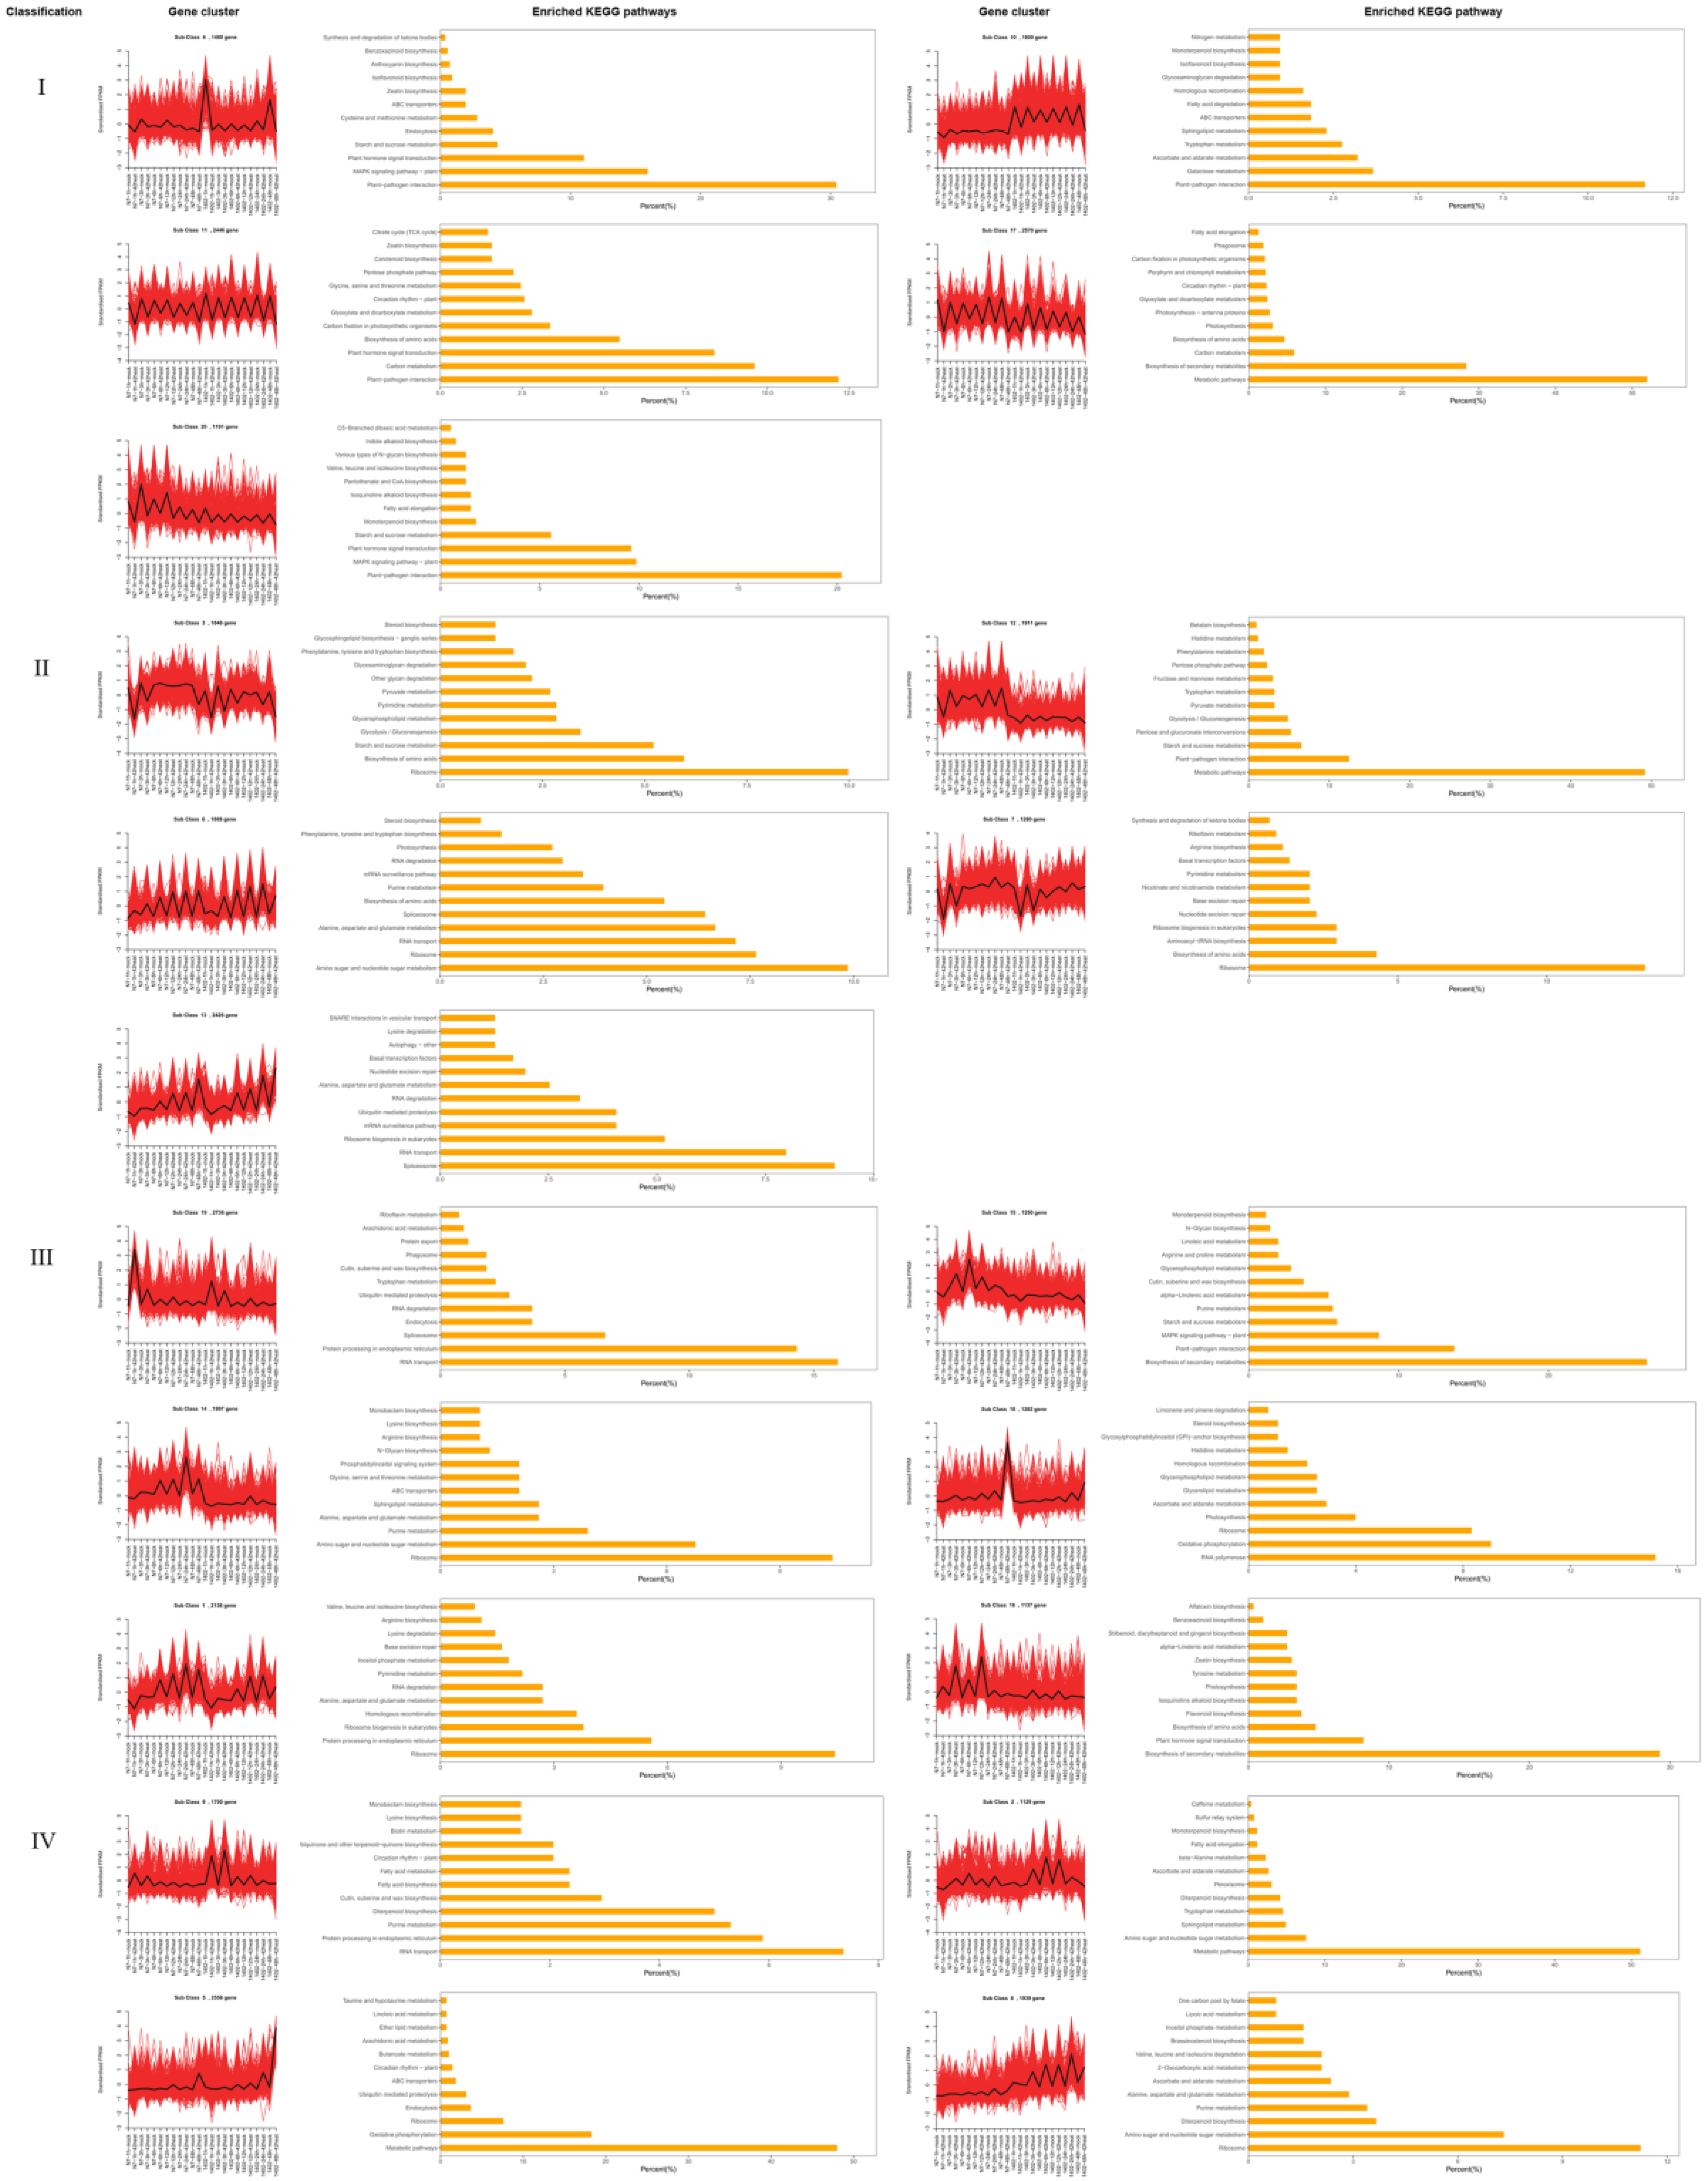
To study the gene expression patterns in L. barbarum N7 and 1402 under high temperature conditions over time, k-means cluster analysis was performed. The gene expression patterns were classified into 20 subclasses, which were then divided into four categories according to the differences between N7 and 1402 in gene expression trends (Figure 4).
The first category represents gene classes that showed no regulation change when subjected to heat stress, in both N7 and 1402, which included subclasses 4, 10, 11, 17, and 20. The KEGG pathway enrichment analysis demonstrated that these genes were mainly involved in the ‘MAPK signaling pathway’, ‘carbon metabolism’, and ‘galactose metabolism’ pathways.
The second category represented gene classes that showed similar regulation change tendencies between N7 and 1402 when exposed to high temperature, in which subclasses 3, 6, 7, 12, and 13 were included. The gene expression patterns were similar in subclasses 3 and 12 in that the gene expressions gradually increased at first, and then gradually decreased with time, and these were mainly enriched in the ‘biosynthesis of amino acids’, ‘starch and sucrose metabolism’, and ‘’ribosome’ pathways. The gene expression gradually increased and later plateaued in subclasses 6 and 7, which were mainly enriched in the ‘ribosome’, ‘amino sugar and nucleotide sugar metabolism’, and ‘biosynthesis of amino acids’ pathways. The gene expression gradually increased until 48 h in subclass 13, which was mainly enriched in the ‘spliceosome’ and ‘RNA transport’ pathways.
The third category represented gene classes where expression levels changed significantly in N7 but had either minimal or no trend changes in 1402. The gene expression changes in N7 were larger compared to 1402 in subclasses 1, 18, and 19. The genes in subclasses 14, 15, and 16 were significantly regulated in N7, but experienced almost no change in 1402. These genes were enriched in the ‘ribosome’, ‘RNA polymerase’, ‘RNA transport’, ‘amino sugar and nucleotide sugar metabolism’, ‘MAPK signaling pathway’, and ‘plant hormone signal transduction’ pathways. The fourth category represented gene classes where expression levels changed significantly in 1402 but not in N7, and included subclasses 2, 5, 8, and 9. These genes were mainly involved in the ‘amino sugar and nucleotide sugar metabolism’, ‘oxidative phosphorylation’, ‘ribosome’, and ‘RNA transport’ pathways.

3.5. Metabolome Analysis in Response to Heat Stress

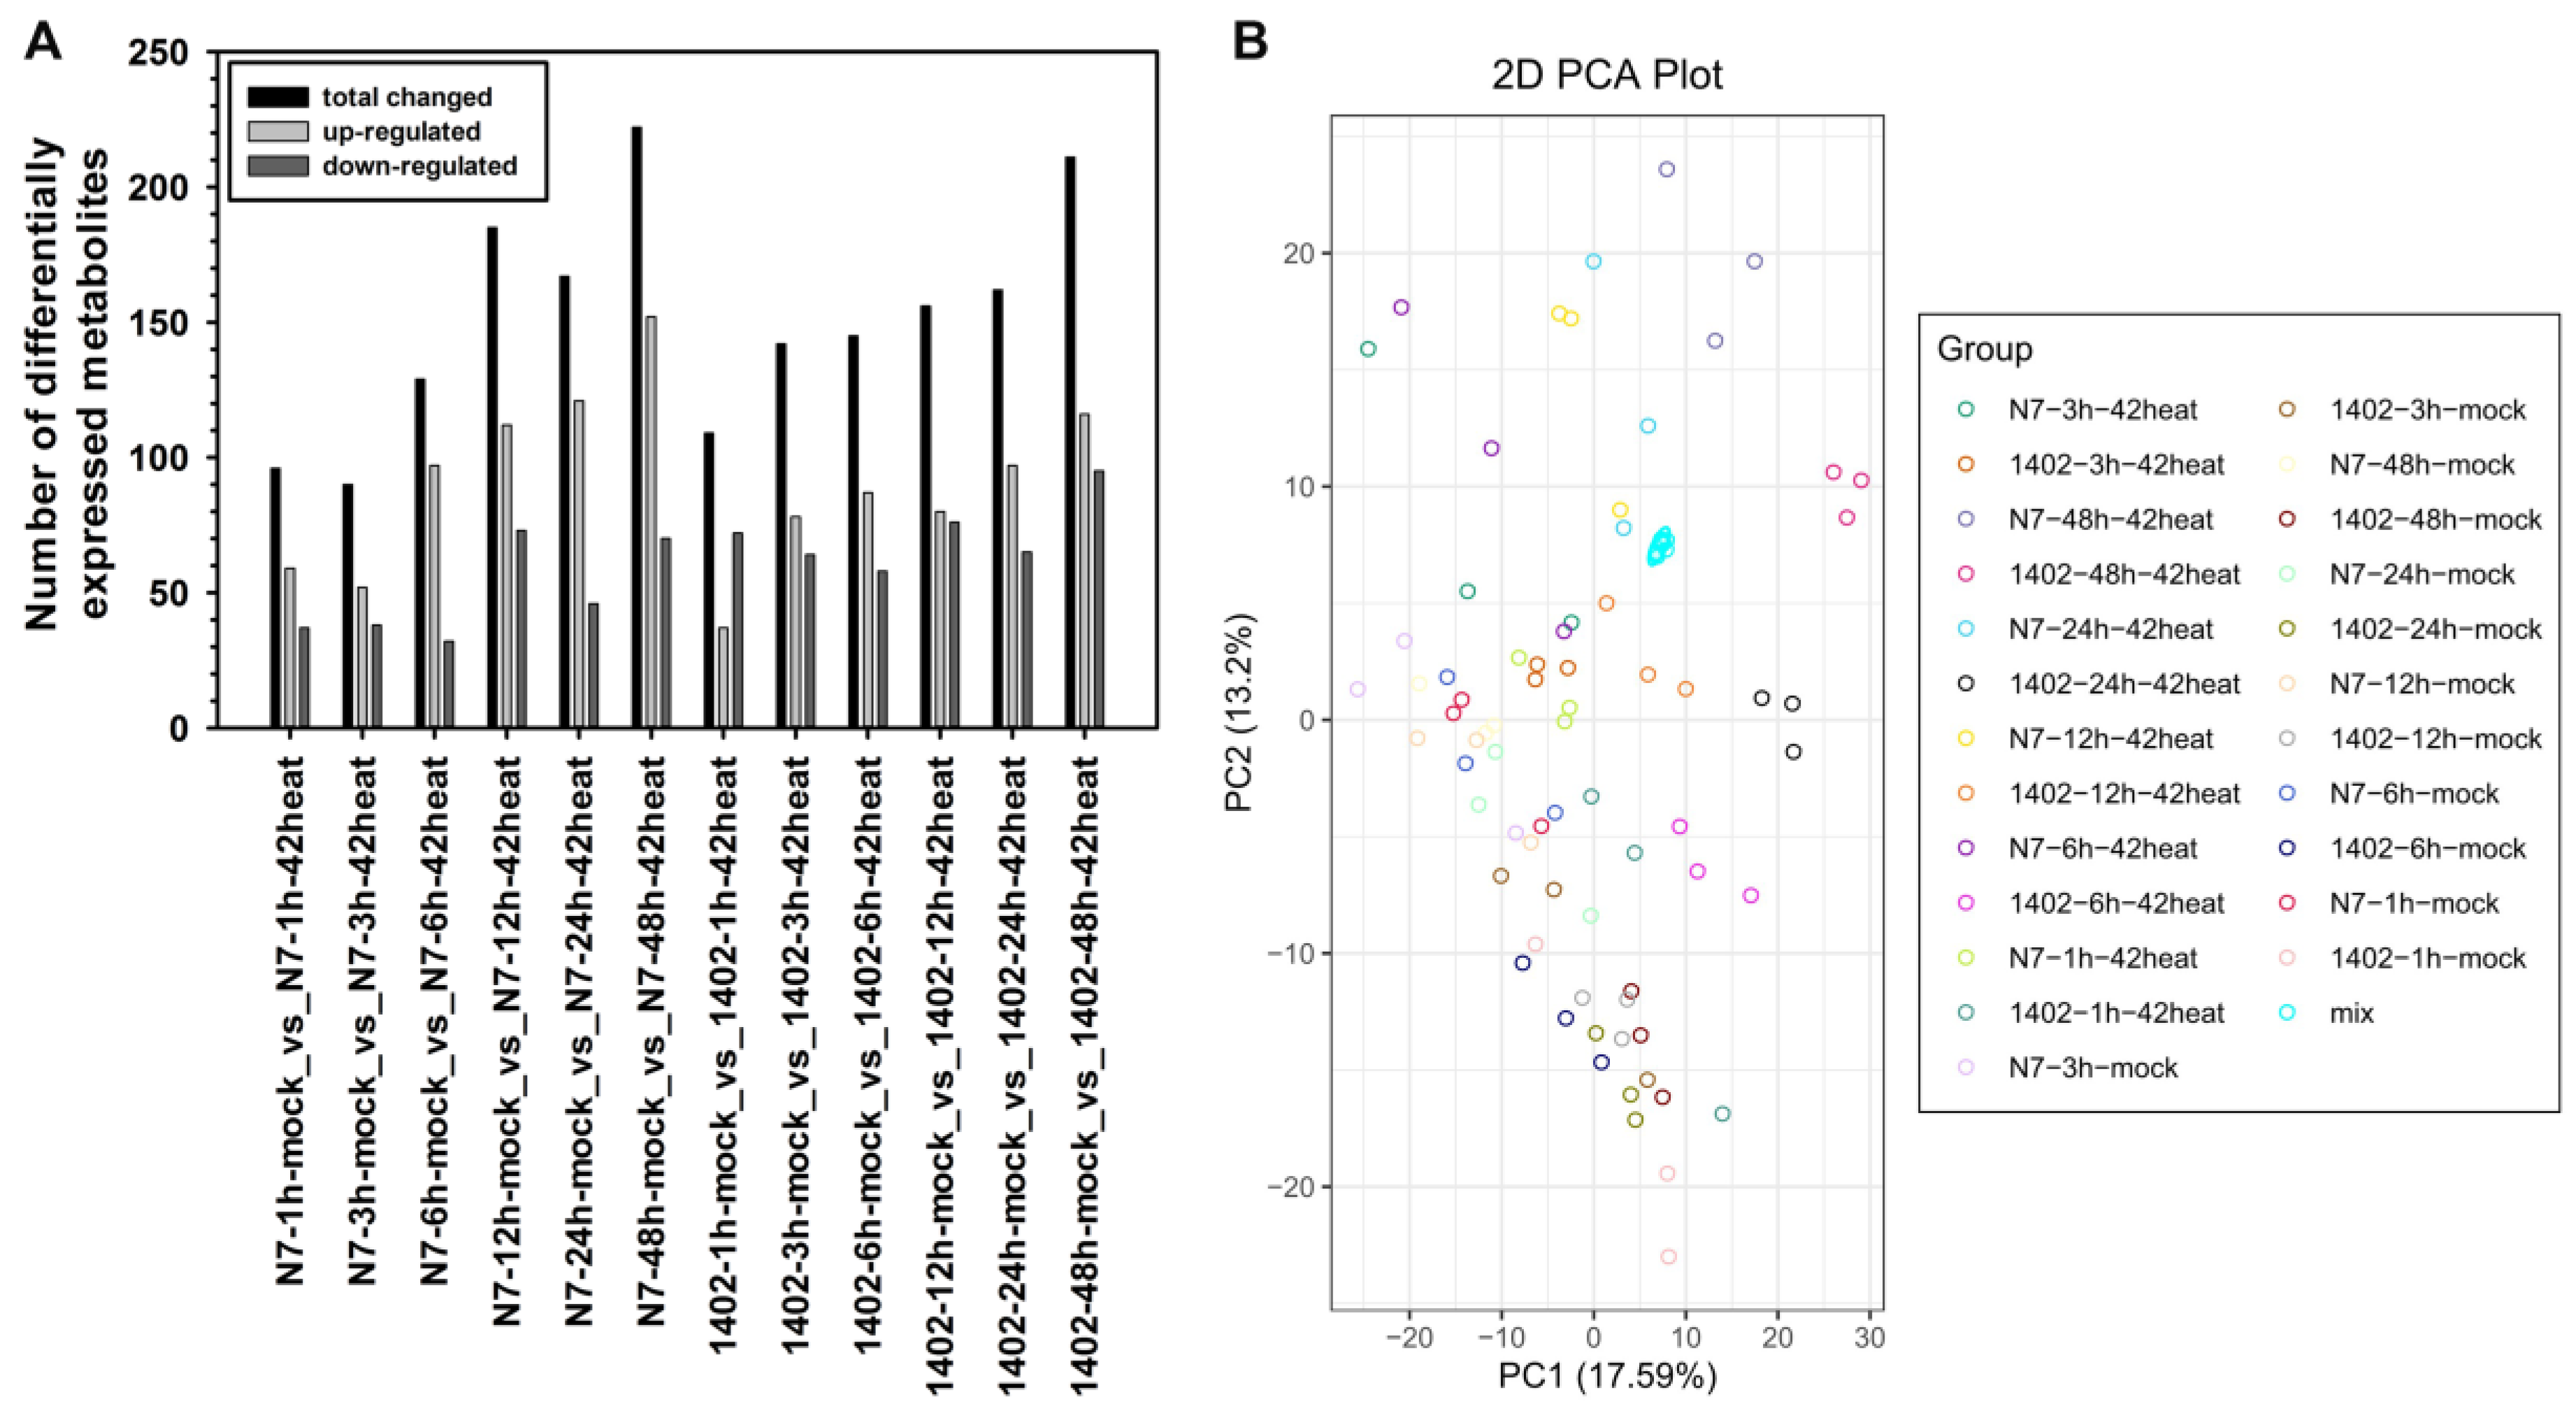
Metabolomic analysis was carried out in the N7 and 1402 wolfberry lines in response to heat stress. The general trend was that the number of DEMs gradually increased with prolonged time exposure to high temperatures (Figure 5). In N7, as the treatment time ranged from 1 h to 3 h, 6 h, 12 h, 24 h, and 48 h, the total changed metabolite numbers were 96, 90, 129, 185, 167, and 222, respectively, while the up-regulated metabolite numbers were 59, 52, 97, 112, 121, and 152, respectively, and the down-regulated metabolite numbers were 37, 38, 32, 73, 46, and 70, respectively. The number of up-regulated metabolites was higher than the down-regulated metabolites at each time point. In 1402, along with heat treatment, the total changed metabolite numbers were 109, 142, 145, 156, 162, and 211, respectively, while the up-regulated metabolite numbers were 37, 78, 87, 80, 97, and 116, respectively, and the down-regulated metabolite numbers were 72, 64, 58, 76, 65, and 95 at 1 h, 3 h, 6 h, 12 h, 24 h, and 48 h, respectively. PCA of the metabolites in the control and heat stress groups at the six time points of N7 and 1402 showed that PC1 and PC2 completely distinguished the 24 species and treatment combinations.

3.6. Summarized Difference Analysis in N7 and 1402 under Heat Stress

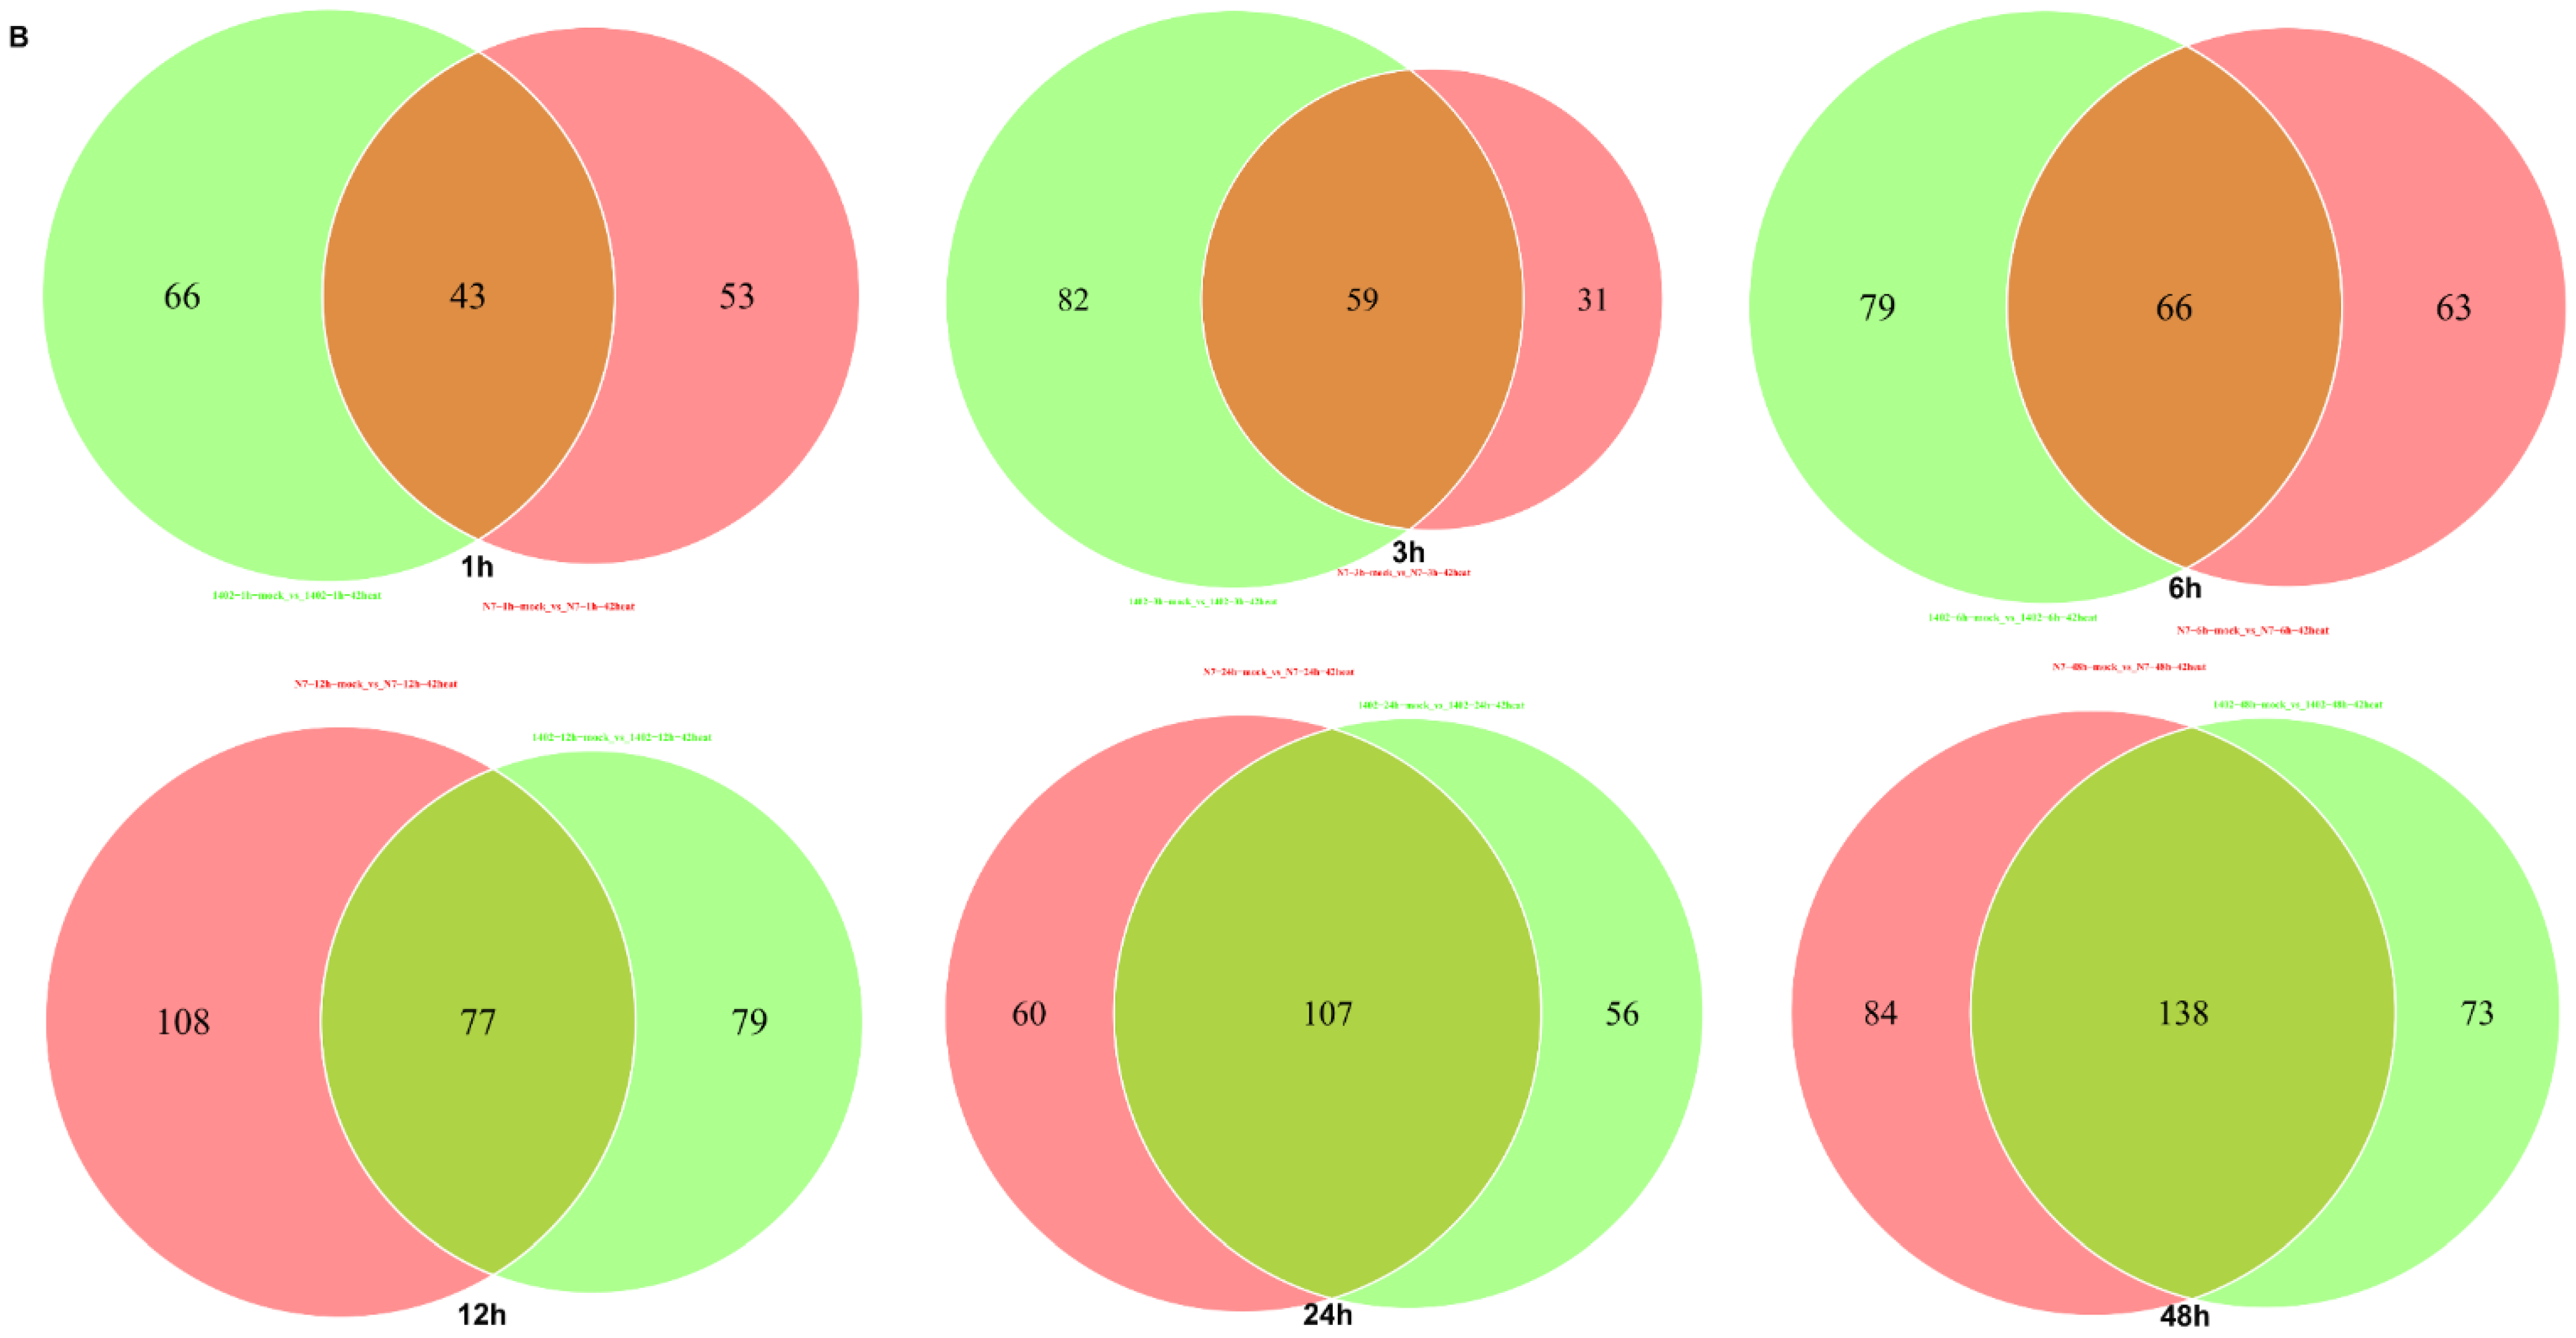
The metabolites differed in N7 and 1402 at different time points under heat stress (Figure 6). The analysis of differences, along with time points, is displayed by the upset diagram. There were 22 differentially expressed metabolites in common in the heat stress group at 1 h, 3 h, 6 h, 12 h, 24 h, and 48 h in N7, and 26 common DEMs in 1402. Moreover, there were 13, 10, 17, 29, 15, and 66 differentially expressed metabolites in N7 between the control and heat stress groups at 1 h, 3 h, 6 h, 12 h, 24 h, and 48 h, respectively. Moreover, there were 23, 35, 19, 43, 10, and 33 DEMs in N7 between the control and heat stress groups at 1 h, 3 h, 6 h, 12 h, 24 h, and 48 h, respectively (Figure 6A). The difference between N7 and 1402 at each time point under heat stress is summarized in Figure 6B. N7 and 1402 shared 43, 59, 66, 77, 107, and 138 DEMs at 1 h, 3 h, 6 h, 12 h, 24 h, and 48 h under heat treatment, respectively.

3.7. The Top 30 Differentially Expressed Metabolites in N7 and 1402

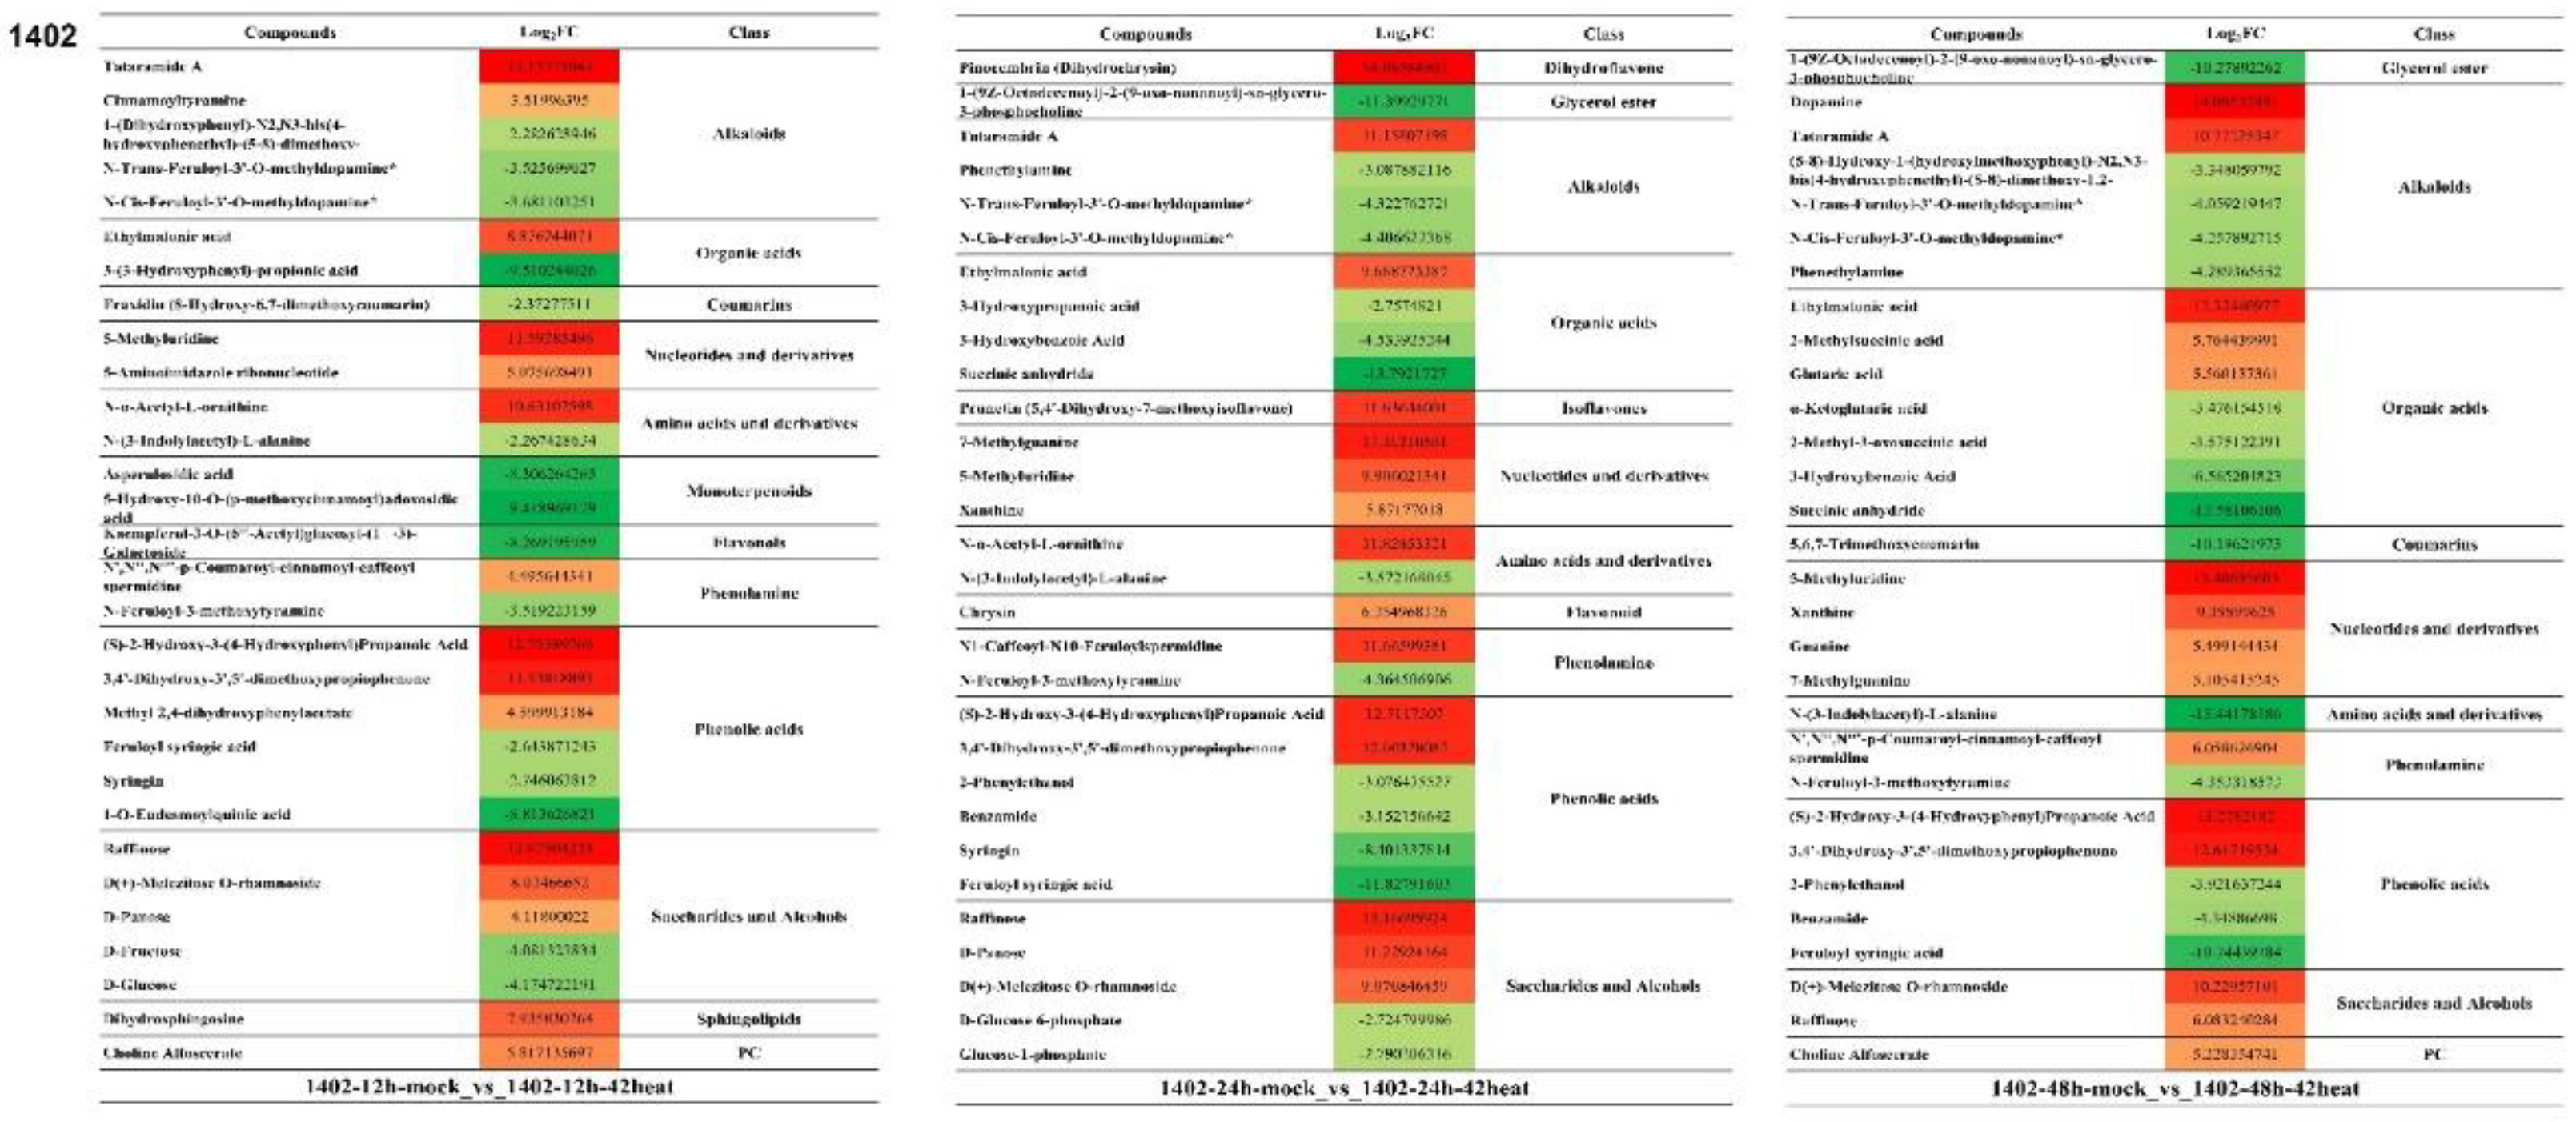
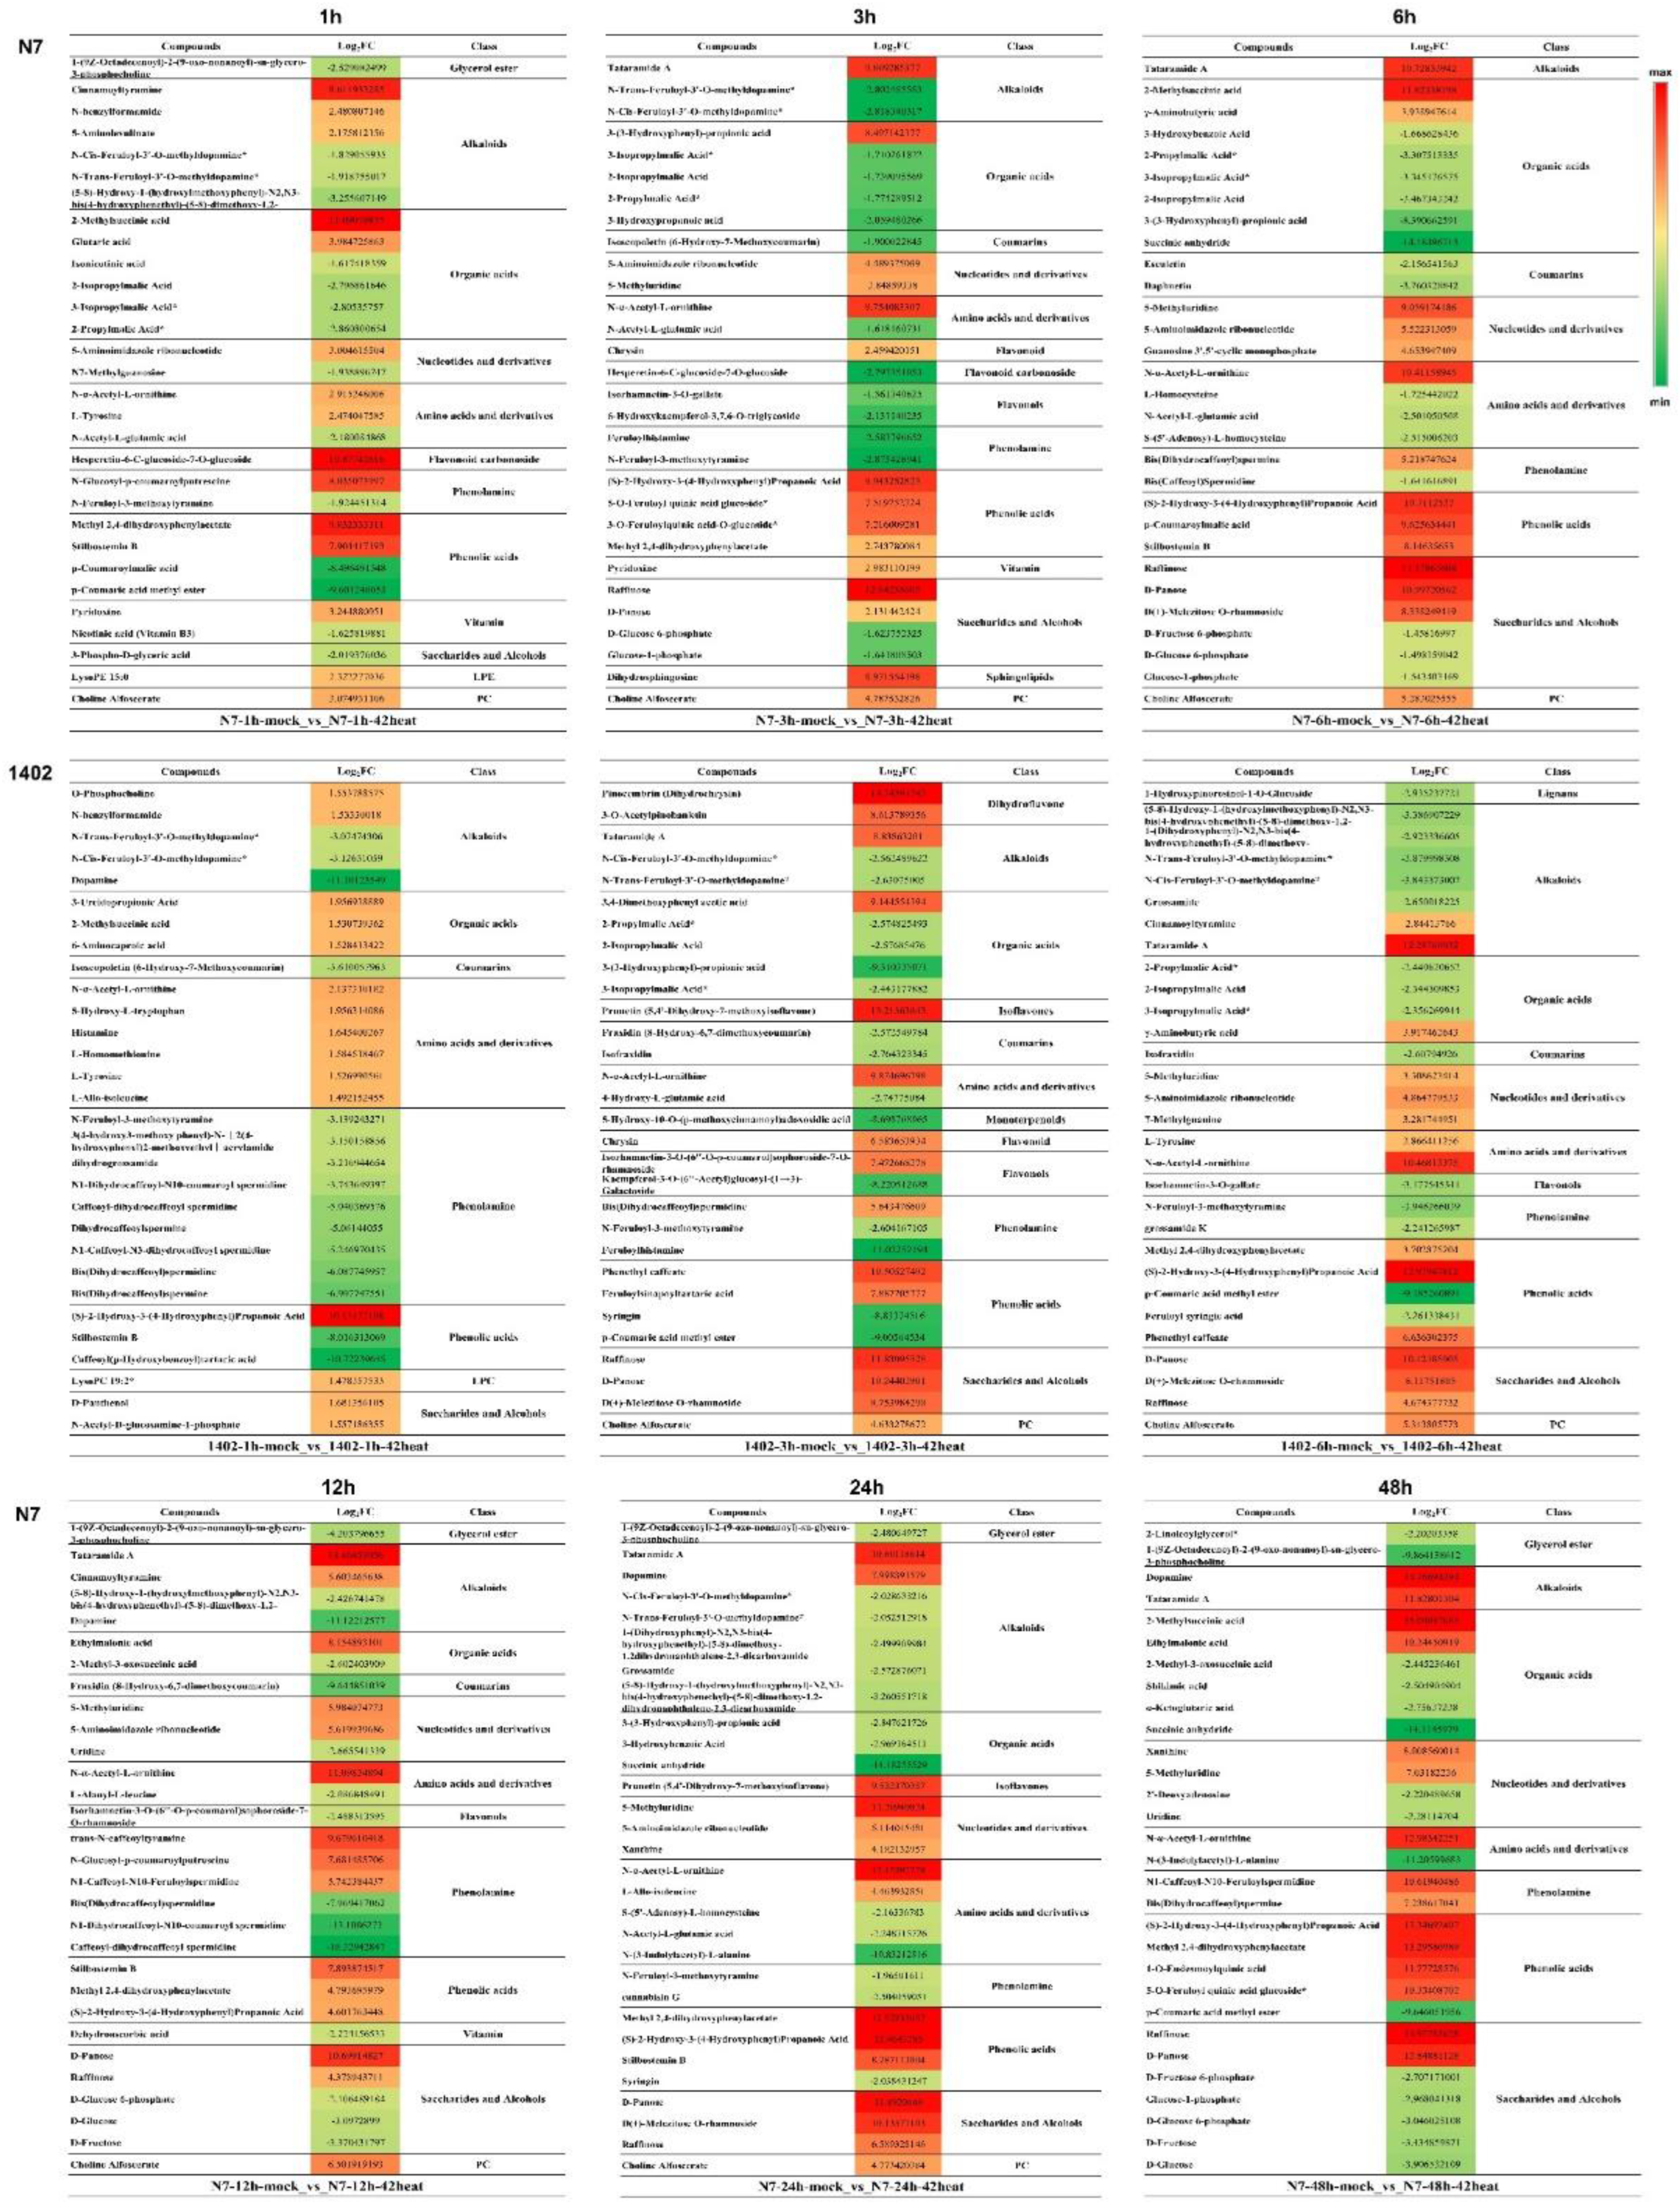
The top 30 differentially expressed metabolites at different time points included 1 h, 3 h, 6 h, 12 h, 24 h, and 48 h under heat stress in N7 and 1402 (Figure 7). These significantly and differentially expressed metabolites were mainly derived from organic acids, nucleotides and derivatives, amino acids and derivatives, flavonoids, phenolamine, phenotic acids, vitamins, saccharides and alcohols, and PC metabolic pathways. Notably, the most significantly regulated metabolites differed with treatment time in N7 and 1402.
In N7, 2-methylsuccinic acid and hesperetin-6-C-glucoside-7-O-glucoside were up-regulated while p-coumaroylmalic acid and p-coumaric acid methyl ester were down-regulated at 1 h. Dihydrosphingosine and raffinose were up-regulated while N-trans-feruloyl-3′- O-methyldopamine and N-cis-feruloyl-3′-O-methyldopamine were down-regulated at 3 h. Raffinose and D-panose were up-regulated while succinic anhydride and 3-(3-hydroxyphenyl)-propionic acid were down-regulated at 6 h. Tataramide A and N-a-acetyl-L-ornithine were up-regulated while N1-dihydrocaffeoyl-N10-coumaroyl spermidine and caffeoyl-dihydrocaffeoyl spermidine were down-regulated at 12 h. Methyl 2,4- dihydroxyphenylacetate and propenoic acid were up-regulated while succinic anhydride and N-(3-indolylacetyl)-L-alanine were down-regulated at 24 h. Finally, dopamine and raffinose were up-regulated while succinic anhydride and N-(3-indolylacetyl) -L-alanine were down-regulated at 48 h.
In 1402, (S)-2-hydroxy-3-(4-hydroxyphenyl) propanoic acid was up-regulated while dopamine and caffeoyl (p-hydroxybenzoyl) tartaric acid were down-regulated at 1 h. Pinocembrin and prunetin were up-regulated while feruloylhistamine and 3-(3-hydroxyphenyl) -propionic acid were down-regulated at 3 h. Tataramide A and (S)-2-hydroxy-3-(4-hydroxyphenyl) propanoic acid were up-regulated while p-coumaric acid methyl ester was down-regulated at 6 h. Raffinose and (S)-2-hydroxy-3-(4-hydroxyphenyl) propanoic acid were up-regulated while 3-(3-hydroxyphenyl)-propionic acid and 5-hydroxy-10-O-(p-methoxycinnamoyl) adoxosidic acid were down-regulated at 12 h. Pinocembrin and 7-methylguanine were up-regulated while succinic anhydride and feruloyl syringic acid were down-regulated at 24 h. Finally, dopamine and 5-methyluridine were up-regulated while succinic anthydride and N-(3-indolylacetyl)-L-alanine were down-regulated at 48 h.

3.8. The Shared Differentially Expressed Metabolites in N7 or 1402
Some regulated metabolites were shared along with treatment times between N7 and 1402 (Figure 8). A total of 22 metabolites were divided into seven classes (Figure 8A). The differential metabolites displayed here in the amino acids and their derivatives, alkaloids, nucleotides and derivatives, and organic acid classes, were up-regulated stepwise with treatment time. The lipid class metabolites were also up-regulated by heat stress but peaked at 12 h, after which it decreased. Vnilloyltartaric acid, which is a phenolic acid, had an expression peak at 3 h, whereafter it decreased. In contrast, D-glucose-6-phosphate, glucose-1-phosphate, and D-fructose-6-phosphate were down-regulated in N7. Furthermore, eight classes existed, which included 26 DEMs that are commonly regulated with treatment time in 1402 (Figure 8B). This differed from N7 in that most alkaloids, D-glucose, D-fructose, and isofraxidin, were down-regulated, while fewer amino acids were up-regulated.
Figure 7. Heatmap of the top 30 significantly and differentially expressed metabolites in L. barbarum N7 and 1402 in response to heat stress after 1, 3, 6, 12, 24, and 48 h of treatment.
Sustainability 14 12617 g007aSustainability 14 12617 g007b

3.9. KEGG Pathway Enrichment in DEGs and DEMs in N7 and 1402

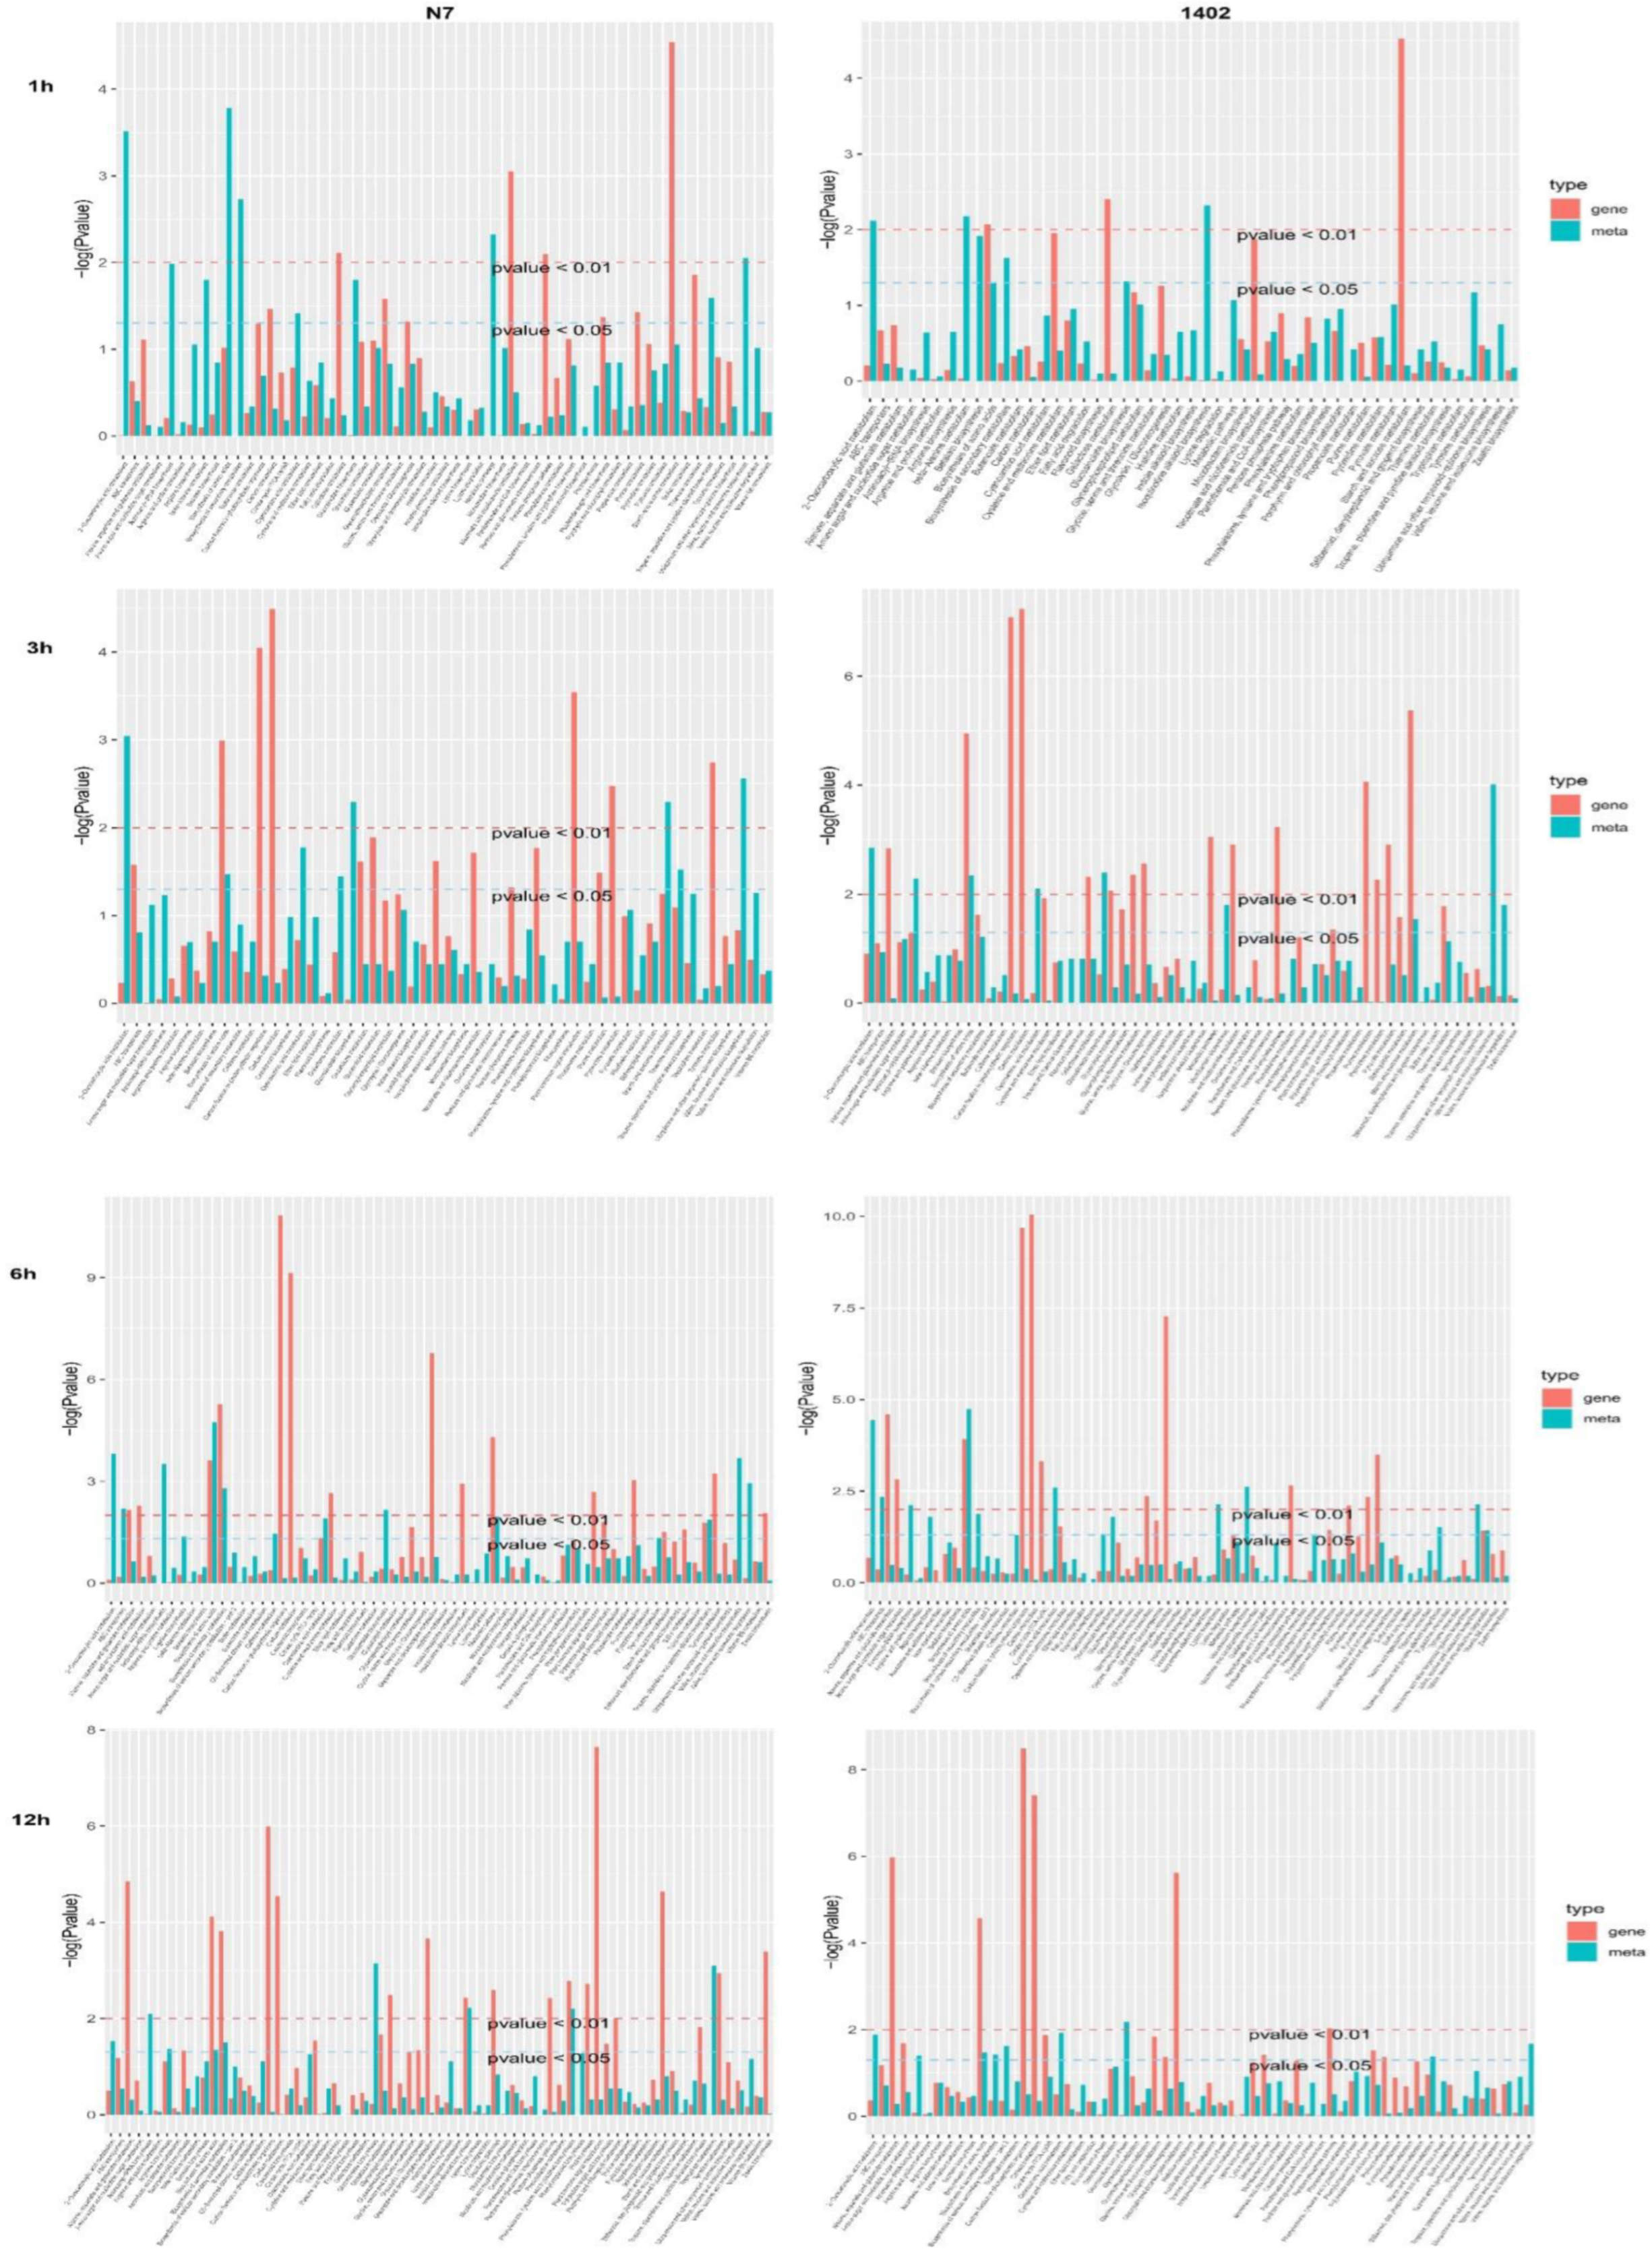
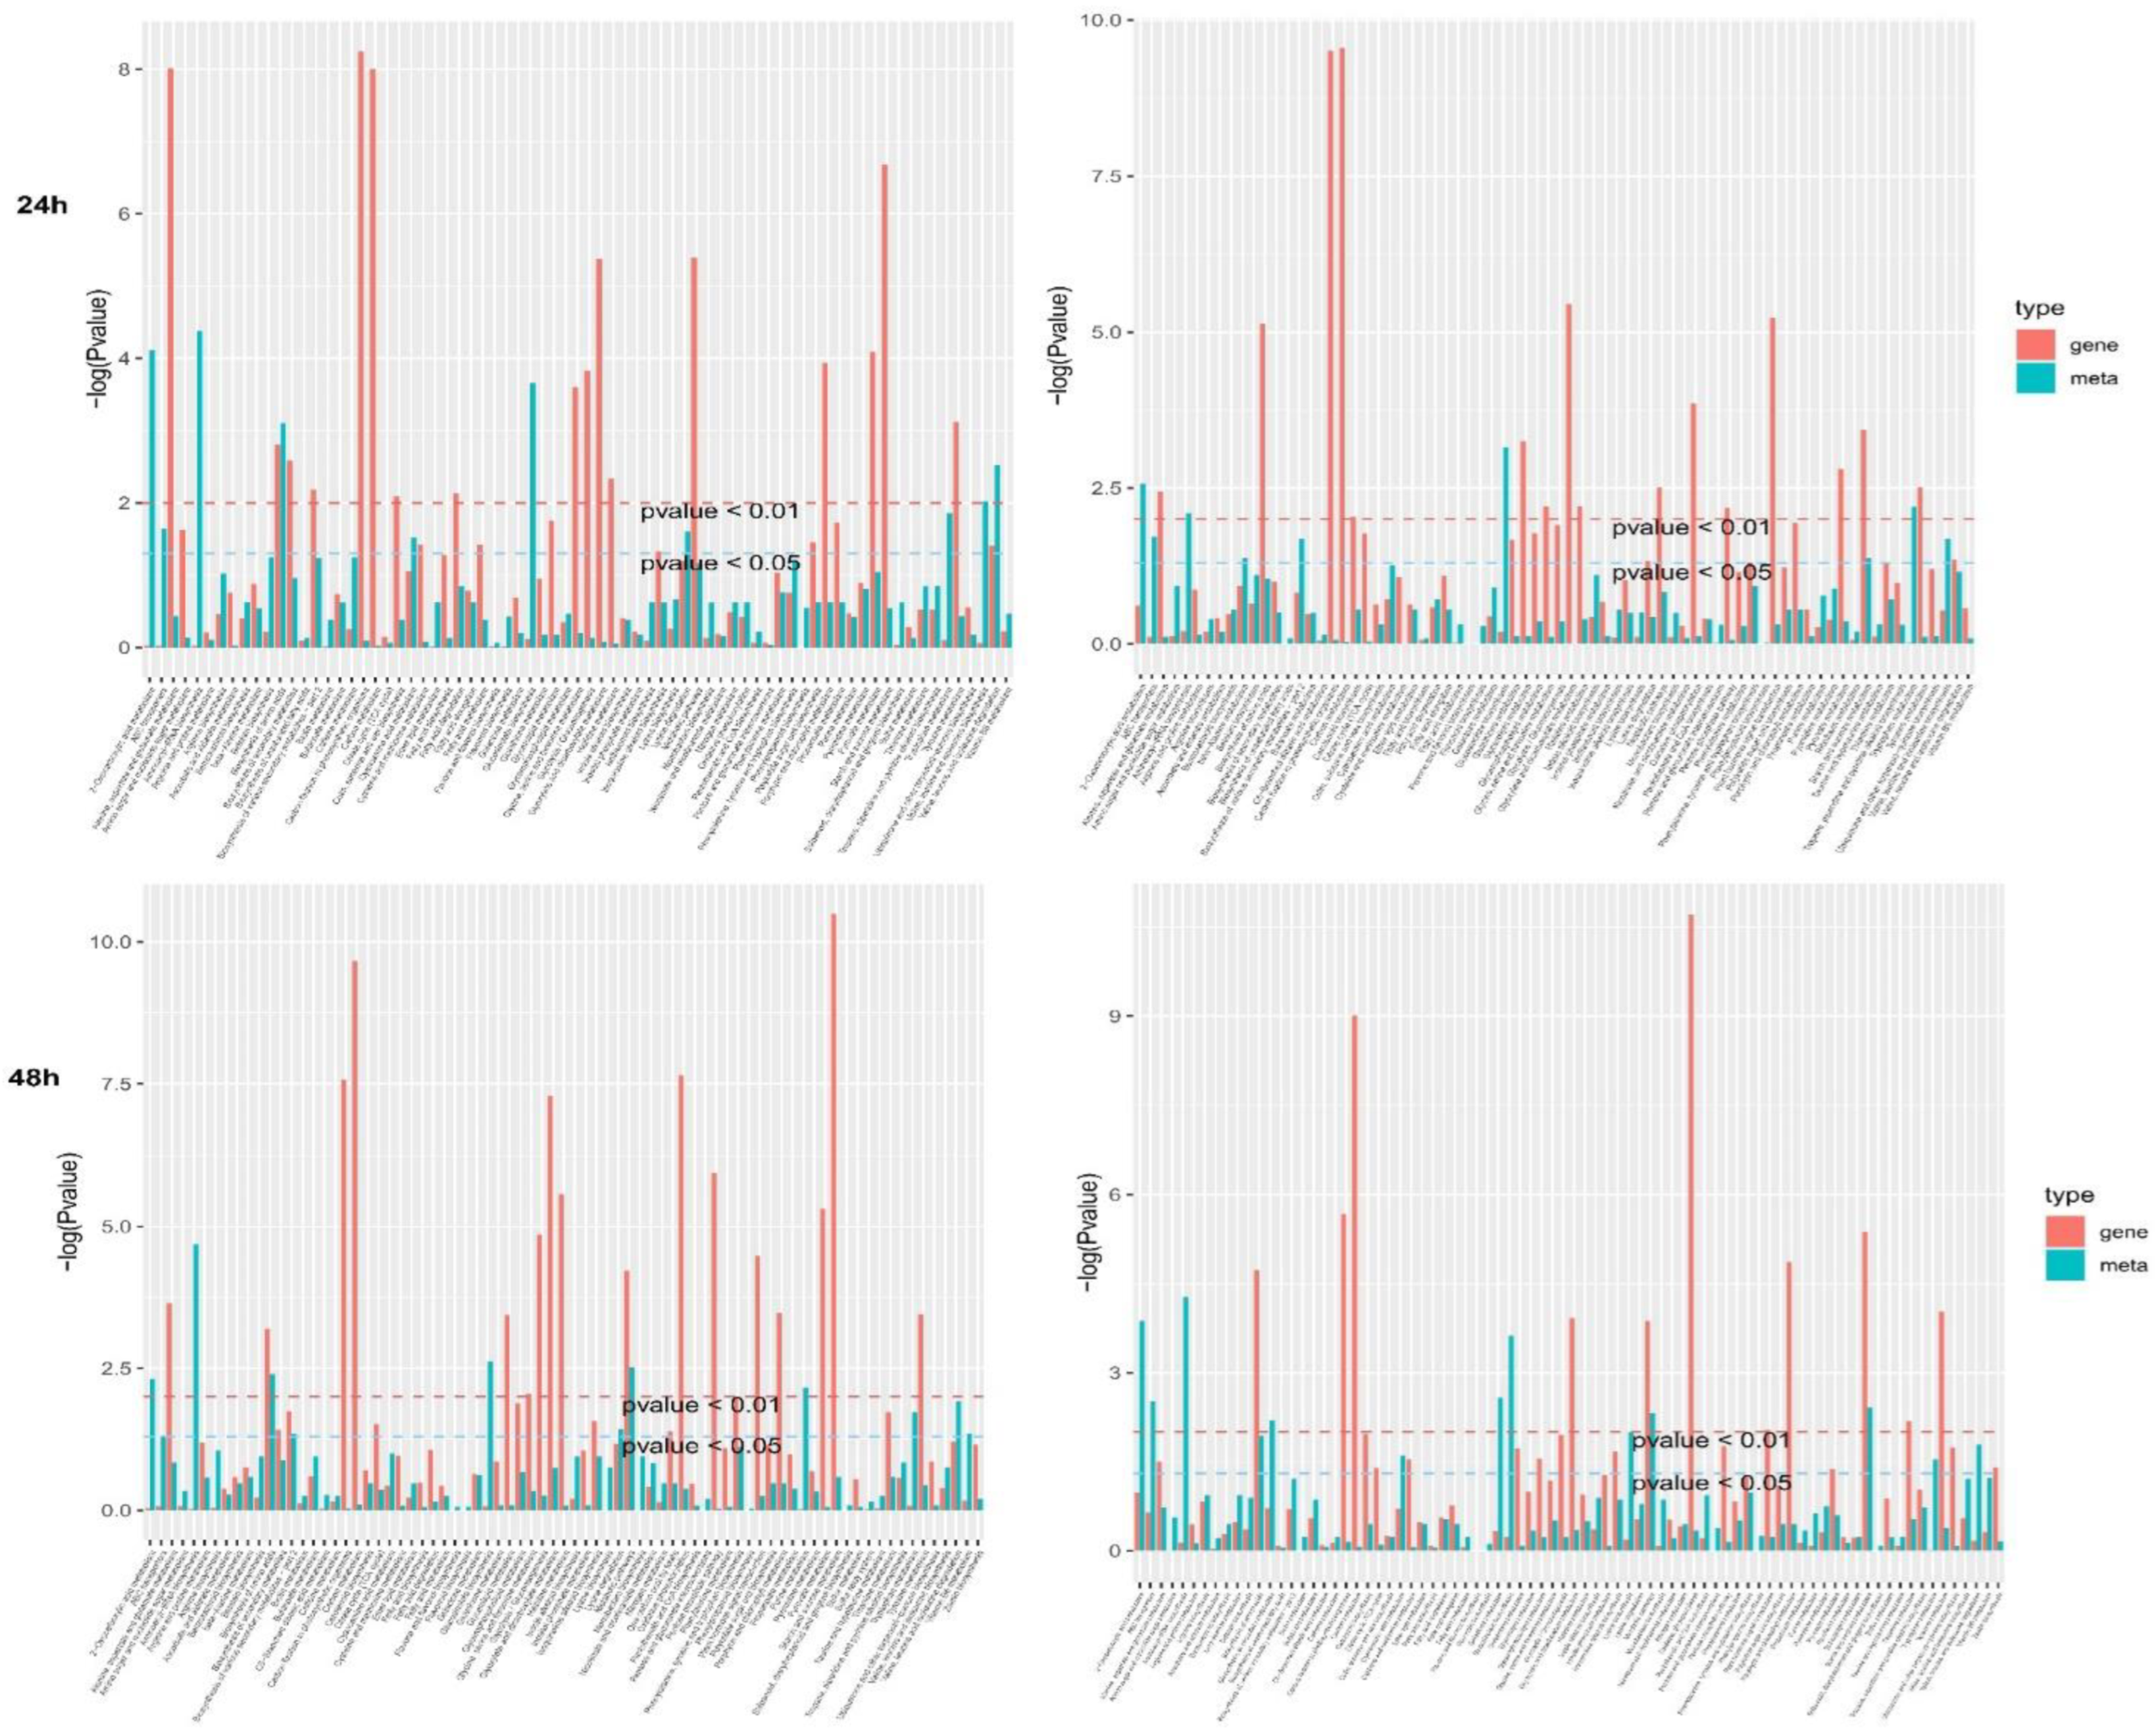
Some common pathways were found in which DEGs and DEMs were highly enriched (Figure 9; higher columns indicate greater enrichment). At 1 h in N7, there were no simultaneously and significantly enriched pathways in DEGs and DEMs but the amino acid biosynthesis pathway was highly enriched with DEGs and starch, while the sucrose metabolism pathway was highly enriched with DEMs. The amino acid biosynthesis pathway was highly enriched with DEGs and DEMs from 3 h, 6 h, 12 h, 24 h, to 48 h. In 1402, the amino acid biosynthesis pathway was highly enriched with DEGs and DEMs from 1 h to 48 h, except for the 24 h time point. Starch and sucrose metabolism was highly enriched with DEMs at 1 h, 6 h, and 12 h, and was highly enriched with DEGs and DEMs at 3 h, 24 h, and 48 h. This indicated that the amino acid biosynthesis, starch, and sucrose metabolism pathways play key roles in the heat stress response of wolfberry.

3.10. Identification of DEGs and DEMs Co-Expression in Response to Heat Stress

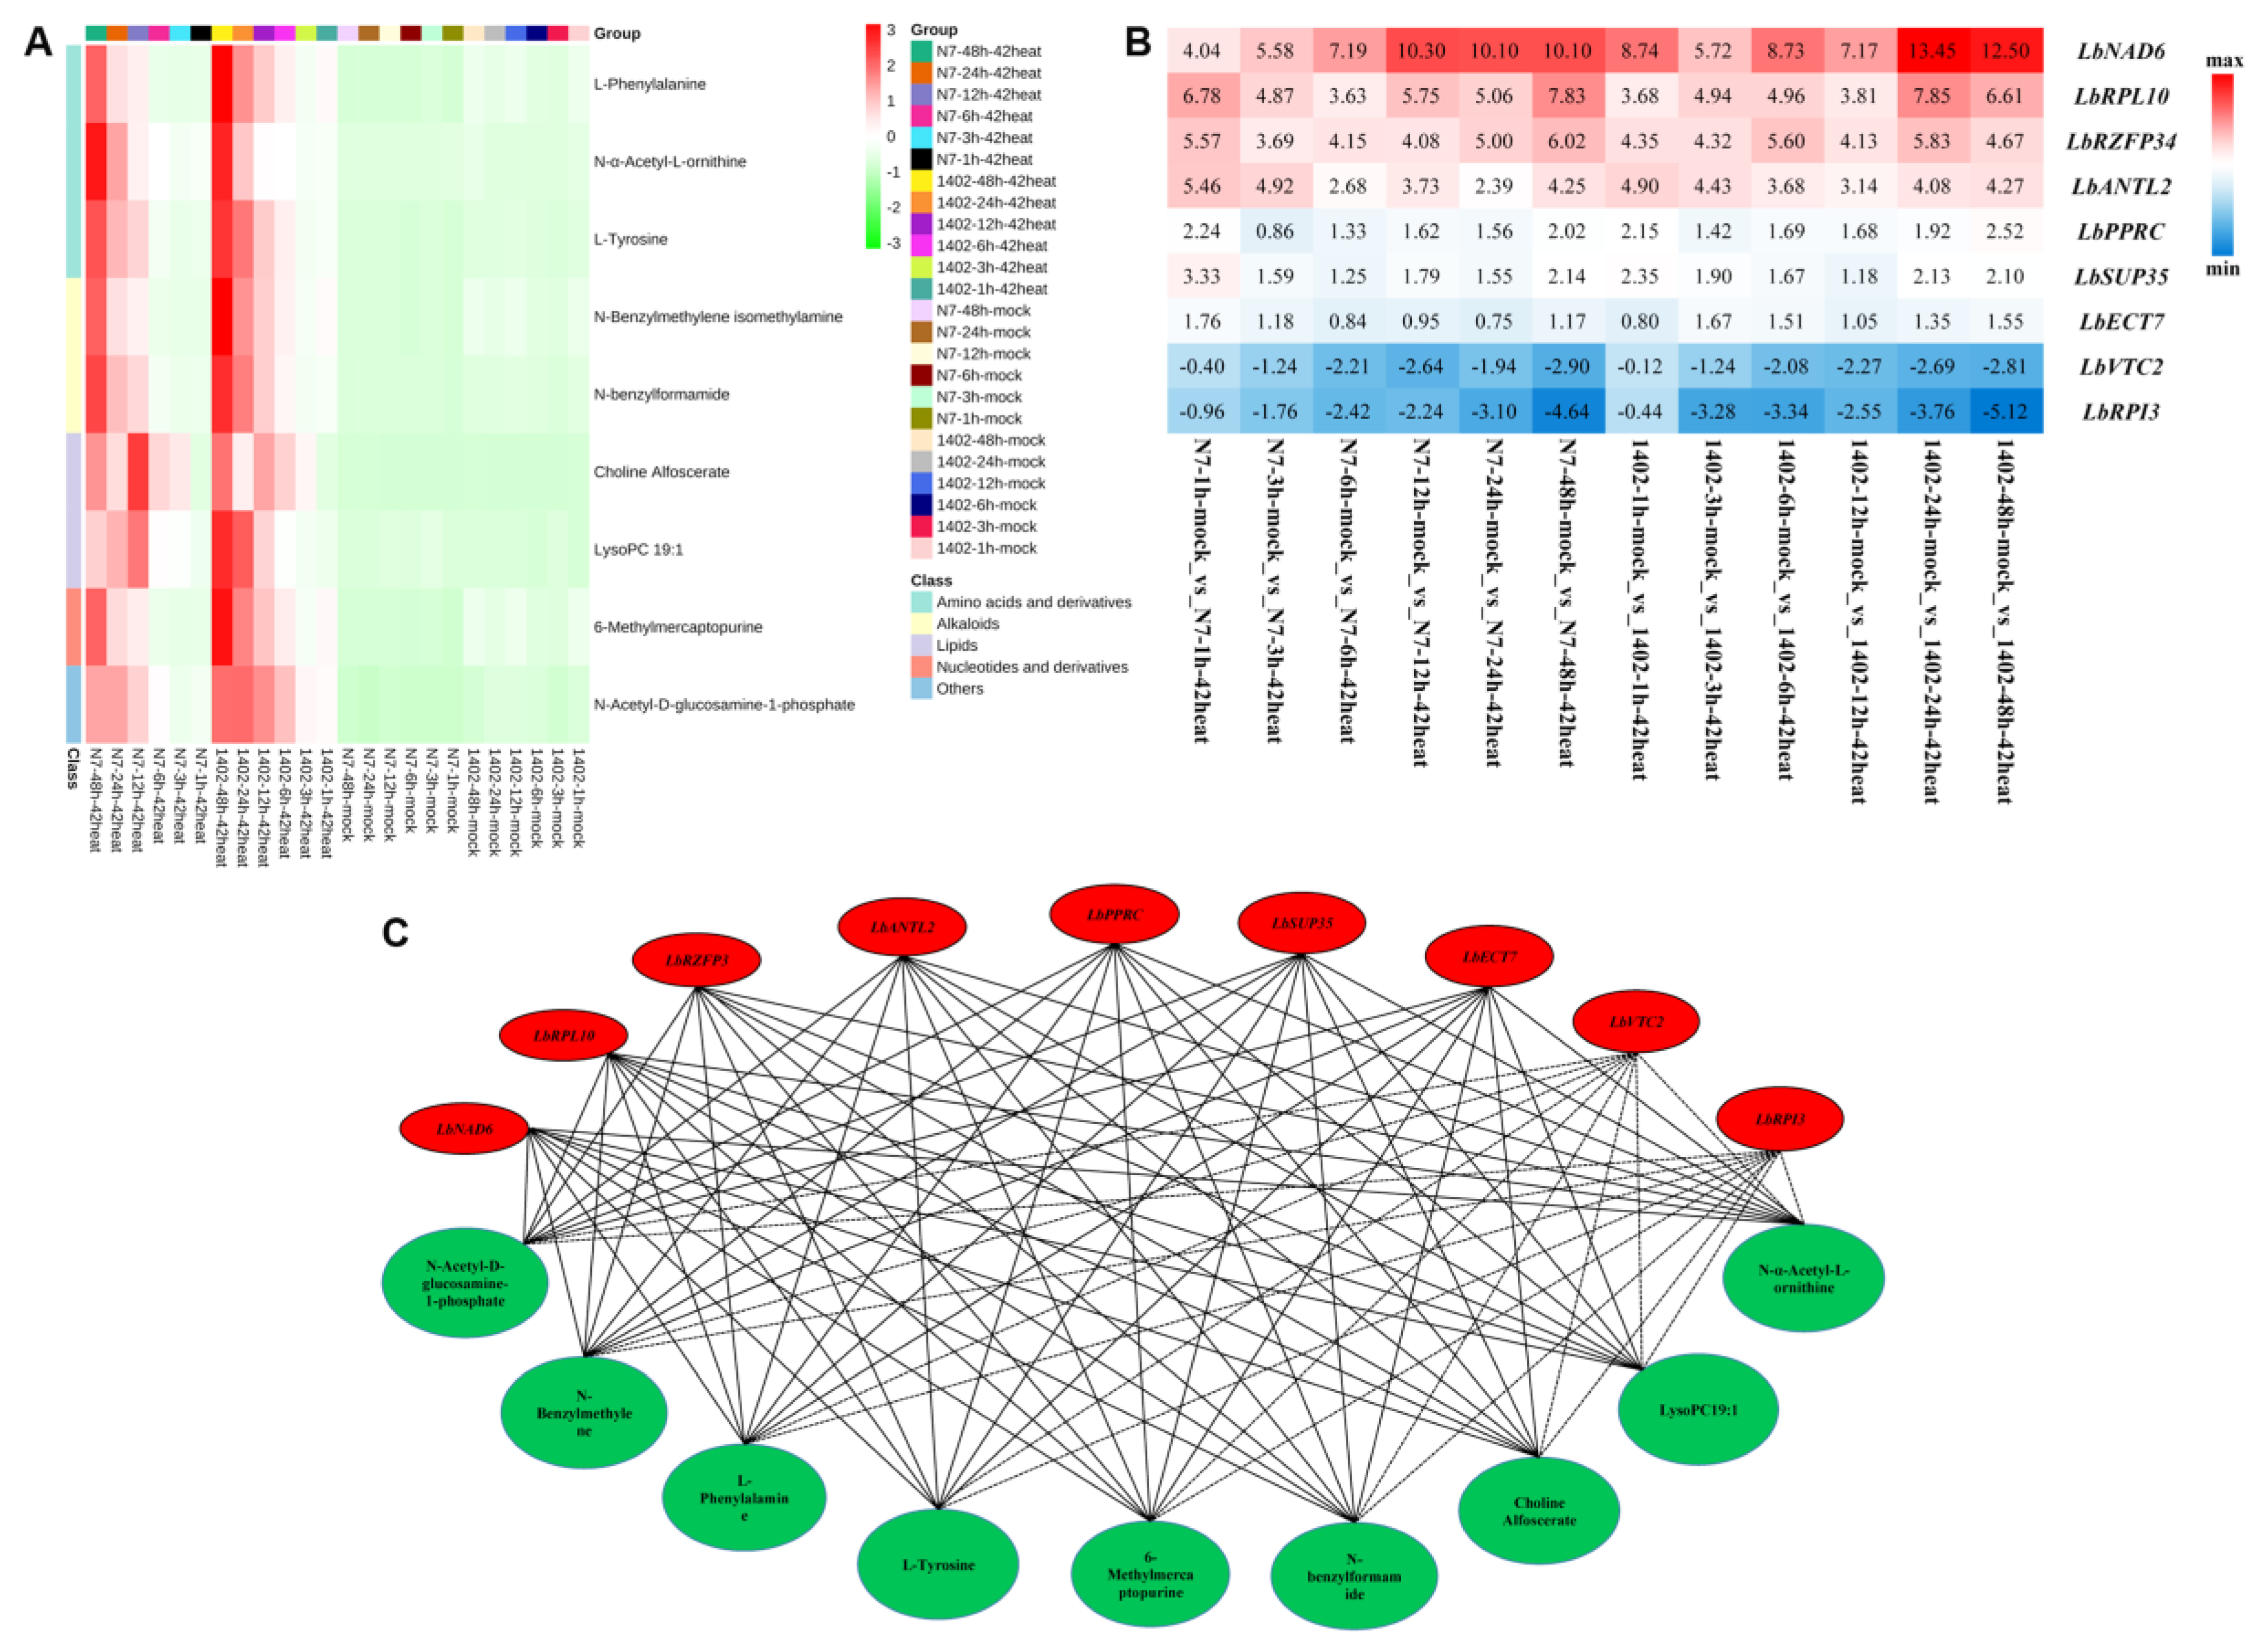
A total of nine DEMs were co-regulated in both N7 and 1402 but occurred in different regulation patterns and were divided into amino acids and their derivatives, alkaloids, lipids, nucleotides and their derivatives, and other classes (Figure 10A). In these metabolites, L-phenylalanine, L-tyrosine, N-benzylmethylene isomethylamine, N-benzylformamide, lysoPC 19:1, and N-acetyl-D-glucosamine-1-phosthate reached a higher expression level in 1402 compared to N7, and may play a key role in wolfberry heat tolerance. Different expression levels were found for shared genes in these metabolic pathways (Figure 10B). The genes LbNAD6, LbRPL10, LbRZFP34, and LbANTL2 were up-regulated, while LbVTC2 and LbRPI3 were down-regulated, most of which had a larger regulation amplitude in 1402 compared to N7. In the DEGs and DEMs network (Figure 10C), the genes LbVTC2 and LbRPI3 were negatively correlated, and the genes LbNAD6, LbRPL10, LbRZFP34, LbANTL2, LbSUP35, and LbECT7 were all positively correlated with the metabolites mentioned above.

4. Discussion

Global warming is an increasingly serious problem influencing worldwide agricultural production. Plants might not be able to successfully adapt to rising temperatures. Thus, investigating how plants cope with elevated temperatures is critical. The plant mechanisms responsible for heat stress regulation are highly complicated and include metabolite production and accumulation, up- and down-regulation of different genes, plant hormone regulation, signal factor transduction, and the influence of transcription factors, amino acid metabolism, and lipid metabolism [33,34,35,36,37]. Wolfberry is an excellent plant resource that serves as both medicine and food [29]. However, high temperature stress significantly reduces wolfberry yield. Curiously though, there are few studies on the response to high temperature stress in wolfberry. Thus, elucidating how wolfberry adapts to heat stress is a pressing problem. Therefore, we explored the transcriptome and metabolome changes between heat-resistant and heat-sensitive cultivars over time in response to high temperature stress. Our observations clearly showed that L. barbarum 1402 had a better heat stress tolerance compared to Ningqi No. 7.
Transcriptome analysis revealed a differential gene expression between 1402 and N7 in response to high temperature stress. The number of DEGs at the different time points during the heat treatment in N7 first peaked at 1 h, after which it decreased, and then reached a second peak at 48 h. In contrast, 1402 first peaked at 3 h, after which it decreased, and then again reached a second peak at 48 h over the same period. These results indicate that 1402 was better able to increase transcriptional regulation in response to heat stress. We also discovered a high temperature plant coping mechanism. Three response stages occurred in wolfberry during 48 h of heat treatment. Firstly, a rapid stress response reaction occurred when exposed to high temperatures, along with a large amount of gene activation, which occurred between 0 h and 1 h in N7 and between 0 h and 3 h in 1402. This might be due to better heat tolerance in 1402, since it did not require a rapid and high number of gene activation. Secondly, a period of time occurred in which the number of DEGs decreased compared to the first phase, whereafter it gradually increased between 1 h and 24 h in N7 and between 3 h and 24 h in 1402. This represented a phase of moderation and adaptation to high temperatures. Thirdly, the number of DEGs peaked at 48 h in both N7 and 1402. At this time point, a variety of genes were activated to resist high temperature stress. KEGG enrichment analysis showed that the ‘carbon metabolism’, ‘starch and sucrose metabolism’, ‘MAPK signaling’, and ‘biosynthesis of amino acids’ pathways commonly changed in N7 and 1402 in response to heat stress. An increased high temperature tolerance occurred in 1402 compared to N7, which was due to an earlier activation of certain metabolic pathways in 1402, such as ‘starch and sucrose metabolism’, ‘MAPK signaling pathway’, and ‘plant hormone signal transduction’.
Additionally, metabolic sequencing is currently an important technique for identifying stress-related metabolites and biological pathways [38]. The metabolic analysis showed that the number of differentially expressed metabolites increased gradually over time during the heat treatment, and specifically increased from 96 at 1 h to 222 at 48 h in N7 and increased from 109 at 1 h to 211 at 48 h in 1402. The KEGG enrichment analysis showed that the top differentially expressed metabolites were mainly enriched in amino acids and their derivatives, alkaloids, organic acids, and phenolic acids under high temperature stress.
When plants are exposed to high temperatures, heat stress signals are sensed and transduced to activate heat resistance mechanisms. The mitogen-activated protein kinase (MAPK) cascade is involved in plant heat stress responses, which is an increasing study focus. This study showed that the MAPK mechanism was closely associated with reactive oxygen species and Ca2+ signals, heat shock proteins, and heat shock transcription factors [39,40]. ROS accumulation and protein misfolding in plant cells were caused by heat stress, including their encoded proteins, such as chaperones and ROS scavengers. A serious of heat shock transcription factors were critical for plant thermotolerance [41]. Furthermore, heat stress significantly increased amino acid amounts and nutrient content, which enhanced plant growth [42]. However, the amino acid roles and modulation patterns in response to heat stress remain unknown.
In this study, the joint analysis of transcriptome and metabolome data showed that L-phenylalanine, L-tyrosine, N-benzylformamide, N-benzylmethylene isomethylamine, lysoPC 19:1, and N-acetyl-D-glucosamine-1-phosthate, as well as their related genes, had a higher content or earlier expression in 1402 compared to N7. This indicated that 1402 could respond to heat stress quicker and activate related genes and accumulate metabolites earlier than N7, thus enabling it to resist high temperatures earlier and better. This probably explains 1402′s higher resistance to high temperature stress compared to N7 and provides a feasible way to improve the heat stress tolerance of wolfberry.

5. Conclusions

In summary, we firstly explored wolfberry thermotolerance as well as how its heat stress adaptation and regulation mechanisms fluctuated over time. Moreover, L. barbarum 1402 was fairly heat-resistant, while L. barbarum Ningqi No. 7 was sensitive to high temperatures, in which amino acids and alkaloids played key roles, as well as the earlier and higher of expression and accumulation.

Author Contributions

X.Q., K.Q. and Z.M. designed and wrote the manuscript. B.Q., W.H., Y.C. (Yan Chen) and Y.Y. performed the experiments; X.Q., B.Q. and W.H. made the data analysis; Y.C. (Youlong Cao) and W.A. provided significant intellectual input and valuable contribution. All authors have read and agreed to the published version of the manuscript.

Funding

This research was funded by the Key Research and Development Project foundation of Ningxia province of China (No. 2020BFH03005), the Foreign Science and Technology Cooperation Project of Ningxia Academy of Agriculture and Forestry Sciences (No. DW-X-2020009), and the National Natural Science Foundation of China (No. 31960536).

Institutional Review Board Statement

Not applicable.

Informed Consent Statement

Not applicable.

Data Availability Statement

Not applicable.

Conflicts of Interest

The authors declare no conflict of interest.

References

  1. Jia, J.; Zhou, J.; Shi, W.; Cao, X.; Luo, J.; Polle, A.; Luo, Z.B. Comparative transcriptomic analysis reveals the roles of overlapping heat-/drought-responsive genes in poplars exposed to high temperature and drought. Sci. Rep. 2017, 7, 43215. [Google Scholar] [CrossRef] [PubMed] [Green Version]
  2. Reddy, K.R.; Kakani, V.G. Screening Capsicum species of different origins for high temperature tolerance by in vitro pollen germination and pollen tube length. Sci. Hortic. 2007, 112, 130–135. [Google Scholar] [CrossRef]
  3. Stainforth, D.A.; Aina, T.; Christensen, C.; Collins, M.; Faull, N.; Frame, D.J.; Piani, C. Uncertainty in predictions of the climate response to rising levels of greenhouse gases. Nature 2005, 433, 403. [Google Scholar] [CrossRef] [PubMed]
  4. Lobell, D.B.; Bänziger, M.; Magorokosho, C.; Vivek, B. Nonlinear heat effects on Africanmaize as evidenced by historical yield trials. Nat. Clim. Chang. 2011, 1, 42–45. [Google Scholar] [CrossRef]
  5. Palak, C.; Anna, J.W.; Arindam, G.; Lenka, Z.D.; Wolfram, W.; David, H. Heat stress response mechanisms in pollen development. New Phytol. 2021, 231, 571–585. [Google Scholar]
  6. Lippmann, R.; Babben, S.; Menger, A.; Delker, C.; Quint, M. Development of wild and cultivated plants under global warming conditions. Curr. Biol. 2019, 29, R1326–R1338. [Google Scholar] [CrossRef] [PubMed]
  7. Lesk, C.; Rowhani, P.; Ramankutty, N. Influence of extreme weather disasters on global crop production. Nature 2016, 529, 84–87. [Google Scholar] [CrossRef] [Green Version]
  8. Jagadish, S.V.K. Heat stress during flowering in cereals-Effects and adaptation strategies. New Phytol. 2020, 226, 1567–1572. [Google Scholar] [CrossRef] [Green Version]
  9. Wahid, A.; Gelani, S.; Asjraf, M.; Foolad, M.R. Heat tolerance in plants. Environ. Exp. Botany 2007, 61, 199–223. [Google Scholar] [CrossRef]
  10. Nankishore, A.; Farrell, A.D. The response of contrasting tomato genotypes to combined heat and drought stress. J. Plant Physiol. 2016, 202, 75–82. [Google Scholar] [CrossRef]
  11. Salvucci, M.E.; Crafts-Brandner, S.J. Relationship between the heat tolerance of photosynthesis and the thermal stability of Rubisco activase in plants from contrasting thermal environments. Plant Physiol. 2004, 134, 1460–1470. [Google Scholar] [CrossRef]
  12. Pareek, A.; Sopory, S.K.; Bohnert, H.J. Abiotic Stress Adaptation in Plants; Springer: Berlin/Heidelberg, Germany; University of Illinois at Urbana-USA: Champaign, IL, USA, 2009. [Google Scholar]
  13. Berova, M.; Stoeva, N.; Zlatko, Z.; Ganeva, D. Physiological response of some tomato genotypes (Lycopersicon esculentum L.) to high-temperature stress. J. Cent. Eur. Agric. 2013, 9, 723–732. [Google Scholar]
  14. Abdelrahman, M.; El-Sayed, M.; Jogaiah, S.; Burritt, D.J.; Tran, L.S. The “STAY-GREEN” trait and phytohormone signalling networks in plants under heat stress. Plant Cell Rep. 2017, 36, 1009–1025. [Google Scholar] [CrossRef]
  15. Larkindale, J.; Hall, J.D.; Knight, M.R.; Vierling, E. Heat stress phenotypes of Arabidopsis mutants implicate multiple signaling pathways in the acquisition of thermotolerance. Plant Physiol. 2005, 138, 882–897. [Google Scholar] [CrossRef] [Green Version]
  16. Krishna, K.R.; Neha, P.; Shashi, P.R. Salicylic acid and nitric oxide signaling in plant heat stress. Physiol. Plant. 2020, 168, 241–255. [Google Scholar]
  17. Qu, G.Q.; Liu, X.; Zhang, Y.L.; Yao, D.; Ma, Q.M.; Yang, M.Y.; Luo, Y.B. Evidence for programmed cell death and activation of specific caspa se-like enzymes in the tomato fruit heat stress response. Planta 2009, 229, 1269–1279. [Google Scholar] [CrossRef]
  18. Muhammed, A.; Mahmood, T.; Richard, T.; Nabil, A. An overview of heat stress in tomato (Solanum lycopersicum L.). Saudi J. Biol. Sci. 2021, 28, 1654–1663. [Google Scholar]
  19. Rhodes, D.; Hanson, A. Quaternary ammonium and tertiary sulfonium compounds in higher plants. Annu. Rev. Plant Biol. 1993, 44, 357–384. [Google Scholar] [CrossRef]
  20. Chen, T.H.; Murata, N. Enhancement of tolerance of abiotic stress by metabolic engineering of betaines and other compatible solutes. Curr. Opin. Plant Biol. 2002, 5, 250–257. [Google Scholar] [CrossRef]
  21. Patterson, B.D.; Graham, D. Temperature and metabolism. In DD Davies. Biochem. Plants A Compr. Treatise 1987, 12, 153–199. [Google Scholar]
  22. Randall, R.; Mayer, J.H.C.; David, R. Effects of Heat Shock on Amino Acid Metabolism of Cowpea Cells. Plant Physiol. 1990, 94, 796–810. [Google Scholar]
  23. Zhao, J.; Lu, Z.; Wang, L.; Jin, B. Plant Responses to Heat Stress: Physiology, Transcription, Noncoding RNAs, and Epigenetics. Int. J. Mol. Sci. 2021, 22, 117. [Google Scholar] [CrossRef]
  24. Ohama, N.; Sato, H.; Shinozaki, K.; Yamaguchi-Shinozaki, K. Transcriptional regulatory network of plant heat stress response. Trends Plant Sci. 2017, 22, 53–65. [Google Scholar] [CrossRef]
  25. Ren, S.; Ma, K.; Lu, Z.; Chen, G.; Cui, J.; Tong, P.; Wang, L.; Teng, N.; Jin, B. Transcriptomic and metabolomic analysis of the heat-Stress response of Populus tomentosa Carr. Forests 2019, 10, 383. [Google Scholar] [CrossRef] [Green Version]
  26. Krishna, J.S.V.; Danielle, A.W.; Thomas, D.S. Plant heat stress: Concepts directing future research. Plant Cell Environ. 2021, 44, 1992–2005. [Google Scholar]
  27. Liam, D. Plant Evolution: An Ancient Mechanism Protects Plants and Algae from Heat Stress. Curr. Biol. 2020, 30, R263–R285. [Google Scholar]
  28. Zhao, L.; Jie, T.; Renu, S.; Diane, C.B.; Stephen, H.H. The Transcription Factor bZIP60 Links the Unfolded Protein Response to the Heat Stress Response in Maize. Plant Cell 2020, 32, 3559–3575. [Google Scholar]
  29. Amagase, H.; Farnsworth, N.R. A review of botanical characteristics, phytochemistry, clinical relevance in efficacy and safety of Lycium barbarum fruit (Goji). Food Res. Int. 2011, 44, 1702–1717. [Google Scholar] [CrossRef]
  30. Toh, D.W.K.; Lee, W.Y.; Zhou, H.; Sutanto, C.N.; Lee, D.P.S.; Tan, D.; Kim, J.E. Wolfberry (Lycium barbarum) Consumption with a Healthy Dietary Pattern Lowers Oxidative Stress in Middle-Aged and Older Adults: A Randomized Controlled Trial. Antioxidants 2021, 10, 567. [Google Scholar] [CrossRef]
  31. Zhang, H.; Li, G.; Fu, C.; Duan, S.; Hu, D.; Guo, X. Genome-wide identification, transcriptome analysis and alternative splicing events of Hsf family genes in maize. Sci. Rep. 2020, 10, 8073. [Google Scholar] [CrossRef]
  32. Xing, F.; Li, Z.; Sun, A.; Xing, D. Reactive oxygen species promote chloroplast dysfunction and salicylic acid accumulation in fumonisin B1-induced cell death. FEBS Lett. 2013, 587, 2164–2172. [Google Scholar] [CrossRef] [PubMed] [Green Version]
  33. Kothari, A.; Lachowiec, J. Roles of Brassinosteroids in Mitigating Heat Stress Damage in Cereal Crops. Int. J. Mol. Sci. 2021, 22, 2706. [Google Scholar]
  34. Jin, J.; Yang, L.; Fan, D.; Liu, X.; Hao, Q. Comparative transcriptome analysis uncovers different heat stress responses in heat-resistant and heat-sensitive jujube cultivars. PLoS ONE 2020, 15, e0235763. [Google Scholar] [CrossRef] [PubMed]
  35. Guihur, A.; Rebeaud, M.E.; Goloubinoff, P. How do plants feel the heat and survive? Trends Biochem. Sci. 2022, 22, 824–838. [Google Scholar] [CrossRef] [PubMed]
  36. Wang, S.; Hu, T.; Tian, A.; Luo, B.; Du, C.; Zhang, S.; Huang, S.; Zhang, F.; Wang, X. Modification of Serine 1040 of SIBRI1 Increases Fruit Yield by Enhancing Tolerance to Heat Stress in Tomato. Int. J. Mol. Sci. 2020, 21, 7681. [Google Scholar] [CrossRef] [PubMed]
  37. Hasanuzzaman, M.; Nahar, K.; Alam, M.M.; Roychowdhury, R.; Fujita, M. Physiological, biochemical, and molecular mechanisms of heat stress tolerance in plants. Int. J. Mol. Sci. 2013, 14, 9643–9684. [Google Scholar] [CrossRef]
  38. Wang, C.; Zhou, Y.; Yang, X.; Zhang, B.; Xu, F.; Wang, Y.; Song, C.; Yi, M.; Ma, N.; Zhou, X.; et al. The Heat Stress Transcription Factor LlHsfA4 Enhanced Basic Thermotolerance through Regulating ROS Metabolism in Lilies (Lilium Longiflorum). Int. J. Mol. Sci. 2022, 23, 572. [Google Scholar] [CrossRef]
  39. Yu, B.; Ming, F.; Liang, Y.; Wang, Y.; Gan, Y.; Qiu, Z.; Yan, S.; Cao, B. Heat Stress Resistance Mechanisms of Two Cucumber Varieties from Different Regions. Int. J. Mol. Sci. 2022, 23, 1817. [Google Scholar] [CrossRef]
  40. Mo, S.; Qian, Y.; Zhang, W.; Qian, L.; Wang, Y.; Cailin, G.; Ding, H. Mitogen-activated protein kinase action in plant response to high-temperature stress: A mini review. Protoplasma 2021, 258, 477–482. [Google Scholar] [CrossRef]
  41. Yanglin, D.; Yiting, S.; Shuhua, Y. Molecular regulation of plant responses to environmental temperatures. Mol. Plant 2020, 13, 544–564. [Google Scholar]
  42. Waqas, M.; Shahzad, R.; Khan, A.L.; Asaf, S.; Kim, Y.H.; Kang, S.M.; Bilal, S.; Hamayun, M.; Lee, I.J. Salvaging effect of triacontanol on plant growth, thermotolerance, macro-nutrient content, amino acid concentration and modulation of defense hormonal levels under heat stress. Plant Physiol. Biochem. 2016, 99, 118–125. [Google Scholar] [CrossRef]
Figure 1. Phenotypic heat stress response with different high temperature treatment times in two wolfberry lines. (A) Phenotype of L. barbarum Ningqi No. 7 and 1402 under the 42 °C treatment from 0 h to 48 h; (B) leaf chlorophyll content in Ningqi No. 7 and 1402 under the 42 °C treatment from 0 h to 48 h. N = 3. Bars = mean ± SEM.
Sustainability 14 12617 g001
Figure 2. Overview of differentially expressed genes (DEGs) in Ningqi No. 7 (N7) and 1402 under high temperature treatment. (A) Number of up-regulated and down-regulated DEGs in the two wolfberry lines under high temperature treatment at each time point; (B) PCA (principal component analysis) clustering based on transcriptome data.
Sustainability 14 12617 g002
Figure 3. KEGG enrichment analysis statistics of co- and differentially expressed DEGs (different expressed genes) between L. barbarum N7 and 1402 under heat stress at different treatment time points. The ordinate represents the KEGG pathway and the abscissa represents the rich factor. Greater rich factors indicate greater degrees of enrichment. Larger dots indicate a higher number of DEGs enriched by the pathway. Higher dot color intensities indicate more significant enrichment.
Sustainability 14 12617 g003aSustainability 14 12617 g003b
Figure 4. k-means transcriptomic analysis of significant DEGs in N7 and 1402 under high temperature stress. The DEGs are divided into 20 groups, which are classified into four categories according to the differences between N7 and 1402 in gene expression trends (sunfigure I, II, III, IV). I, no regulation change when subjected to heat stress, in both N7 and 1402. II, similar regulation change tendencies between N7 and 1402 when exposed to high temperature. III, genes expression levels changed significantly in N7, but either minimal or no trend changes in 1402. IV, genes expression levels changed significantly in 1402 but not in N7. The KEGG pathway enrichments are listed in the corresponding panels to the right.
Sustainability 14 12617 g004
Figure 5. Metabolome analysis of Ningqi No. 7 (N7) and 1402 in response to high temperature treatments. (A) Number of differentially expressed metabolites in N7 and 1402 under high temperature treatment at each time point; (B) PCA (principal component analysis) clustering based on the metabolome data.
Sustainability 14 12617 g005
Figure 6. Analysis of co- and differentially expressed metabolites in L. barbarum N7 and 1402 in response to heat stress. (A) Upset diagrams of the differentially expressed metabolites during different time points under heat stress in N7 or 1402; (B) Venn diagrams of the differentially expressed metabolites between N7 and 1402 at different time points under heat stress.
Sustainability 14 12617 g006aSustainability 14 12617 g006b
Figure 8. Heatmap of differentially expressed metabolites that were shared at 1, 3, 6, 12, 24, and 48 h in response to heat stress in L. barbarum N7 or 1402. (A) The differentially expressed metabolites shared all heat treatment time points in N7; (B) the differentially expressed metabolites shared all heat treatment time points in 1402.
Sustainability 14 12617 g008
Figure 9. KEGG pathway enrichment (histogram of p-values) analysis of L. barbarum N7 and 1402 under control and heat stress groups at 1 h, 3 h, 6 h, 12 h, 24 h, and 48 h after treatment. The abscissa represents metabolic pathways and the ordinate represents enriched p-values; the red and green columns represent the differentially expressed genes and metabolites, respectively.
Sustainability 14 12617 g009aSustainability 14 12617 g009b
Figure 10. Identification of co-expression network modules. (A) Heatmap of the differentially expressed metabolites in response to heat stress; (B) heatmap of the differentially expressed genes in response to heat stress; (C) network of the DEGs and DEMs that were co-regulated in the indicated pathways. Metabolites are highlighted in green and genes are highlighted in red. Solid lines refer to positive regulation while dashed lines refer to negative regulation.
Sustainability 14 12617 g010
Publisher’s Note: MDPI stays neutral with regard to jurisdictional claims in published maps and institutional affiliations.