Article

A Study of Chinese Consumers’ Consistent Use of Mobile Food Ordering Apps

1
College of Business Administration, Wonkwang University, No. 460, Iksandae-ro, Iksan 54538, Korea
2
Department of Business and Administration, Shandong Jiaotong University, Jinan 250307, China
3
Department of Management, Shandong Vocational University of Foreign Affairs, Weihai 264504, China
4
Department of Business and Administration, Mokpo University, Yeongsan-ro, Cheonggye-myeon, Muan-gun 58554, Korea
*
Author to whom correspondence should be addressed.
Sustainability 2022, 14(19), 12589; https://doi.org/10.3390/su141912589
Submission received: 18 September 2022 / Revised: 28 September 2022 / Accepted: 30 September 2022 / Published: 3 October 2022

Abstract

:
Mobile Food Ordering Apps (MFOAs) programs have changed the way consumers order and consume food. Mobile Food Ordering Apps (MFOAs) are widely recognized in the restaurant industry as an innovative method of serving customers; however, there are important questions about the impact of implementing MFOAs on customers’ willingness to reuse such applications, and several studies have examined the results of using MFOAs from a customer perspective. The main objective of this study was to identify and empirically test the main factors that predict Chinese users’ attitudes toward MFOAs, the satisfaction and re-use of such applications, and the moderating role of habits. This study proposes an integrated model based on the Technology Acceptance Model (TAM) and the Expectation Confirmation Theory (ECT), combined with the features of MFOA-added variables such as online reviews, price value and trust. A total of 212 valid questionnaires were obtained and collected from a sample of Chinese customers using MFOAs. This study uses SPSS 26.0 and smartPLS version 3.0 for a path analysis and empirical testing of the research model. There are 13 hypotheses, 6 of which are valid. H2(PE → SAT), H3(OR → SAT), H5(EOU → ATT), H6(PV → ATT), H7(TR → ATT), and H9(SAT → CI) are valid. However, H1(CON →SAT), H4(USF → ATT), H8(TR → CI), H10(ATT → CI) are not valid, and HAB does not play a moderating role between CI and SAT, CI and ATT, and CI and TR. Based on the research results, theoretical contributions and practical implications can be provided for scholars and practitioners in MFOA-related fields.

1. Introduction

With the rapid development of information and communication technology (ICT) and smartphones, smart technologies and mobile application (app) software have become a widespread and integral part of daily life [1,2,3,4,5,6]. The number of active Internet users was close to 4.66 billion in 2020, covering 59% of the global population. Of these, mobile users have always been the most prevalent, accounting for 91% of all Internet users [7]. As most industries began to adopt automated machinery to manage their daily operations more efficiently, as well as reduce risk and waste, the Internet has created a new paradigm in the use of technology. The rapid growth of the Internet and technology as a new global marketplace has bridged the divide between time and space. In today’s Internet age, information integration among supply chain members is becoming increasingly important [8]. As the Internet booms, smartphones are becoming more common and ubiquitous. More and more companies are taking advantage of this by reaching as many consumers as possible through mobile apps [9]. The growth of mobile apps plays an integral role in creating opportunities for businesses, especially in the takeaway industry. The growth potential of MFOAs around the world is evident. For example, in terms of countries, the top three markets for MFOAs are China (e.g., Meituan), which is expected to generate USD 51.514 billion in 2020; the U.S. (e.g., Seamless, Grubhub), which is expected to generate USD 23.991 billion in 2020; and India (e.g., Swiggy), which is expected to grow at a 10% incremental rate, eventually reaching a market size of USD 13,233 million by 2024 [10].
Takeaway services using Mobile Food Ordering Apps have become a rapidly growing trend in China and a convenient way for these businesses to increase their sales revenue [11]. Either online or via their smartphones or tablets, an increasing number of people are using Mobile Food Ordering Apps, such as Elema, Meituan, Baidu and Koubei Takeaway, which can deliver food from their favorite restaurants directly to their doorstep with just a few simple clicks. The MFOA business is booming in China and is now the ultimate platform for generating business opportunities and increasing revenue [11]. MFOAs and services are gradually affecting the restaurant industry, mainly because of the growing potential of takeaway services to ensure staff productivity, the accuracy of takeaway orders and creation of customer databases [12]. Some of the restaurants that offer their own online delivery services include Delta, Pizza Hut, KFC, and many other small restaurants in urban areas. In contrast, multi-restaurant mobile apps such as Foodpanda, Zomato, and Uber Eats can act as intermediaries between different restaurants [13], and Chinese takeaways, such as Meituan, Elema, etc., can act as intermediaries for different restaurants to provide services to consumers. By using these apps, customers can more easily and efficiently order food from a wide variety of restaurants at a convenient time and location. Along with this information, customers are able to see the progress of their order at all stages [14,15,16,17]. Furthermore, most previous studies on mobile applications, especially on MFOAs, have simply discussed aspects related to customer intent and initial adoption, in order to fill this gap. For example, Okumus et al. used the UTAUT model [18]; Wang, Tseng et al. used the IS Success model [19]; Okumus and Bilgihan used the TAM model [20]; Cho et al. used the quality attributes theory [21]; and Yeo et al. used a contingency framework and extended model of IT continuance [22]. This paper is based on this previous research, and the main objective of this study is to further investigate the moderating role of satisfaction, attitudes and customer intent to efficiently reuse and explore the implementation of a new model that combines TAM and ECT. The other three constructs related to mobile application functionality (online reviews, perceived value and trust) are included in the same model. In particular, maintaining social distance and other precautions during the COVID-19 pandemic reduced the number of consumers dining out at restaurants [23]. As a result, mobile food ordering applications (MFOAs) are becoming increasingly popular among customers [24].

2. Literature Review

Previous research found the following results. The study of [22] examined the structural relationships between convenience motivation, post-use usefulness, hedonic motivation, price-saving orientation, time-saving orientation, online purchasing experience, consumer attitudes and behavioral intentions toward OFD services. The first theoretical contribution based on the technology acceptance model (TAM) is presented in [20] and proposes a number of factors (i.e., perceived enjoyment, perceived usefulness, social norms, self-efficacy, and perceived ease of use) as key predictors of customers’ willingness to use MFOAs. The authors of [25] studied the effects of brand identity satisfaction, brand satisfaction and brand loyalty on brand identity. All hypothesized relationships between these variables in the model were supported. The study of [26] showed that Koreans with a high moral obligation (or married people) are less willing to translate their basic inclination into actual intention to adopt FDA compared to those with a low moral obligation (or single people). The authors of [18] tested whether innovativeness has a moderating effect between UTAUT factors and willingness to use mobile diet apps. Their findings largely supported the role of performance expectations, effort expectations, and social influence. However, the moderating effect of innovation was not supported.
In [19], a model based on IS success was proposed to predict the main outcomes of customers’ use of mobile catering apps. They found that consumers are more likely to positively review such apps and be satisfied with their user experience if the apps contain high-quality information, services, systems, and products. In the study of [21], consumers’ perceived value and attitudes toward takeaway apps were largely influenced by trust level, design and product authenticity, and significant differences in the consumer perceptions of such apps were observed between single and multi-person households. In [24] visual design, information design and navigation design had an impact on the conversion of food aggregators. In addition, a new structure and collaborative design was identified through focus group discussions, which in turn influenced conversions. The findings suggest that food aggregators need to design a visually appealing and well-structured mobile app to influence customers’ purchase decisions and conversion outcomes. The results of [27] show that customers’ perceived validation and usefulness have a significant impact on their dining attitudes. Furthermore, customers’ dining attitudes were positively associated with network satisfaction. Finally, web satisfaction significantly influenced customers’ continued intention to use MFOAs. In [28], performance expectations were the strongest predictor of OFDS’ intention to use MFOAs, followed by congruence with self-image. Predictors of low quantiles included habit and positive thoughts, while impulse purchase tendency had a negative effect on the intention to use OFDS. In [29], the effect of pleasure and arousal was explored, while aesthetic form only affects pleasure in online food delivery. This study also shows that app designs for OFDS create a sense of arousal in consumers who are excited to share their experience with other consumers and revisit the app, thus confirming the mediating effect of pleasure and arousal on word-of-mouth.
In [30], it was found that source credibility, review validity, navigation system, food quality, and service quality significantly affect perceived customer value. Consumers’ perceived value, in turn, positively influences their purchase intention. The findings also found that the effects of review valence, navigation system, food quality, and service quality on customer perceived value depend on the different levels of the restaurant. The findings in [31] suggest that recovery strategies are associated with guilt-free feelings, resentment, and brand trust, but not with NWOM. In [32], habits have the greatest impact on the willingness to consistently use MFOAs, followed by performance expectations and social influence. We revealed a full mediation effect, confirming that consumer elasticity and attitude are strong mediators for predicting consumer satisfaction. In [33], the findings show that product engagement and consumer resilience are critical for outbound applications and building positive customer attitudes, which significantly contribute to increased satisfaction and purchase intent. The authors of [29] showed that aesthetic appeal is associated with pleasure and arousal. Aesthetic form is associated with pleasure, word-of-mouth, and revisiting intentions. In addition, pleasure affects arousal, word-of-mouth, and revisiting intentions. These findings also confirm the moderating role of pleasure and arousal. The authors of [34] showed that satisfaction was the most significant influencing factor and that perceived task–technology fit, trust, performance expectations, social influence and confirmation had direct or indirect positive effects on users’ intention to continue using MFOAs. The authors of [35] showed that perceived food quality (PFQ) has a positive effect on price fairness (PF) and perceived value (PV). Price fairness (PF), perceived value (PV), and customer satisfaction (CS) were also significantly and positively related. The findings also support that consumers’ behavioral intentions are influenced by customer satisfaction (CS). Customer satisfaction (CS) partially mediates the relationship between perceived food quality (PFQ), price fairness (PF), perceived value (PV) and behavioral intention.

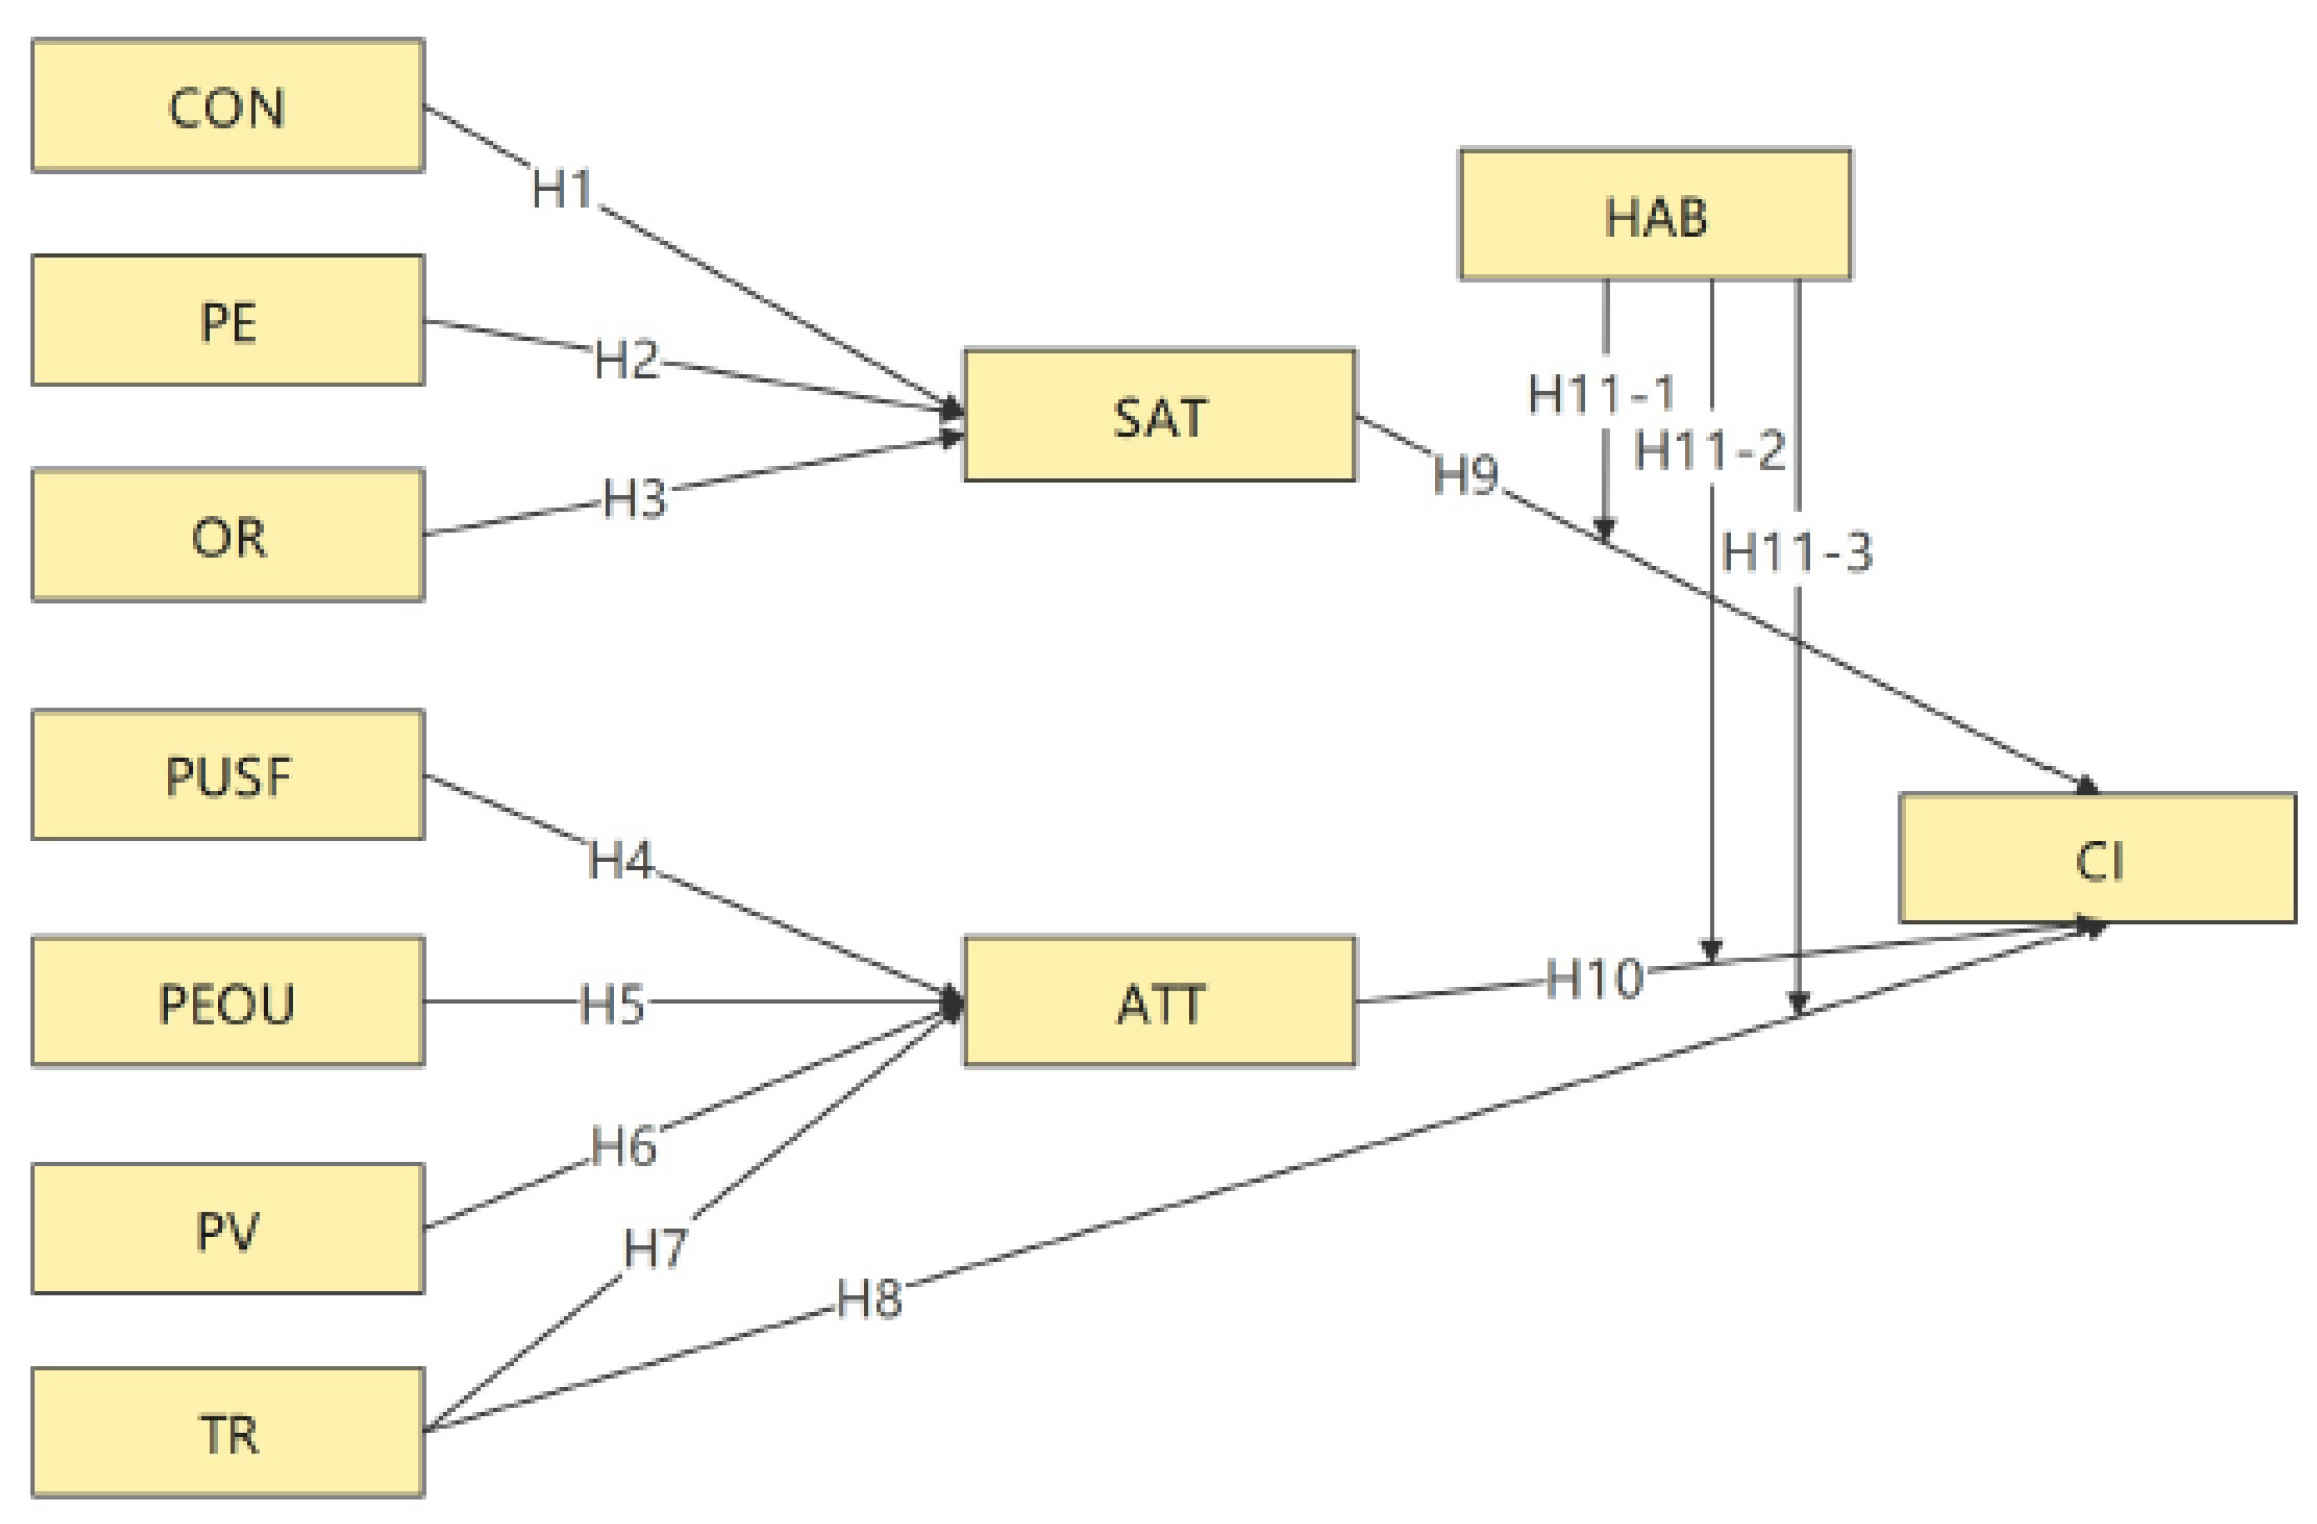
3. Research Model and Hypothesis Development

We propose a research model to solve this problem, as shown in Figure 1. The variables of the model include confirmation, performance expectancy, online reviews, perceived usefulness, perceived ease of use, perceived value, trust, satisfaction, attitude, and habit, and the outcome variable is the intention to consistently use MFOAs.

3.1. Confirmation (CON)

Confirmation (CON) is defined as the degree to which users perceive an information system to be consistent with their previous expectations and actual performance [36]. In terms of ECM, [36] states that CON is an important predictor of performance expectations and satisfaction and determines users’ willingness to continue using information systems. This study considers CON as the extent to which consumers’ initial expectations of MFOA are confirmed, affecting satisfaction with continued use. The authors of [37] verified that CON has a significant positive effect on performance expectations and satisfaction with users’ willingness to continue using web services. Similar results have been verified by applying ECM in various mobile technology ongoing use environments, such as mobile banking [38]. Therefore, this study proposes the following hypothesis:
Hypothesis 1 (H1).
Confirmation will positively influence Chinese customers’ satisfaction with MFOAs.

3.2. Performance Expectancy (PE)

Customer perceptions of the primary utility and benefits of using new technology products and services have been repeatedly shown to influence behavioral intentions and the actual adoption of new technology products and services [39,40,41,42]. Performance expectations represent the ability of new systems and applications to help customers achieve their needs in a more convenient and efficient way [43]. The potential mobility and flexibility features provide more convenience for customers to interact with the restaurant as opposed to MFOAs. For example, by using MFOAs, customers can effectively visit any restaurant at any time of the day, any day of the week, have a wide variety of food options, gather enough information, and place orders remotely [19,20,21]. MFOAs are particularly important considering issues such as traffic, parking and long waiting times at restaurants. Therefore, it can be assumed that, if customers find high practical value in using these innovative applications, they are more likely to be satisfied and happy with their experience of using MFOAs [27]. This study proposes the following hypothesis:
Hypothesis 2 (H2).
Performance expectations will positively influence the satisfaction of Chinese customers with MFOAs.

3.3. Online Review (OR)

The interactive nature of MFOAs allows customers to give their own feedback on the restaurants they deal with and share that feedback with other customers on ordering platforms [44]. In other words, the online reviews provided by customers are a kind of word-of-mouth published through online platforms [45,46,47]. Consumers consider such reviews to be an important and valuable source of information when purchasing products or evaluating alternatives [45,48,49]. As a result, online reviews can generally predict the willingness of customers to use an MFOA upon reading such reviews [48]. This study proposes the following hypothesis:
Hypothesis 3 (H3).
Online reviews positively influence Chinese customers’ satisfaction with MFOA.

3.4. Perceived Usefulness (PUSF)

The Technology Acceptance Model (TAM), originally proposed by Davis [49], argues that the country in which a new technology is useful and practical plays an important role in the adoption of that technology [49]. Perceived usefulness is defined as the degree to which a person believes that using a particular system will improve their performance, and one of the most important predictors of consumer attitudes toward the adoption of new technologies is perceived usefulness [49]. Customers show positive attitudes toward using MFOAs when they find technology applications useful and practical [50]. The authors of [51] showed that the more customers perceive MFOAs to be useful, the more positive attitudes they build toward MFOA. This is because MFOA service providers may promote the usefulness of these applications in educating customers and connecting restaurants by providing useful features such as nutritional details, map directions, direct-dial phone numbers, online coupons and notifications. In addition, the TRA model shows that perceived usefulness significantly affects consumer attitudes. For example, in the context of online food delivery systems, perceived usefulness was found to be used as an antecedent of customer attitudes and behavioral intentions [52]. This study proposes the following hypothesis:
Hypothesis 4 (H4).
Perceived usefulness will positively influence Chinese customers’ attitude toward MFOA.

3.5. Perceived Ease of Use (PEOU)

Perceived ease of use (PEOU) is defined as the degree of mental or physical challenge a person expects when adopting a new technology [53]. Many studies have confirmed that PEOU has a significant impact on customers’ intention to use various technologies. For example, the authors of [54] suggest that customers are willing to accept online shopping if mobile devices and web interfaces are easy to access and require little effort. Research supports a positive and significant relationship between ease of use and online shopping attitudes [55,56]. This study proposes the following hypothesis:
Hypothesis 5 (H5).
Perceived ease of use will positively influence Chinese customers’ attitude toward MFOA.

3.6. Perceived Value (PV)

Perceived value is defined as the consumer’s overall evaluation of the perceived utility of a service or product by comparing the perceived benefits with the corresponding costs [57,58]. Consumers’ positive or negative evaluations and feelings about a product affect their overall evaluation of the product’s utility and value [59]. When perceived value is considered as an overall judgment of the relative value weights of different products, it can be expressed as the total benefit received by the consumer. Therefore, it is considered as one of the main antecedents of consumer attitudes and willingness to repurchase [60]. Consumers have a more positive attitude when their expectations of these takeaway apps match or exceed their perceived value [21]. This study proposes the following hypothesis:
Hypothesis 6 (H6).
Perceived value will positively influence the attitude of Chinese customers toward MFOA.

3.7. Trust (TR)

Trust (TR) refers to an index of positive beliefs about perceived reliability, dependability, and assurance in a person, object, or process [61]. Trust is conceptualized as a subjective belief that an online provider will fulfill its transactional obligations because consumers understand these obligations [62]. In e-commerce, trust in a website plays a crucial role because if consumers do not trust the website, they are less likely to shop online [63]. TR has a positive feeling about technology-based services [64]. Customers with low service TR tend to be skeptical and reluctant to adopt certain services. Trust was found to influence consumer attitudes and willingness to engage in trusting behavior [65]. Consumers who trust online travel product websites will have a positive attitude toward them [66]. This study proposes the following hypothesis:
Hypothesis 7 (H7).
Trust will positively influence the attitude of Chinese customers toward MFOAs.
Hypothesis 8 (H8).
Trust will positively influence the continued use of MFOAs by Chinese customers.

3.8. Satisfaction (SAT)

Satisfaction is one of the key constructs used in research models to explain consumer behavior. Based on expectation confirmation theory, satisfaction is defined as “the generalized psychological state resulting from the combination of emotions surrounding unconfirmed expectations and consumers’ prior feelings about the consumption experience” [67]. According to this definition, satisfaction arises when consumers’ expectations are met and dissatisfaction arises in other instances [68]. The relationship between customer satisfaction and behavioral intentions has long been established in the marketing literature [69]. If MFOA services confirm customer expectations, customers are more likely to be satisfied with their previous purchase experience and to repeat food orders through MFOAs [27]. Recently, [39] found that e-satisfaction in Jordan was positively correlated with customers’ willingness to continue using MFOA. This study proposes the following hypothesis:
Hypothesis 9 (H9).
Satisfaction will positively influence the continued use of MFOAs by Chinese customers.

3.9. Attitude (ATT)

In a seminal article by Davis [70], the adoption of a technology is determined by behavioral intention, which is a combination of one’s attitude and perceived usefulness. Attitude has a significant influence on behavioral intention, and behavioral intention can be highly predicted by attitude. A person’s attitude may influence a response of arousal, depending on the individual’s observable behavior [71]. Furthermore, a person with a favorable attitude toward a behavior will be more inclined to adopt a particular kind of behavior [72,73]. On this basis, we can clearly see a positive correlation between attitudes and behavioral intentions. An example is the protection of information technology, more commonly known as antivirus software [74] and technology in the hospitality industry [75]. Surveys have shown that attitudes toward online shopping are the strongest factor in online shopping intentions [76]. This study proposes the following hypothesis:
Hypothesis 10 (H10).
Attitudes will positively influence the continued use of MFOA by Chinese customers.

3.10. Habit (HAB)

The development of a habit requires some repetition or practice [77]. Online shopping habits can be viewed as an automatic behavioral response that is triggered by sitting stimuli without the need for a cognitive analysis process due to the learned association between the shopping behavior and a satisfactory outcome [77,78,79,80]. Habit is defined as a set of learned behaviors that have become automatic responses to a given situation and that may play a role in achieving certain goals or end states [81]. In the context of online shopping, habit is defined as an automatic behavioral response that is induced by a condition or circumstance without conscious mental processes. It is caused by the association between shopping behavior and satisfactory outcomes as a result of past experiences [82]. The authors of [83] believe that habit moderates the relationship between purchase intention and its determinants.
Habit is considered to be a positive moderator of the effect of satisfaction on repurchase intention. Khalifa and Liu [84] suggest that customers with higher habit are more likely to repurchase from the same online store than those without such habit if their satisfaction with the online store is the same. This provides empirical evidence to support the effect of the positive conditioning satisfaction of habit on repeat purchase intention [84].
Morrison and Firmstone [85] believes that the main function of trust is to reduce uncertainty. Uncertainty refers to a person’s perceived inability to accurately predict something [86]. When uncertainty or ambiguity are high, people have no clear guidance or useful cues to explain the behavior of others; therefore, trust can have a powerful impact in such situations. In situations of uncertainty or ambiguity, trust plays a small role in helping people understand or judge the behavior of others [87]. Habits are an effective way to manage risk by eliminating a sense of uncertainty; therefore, habits are the most effective elements for trust to function [85]. This study argues that habit may make the conscious consideration of uncertainty unnecessary. Thus, habit negatively moderates the relationship between trust and repetitive purchase intention [83].
Hypothesis 11-1 (H11-1).
Habit positively moderates the effect between satisfaction and repeat purchase.
Hypothesis 11-2 (H11-2).
Habit reduces the effect of trust on repeat purchases.
Hypothesis 11-3 (H11-3).
Habit reduces the impact of attitude on repeat purchases.

4. Methodology

Sample and Data Collection

Data were collected by means of a questionnaire that described the purpose of the study and thanked the respondents. Respondents’ demographic information was anonymously recorded (see Table 1). The questionnaire did not address issues such as human rights, racial discrimination, etc. The questionnaire was conducted completely anonymously, and no personal information of any participants appears in this paper. The data collected in this study were used only for the research purposes of this thesis, and we have assured the respondents of this. All entries of the scale were taken from the relevant literature (see Appendix A). All items were measured using a 5-point Likert scale ranging from 1 (strongly disagree) to 5 (strongly agree).
Before the official release of the questionnaire, we invited 50 MFOA users to test the questionnaire and redesigned the questionnaire based on the feedback from the testers.
After finalizing the questionnaire, our survey was distributed on wenjunxing (https://www.wjx.cn (accessed on 7 June 2022)), one of the most popular online survey sites in China. China has the highest use of Internet-related technologies in the world [88], and 304 questionnaires were collected. First, we wanted respondents to know the benefits and problems they face when using MFOAs. Therefore, firstly, respondents needed to have used MFOAs at least once, and secondly, due to outliers, incomplete data and suspicious data patterns, ineligible questionnaires were removed, leaving a total of 212 valid questionnaires collected for the analysis.
In order to ensure the representativeness of our questionnaire, we set up restrictive questions in the questionnaire. The subjects first answered whether they had used MFOAs before filling out the questionnaire. If they filled in no, then we considered the questionnaire invalid.

5. Date Analysis

In this study, the data obtained were analyzed using two statistical software. Demographic data were obtained using (SPSS) version 26.0 software. The convergent validity, discriminant validity, relationship between variables, and the significance of the model were analyzed using the partial least squares structural equation model (PLS-SEM3.0). SmartPLS is commonly used for structural equation modeling [17,89,90]. Because it can better handle complex models, non-normally distributed data, smaller sample sizes, predictive or exploratory studies, theory development or theory testing, and an interaction term analysis were used [91,92].

5.1. Measurement Model

SmartPLS 3.0 provides validation factor analysis (CFA) to assess the reliability and validity of the structure. The assessment of measurement models (construct validity) and item loadings (see Table 2), AVE, composite reliability (CR), and Cronbach’s alpha values were assessed. Fornell and Larcker [89] suggested that the composite reliability (CR) and Cronbach’s alpha values should be above 0.70. In the convergent validity analysis process, the reliability of the constructs must meet the following criteria: the factor loadings must be greater than 0.5; the CR values must be greater than 0.6; and the AVE values must be greater than 0.5 [90]. All values of AVE and CR also exceeded the threshold values. Therefore, all values met the criteria for convergent validity.

5.1.1. Reliability Analysis

Fornell and Larcker [89] suggested using Cronbach’s alpha and composite reliability (CR) values to check the reliability of the structure, which should be greater than 0.70. To verify the reliability of the internal consistency, the PLS-Algorithm of SmartPLS 3.0 was used.
After the factor loading analysis in Table 2, the external factor loading values for all the measures were 0.70 and above, and the factor loadings were significant at the p < 0.001 level, so it can be judged that convergent validity is guaranteed [90], the AVE value is greater than 0.5 [89], and the composite reliability (CR) ideal confidence above a threshold of 0.70 [90,93]. Therefore, all values satisfy the condition of convergent validity. Internal consistency reliability and Cronbach’s alpha all show a reliability of 0.70 or greater [94].

5.1.2. Discriminant Validity Analysis

Discriminant validity describes the extent to which items differ from each other [95]. The criterion from [89] was used to check discriminant validity by specifying that the square root of the AVE for each construct should be greater than the correlation coefficient between the constructs. The authors of [89] specified that the square root of the AVE of each construct should be greater than the correlation coefficient between the constructs.
The square root of the AVE for each factor on the diagonal in Table 3 is greater than the correlation coefficient between any pair of factors, indicating the discriminant validity between the variables. Another way to test for convergent and discriminant validity is to examine the factor loadings of each measurement element. The paper of [96] suggested that each measurement element has a higher level of factor loading than the other measurement elements.
The cross loading in Table 4 revealed that the factor loadings of the measured elements of each variable were higher than the correlations with other variables, so the convergent validity and discriminant validity were guaranteed and analyzed in this study.

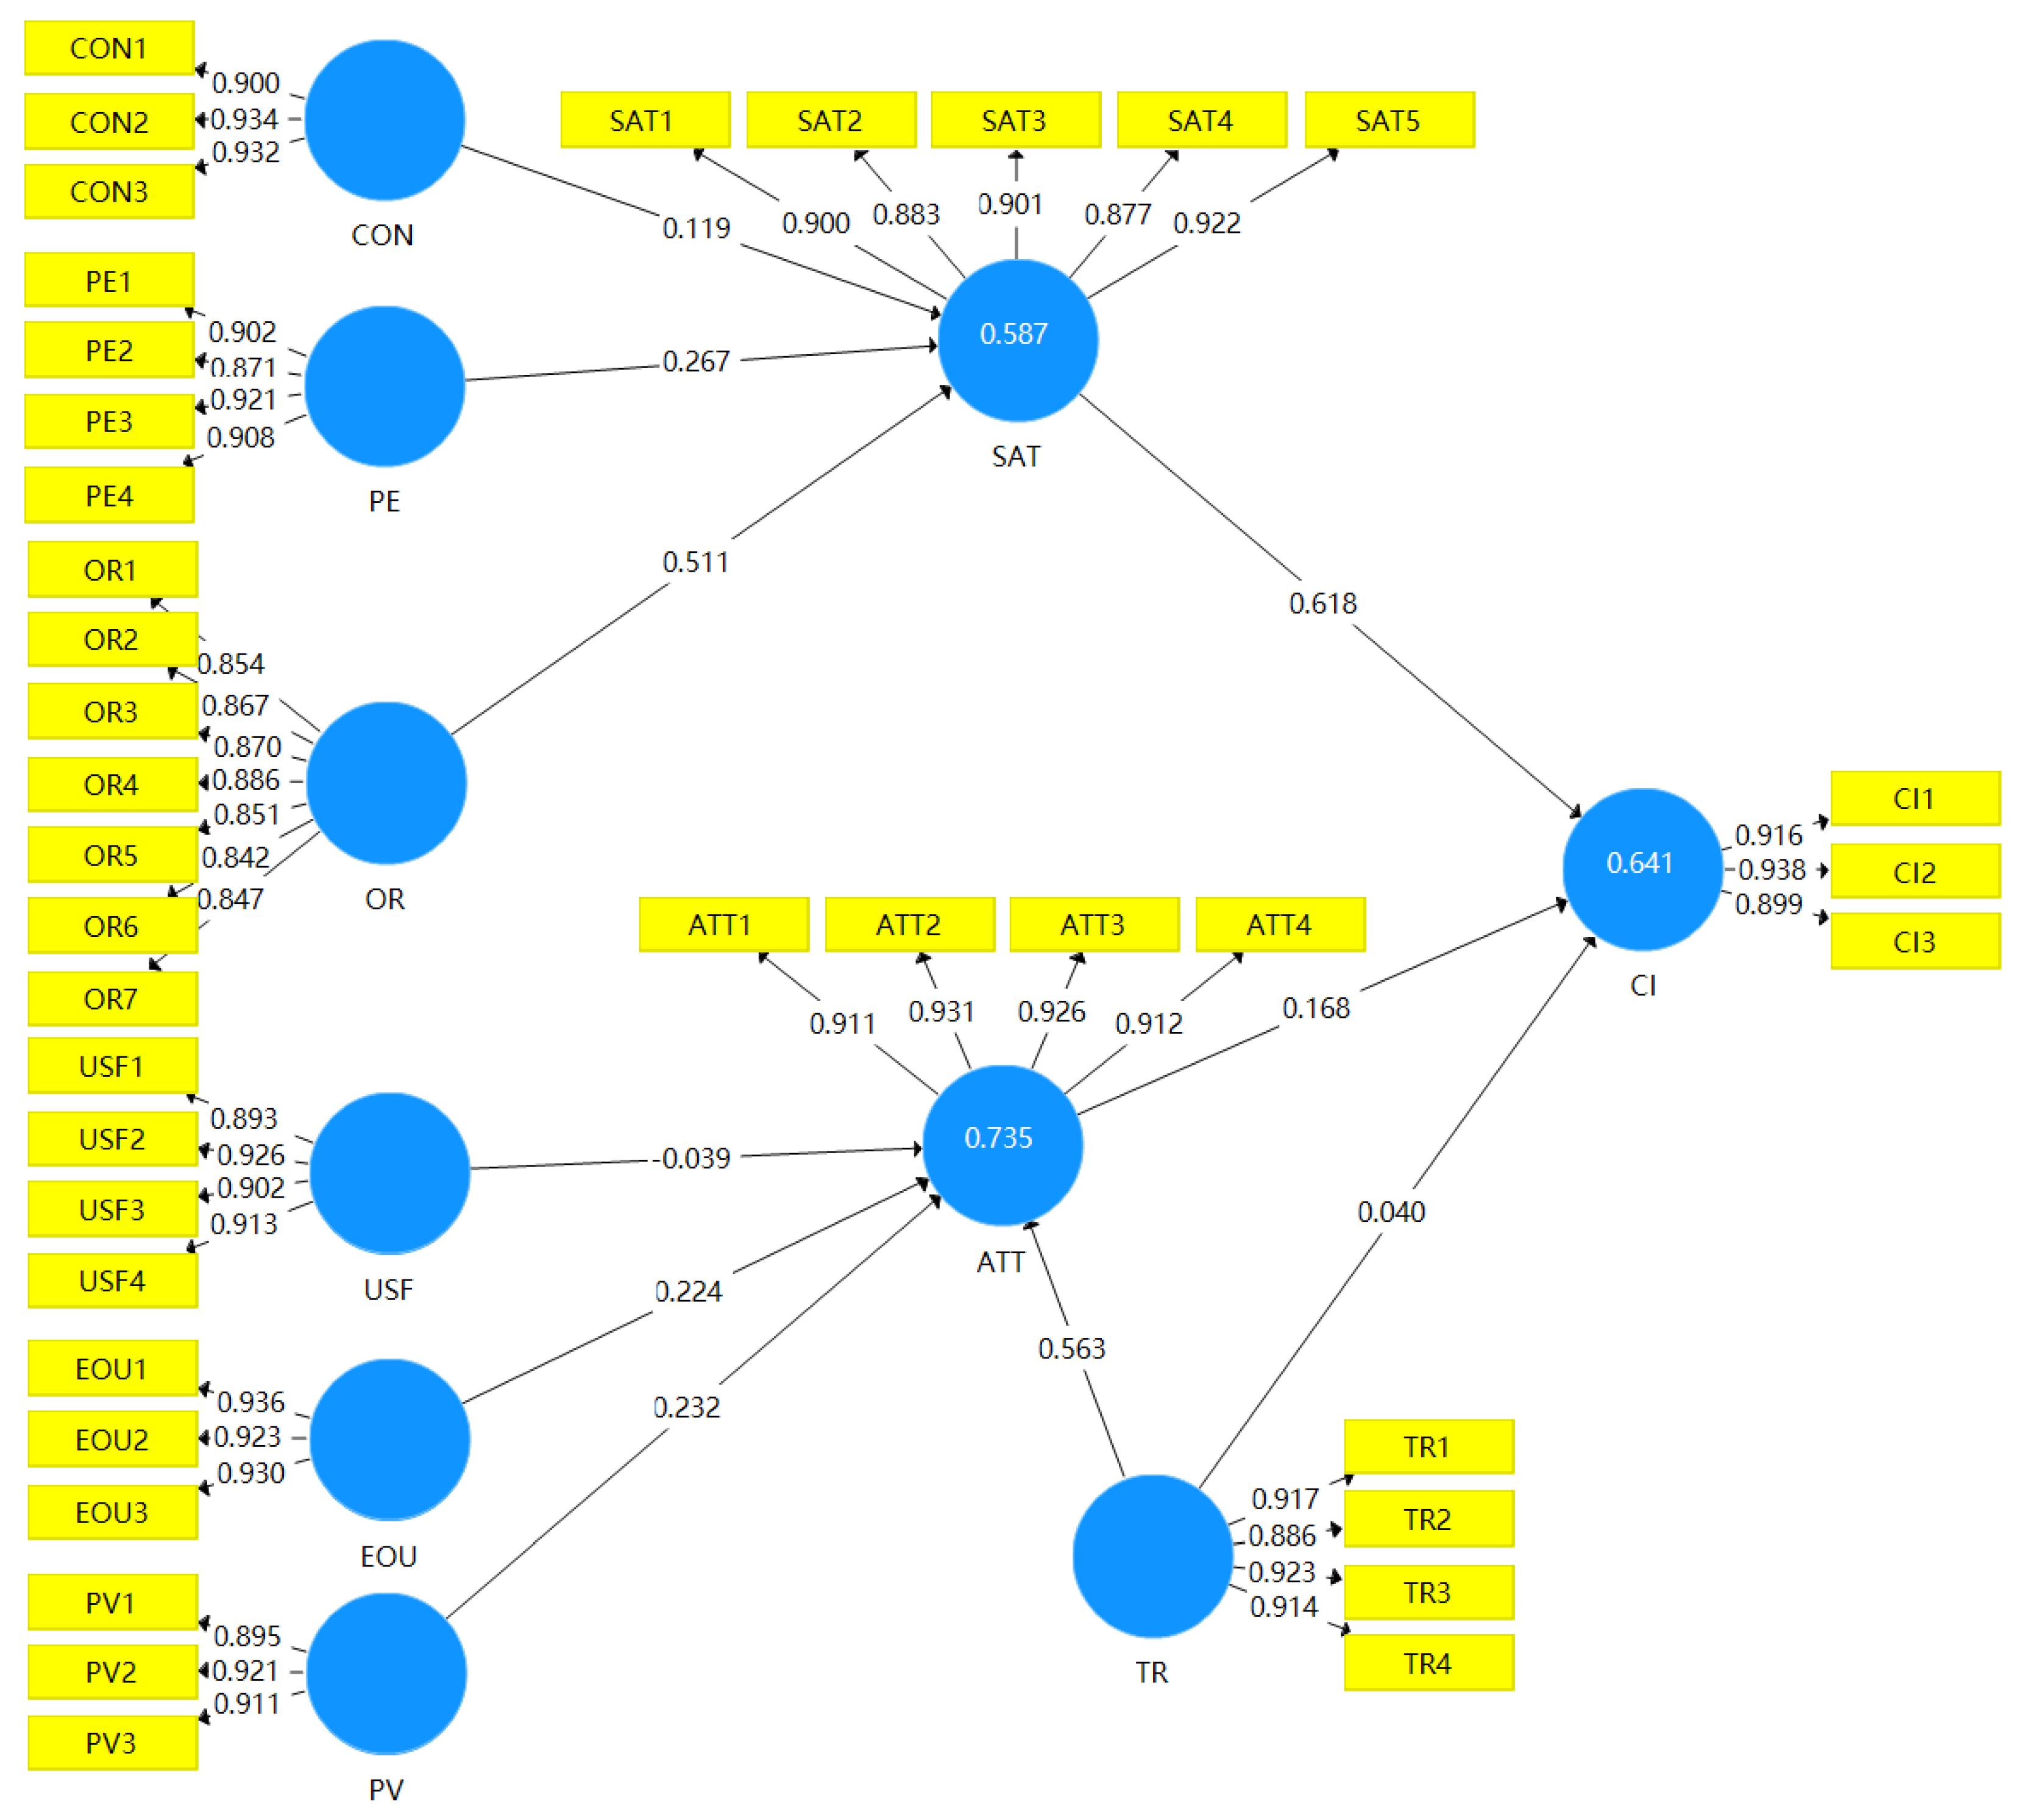
5.2. Structural Model

The results show that the study model meets the requirements of reliability and validity through the tests of reliability and validity. In this study, using Smart PLS3.0 software, we started to evaluate the structural model using the coefficient of determination (R2) and the significance level of each path coefficient. Figure 2 presents the PLS-Algorithm, including the loading factor. The number in the circle of the endogenous potential variable is R2. The numbers shown by arrows are all external factor loadings and path coefficients of the independent and dependent variables, indicating standardized regression coefficients, which can be compared with each other. The numbers on the straight lines between the latent variables are the path coefficient values.

5.2.1. Coefficient of Determination (R2)

For the assessment of the explained variance R2 of all endogenous structures using the PLS-Algorithm, the results are shown in Table 5. The paper of [96] concluded that the endogenous latent variable R2 = 0.67 has a high explanatory power, R2 = 0.33 indicates a moderate explanatory power, and R2 = 0.19 indicates a weak explanatory power.
The results show that the model has a strong explanatory power for the dependent variables. Exogenous factors have more than a 73% explanatory power for the variance of consumer attitudes, in addition to nearly a 64% explanatory power for the continued use and a 58% explanatory power for satisfaction.

5.2.2. Predictive Relevance (Q2)

For the evaluation of predictive correlation, the algorithm of PLS-Blindfolding Q2 was used. The authors of [96,97] proposed Q2 > 0 as a predictor (0.02, 0.15, 0.35 for weak, medium and strong predictors of Q2.
Table 6 shows that the results of the structural model can be evaluated by predictive relevance since the endogenous latent variables, such as attitude toward consistent use and satisfaction, have a Q2 greater than 0.

5.3. Result of Hypothesis Verification

Smart PLS version 3.0 was used for hypothesis validation. In this study, 5000 bootstrap runs were chosen to obtain a stable result, and t-values and path coefficients were calculated to determine whether to reject the null hypothesis and confidence interval. If the absolute value of the test statistic t > 1.96 (threshold), the original hypothesis (H0) is rejected and the research hypothesis (H1) is adopted. If the absolute value of the test statistic t < 1.96 (p > 0.05), the original hypothesis (H0) is adopted, and the research hypothesis (H1) is rejected.

5.3.1. Tests of the Direct Effect

Table 7 indicates the results of the direct effects of the structural model, including the coefficients and their significance. The results reveal the relationship between each pair of constructs and support nearly half of the hypotheses for H2, H3, H5, H6, H7, H9, respectively (β = 0.267, p < 0.001; β = 0.511, p < 0.001; β = 0.224, p < 0.05; β = 0.232, p < 0.01; β = 0.563, p < 0.001; β = 0.618, p < 0.001).
The hypotheses H2 (PE → SAT), H3 (OR → SAT), H5 (EOU → ATT), H6 (PV → ATT), H7 (TR → ATT), and H9 (SAT → CI) are valid. The other hypotheses are not supported.

5.3.2. Tests of the Moderating Effects

Finally, the moderating effect of habit was validated. Habits do not play a role in the bar regulation between CI and SAT, between CI and ATT, and between CI and TR. The SmartPLS method recommended by Fassott, Henseler and Coelho [98] was used for evaluation.
According to Table 8, habit did not play a moderating role between satisfaction and continued use, attitude and continued use, and trust and continued use. β = −0.078, p > 0.05; β = 0.034, p > 0.05; β = −0.051, p > 0.05.

6. Discussion

With their growing popularity, marketing scholars and practitioners have recognized mobile applications as effective digital communication and consumer engagement tools. To explore the role of mobile apps in consumer engagement, this study explains consumers’ willingness to consistently use MFOAs by developing and testing a comprehensive research model. In this study, a combination of technology acceptance model and expectation confirmation theory was used, and variables such as perceived performance, perceived usefulness, perceived ease of use, trust, perceived value, satisfaction, and attitude were used to examine customers’ intention to continue using MFOAs. The results show that 6 of the 13 hypotheses proved to be significant.
In this paper, H1 (β = 0.119 p = 0.092) is not significant, which is contrary to the results found by Lee and Kwon. H2 (β = 0.267, p < 0.001) is significant, validating the previous study by Alarwan. The results for H3 (β = 0.511, p < 0.001) are significant and are the same as those of Elwalda, Lü and Ali. The results for H4 (β = −0.039, p = 0.729) were non-significant, contrary to the findings of Alagoz and Hekimoglu. The results of H5 (β = 0.224, p < 0.05) are the same as those of Ayeh, Zhu and Chang. The results of H6 (β = 0.232, p < 0.01) are corroborated in the previous study by Cho, Bonn and Li. The results of H7 (β = 0.563, p < 0.000) are a significant validation of the previous study by Grabner-Kraeuter. The results of H8 (β = 0.040, p = 0.705) are non-significant, which is in opposition to the results in the study by Alsajjan and Dennis. The results of H9 (β = 0.618, p < 0.000) are significant and the same as those found in the previous study by Alalwan. The results of H10 (β = 0.168, p = 0.144) are non-significant, which is in opposition to the findings of Limayem, Hirt and Cheung.
Habit plays no role in moderating variables. H11-1 (β = 0.119, p = 0.580) was not significant. However, in Khalifa and LIu’s study, habit was considered to be the factor that positively moderates the effect of satisfaction on repeat purchase intention. If satisfaction with an online store is the same, customers with higher levels of habituation are more likely to purchase again from the same online store than those without habituation. The results of 11-2 (β = 0.034, p =-0.759) are not significant, but the moderating variable for habituation in Agag and Masry’s study is significant. The results of 11-3 (β =−0.051, p = 0.641) are also non-significant, but habit played a negative moderating role between continued use and attitude in Chiu, Lai and Chang’s study.
Some of the research hypotheses in this paper, although not valid, have been tested in some other papers outside of China. We believe that there are many factors that contribute to these results, such as cultural, dietary, economic, and geographical differences between China and other countries.

6.1. Theoretical Contribution

This study investigated the factors that determine the intention to continue using MFOAs. Firstly, the theoretical contribution of this paper is different from that of the previous literature, which showed that satisfaction was the strongest predictor of consistent use, whereas the results of this paper are those attitudes. Secondly, this study greatly enriches the literature on MFOAs and provides new perspectives for future researchers. Thirdly, although TAM and ECM models are well-known, few researchers in the field of mobile food ordering applications have studied these two models together, which could improve our understanding of both models. Fourthly, this study improves consumer attitudes toward MFOA use and actual ordering behavior, addressing the overemphasis on satisfaction in the prior literature.
This study provides vital information for those in the food service industry that customers’ willingness to consistently use MFOAs is driven by confirmation, performance expectations, satisfaction, perceived ease of use, perceived usefulness, and attitude. Notably, in this paper, attitude is the most important factor in customers’ willingness to consistently use, followed by satisfaction; this is in contrast to previous research where attitude was the strongest factor in the consistent use of MFOAs. MFOAs will continue to be used more often, especially in China since the pandemic continues to affect many restaurants that have to move their businesses online in order to survive. Therefore, the findings of this paper can also be used as a reference for other service industries.

6.2. Practical Implications

In addition to its contribution to theory, this study provides additional information on the main factors of marketing. In this paper, attitude is the most influential factor in predicting the willingness to consistently reuse MFOAs. Therefore, marketers should focus more on the role of promotion in order to convince customers to use MFOAs and spend less time and effort compared to dining in person at a restaurant or ordering on the phone. In this regard, great importance should be attributed to the accuracy of delivery times. In fact, issues related to delivery times can influence customers’ perceptions of the usefulness and efficiency of MFOAs. In addition, the regular maintenance of MFOAs is necessary to ensure their reliability and quality so that customers are able to efficiently order food. It is also important to pay attention to technical support and the resources needed to facilitate the successful use of MFOAs. Customer service systems should be available at all times to ensure that customers’ issues are appropriately addressed.
Furthermore, financial incentives are necessary to make consumers feel that ordering food through MFOAs is cost-effective (e.g., price discounts, quantity discounts, points and rewards, such as vouchers) [99]. Special treatment for loyal customers is very important, and operators can rely on loyal customers to attract other customers by offering rewards for such referrals. Operators should encourage customers to rate and provide reviews, and they should facilitate this rating and review process [45]. It is vital to convince customers that such ratings and reviews are critical to improving restaurant performance.

7. Conclusions

This study sought to provide a better understanding of the aspects that may influence Chinese customers’ intentions to continue using MFOAs, since only a few studies have explored MFOA-related issues thus far. The combined TAM and ECM models were considered to be an appropriate theoretical basis for the proposed conceptual model, and the data for this study were collected from actual users of MFOAs in China. The data were analyzed using SPSS 26.0 and smartPLS 3.0, and the results largely support the validity of the current study model, confirming that attitude and satisfaction were the most significant predictors of sustained MFOA use, and that habit did not play a moderating role in this study.

Limitations and Future Research Direction

Although this study aims to enrich the current understanding of the continued use of MFOAs by Chinese consumers, some limitations should be noted. The nature of the current study is cross-sectional, and the findings may not be generalizable to different countries. Therefore, it is not yet possible to obtain an accurate perspective to explain how customer perceptions have changed over time. Therefore, in future research, longitudinal studies are needed to reveal how customers’ attitudes and satisfaction have changed over time. While many factors have been covered in the current research model, other factors (mobile interactivity and customization) could be considered in future research, and this study did not consider the impact of cultural factors (e.g., eating habits, health awareness, family size, and lifestyle). Future studies take these cultural aspects into account and try to generalize the findings to a wider geographical area.

Author Contributions

Conceptualization, X.W. and W.Z.; methodology, X.W.; software, T.Z.; validation, X.W., Y.W. and W.Z.; formal analysis, S.N.; investigation, X.W.; resources, X.W.; data curation, T.Z.; writing—original draft preparation, X.W.; writing—review and editing, X.W.; visualization, Y.W.; supervision, S.N.; project administration, T.Z.; funding acquisition, W.Z. All authors have read and agreed to the published version of the manuscript.

Funding

This research was funded by National Natural Science Foundation of China grant number (72072154).

Institutional Review Board Statement

Not applicable.

Informed Consent Statement

Informed consent was obtained from all subjects involved in the study.

Data Availability Statement

Data sharing not applicable.

Conflicts of Interest

The authors declare no conflict of interest.

Appendix A. Measurement Items of the Study

ConstructsDescriptionSources
Confirmation (CON)CON1-My experience with using the mobile food order apps was better than what I expected.
CON2-The benefit provided by the mobile food order apps was better than what I expected.
CON3-Overall, most of my expectations from using the mobile food order apps were confirmed.
[82,100]
Performance Expectancy (PE)PE1-I feel that mobile food order apps are useful for ordering and receiving delivery food.
PE2-I feel mobile food order apps are convenient to order and receive delivery food.
PE3-Using mobile food order apps help me accomplish tasks more quickly.
PE4-Using mobile food order apps increases my productivity.
[34,39]
Online Review (OR)OR1-The information from online reviews provided in mobile food order apps was credible.
OR2-The information from online reviews provided in mobile food order apps was relevant to my needs.
OR3-The information from online reviews provided in mobile food order apps was based on facts.
OR4-The information from online reviews provided in mobile food order apps was of sufficient depth(degree of detail)
OR5-The information from online reviews provided in mobile food order apps was of sufficient breadth (spanning different subject areas).
OR6-There quantity of information provided in mobile food order apps was sufficient to satisfy my needs.
OR7-The information provided in online reviews of mobile food order apps was helpful for me to evaluate the product.
[44]
Usefulness (USF)USF1-Using mobile food order apps would enable me to better check the ordering and receiving process of delivery food.
USF2-Using mobile food order apps would make it more convenient to order and receive delivery food.
USF3-Using mobile food order apps would improve the process of ordering and receiving delivery food.
USF4-mobile food order apps would be useful for ordering and receiving delivery food.
[53,101]
Ease of use (EOU)EOU1-I would find it easy to order food using mobile food order apps.
EOU2-My operation of mobile food order apps would be clear and understandable.
EOU3-Using mobile food order apps would not require a lot of mental effort.
[101]
Price Value (PV)PV1-mobile food order apps are reasonably priced.
PV2-mobile food order apps are good value for the money.
PV3-At the current price, mobile food order apps provide good value.
[39,102]
Trust(TR)TR1-I believe mobile food order apps is trustworthy
TR2-I believe mobile food order apps keep customers’ interests in mind.
TR3-I felt secure in ordering and receiving delivery food through the mobile food order apps.
TR4-I trust mobile food order apps service to do the job right.
[102]
Satisfaction (SAT)SAT1-I am generally pleased with mobile food order apps.
SAT2-I am very satisfied with mobile food order apps.
SAT3-I am happy with mobile food order apps.
SAT4-I am satisfied with the way that mobile food order apps have carried out transactions.
SAT5-Overall, I was satisfied with mobile food order apps.
[16]
Attitude (ATT)ATT1-Purchasing food through mobile food order apps services is wise
ATT2-Purchasing food through mobile food order apps services is good
ATT3-Purchasing food through mobile food order apps services is sensible
ATT4-Purchasing food through mobile food order apps services is rewarding
[103]
Habit (HAB)HAB1-Shopping at the Groupon is something I do frequently.
HAB2-Shopping at the Groupon is nature to me.
HAB3-Shopping at the Groupon is something I do without thinking.
[82]
Continued Intention (CI)CI1-I intend to continue using mobile food order apps in the future.
CI2-I will always try to use mobile food order apps in my daily life.
CI3-I plan to continue to use mobile food order apps frequently.
[39,102]

References

  1. Baabdullah, A.M.; Alalwan, A.A.; Rana, N.P.; Patil, P.; Dwivedi, Y.K. An integrated model for m-banking adoption in Saudi Arabia. Int. J. Bank Mark. 2019, 37, 452–478. [Google Scholar] [CrossRef] [Green Version]
  2. Lal, B.; Dwivedi, Y.K. Homeworkers’ usage of mobile phones; social isolation in the home-workplace. J. Enterp. Inf. Manag. 2009, 22, 257–274. [Google Scholar] [CrossRef]
  3. Shareef, M.A.; Archer, N.; Dwivedi, Y.K. Examining adoption behavior of mobile government. J. Comput. Inf. Syst. 2012, 53, 39–49. [Google Scholar]
  4. Dwivedi, Y.K.; Shareef, M.A.; Simintiras, A.C.; Lal, B.; Weerakkody, V. A generalised adoption model for services: A cross-country comparison of mobile health (m-health). Gov. Inf. Q. 2016, 33, 174–187. [Google Scholar] [CrossRef] [Green Version]
  5. Shareef, M.A.; Kumar, V.; Dwivedi, Y.K.; Kumar, U. Service delivery through mobile-government (mGov): Driving factors and cultural impacts. Inf. Syst. Front. 2016, 18, 315–332. [Google Scholar] [CrossRef] [Green Version]
  6. Ismagilova, E.; Hughes, L.; Dwivedi, Y.K.; Raman, K.R. Smart cities: Advances in research—An information systems perspective. Int. J. Inf. Manag. 2019, 47, 88–100. [Google Scholar] [CrossRef]
  7. Statista. Available online: https://www.statista.com/statistics/617136/digital-population-worldwide/ (accessed on 6 June 2022).
  8. Zhou, L.; Chong, A.Y.; Ngai, E.W. Supply chain management in the era of the internet of things. Int. J. Prod. Econ. 2015, 159, 1–3. [Google Scholar] [CrossRef]
  9. Islam, N.; Want, R. Smartphones: Past, present, and future. IEEE Pervasive Comput. 2014, 13, 89–92. [Google Scholar] [CrossRef]
  10. Statista. Online Food Delivery Worldwide. 20 June 2020. Available online: https://www.statista.com/outlook/374/100/online-food-delivery/worldwide (accessed on 6 June 2022).
  11. Pressreader. Delivering the Market. Available online: https://www.pressreader.com/china/china-pictorial-english/20170808/282544428423387 (accessed on 7 June 2022).
  12. Moriarty, B. 5 Reasons Why Your Restaurant Needs An Online Ordering System. 2018. Available online: https://starmicronics.com/blog/5-reasons-why-your-restaurant-need-an-online-ordering-system/ (accessed on 7 June 2022).
  13. Sjahroeddin, F. The role of ES-Qual and food quality on customer satisfaction in online food delivery service. In Proceedings of the Prosiding Industrial Research Workshop and National Seminar, Bandung, Indonesia; 2018; pp. 551–558. [Google Scholar]
  14. Lu, Y.; Rastrick, K. Impacts of website design on the adoption intention of mobile commerce: Gender as a moderator. N. Z. J. Appl. Bus. Res. 2014, 12, 51–68. [Google Scholar]
  15. Marriott, H.R.; Williams, M.D.; Dwivedi, Y.K. What do we know about consumer m-shopping behaviour? Int. J. Retail Distrib. Manag. 2017, 45, 568–586. [Google Scholar] [CrossRef] [Green Version]
  16. Nilashi, M.; Ibrahim, O.; Mirabi, V.R.; Ebrahimi, L.; Zare, M. The role of Security, Design and Content factors on customer trust in mobile commerce. J. Retail. Consum. Serv. 2015, 26, 57–69. [Google Scholar] [CrossRef]
  17. Algharabat, R.; Alalwan, A.A.; Rana, N.P.; Dwivedi, Y.K. Three dimensional product presentation quality antecedents and their consequences for online retailers: The moderating role of virtual product experience. J. Retail. Consum. Serv. 2017, 36, 203–217. [Google Scholar] [CrossRef]
  18. Okumus, B.; Ali, F.; Bilgihan, A.; Ozturk, A.B. Psychological factors influencing customers’ acceptance of smartphone diet apps when ordering food at restaurants. Int. J. Hosp. Manag. 2018, 72, 67–77. [Google Scholar] [CrossRef]
  19. Wang, Y.-S.; Tseng, T.H.; Wang, W.-T.; Shih, Y.-W.; Chan, P.-Y. Developing and validating a mobile catering app success model. Int. J. Hosp. Manag. 2019, 77, 19–30. [Google Scholar] [CrossRef]
  20. Okumus, B.; Bilgihan, A. Proposing a model to test smartphone users’ intention to use smart applications when ordering food in restaurants. J. Hosp. Tour. Technol. 2014, 5, 31–49. [Google Scholar] [CrossRef]
  21. Cho, M.; Bonn, M.A.; Li, J.J. Differences in perceptions about food delivery apps between single-person and multi-person households. Int. J. Hosp. Manag. 2019, 77, 108–116. [Google Scholar] [CrossRef]
  22. Yeo, V.C.S.; Goh, S.-K.; Rezaei, S. Consumer experiences, attitude and behavioral intention toward online food delivery (OFD) services. J. Retail. Consum. Serv. 2017, 35, 150–162. [Google Scholar] [CrossRef]
  23. Lock, S. Year-over-year daily change in seated restaurant diners due to the coronavirus (COVID-19) pandemic worldwide from Fenruary 24 to October 12, 2020. Food Drink. Serv. 2020. [Google Scholar]
  24. Kapoor, A.P.; Vij, M. Technology at the dinner table: Ordering food online through mobile apps. J. Retail. Consum. Serv. 2018, 43, 342–351. [Google Scholar] [CrossRef]
  25. Dirsehan, T.; Cankat, E. Role of mobile food-ordering applications in developing restaurants’ brand satisfaction and loyalty in the pandemic period. J. Retail. Consum. Serv. 2021, 62, 102608. [Google Scholar] [CrossRef]
  26. Roh, M.; Park, K. Adoption of O2O food delivery services in South Korea: The moderating role of moral obligation in meal preparation. Int. J. Inf. Manag. 2019, 47, 262–273. [Google Scholar] [CrossRef]
  27. Al Amin, M.; Arefin, M.S.; Sultana, N.; Islam, M.R.; Jahan, I.; Akhtar, A. Evaluating the customers’ dining attitudes, e-satisfaction and continuance intention toward mobile food ordering apps (MFOAs): Evidence from Bangladesh. Eur. J. Manag. Bus. Econ. 2020, 30, 211–229. [Google Scholar] [CrossRef]
  28. Gunden, N.; Morosan, C.; Defranco, A. Consumers’ intentions to use online food delivery systems in the USA. Int. J. Contemp. Hosp. Manag. 2020, 32, 1325–1345. [Google Scholar] [CrossRef]
  29. Kumar, S.; Jain, A.; Hsieh, J.-K. Impact of apps aesthetics on revisit intentions of food delivery apps: The mediating role of pleasure and arousal. J. Retail. Consum. Serv. 2021, 63, 102686. [Google Scholar] [CrossRef]
  30. Shah, A.M.; Yan, X.; Shah, S.A.A.; Ali, M. Customers’ perceived value and dining choice through mobile apps in Indonesia. Asia Pac. J. Mark. Logist. 2020, 33, 1–28. [Google Scholar] [CrossRef]
  31. Kaur, P.; Talwar, S.; Islam, N.; Salo, J.; Dhir, A. The effect of the valence of forgiveness to service recovery strategies and service outcomes in food delivery apps. J. Bus. Res. 2022, 147, 142–157. [Google Scholar] [CrossRef]
  32. Lee, S.W.; Sung, H.J.; Jeon, H.M. Determinants of continuous intention on food delivery apps: Extending UTAUT2 with information quality. Sustainability 2019, 11, 3141. [Google Scholar] [CrossRef] [Green Version]
  33. Das, M.; Ramalingam, M. What drives product involvement and satisfaction with OFDs amid COVID-19? J. Retail. Consum. Serv. 2022, 68, 103063. [Google Scholar] [CrossRef]
  34. Zhao, Y.; Bacao, F. What factors determining customer continuingly using food delivery apps during 2019 novel coronavirus pandemic period? Int. J. Hosp. Manag. 2020, 91, 102683. [Google Scholar] [CrossRef]
  35. Konuk, F.A. The influence of perceived food quality, price fairness, perceived value and satisfaction on customers’ revisit and word-of-mouth intentions towards organic food restaurants. J. Retail. Consum. Serv. 2019, 50, 103–110. [Google Scholar] [CrossRef]
  36. Bhattacherjee, A. Understanding information systems continuance: An expectation-confirmation model. MIS Q. 2001, 25, 351–370. [Google Scholar] [CrossRef]
  37. Lee, Y.; Kwon, O. Intimacy, familiarity and continuance intention: An extended expectation–confirmation model in web-based services. Electron. Commer. Res. Appl. 2011, 10, 342–357. [Google Scholar] [CrossRef]
  38. Yuan, S.; Liu, Y.; Yao, R.; Liu, J. An investigation of users’ continuance intention towards mobile banking in China. Inf. Dev. 2016, 32, 20–34. [Google Scholar] [CrossRef]
  39. Alalwan, A.A. Mobile food ordering apps: An empirical study of the factors affecting customer e-satisfaction and continued intention to reuse. Int. J. Inf. Manag. 2020, 50, 28–44. [Google Scholar] [CrossRef]
  40. Rana, N.P.; Dwivedi, Y.K.; Williams, M.D.; Weerakkody, V. Adoption of online public grievance redressal system in India: Toward developing a unified view. Comput. Hum. Behav. 2016, 59, 265–282. [Google Scholar] [CrossRef]
  41. Shareef, M.A.; Baabdullah, A.; Dutta, S.; Kumar, V.; Dwivedi, Y.K. Consumer adoption of mobile banking services: An empirical examination of factors according to adoption stages. J. Retail. Consum. Serv. 2018, 43, 54–67. [Google Scholar] [CrossRef] [Green Version]
  42. Alalwan, A.A.; Dwivedi, Y.K.; Rana, N.P. Factors influencing adoption of mobile banking by Jordanian bank customers: Extending UTAUT2 with trust. Int. J. Inf. Manag. 2017, 37, 99–110. [Google Scholar] [CrossRef] [Green Version]
  43. Venkatesh, V.; Morris, M.G.; Davis, G.B.; Davis, F.D. User acceptance of information technology: Toward a unified view. MIS Q. 2003, 27, 425–478. [Google Scholar] [CrossRef] [Green Version]
  44. Bert, F.; Giacometti, M.; Gualano, M.R.; Siliquini, R. Smartphones and health promotion: A review of the evidence. J. Med. Syst. 2014, 38, 1–11. [Google Scholar] [CrossRef] [PubMed]
  45. Filieri, R. What makes online reviews helpful? A diagnosticity-adoption framework to explain informational and normative influences in e-WOM. J. Bus. Res. 2015, 68, 1261–1270. [Google Scholar] [CrossRef]
  46. Mudambi, S.M.; Schuff, D. Research note: What makes a helpful online review? A study of customer reviews on Amazon. com. MIS Q. 2010, 34, 185–200. [Google Scholar] [CrossRef] [Green Version]
  47. Wei, P.-S.; Lu, H.-P. An examination of the celebrity endorsements and online customer reviews influence female consumers’ shopping behavior. Comput. Hum. Behav. 2013, 29, 193–201. [Google Scholar] [CrossRef]
  48. Cheung, C.M.K.; Lee, M.K.O.; Rabjohn, N. The impact of electronic word-of-mouth. Internet Res. 2008, 18, 229–247. [Google Scholar] [CrossRef]
  49. Davis, F.D.; Bagozzi, R.P.; Warshaw, P.R. User acceptance of computer technology: A comparison of two theoretical models. Manag. Sci. 1989, 35, 982–1003. [Google Scholar] [CrossRef] [Green Version]
  50. Kang, J.-W.; Namkung, Y. The role of personalization on continuance intention in food service mobile apps. Int. J. Contemp. Hosp. Manag. 2019, 31, 734–752. [Google Scholar] [CrossRef]
  51. Nguyen, T.T.H.; Nguyen, N.; Nguyen, T.B.L.; Phan, T.T.H.; Bui, L.P.; Moon, H.C. Investigating consumer attitude and intention towards online food purchasing in an emerging economy: An extended tam approach. Foods 2019, 8, 576. [Google Scholar] [CrossRef] [PubMed] [Green Version]
  52. Alagoz, S.M.; Hekimoglu, H. A study on TAM: Analysis of customer attitudes in online food ordering system. Procedia-Soc. Behav. Sci. 2012, 62, 1138–1143. [Google Scholar] [CrossRef] [Green Version]
  53. Pinho, J.C.M.R.; Soares, A.M. Examining the technology acceptance model in the adoption of social networks. J. Res. Interact. Mark. 2011. [Google Scholar]
  54. Ramayah, T.; Ignatius, J. Impact of perceived usefulness, perceived ease of use and perceived enjoyment on intention to shop online. ICFAI J. Syst. Manag. (IJSM) 2005, 3, 36–51. [Google Scholar]
  55. Zhu, D.H.; Chang, Y.P. Investigating consumer attitude and intention toward free trials of technology-based services. Comput. Hum. Behav. 2014, 30, 328–334. [Google Scholar] [CrossRef]
  56. Ayeh, J.K. Travellers’ acceptance of consumer-generated media: An integrated model of technology acceptance and source credibility theories. Comput. Hum. Behav. 2015, 48, 173–180. [Google Scholar] [CrossRef]
  57. Lin, C.H.; Sher, P.J.; Shih, H.Y. Past progress and future directions in conceptualizing customer perceived value. Int. J. Serv. Ind. Manag. 2005, 16, 318–336. [Google Scholar] [CrossRef]
  58. Ravald, A.; Grönroos, C. The value concept and relationship marketing. Eur. J. Mark. 1996, 30, 19–30. [Google Scholar] [CrossRef]
  59. Shiu, E.; Walsh, G.; Hassan, L.M.; Parry, S. The direct and moderating influences of individual-level cultural values within web engagement: A multi-country analysis of a public information website. J. Bus. Res. 2015, 68, 534–541. [Google Scholar] [CrossRef]
  60. Chen, P.-T.; Hu, H.-H. The effect of relational benefits on perceived value in relation to customer loyalty: An empirical study in the Australian coffee outlets industry. Int. J. Hosp. Manag. 2010, 29, 405–412. [Google Scholar] [CrossRef]
  61. Fogg, B.J.; Tseng, H. The elements of computer credibility. In Proceedings of the SIGCHI conference on Human Factors in Computing Systems, New York, NY, USA, 15–20 May 1999; pp. 80–87. [Google Scholar]
  62. Kim, D.J.; Ferrin, D.L.; Rao, H.R. A trust-based consumer decision-making model in electronic commerce: The role of trust, perceived risk, and their antecedents. Decis. Support Syst. 2008, 44, 544–564. [Google Scholar] [CrossRef]
  63. Kim, M.-J.; Chung, N.; Lee, C.-K. The effect of perceived trust on electronic commerce: Shopping online for tourism products and services in South Korea. Tour. Manag. 2011, 32, 256–265. [Google Scholar] [CrossRef]
  64. Liu, S. The impact of forced use on customer adoption of self-service technologies. Comput. Hum. Behav. 2012, 28, 1194–1201. [Google Scholar] [CrossRef]
  65. Grabner-Kraeuter, S. The role of consumers’ trust in online-shopping. J. Bus. Ethics 2002, 39, 43–50. [Google Scholar] [CrossRef]
  66. Alsajjan, B.; Dennis, C. Internet banking acceptance model: Cross-market examination. J. Bus. Res. 2010, 63, 957–963. [Google Scholar] [CrossRef]
  67. Oliver, R.L. A cognitive model of the antecedents and consequences of satisfaction decisions. J. Mark. Res. 1980, 17, 460–469. [Google Scholar] [CrossRef]
  68. Namkung, Y.; Jang, S. Does Food Quality Really Matter in Restaurants? Its Impact On Customer Satisfaction and Behavioral Intentions. J. Hosp. Amp; Tour. Res. 2007, 31, 387–409. [Google Scholar] [CrossRef]
  69. Cronin Jr, J.J.; Taylor, S.A. Measuring service quality: A reexamination and extension. J. Mark. 1992, 56, 55–68. [Google Scholar] [CrossRef]
  70. Davis, F.D. Perceived usefulness, perceived ease of use, and user acceptance of information technology. MIS Q. 1989, 13, 319–340. [Google Scholar] [CrossRef] [Green Version]
  71. Ajzen, I.; Fishbein, M. Attitude-behavior relations: A theoretical analysis and review of empirical research. Psychol. Bull. 1977, 84, 888. [Google Scholar] [CrossRef]
  72. Kuo, Y.-F.; Yen, S.-N. Towards an understanding of the behavioral intention to use 3G mobile value-added services. Comput. Hum. Behav. 2009, 25, 103–110. [Google Scholar] [CrossRef]
  73. Rezaei, S.; Shahijan, M.K.; Amin, M.; Ismail, W.K.W. Determinants of app stores continuance behavior: A PLS path modelling approach. J. Internet Commer. 2016, 15, 408–440. [Google Scholar] [CrossRef]
  74. Dinev, T.; Hu, Q. The centrality of awareness in the formation of user behavioral intention toward protective information technologies. J. Assoc. Inf. Syst. 2007, 8, 23. [Google Scholar] [CrossRef]
  75. Lam, T.; Cho, V.; Qu, H. A study of hotel employee behavioral intentions towards adoption of information technology. Int. J. Hosp. Manag. 2007, 26, 49–65. [Google Scholar] [CrossRef]
  76. Limayem, M.; Khalifa, M.; Frini, A. What makes consumers buy from Internet? A longitudinal study of online shopping. IEEE Trans. Syst. Man Cybern.-Part A Syst. Hum. 2000, 30, 421–432. [Google Scholar] [CrossRef]
  77. Aarts, H.; Verplanken, B.; Van Knippenberg, A. Predicting behavior from actions in the past: Repeated decision making or a matter of habit? J. Appl. Soc. Psychol. 1998, 28, 1355–1374. [Google Scholar] [CrossRef]
  78. Verplanken, B. Beyond frequency: Habit as mental construct. Br. J. Soc. Psychol. 2006, 45, 639–656. [Google Scholar] [CrossRef] [PubMed]
  79. Wood, W.; Neal, D. A new look at habits and the interface between habits and goals. Psychol. Rev. 2007, 114, 843–863. [Google Scholar] [CrossRef] [PubMed]
  80. Wood, W.; Quinn, J.M.; Kashy, D.A. Habits in everyday life: Thought, emotion, and action. J. Personal. Soc. Psychol. 2002, 83, 1281. [Google Scholar] [CrossRef]
  81. Verplanken, B.; Aarts, H.; Van Knippenberg, A. Habit, information acquisition, and the process of making travel mode choices. Eur. J. Soc. Psychol. 1997, 27, 539–560. [Google Scholar] [CrossRef]
  82. Hsu, M.-H.; Chang, C.-M.; Chuang, L.-W. Understanding the determinants of online repeat purchase intention and moderating role of habit: The case of online group-buying in Taiwan. Int. J. Inf. Manag. 2015, 35, 45–56. [Google Scholar] [CrossRef]
  83. Chiu, C.-M.; Hsu, M.-H.; Lai, H.; Chang, C.-M. Re-examining the influence of trust on online repeat purchase intention: The moderating role of habit and its antecedents. Decis. Support Syst. 2012, 53, 835–845. [Google Scholar] [CrossRef]
  84. Khalifa, M.; Liu, V. Online consumer retention: Contingent effects of online shopping habit and online shopping experience. Eur. J. Inf. Syst. 2007, 16, 780–792. [Google Scholar] [CrossRef]
  85. Morrison, D.E.; Firmstone, J. The social function of trust and implications for e-commerce. Int. J. Advert. 2000, 19, 599–623. [Google Scholar] [CrossRef]
  86. Milliken, F.J. Three types of perceived uncertainty about the environment: State, effect, and response uncertainty. Acad. Manag. Rev. 1987, 12, 133–143. [Google Scholar] [CrossRef]
  87. Jarvenpaa, S.L.; Shaw, T.R.; Staples, D.S. Toward contextualized theories of trust: The role of trust in global virtual teams. Inf. Syst. Res. 2004, 15, 250–267. [Google Scholar] [CrossRef]
  88. Zhang, W.; Wang, Y.; Zhang, T. Can “live streaming” really drive visitors to the destination? From the aspect of “social presence”. Sage Open 2021, 11, 21582440211006691. [Google Scholar] [CrossRef]
  89. Fornell, C.; Larcker, D.F. Evaluating structural equation models with unobservable variables and measurement error. J. Mark. Res. 1981, 18, 39–50. [Google Scholar] [CrossRef]
  90. Hair, J.F. Multivariate Data Analysis; Prentice Hall: Upper Saddle River, NJ, USA, 2009. [Google Scholar]
  91. Chin, W.W.; Marcolin, B.L.; Newsted, P.R. A partial least squares latent variable modeling approach for measuring interaction effects: Results from a Monte Carlo simulation study and an electronic-mail emotion/adoption study. Inf. Syst. Res. 2003, 14, 189–217. [Google Scholar] [CrossRef] [Green Version]
  92. Leguina, A. A primer on partial least squares structural equation modeling (PLS-SEM). Int. J.Res. method Educ. 2015, 38, 220–221. [Google Scholar] [CrossRef]
  93. Werts, C.E.; Linn, R.L.; Jöreskog, K.G. Intraclass reliability estimates: Testing structural assumptions. Educ. Psychol. Meas. 1974, 34, 25–33. [Google Scholar] [CrossRef]
  94. Dijkstra, T.K.; Henseler, J. Consistent and asymptotically normal PLS estimators for linear structural equations. Comput. Stat. Data Anal. 2015, 81, 10–23. [Google Scholar] [CrossRef] [Green Version]
  95. Campbell, D.T.; Fiske, D.W. Convergent and discriminant validation by the multitrait-multimethod matrix. Psychol. Bull. 1959, 56, 81. [Google Scholar] [CrossRef] [Green Version]
  96. Chin, W.W. The partial least squares approach to structural equation modeling. Mod. Methods Bus. Res. 1998, 295, 295–336. [Google Scholar]
  97. Henseler, J.; Ringle, C.M.; Sinkovics, R.R. The use of partial least squares path modeling in international marketing. In New Challenges to International Marketing; Emerald Group Publishing Limited: Bradford, UK, 2009. [Google Scholar]
  98. Fassott, G.; Henseler, J.; Coelho, P.S. Testing moderating effects in PLS path models with composite variables. Ind. Manag. Data Syst. 2016. [Google Scholar] [CrossRef] [Green Version]
  99. Shareef, M.A.; Dwivedi, Y.K.; Stamati, T.; Williams, M.D. SQ mGov: A Comprehensive Service-Quality Paradigm for Mobile Government. Inf. Syst. Manag. 2014, 31, 126–142. [Google Scholar] [CrossRef] [Green Version]
  100. Hung, M.-C.; Yang, S.-T.; Hsieh, T.-C. An examination of the determinants of mobile shopping continuance. Int. J. Electron. Bus. Manag. 2012, 10, 29. [Google Scholar]
  101. Hu, P.J.; Chau, P.Y.; Sheng, O.R.L.; Tam, K.Y. Examining the technology acceptance model using physician acceptance of telemedicine technology. J. Manag. Inf. Syst. 1999, 16, 91–112. [Google Scholar] [CrossRef]
  102. Venkatesh, V.; Thong, J.Y.; Xu, X. Consumer acceptance and use of information technology: Extending the unified theory of acceptance and use of technology. MIS Q. 2012, 36, 157–178. [Google Scholar] [CrossRef] [Green Version]
  103. Childers, T.L.; Carr, C.L.; Peck, J.; Carson, S. Hedonic and utilitarian motivations for online retail shopping behavior. J. Retail. 2001, 77, 511–535. [Google Scholar] [CrossRef]
Figure 1. Research Model.
Sustainability 14 12589 g001
Figure 2. The result of SmartPLS–Algorithm.
Sustainability 14 12589 g002
Table 1. Detail of sample demographic.
ItemCategoryFrequencyPercent
Genderfemale9042.5
male12257.5
Total212100.0
Age<206731.6
20–2912659.4
30–39125.7
>4073.3
Total 212100.0
Occupationcompany employee83.8
civil servant136.1
Free-career10.5
student18687.7
other41.9
Total 212100.0
Educational statusHigh school52.4
Diploma20.9
Bachelor17180.7
Postgraduate3416.0
Total 212100.0
Income(Yuan)<400018084.9
4000–7999115.2
>8000219.9
Total 212100.0
MFOA usage frequencyUse 1–2 times a week15673.6
Use 3–5 times a week3918.4
Use 6–9 times a week136.1
Use more than 10 times a week41.9
Total212100.0
Table 2. Construct validity.
Construct ValidityItemItem LoadingAVEComposite ReliabilityCronbach’s Alpha
ConfirmationCON10.9000.8510.9450.912
CON20.934
CON30.932
Performance expectancyPE10.9020.8110.9450.922
PE20.871
PE30.921
PE40.908
Online ReviewOR10.8540.7390.9520.941
OR20.867
OR30.870
OR40.886
OR50.851
OR60.842
OR70.847
PerceivedUsefulnessUSF10.8930.8260.9500.93
USF20.929
USF30.902
USF40.913
Perceived Ease of UseEOU10.9360.8640.9500.922
EOU20.923
EOU30.930
perceivedValuePV10.8950.8270.9350.895
PV20.921
PV30.911
TrustTR10.9170.8280.9510.931
TR20.886
TR30.923
TR40.914
SatisfactionSAT10.8990.8040.9540.939
SAT20.883
SAT30.901
SAT40.877
SAT50.922
AttitudeATT10.9110.8460.9570.939
ATT20.931
ATT30.926
ATT40.912
Table 3. Correlation matrix and square roots of the AVE.
ItemAVEATTCICONEOUORPEPVSATTRUSF
ATT0.8460.920
CI0.8430.7230.918
CON0.8510.4660.4670.922
EOU0.8640.5690.5240.4730.930
OR0.7390.6320.5970.4260.5330.860
PE0.8110.5790.5600.6440.6300.5420.900
PV0.8270.7330.6390.3750.4480.5400.4800.909
SAT0.8040.8450.7940.5080.5800.7060.6200.7480.897
TR0.8280.8200.7080.3960.4800.6270.5010.7540.8580.910
USF0.8260.6350.6800.5610.7340.6750.7250.6010.7360.6580.909
Note: Diagonal values (in bold) are squared roots of AVE; off-diagonal values are the estimates of inter-correlation between the latent constructs.
Table 4. Item loadings and cross loadings.
ItemATTCICONEOUORPEPVSATTRUSF
ATT10.9110.6360.4080.5060.5720.5280.6280.7430.7090.540
ATT20.9310.6850.4500.5980.5870.5380.6770.7970.7770.629
ATT30.9260.6520.3930.4840.5360.4850.6630.7620.7370.544
ATT40.9120.6820.4610.5040.6270.5760.7270.8030.7890.620
CI10.6670.9120.5040.5590.5660.5740.6030.7520.6390.679
CI20.6870.9370.4320.5010.5550.5520.5980.7540.6650.639
CI30.6350.9040.3430.3760.5220.4090.5560.6770.6460.550
CON10.3870.4020.9000.4410.3230.6200.3110.4450.3310.508
CON20.4560.4470.9340.4540.4450.6120.3700.4830.3860.545
CON30.4450.4350.9320.4150.4050.5540.3530.4770.3780.499
EOU10.5110.4960.4320.9360.5180.5560.4040.5270.4530.668
EOU20.5250.4480.3990.9230.4310.5660.4040.5340.4400.658
EOU30.5510.5090.4850.9300.5370.6310.4390.5550.4460.720
OR10.5320.5020.4020.4160.8540.4440.4780.5800.5230.524
OR20.5650.5690.4130.5350.8670.4950.4920.6220.5330.646
OR30.5630.5260.4120.4630.8700.4580.4070.6010.5140.563
OR40.5200.4850.4050.4400.8860.4310.4730.6110.5200.562
OR50.4880.4620.2850.3950.8510.4660.4600.5960.5350.544
OR60.5710.4960.3210.4590.8420.4680.4520.5810.5580.539
OR70.5630.5450.3230.4920.8470.4970.4820.6510.5900.673
PE10.5330.5510.6100.5530.4680.9020.4400.6120.4930.661
PE20.5140.4530.5200.5700.4470.8710.4050.5060.3970.646
PE30.5300.5170.6160.5820.5460.9210.4510.5760.4800.666
PE40.5060.4780.5650.5650.4890.9080.4300.5300.4260.640
PV10.6690.5770.3700.4500.4840.4570.8950.6910.6510.530
PV20.6850.5720.2890.3870.4820.3760.9210.6630.7170.541
PV30.6460.5930.3650.3830.5060.4800.9110.6880.6890.570
SAT10.7980.6940.4260.5200.6020.5100.7060.8990.7980.636
SAT20.7430.7180.4800.5280.6620.6040.6360.8830.7630.681
SAT30.7170.6910.3770.4380.5960.4710.6650.9010.7800.632
SAT40.7280.7060.5050.5480.6330.6280.6390.8770.7290.671
SAT50.8000.7430.4820.5580.6660.5580.7110.9220.7780.676
TR10.7790.7010.4240.5040.6550.5230.7020.8400.9170.630
TR20.6680.5590.2880.3420.4840.3610.6870.6940.8860.501
TR30.7590.6560.3380.4090.5430.4540.6910.7770.9230.629
TR40.7690.6510.3810.4790.5890.4730.6670.8010.9140.624
USF10.5570.6040.5470.6220.6070.6680.5010.6490.5690.893
USF20.5810.6510.4980.7080.6040.6470.5560.6700.6020.926
USF30.5870.6050.4670.6050.6030.6380.5810.6720.6090.902
USF40.5840.6060.5290.7340.6400.6850.5460.6850.6090.913
Note: Bold values are loadings for each item, which are above the recommended value of 0.5; and an item’s loadings on its own variable are higher than all of its cross loadings with other variables.
Table 5. Coefficient of determination (R2) evaluation result.
Endogenous Latent ConstructR2Adjusted R2
ATT0.7350.729
CI0.6410.635
SAT0.5870.581
Table 6. The results of predictive relevance (Q2).
ItemSSOSSEQ2 (=1−SSE/SSO)
ATT848.000332.5380.608
CI636.000298.6860.530
CON636.000636.000
EOU636.000636.000
OR1484.0001484.000
PE848.000848.000
PV636.000636.000
SAT1060.000573.6000.459
TR848.000848.000
USF848.000848.000
Table 7. Structural relationships and hypotheses testing.
HypothesisPathCoeffT-Valuep-ValuesConfidence Interval (95%)Accept/
Reject
H1CON → SAT0.1191.6840.092−0.0110.262Reject
H2PE → SAT0.2673.7800.0000.1260.406Accept
H3OR → SAT0.5118.1500.0000.3890.626Accept
H4USF → ATT−0.0390.3470.7290.2680.176Reject
H5EOU → ATT0.2242.2670.0230.0380.425Accept
H6PV → ATT0.2323.2020.0010.0770.379Accept
H7TR → ATT0.5636.2030.0000.3780.747Accept
H8TR → CI0.0400.3780.7050.1590.248Reject
H9SAT → CI0.6185.2670.0000.2900.750Accept
H10ATT → CI0.1681.4630.144−0.0150.354Reject
Table 8. Moderation result.
HypothesisDVModIVCoeffT-Valuep-ValuesConfidence Interval (95%)Accept/
Reject
H11-1CIHABSAT−0.0780.5540.5800.038−0.213Reject
H11-2ATT0.0340.3070.759−0.024−0.277Reject
H11-3TR−0.0510.4660.641−0.006−0.270Reject
Publisher’s Note: MDPI stays neutral with regard to jurisdictional claims in published maps and institutional affiliations.

