Article

Assessing the Private Sector’s Efforts in Improving the Supply Chain of Hermetic Bags in East Africa

by
Oluwatoba J. Omotilewa
1 and
Dieudonne Baributsa
2,*
1
Macroeconomics Policy, Forecasting & Research Department, African Development Bank, Abidjan 01 BP 1387, Côte d’Ivoire
2
Department of Entomology, Purdue University, West Lafayette, IN 47907, USA
*
Author to whom correspondence should be addressed.
Sustainability 2022, 14(19), 12579; https://doi.org/10.3390/su141912579
Submission received: 12 August 2022 / Revised: 20 September 2022 / Accepted: 29 September 2022 / Published: 3 October 2022

Abstract

:
Hermetic bags are effective at curbing grain losses due to insect pests, but their use remains low due to unavailability among smallholder farmers. This study used primary data from actors within the Purdue Improved Crop Storage (PICS) supply chain network, mostly the private sector, in Ethiopia, Tanzania, and Uganda, to understand the challenges and opportunities in improving the availability of hermetic bags in rural areas. It finds that supply-side distribution approaches played a critical role in improving PICS bag availability. Some of the supply-side constraints included poor inventory management, pricing, and limited access to capital. Inventory management can be improved through better forecasting using sales records and prediction of farmers’ harvests. Improved access to credit during peak season can improve the timely supply and reduce stockouts. Marketing inefficiency appears to be fueled by a high-profit margin at the distributor level. Using all available distribution channels in addition to ag-input dealers will enhance the availability of the bags in rural communities.

1. Introduction

Cereals, particularly maize, are highly important staple foods in East and Southern Africa, while legume crops, such as common beans, cowpea, and soya beans, constitute the major source of protein for most consumers in sub-Saharan Africa (SSA) [1,2,3]. Although the production of these food crops is often seasonal, their consumption is typically year-round, requiring a form of endowment transfer from one harvest to the next to smoothen consumption [4,5]. Often, this transfer requires proper postharvest handling (shelling or threshing and drying) and storage. However, the use of conventional grain storage technologies often leads to quantitative and qualitative losses from insect pest attacks resulting in economic and nutritional losses [6,7,8,9]. In sub-Saharan Africa, loss of grains during storage is estimated at up to 20% but can reach up to 100% loss if no measures are taken [10,11]. Grain postharvest losses in East and Southern Africa have been estimated to be worth about USD 1.6 billion annually, and the bulk of these losses occur during postharvest storage [8].
Typically, farmers attempt to reduce storage losses using synthetic chemicals (e.g., insecticides), which may be harmful to the health due to misuse or overuse, or traditional methods that may not be as effective or scalable. The use of hermetic containers (e.g., silos, bags, drums, jars, etc.), without the application of insecticides, has proven effective in preserving stored grains from pest attacks and aflatoxin development [12,13,14,15]. Hermetic storage containers work by preventing air exchange between the ambient environment and their interior, thereby depriving insect pests of the oxygen needed for metabolic activities [16]. When insects can no longer breathe, they become inactive, desiccate, and eventually die. Hence, hermetic bags function in a dual role: (i) as storage containers and (ii) as pest control methods.
Hermetic storage methods disseminated among smallholder farmers in SSA include hermetic bags, metal and plastic silos, and metal drums [12,17]. Hermetic bags (e.g., Purdue Improved Crop Storage- PICS, SuperGrain, and AgroZ bags) have garnered the most support from donors and governments for large-scale dissemination [18,19]. PICS were the first hermetic bags commercially available in SSA, starting in West and Central Africa and later expanding to East Africa [20]. By mid-2019, more than seven million farmers were trained (mostly in SSA) through 67,000 demonstrations [20]. In addition to training farmers, efforts have been made to build a supply chain by working with the private sector to improve the availability of PICS bags in rural areas [17]. Furthermore, there were about 23 licensed manufacturers and distributors who produced and sold 20 million PICS bags to smallholder farmers and other buyers [20].
Despite the efforts to commercialize the PICS and other hermetic bags in SSA, unavailability in rural areas remains one of the major challenges to adoption among smallholder farmers [9,21,22,23,24,25]. Unavailability of PICS bags may mean a physical absence of the product in the marketplace or the product being available late after farmers have already used/purchased other storage technologies [20]. Further, farmers often complain about lacking information on where to purchase hermetic bags in rural areas [24,26]. Therefore, there is a need to examine and understand the challenges and opportunities along the supply chain (manufacturers, distributors, vendors, retailers, and end-users) to help improve availability. This is not only critical to the adoption of the bags but may also be useful in the distribution of other agricultural technologies in existing and new markets in East Africa and other countries in SSA.
Hence, this study aimed to (i) identify key supply-side constraints; (ii) examine which distribution channels are most effective in making the bags available to farmers in rural areas; and (iii) assess ways of improving the availability of the PICS bags in rural areas.
The contributions of this study are twofold: first, we investigated existing supply chain approaches employed to market a relatively new agricultural input product in nascent markets. Second, our geographic scope (Ethiopia, Tanzania, and Uganda) is wider, giving room to learn more generic information in the East Africa region. This is one of the limited studies that have examined the distribution of hermetic bags from a supply chain perspective in the East Africa region. Prior studies alluded to many barriers to the uptake of hermetic bags despite their proven efficacy in preserving stored grains. Barriers to the adoption of hermetic bags include (i) limited availability near farmers; (ii) insufficiently dense distribution networks; (iii) low awareness [9,22,23,25]; (iv) initial cost of the technology compared to other storage methods (e.g., polypropylene woven bags) [26]; and (v) skepticism on the effectiveness of the technology in the absence of synthetic storage chemicals [24].

2. Materials and Methods

2.1. Study Area, Sampling, and Data

The study used primary data from actors within the PICS supply chain network in Tanzania, Uganda, and Ethiopia. The interviews were conducted between November 2017 and April 2018. Across the three countries, two regions (high-performing and low-performing) were purposely selected to have a balanced understanding of and cross-country perspective on the distribution channels (Table 1). Performances of the different regions were determined based on sales data obtained from the manufacturer or distributor in each country. Because the sample size of the main supply chain actors was limited, we sampled all manufacturers, distributors, and vendors available in the regions of study (Table 2). Sales data were obtained throughout the supply chain, starting from the main distributor or supplier of the PICS bags in each country down to the vendors/retailers at the village level. Separate and tailored questionnaires were administered for each group of manufacturers, distributors, vendors or retailers, farmers, and development partners/Non-Governmental Organizations (NGOs). To obtain farmers’ perspectives, interviews through farmer focus groups (FFG) were organized. The data analyzed and reported subsequently are the response of an average farmer from within the focus groups in each country.

2.2. Marketing Efficiency and Profit Margins

Following previous studies on input marketing efficiency [21,27], we estimated the marketing efficiency for PICS bags in both high- and low-performing regions across the three countries as follows:
M E = 1 P F / P M
where ME is the efficiency of the input marketing channel, PF is the price paid by farmers or end-users, and PM is the price at the factory (manufacturer’s price) for the technology. Overall, marketing efficiency ranges 0 < ME ≤ 1, where the unity index is the most efficient, indicating that farmer price and manufacturer price are the same. The lower the index (closer to zero), the more inefficient the distribution system is. The factors influencing marketing efficiency include, but are not limited to, the location of manufacturer or distance to PICS vendors, transportation costs (which is a function of distance traveled as well as the quality of road infrastructure), length of distribution channel (number of intermediaries from manufacturer to the end-users) and density (number of outlets selling), margins at each level of the supply chain, and capacity/scale of the manufacturer.
Overall marketing efficiency was computed at the country level as well as within countries for high and low-performing regions, using the average price at the factory and that paid by farmers. In addition, the profit margins based on cost and sales prices for each actor along the supply chain were computed. For distributors, the computed profit margins were compared to reported margins obtained during their interviews because distributors play a bigger role in price setting and can influence profit margins downstream, given farmers’ willingness to pay may have an upper limit.
In addition to estimating marketing efficiency by country, we further analyzed the gross profit margins at each stage along the value chain. The gross profit margin was simply the margin between the cost (procurement) price and the selling price. This enabled us to examine the relationship between the profit margins and the overall sales volume of hermetic bags. Prior literature suggests that a lengthy distribution channel will have the highest cost and will likely be more inefficient [21].

2.3. Analysis of Distribution Channels within the Supply Chain

In addition to examining marketing efficiency and profit margins within the supply chain, we documented and further analyzed the characteristics of each actor and interaction within the rest of the supply chain. This analysis provided a comprehensive description of the current PICS bags supply chain in the study area, including mapping the distribution of bags from manufacturers to farmers and costing (price, taxes, etc.) from manufacturers to retailers.

3. Results

3.1. Existing Distribution Channels and Relationships between Supply Chain Actors

The relationship between the PICS supply chain actors is presented in Figure 1. This relationship is convoluted. At the center of the chain is the manufacturer, who directly feeds the distributors, vendors, and retailers, as well as development partners (NGOs, government and donor agencies, projects, etc.) engaged in postharvest loss reduction activities. The relationship between other actors along the supply chain depends on the purchase size and goals of each actor.

3.2. Characteristics of Supply Chain Actors

3.2.1. Manufacturers

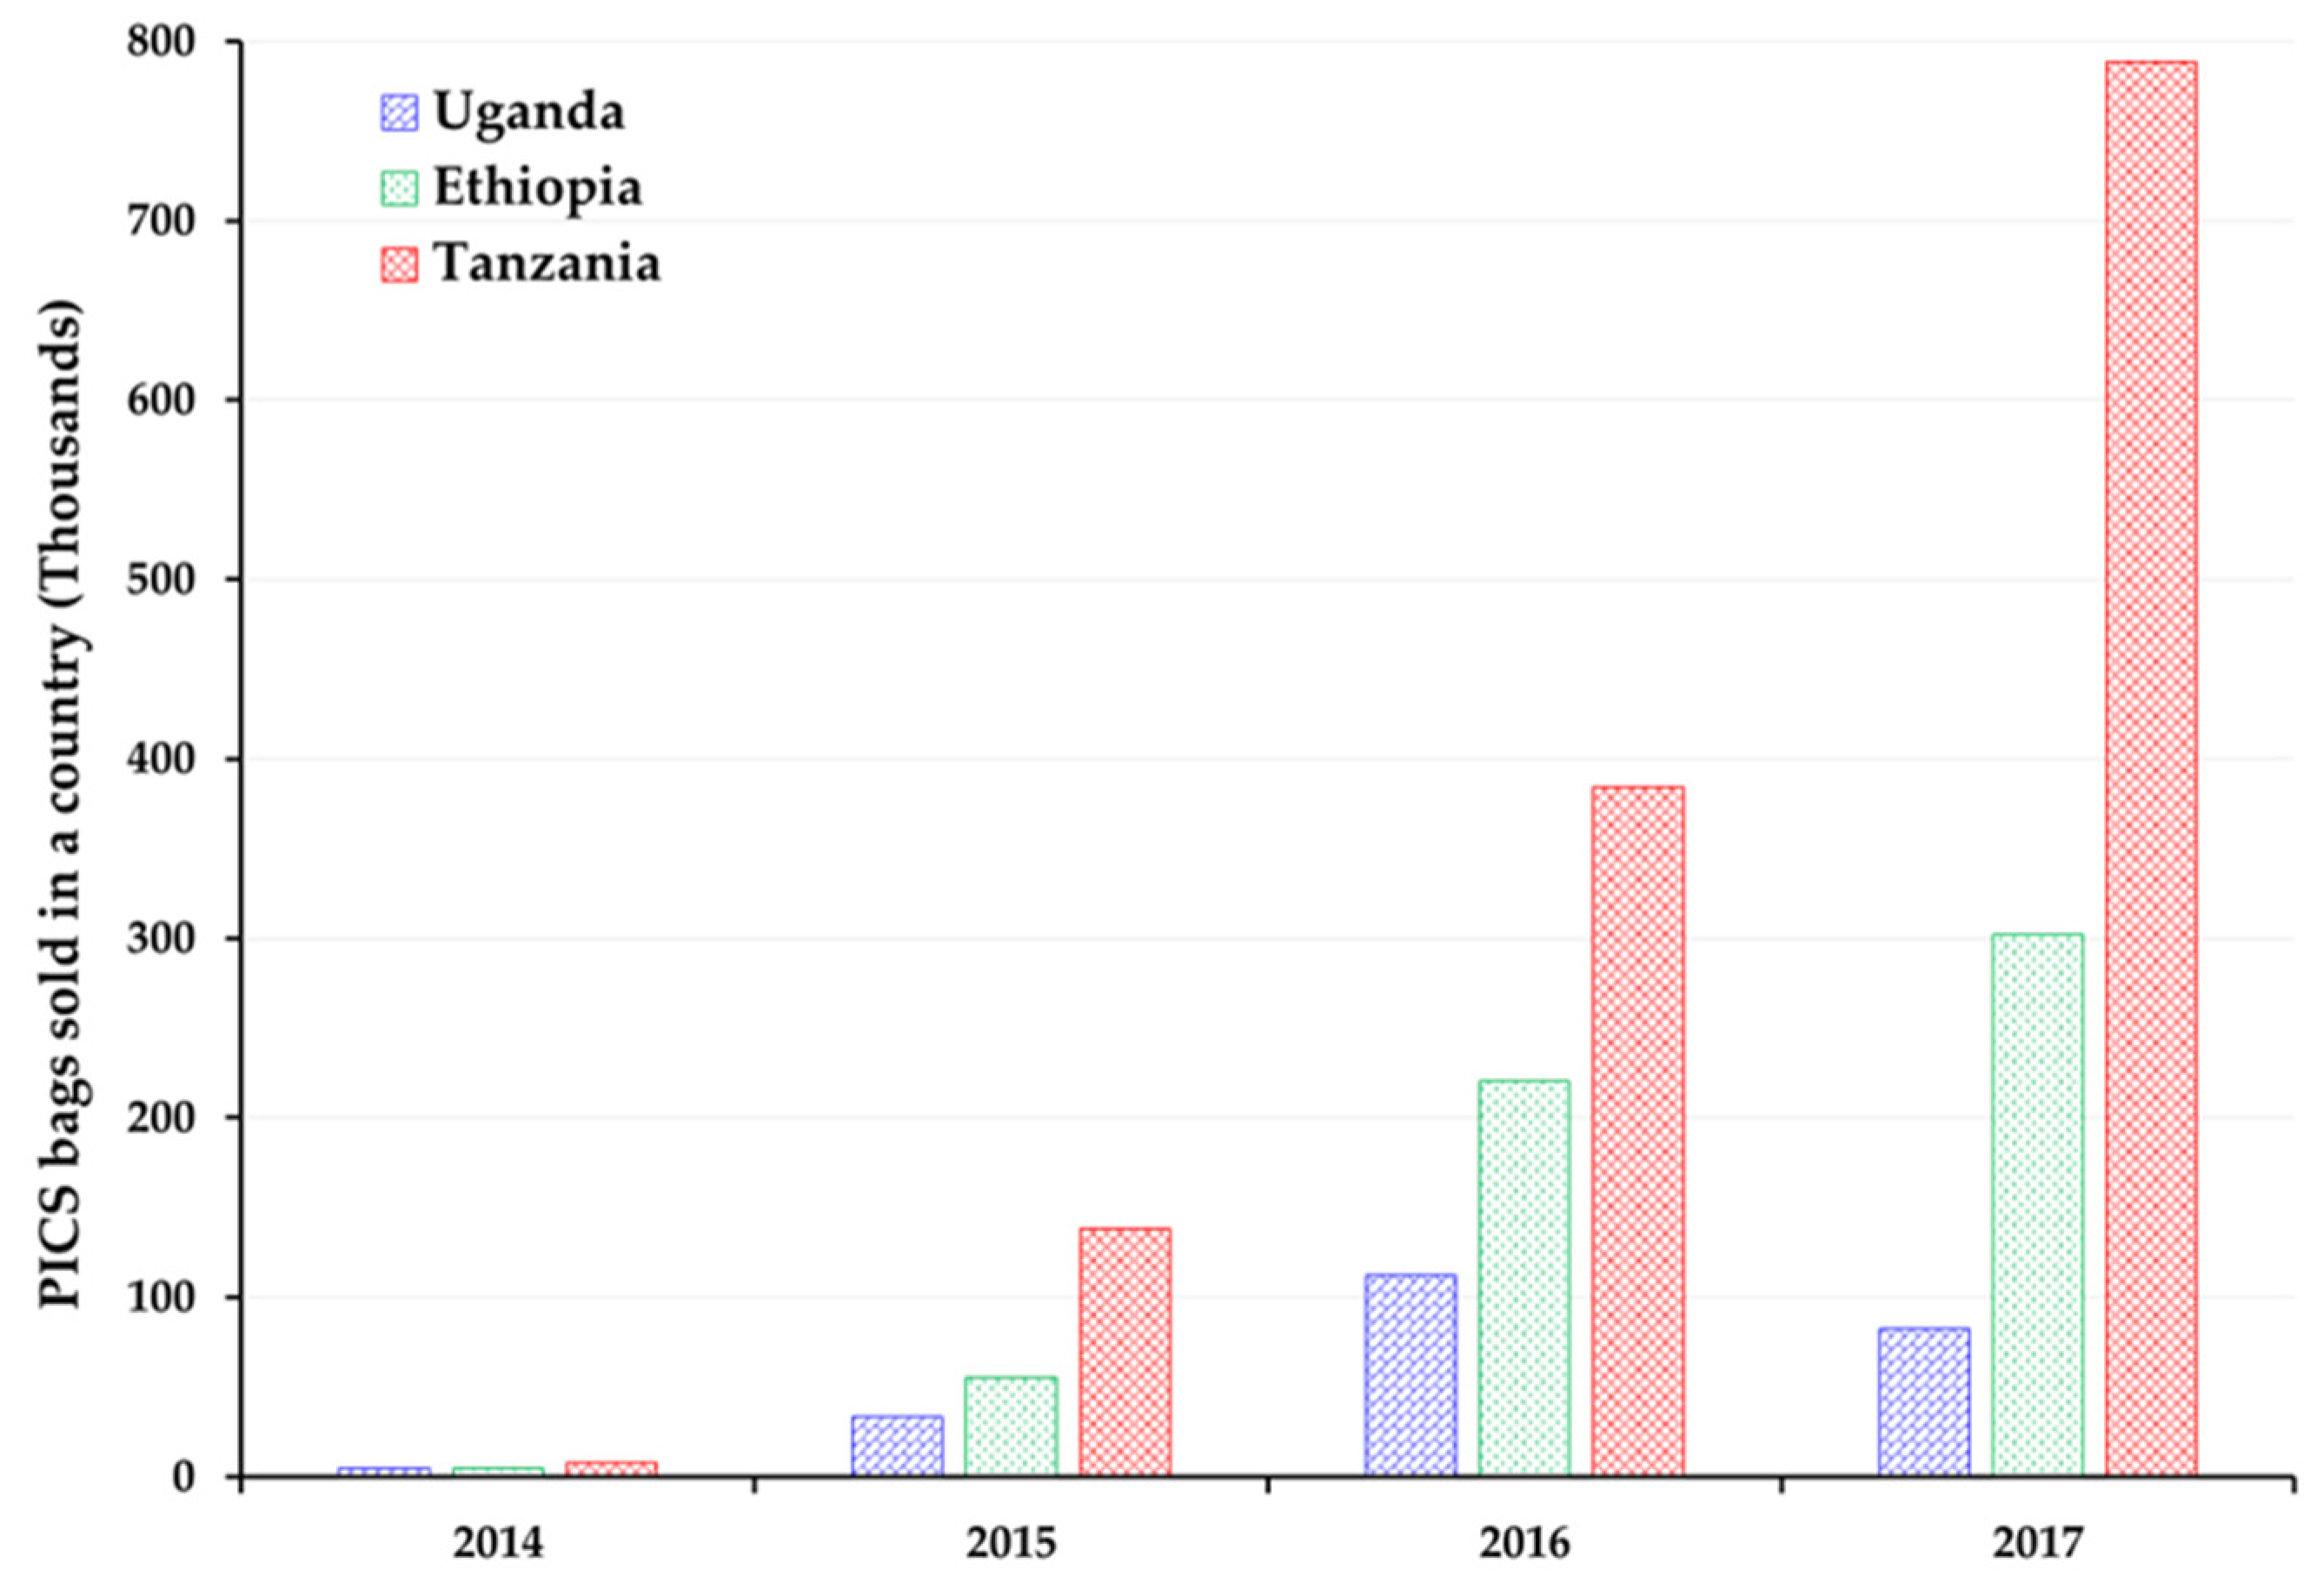
Manufacturing of PICS bags in Tanzania and Ethiopia started in 2014 and 2016, respectively. PICS constituted less than 20% of the manufacturer’s total portfolio in Tanzania and Ethiopia. The manufacturer in Tanzania produced both liners and polypropylene (PP) woven bags, while the manufacturer in Ethiopia produced only PP bags. The manufacturing capacity varied by country—for instance, to produce 10,000 PP bags it required a two-week lead time and seven days in Ethiopia, whereas it took as little as a day with a lead time of a week in Tanzania. In addition, the cost of manufacturing and pricing was affected by taxes. Taxes varied by county and were 41% in Tanzania and 31% in Ethiopia. They included import duty, VAT, government levy and clearing fees, corporate business tax, and withholding charge on raw materials. Sales of PICS bags varied by country and significantly grew from 2014 to 2017, particularly in Ethiopia and Tanzania (Figure 2). The total quantity sold in each country during the four years was 232,944 bags in Uganda, 581,960 bags in Ethiopia, and 1,318,334 bags in Tanzania. Sales grew exponentially in Tanzania while they lagged in Uganda.

3.2.2. Distributors

We considered distributors as those who buy the bags from the manufacturers and sell them to vendors and retailers in bulk. On average, distributors in Ethiopia, Tanzania, and Uganda were selling PICS bags to a total of approximately 165, 65, and 112 vendors and retailers, respectively. The main source of capital for distributors was their own money. This is 100% true for distributors in Ethiopia and Uganda. However, in Tanzania, none of the distributors used their own money. One used capital sourced from a bank loan, while the other used supplier’s (manufacturer’s) credit. We also found that, except for Tanzania, distributors in other countries had received some form of funding support from external sources to facilitate the acquisition/purchase or promotion of PICS bags.

3.2.3. Vendors and Retailers

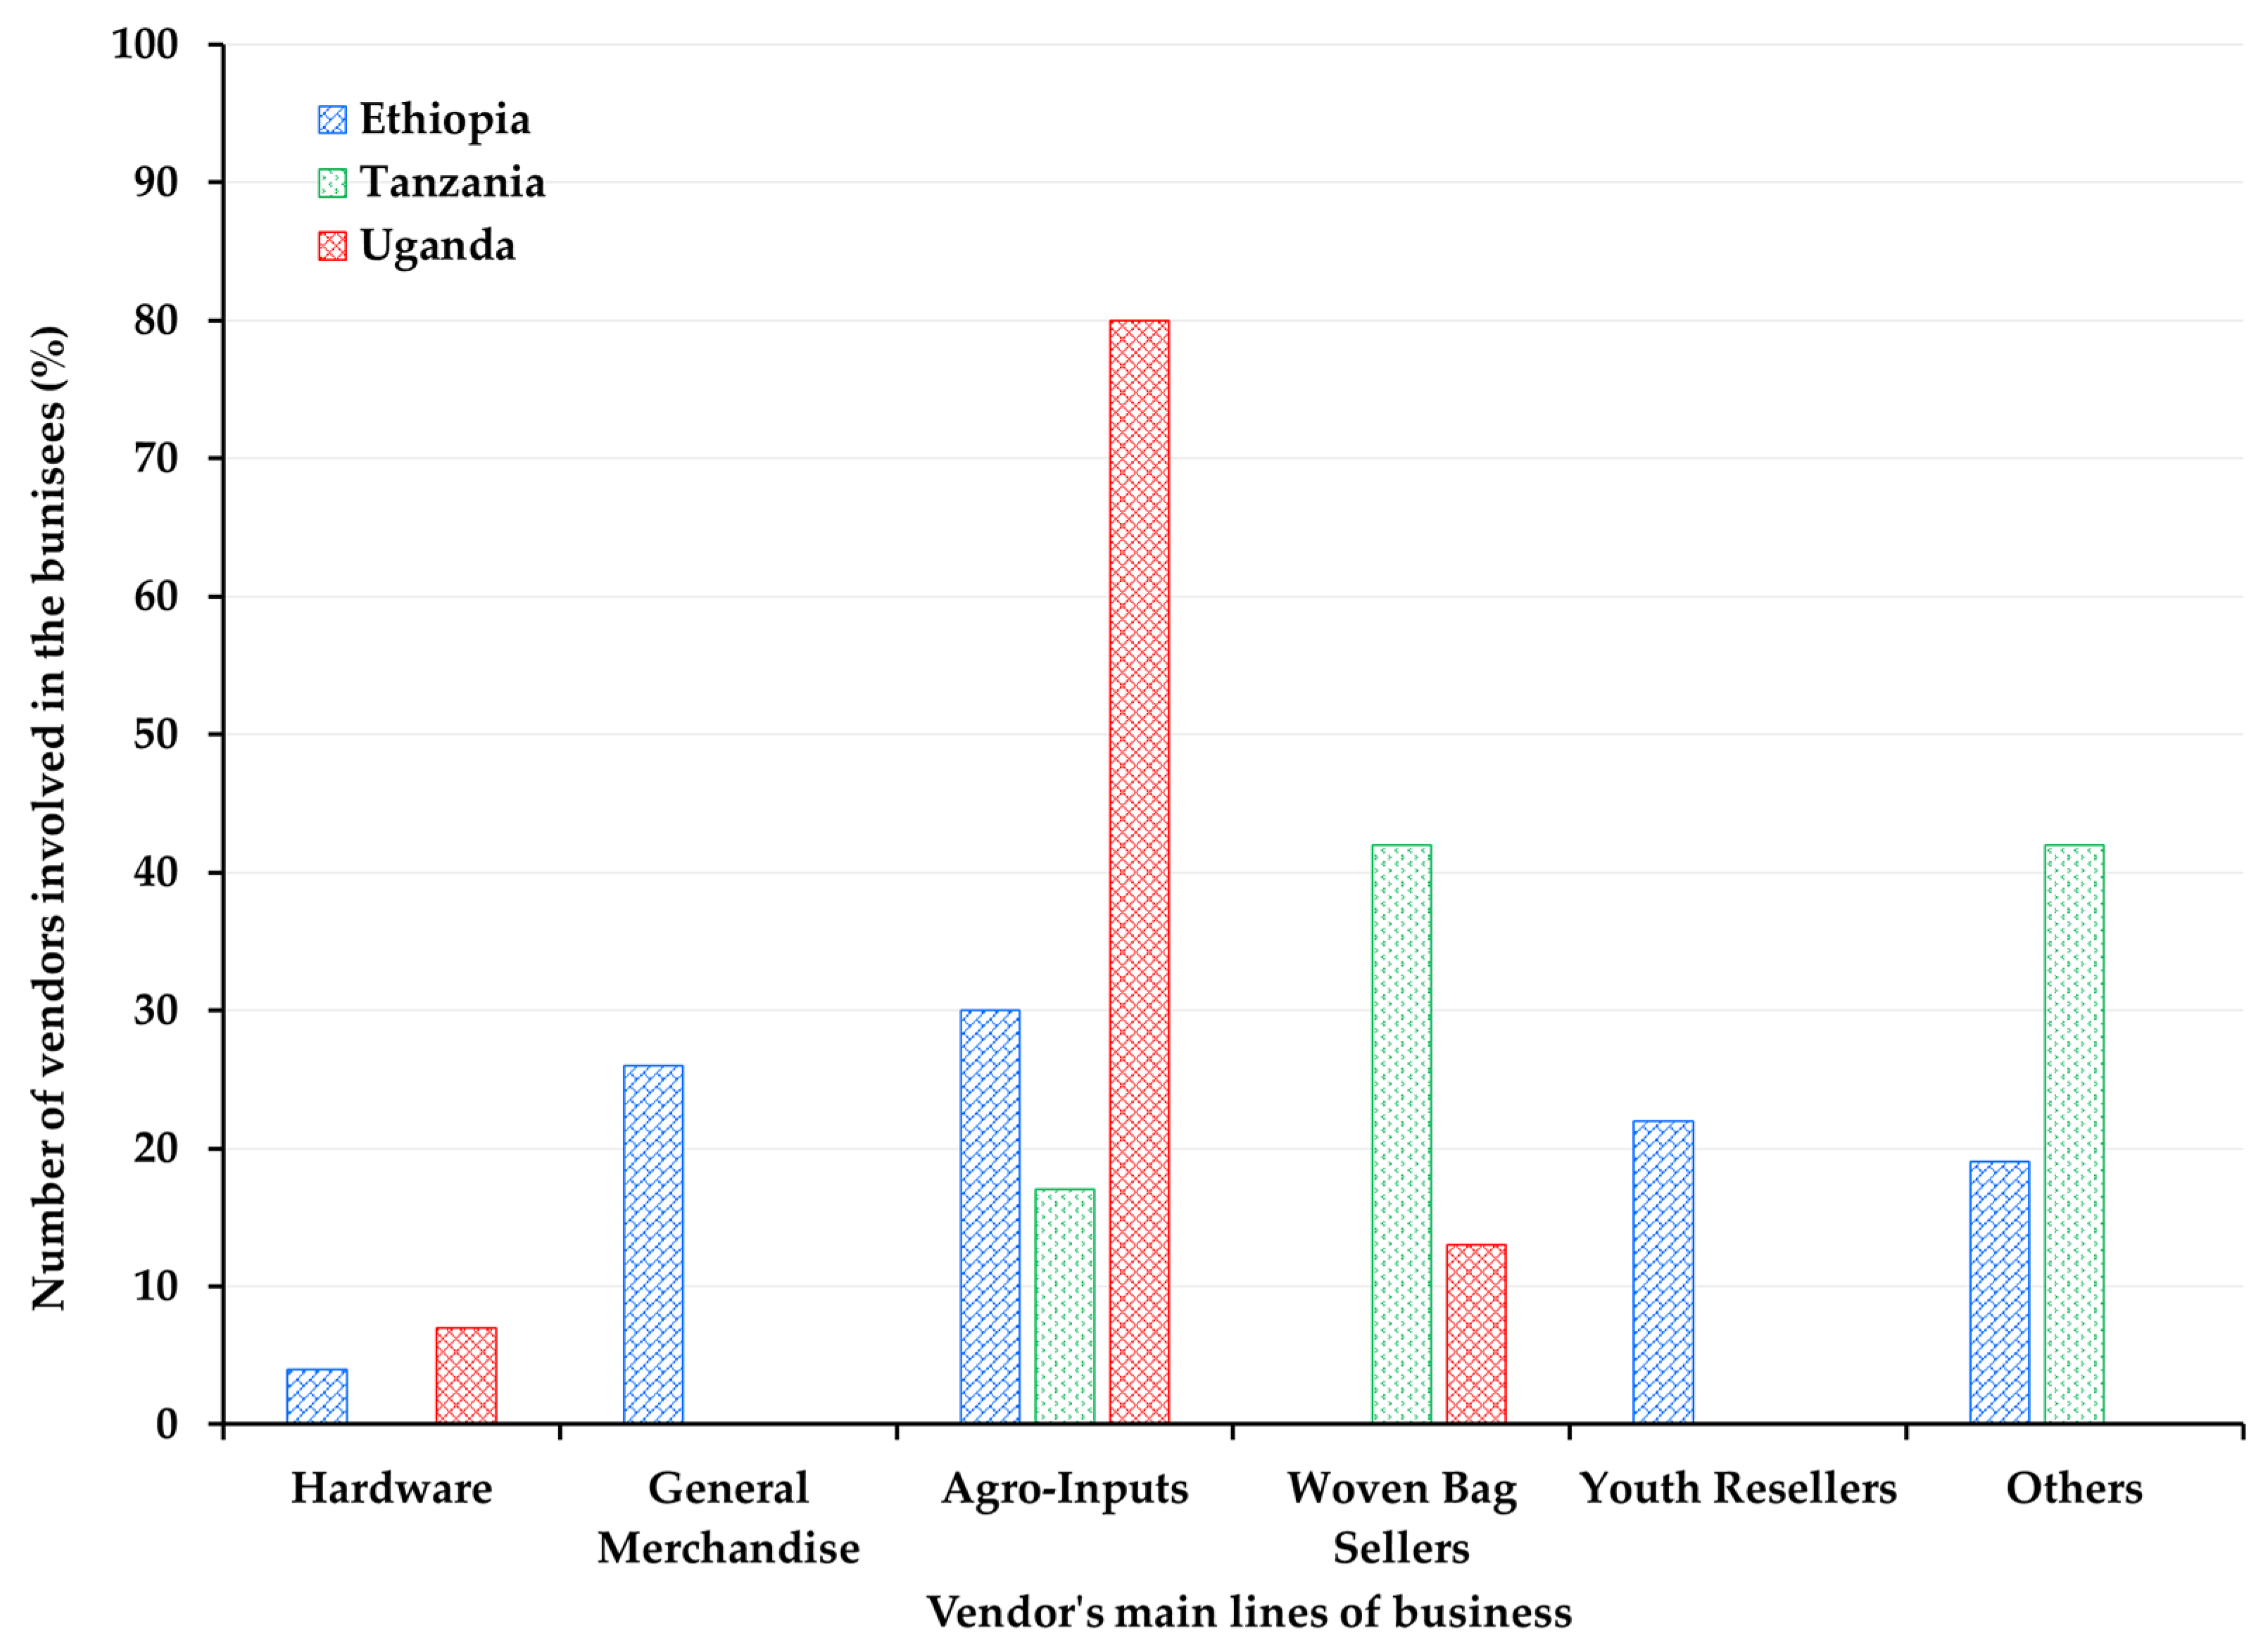
Vendors and retailers are used interchangeably because of the large similarities between them. The main difference is in the volume of bags sold, but this is country or region specific, considering a retailer in one region could be a vendor in another. In many instances, a single vendor (at the town or district level) may supply many retailers (often at the village level). Vendors and retailers were predominantly male in Ethiopia and Tanzania, with 85% and 92% of the sample, respectively. In Uganda, however, more females (53%) were retailing the bags. These vendors operated diverse businesses (Figure 3). In Ethiopia, more than half of the vendors were into general merchandise (e.g., household items) and agricultural inputs (e.g., seed, fertilizers, etc.). In Tanzania, about three-fifths of vendors were selling agricultural inputs and PP woven bags. The other vendors in Tanzania sold tarpaulin, packaging bags and related accessories, and foodstuff. There was a small number of extension officers who sold PICS bags in Tanzania. For Uganda, nearly all vendors (80%) were ag-input dealers.
A deeper assessment of the main products sold by these vendors indicated a significant variation across the three countries. In Ethiopia, among vendors: 37% mainly retailed PICS bags, 26% sold seeds and/or agrochemicals such as pesticides and fertilizers, and 37% mainly retailed water filters and household consumable goods in lock-up shops. By contrast, in Tanzania, only 17% of vendors reported PICS bags as their main product; 42% reported woven bags; 17% sold agrochemicals, fertilizer, and pesticides; while the remaining sold mainly household consumables such as maize, wine, and vanilla. In Uganda, the main products sold are agrochemicals (47% of vendors) and seeds (27%). Only 7% of vendors sold PICS as the main product, while the remaining 19% sold chili, maize, and irrigation hardware as main products.

3.2.4. Farmers

Farmers are the main users and customers of PICS technology. They used the PICS bags to store grains either for household consumption or price arbitrage. The level of awareness of the PICS technology varied by country. In Ethiopia, while only 38% of sampled farmers’ focus groups (FFGs) first learned about the bags in 2016, the majority of farmers learned about PICS bags in 2017 (62%). In Tanzania, most farmers were equally not aware of the PICS bags as of 2014. However, 43% and 14% of the sampled group reported being aware of the technology in 2016 and 2017, respectively. In Uganda, the first knowledge of PICS bags started much earlier in 2014 (38% of sampled FFG). By 2015, an additional 50% reported first knowledge, and by 2017, no farmer group reported first knowledge again.
The sources of information for PICS among farmers varied widely from the PICS project to vendors, media, NGOs, and extension agents. Overall, in Ethiopia, 25% of farmers first heard of PICS bags through retailers or vendors, while 50% heard first from extension agents. The remaining 25% is split equally between market sources and NGOs. In Tanzania, 57% of the sampled FFG’s first knowledge of PICS bags came from other sources, including village chairpersons, agricultural shows, and training led by the manufacturer. The remaining 43% is divided equally among media, NGOs, and extension agents. In Uganda, 75% of sampled farmers first heard from NGOs or local representatives of the PICS project. The remaining 25% of the sample is equally divided between retailers/vendors and other sources.

3.3. Marketing Efficiency and Profit Margins

3.3.1. Marketing Efficiency

Marketing efficiency was lowest in Uganda, followed by Tanzania and Ethiopia, respectively (Figure 4). Uganda had a marketing efficiency ratio of 0.55, implying that the average price paid by farmers for the bags was nearly double (1.8×) the manufacturer’s selling price. Tanzania, on the other hand, had a ratio of 0.67, implying the average price paid by farmers was about 1.5× the manufacturer’s price. The most efficient market, however, was Ethiopia, with a ratio of 0.81, indicating the average price paid by farmers was about 1.2× the manufacturer’s selling price. In Tanzania and Uganda, the high sales performing regions were more market efficient (Figure 4). However, the converse happened in Ethiopia, where the low-performing region has better marketing efficiency.

3.3.2. Profit Margins

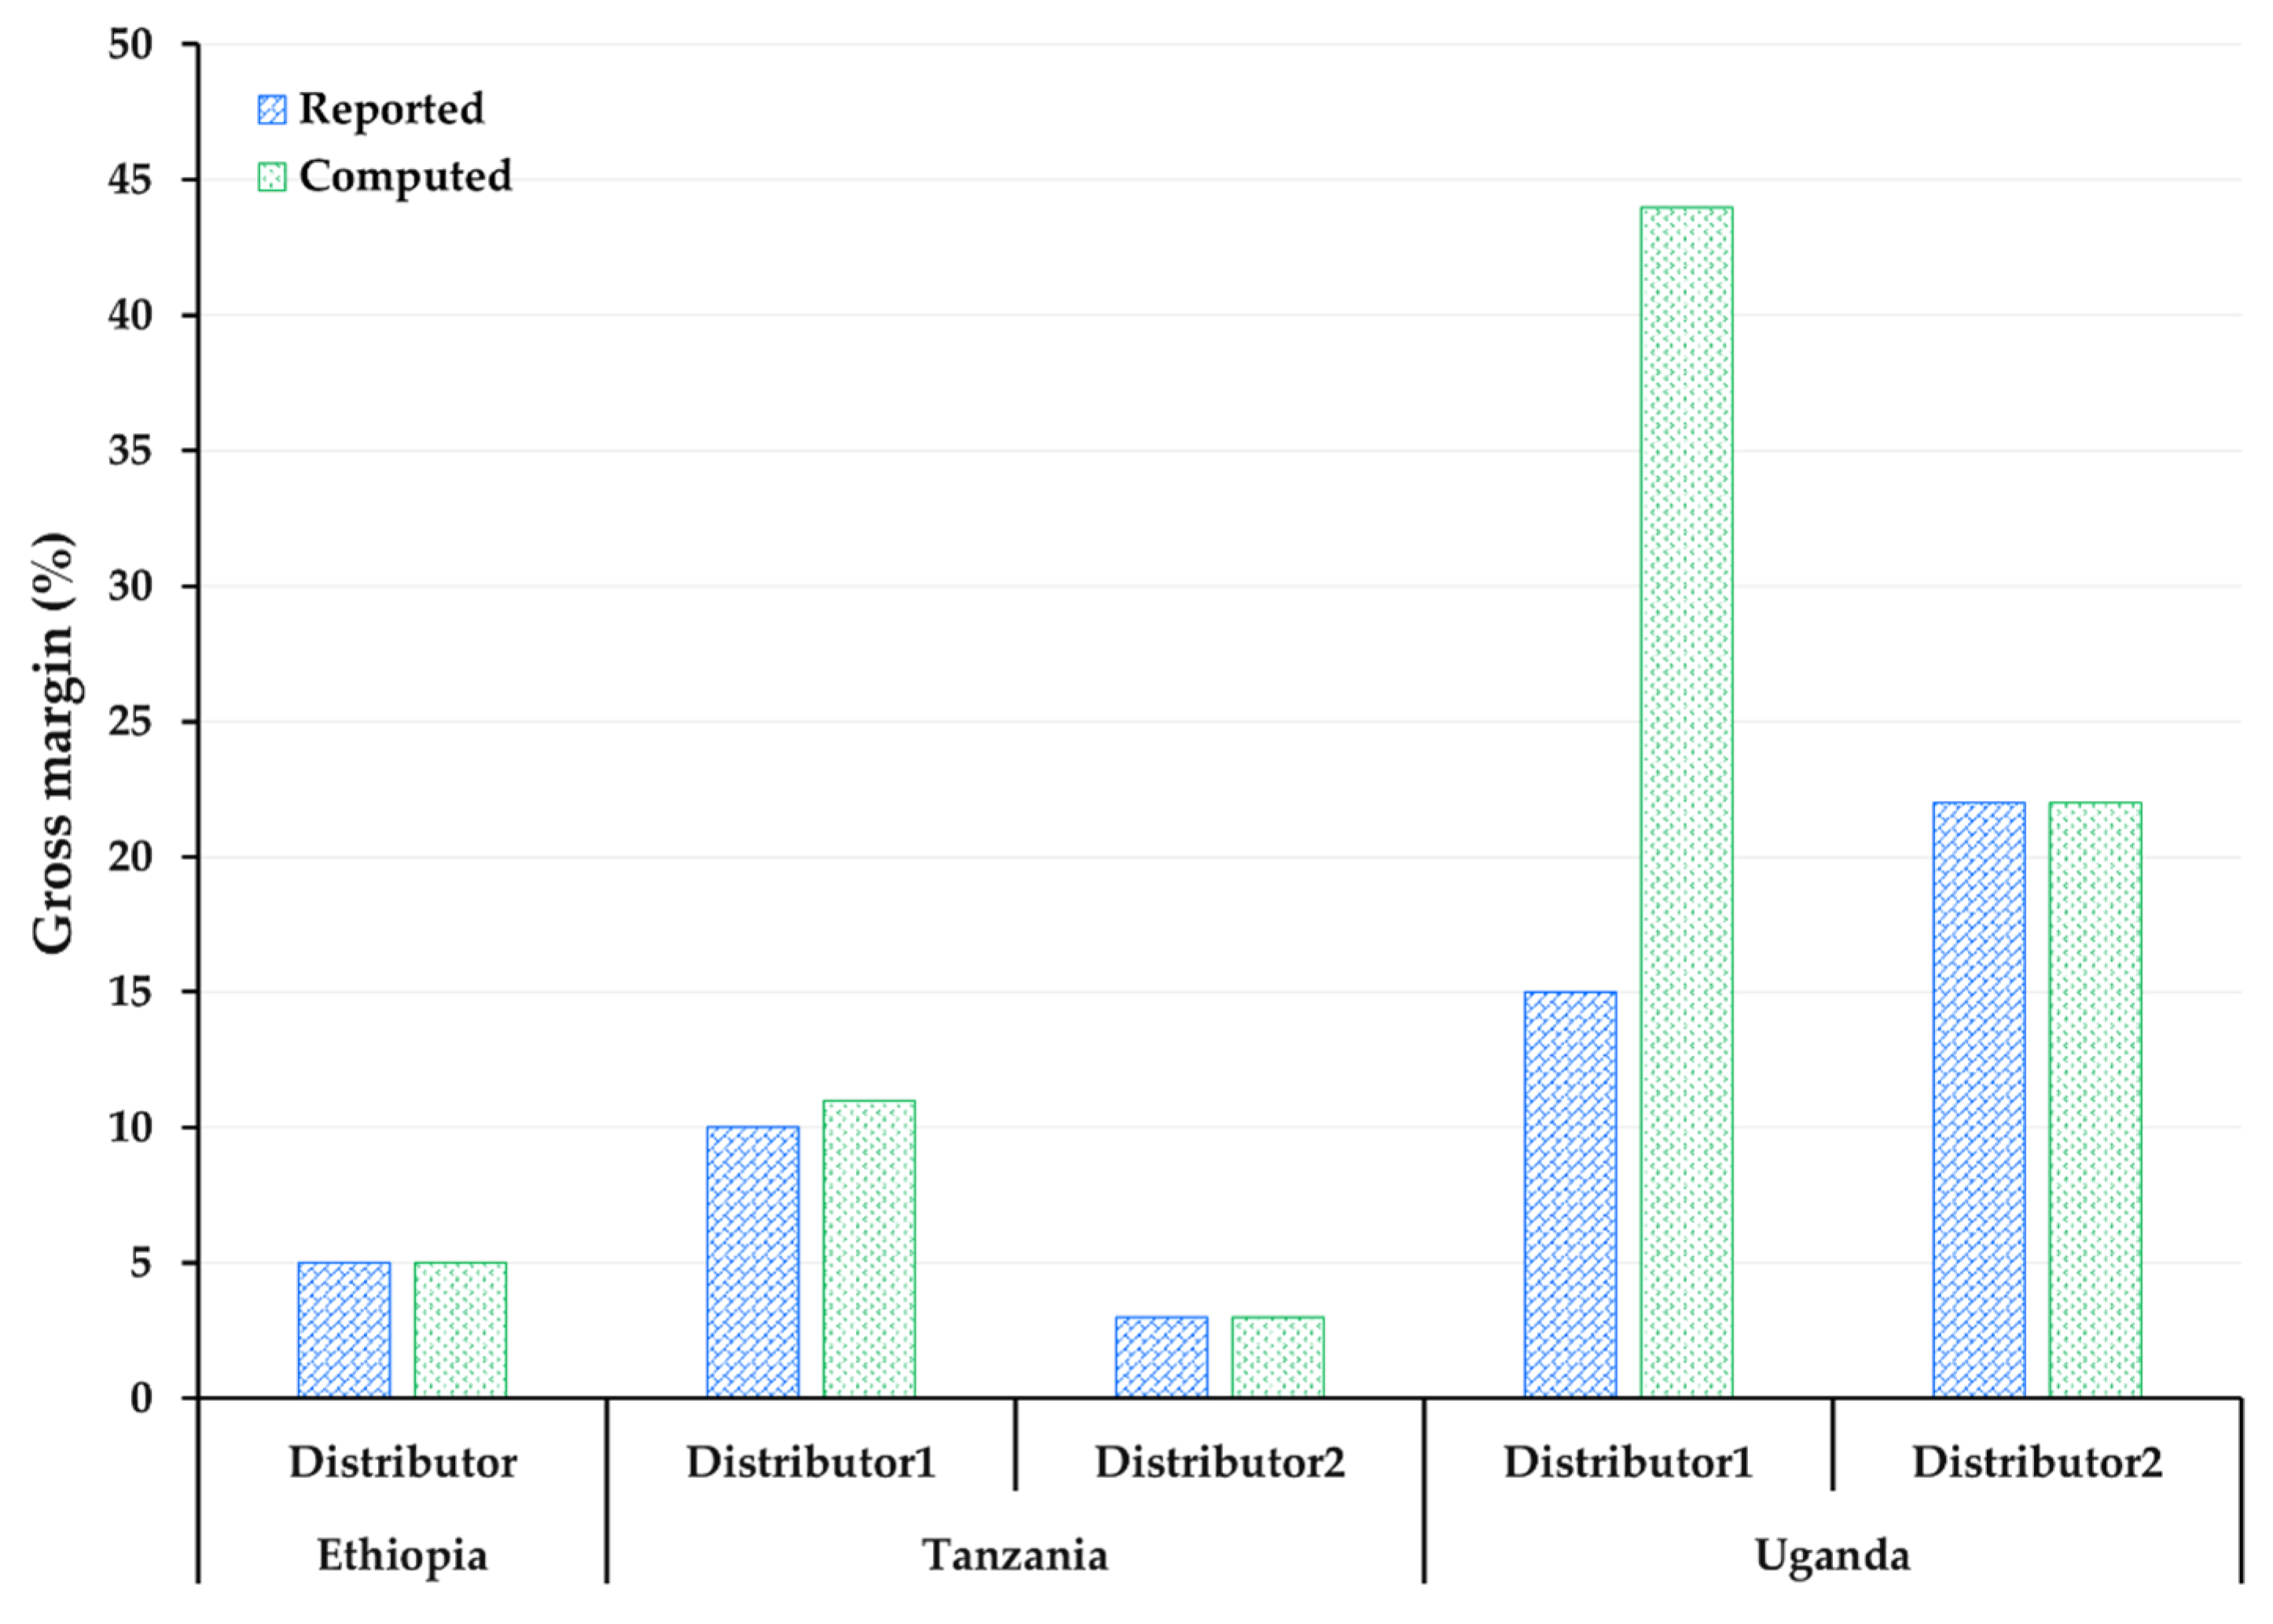
Considering the limited number of manufacturers in our sample, we were unable to determine the profit margin for manufacturers. The gross profit margins (both reported and computed) for distributors are presented in Figure 5. For distributors, the buying and selling prices were respectively: USD 1.36 and 1.43 in Ethiopia; USD 1.61 and 1.79 for distributor 1, and USD 1.57 and 1.61 for distributor 2 in Tanzania; and USD 1.15 and 1.67 for distributor 1, and USD 1.25 and 1.53 for distributor 2 in Uganda.
For vendors, the average per-unit cost buying and selling prices of PICS bags were respectively USD 1.55 and 1.73 in Ethiopia, USD 1.68 and 2.10 in Tanzania, and USD 1.67 and 2.11 in Uganda. Without accounting for transportation costs, the gross margin based on average cost and selling price were 12%, 25%, and 26% in Ethiopia, Tanzania, and Uganda, respectively. Qualitatively, 37% of vendors in Ethiopia reported that the PICS bags margin was higher than that of other products they sold, while another 37% of respondents claimed the margin was lower and 26% claimed a similar margin. In Tanzania, the majority of vendors (58%) claimed that the margin for PICS bags was higher, while 33% claimed that the margin was lower, and only 8% said the margin was the same as other products they sold. On the other hand, in Uganda, where distributors had the highest gross margin, nearly 70% of the vendors said the profit margin on PICS bags was lower compared to that of other products. Nevertheless, the broadly held consensus among vendors in Ethiopia (85%), Tanzania (92%), and Uganda (93%) was that the PICS bags business was still profitable.

3.4. Factors Affecting the Supply and Access to PICS Bags

3.4.1. Seasonality

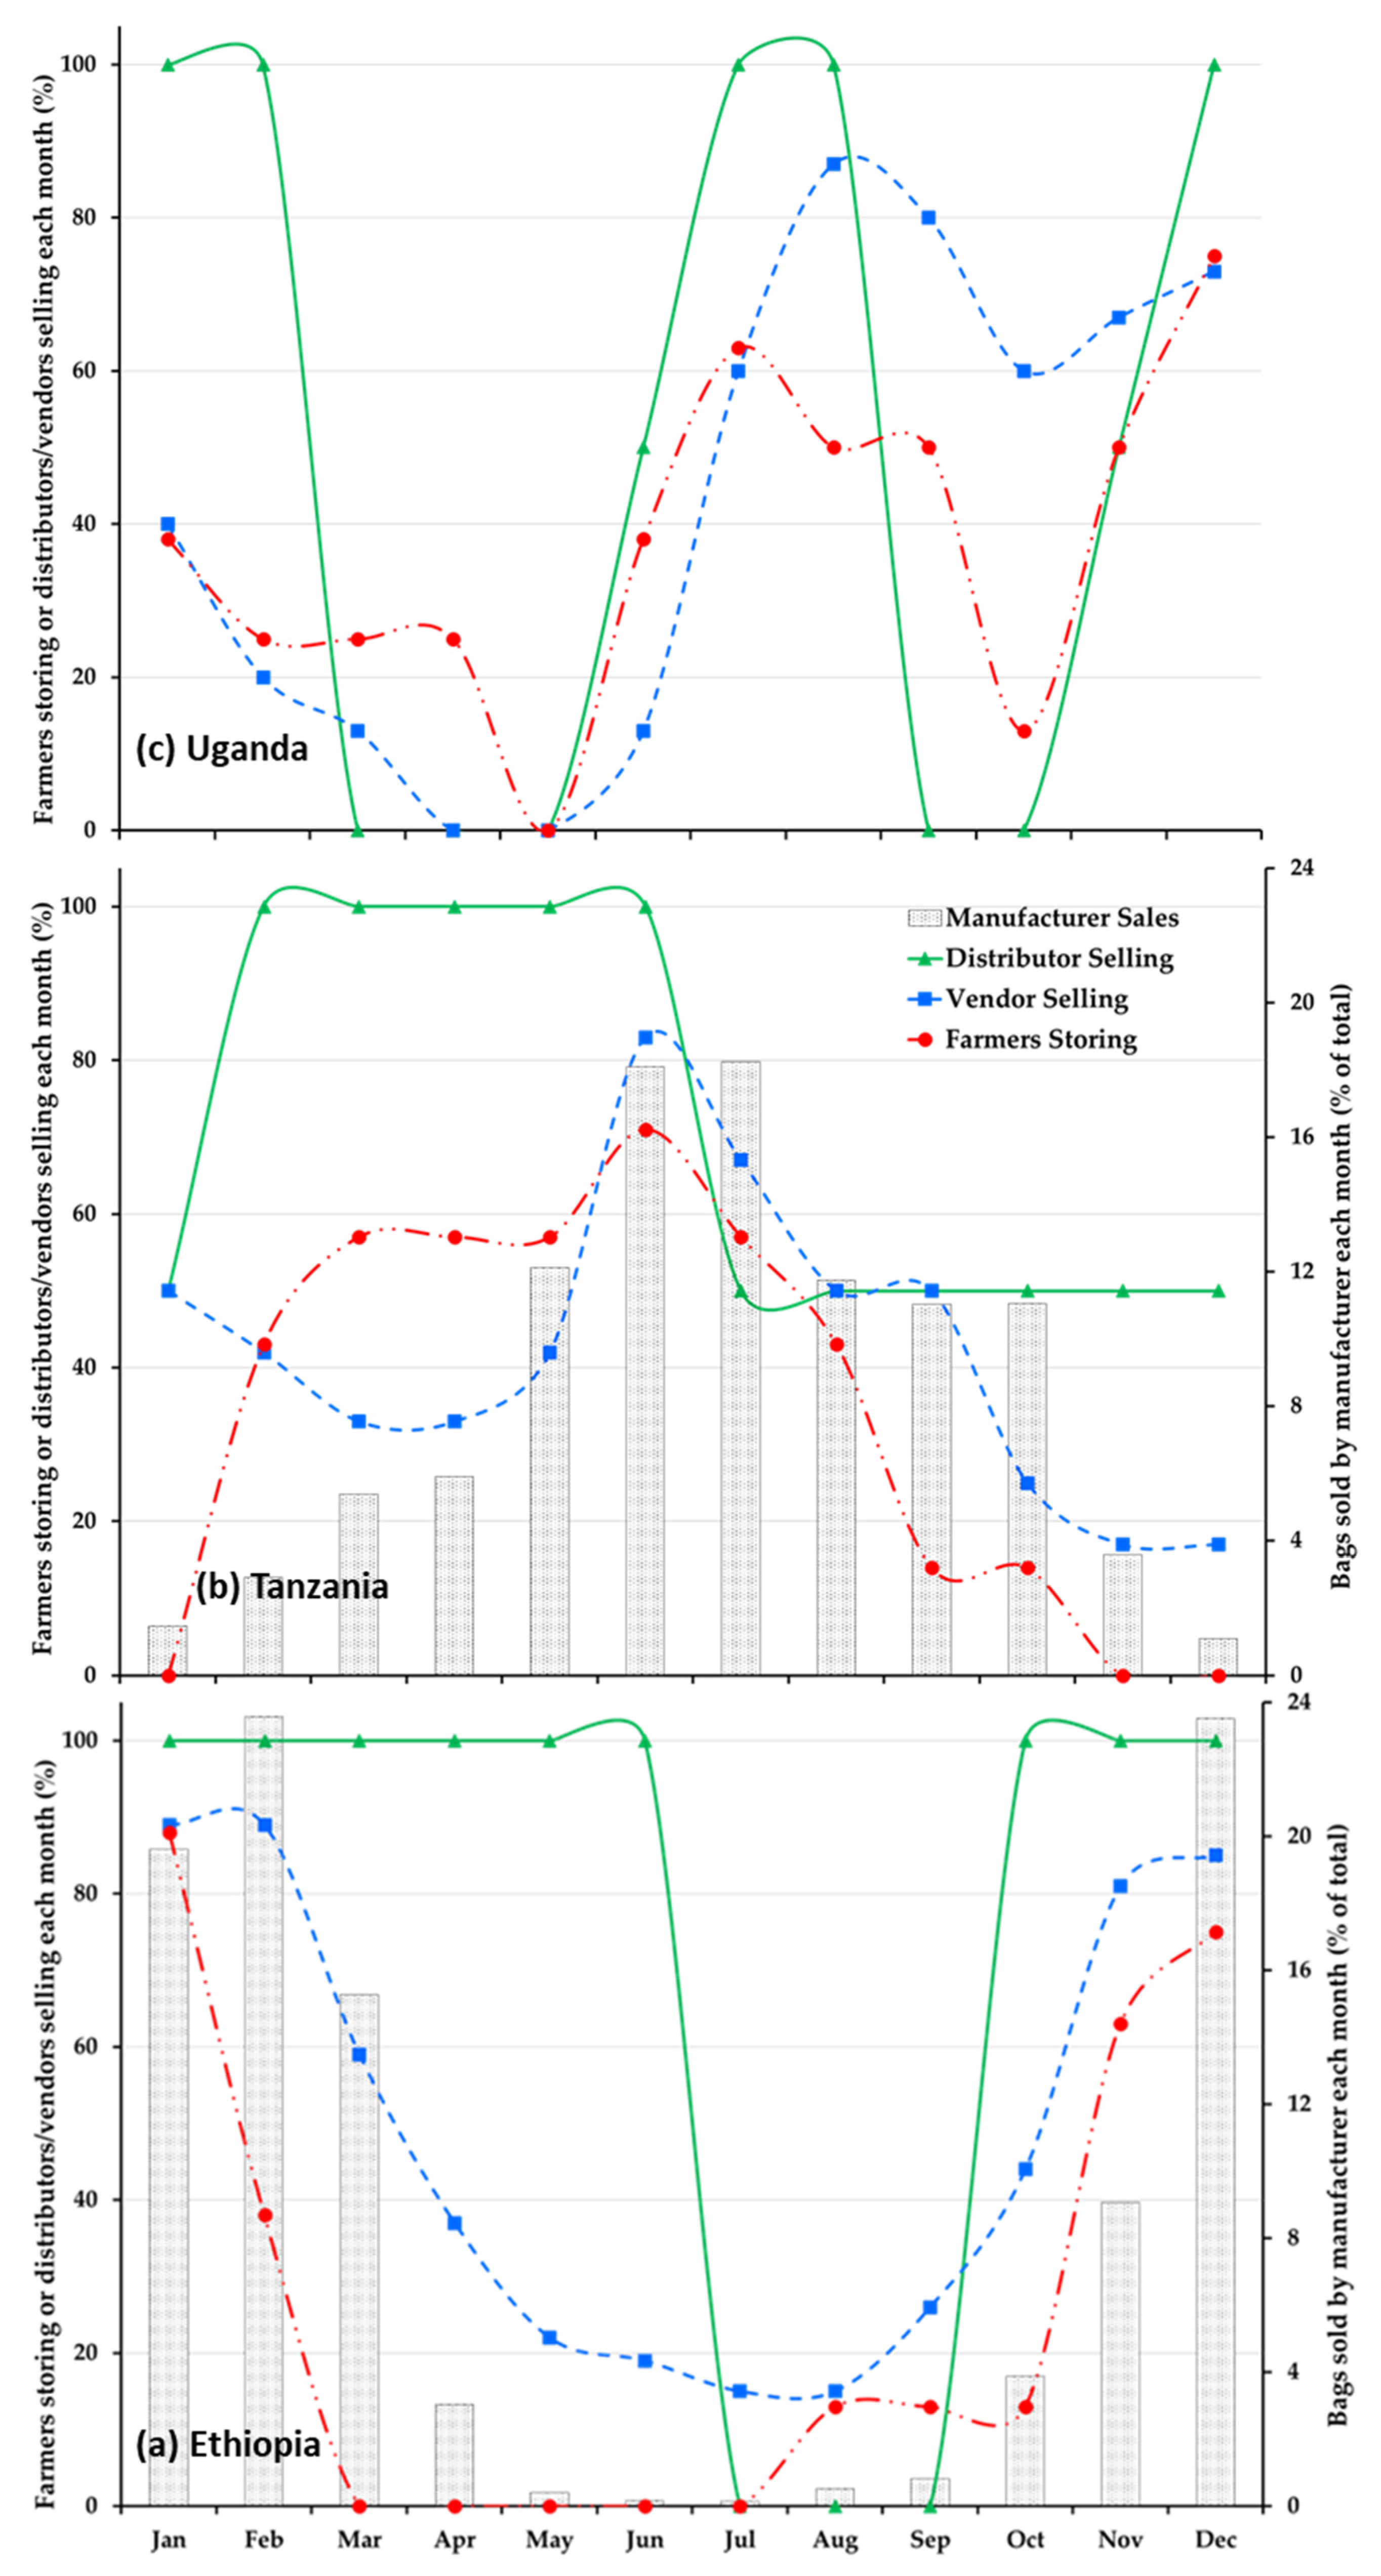
Although PICS bags are needed to store grains year-round to smooth consumption, there is large evidence of seasonality in their demand. End users purchased the bags mainly during or shortly after the harvest season across the three countries (Figure 6). However, Tanzania seems to be an exception, where farmers buy PICS bags nearly year-round, perhaps due to a largely unimodal cropping season that varies among regions within the country. It is important to note that most sales by the manufacturer in Tanzania are linked to the harvest period in the Southern Highlands, which is the largest maize-producing area. In both Tanzania and Ethiopia, despite having unimodal seasons, more distributors were active selling PICS bags compared to Uganda, where there are two harvest seasons. In Tanzania, more than 50% of distributors were actively selling PICS bags for 10 months out of the year. In Ethiopia, all distributors were actively selling PICS bags eight months out of the year. In Uganda, however, all distributors were active selling PICS bags for only four months of the year.

3.4.2. Availability and Timing of Supply of PICS Bags

Perhaps unsurprisingly, because targets are technology users with identical characteristics across the three countries, the major challenge reported by farmers is related to local availability and/or accessibility of the bags. In fact, in Ethiopia, our findings (Figure 6a) show that distributors and vendors are actively selling bags just before farmers start storing (in October) for the major agricultural season (Meher) and linger after farmers stop storing (in March). This finding suggests that the timing of supply is good. However, the distribution network appears not dense enough to cater to all farmers in their local jurisdictions. Three-fourths of farmers interviewed noted that timely supply (supply-demand timing mismatch) and local unavailability of the bags were the main challenges—not stockout. When asked about the most convenient way to make the technology available to farmers, nearly all (88%) of farmers stated “kebele center”, which is the market square in the smallest administrative unit in Ethiopia (kebele) and closest to the farmers.
In Tanzania, all (100%) farmers interviewed reported local unavailability of the bags and/or stockouts as a major challenge, while 29% reported timely supply as the main challenge. Supply chain actors used the major harvest season in the Southern Highlands in June–July as a signal to supply PICS bags, while farmers in the Lake Zone area, where the harvest season is between February and May, reported stockouts. As shown in Figure 6b, farmers stored grains nearly year-round due to variability in harvest seasons across the country as well as the need to store for a longer time to smoothen consumption due to the largely unimodal season. However, manufacturers and vendor sales only peaked at harvest (in July) and perfectly tracked farmer storage for months after harvest but lagged farmer storage before harvest. The peak in manufacturing tracked large crop productions in major regions of the country, including the Southern Highlands. Surprisingly, the distributors’ sales happen year-round and peak shortly before harvest, even before manufacturing sales increase. Moreover, farmers added that their preferred locations for purchasing the bags are local (general merchandise) shops and the establishment of PICS vendors or centers within their communities.
In Uganda, 57% of interviewed farmers reported local unavailability as the main challenge, much lower than in Ethiopia and Tanzania. Given that Uganda is largely a bimodal agricultural season, the distributor and vendor peak sales track harvests in both seasons (May–July and December–February), suggesting that both are reactive to demand, with the vendors slightly lagging behind farmer storage or demand (Figure 6c). However, no stockouts are reported by Ugandan farmers. Ugandan farmers reported the most convenient ways to make the bags available to them were selling through (general merchandise) shops in their respective villages, marketing through farmer associations, and using extension agents.

3.4.3. Logistics—Production and Transportation Costs

All manufacturers imported raw materials used in producing PICS bags. Hence, sourcing the raw materials (plastics), as well as payments in hard currency, may have been challenging. The main manufacturing challenges were: (i) manufacturers lacking access to hard currency to import raw materials, (ii) local currency depreciation affecting import prices and pricing of the bags, and (iii) pressure from distributors to ramp up production during peak season with minimal or no lead time. This last constraint suggests inventory management issues between actors in the PICS supply chain.
Transportation/delivery are major logistics constraints in the supply chain because PICS bags are bulky and must be shipped long distances from the factory to vendors and retailers in rural areas. Whereas the cost of bag delivery from the manufacturer to the distributor is shared equally between manufacturer and distributor in Ethiopia, the cost of delivery from the distributor to vendors is largely borne by vendors (as reported by 78% of vendors). Moreover, in Tanzania, the distribution cost and delivery logistics are better because the manufacturer bears the entire delivery cost and coordinates delivery to distributors. Furthermore, unlike in Ethiopia, nearly three out of five (58%) vendors in Tanzania reported that suppliers (i.e., distributors) bear the cost of transporting the bags to them. Lastly, in Uganda, the Tanzania manufacturer bears the entire transportation cost for delivering PICS bags to distributors. In Uganda, about half (53%) of vendors reported that distributors bear the cost of delivering the bags to them. Across the three countries, 37%, 17%, and 27% of vendors in Ethiopia, Tanzania, and Uganda, respectively, reported high transportation costs as a major constraint.

3.4.4. Access to Capital

Across the three countries, distributors used their funds or received credit from manufacturers to acquire PICS bags. According to distributors, bank interest rates were high and varied by country: 16% in Ethiopia, 15% in Tanzania, and 27% in Uganda (at the time of the survey in 2018). Whereas distributors in Tanzania and Ethiopia sold the bags on 50% cash advance and 50% credit (trade credit), vendors in Uganda paid 100% upfront to purchase the bags. Thus, vendors either used their source of capital (family funds or savings) or received credit from suppliers. Though vendors in Ethiopia (37%), Tanzania (50%), and Uganda (73%) noted lack of credit as a constraint to increasing purchases and sales of PICS bags; some of them reportedly accessed credit through commercial banks (18% in Uganda and 14% in Tanzania) for trading. In Ethiopia, other sources of capital included funds from cooperatives and loans from the workplace. In addition, some vendors in Ethiopia (i.e., the youth resellers) sold on commission, given that PICS bags were supplied on credit (requiring no start-up capital). Youth resellers are young people (mostly unemployed) who are recruited and provided with technical and business training, including the proper use of the PICS bag, as well as the marketing of the technology to rural farmers in villages and weekly markets [28].

3.4.5. Pricing of PICS Bags to Farmers

Farmers complained about the upfront cost of PICS bags. For instance, in Uganda and Tanzania, 43% of sampled farmers said the price/cost of acquisition is high, while 66% of farmers in Ethiopia partially mentioned high prices as a challenge to buying the bags.

4. Discussion

4.1. Distribution of the PICS Bags

The distribution length (number of intermediaries between the manufacturer and end-users or farmers) often plays a role in the overall cost of the technology to farmers in rural communities. Unlike the supply of most ag-input (i.e., fertilizer, seed) in East Africa [29,30], there is no government intervention in the distribution, pricing, and subsidies of the PICS bags. The distribution of PICS bags is fully private sector driven with limited intervention of NGOs. Most NGOs were involved in distributing PICS bags to farmers (for free or subsidized prices) in the early stage of dissemination when the private sector was not fully engaged. Currently, there is a limited number of NGOs that act as private sector distributors (selling PICS bags to farmers). The PICS distribution network varied by country. In Ethiopia, it was developed outside of the existing woven bag distribution network, particularly with the use of youths as commission-based retailers; in Tanzania, it has been operating along with an existing network of woven bag sellers. In Uganda, however, the PICS vendor network has been heavily focused on ag-input dealers (neither expanded nor utilized approaches similar to those in Ethiopia or Tanzania). This may well explain the high sales in both Ethiopia and Tanzania, and low sale volumes of PICS bags in Uganda.

4.2. Market Building-Demand Creations

Extension services (e.g., NGOs, government, farmers’ groups, etc.) created awareness and provided training to farmers on the use of hermetic bags [20]. The year of introduction of PICS bags and the level of awareness in each country was linked to project-funded activities. After the initial introduction of the technology, through pilot programs, the activities were scaled up to reach thousands of farmers in respective subsequent years. This large-scale awareness approach was critical in building a large market size (demand) among farmers to attract the investment of the private sector in the manufacturing and distribution of PICS bags. Unless sufficient demand is created, manufacturers, distributors, and vendors are reluctant to produce and stock a new product, such as PICS bags, unfamiliar to farmers. Most supply chain actors appeared not to have been involved in creating awareness about the bags (at least early in the dissemination phase). Unlike in Ethiopia, some actors in the supply side (vendors) in Tanzania were not involved in building the demand. In Uganda, despite having a heavily ag-input retail network, the role of the private sector in building awareness of the technology among farmers was minimal.

4.3. Marketing Efficiency and Profit Margins

There was a level of heterogeneity in marketing efficiency among countries and across the high sales vs. low sales performing regions within each country. The marketing efficiency observed in Tanzania and Ethiopia, for a new technology such as PICS, was due to the strength of using multiple sales channels and providing sales target incentives to foster competition in promoting the technology. The exceptionally high marketing inefficiency seen in Uganda was likely due, in part, to a lack of competition. Though Ethiopia was market efficient, the better market efficiency in the low-performing region can be explained by different strategies used to increase sales. Farmers in the low-performing areas had less cash to spend (low revenue) compared to those in high-performing areas (e.g., Jimma), who grew cash crops such as coffee. Hence, the strategies used by the national distributor in Ethiopia to increase sales in the low-performing region included: (i) price control to incentivize farmers to invest in the technology; and (ii) price discount by youth resellers (retailers) to increase the volume of sales.
Understanding the margins along the supply chain is important as this can determine product sales performance [21] and marketing efficiency. The differences between computed and reported margins were less than 1% for each distributor in all countries except in Uganda, where one distributor had a gap of 29%. This huge gap can be explained by the attitude of distributor 1 to deflect criticism by downplaying their profit margins during the interview. Both distributors in Uganda had the highest margins compared to the other countries. Such higher margins were also observed in West and Central Africa among PICS wholesalers and semi-wholesalers [23]. However, this is not particular to PICS bags, as ag-input dealers who sell fertilizer to farmers in East Africa tend to focus on higher margins rather than increase sales turnover [29,30]. Although the bags are imported into Uganda from neighboring Tanzania, there are no other costs, such as import duties and withholding charges incurred by the distributor in Uganda. Thus, it seems this extreme gross profit margin by distributors in Uganda is not justified and contributed to the high marketing inefficiency.

4.4. Factors Affecting the Supply and Access to PICS Bags

4.4.1. Seasonality

In all three countries, the seasonality of storage was a constraint to supply chain management. Despite having unimodal seasons, more vendors were active in both Tanzania and Ethiopia than in Uganda. Supply chain actors were more active in Tanzania and Ethiopia due to (i) the high demand for PICS bags among farmers and (ii) also efforts by the manufacturer/distributor to improve the availability of the technology among farmers. The manufacturer in Tanzania and distributors in Ethiopia offered several incentives to improve the availability of PICS bags in rural areas. These incentives included price discounts to distributors and vendors who purchased large quantities of bags or ordered bags off-season when the factory was less busy, and those who sold PICS bags to low-income farmers or those who failed to preserve their grain with other storage methods (e.g., traditional or chemical methods).
In Uganda, distributors and vendors were less active due to low demand for PICS bags, potentially driven by limited needs for on-farm storage. Ugandan smallholder farmers stored for a smaller number of months, which is unsurprising given the largely bimodal cropping seasons. Uganda offers bimodal rainfall that enables the production of a wide variety of crops and multiple harvests every year, which may discourage farmers from storing and hence investing in storage technologies such as PICS bags. This shorter storage period may disincentivize vendors and distributors to stock the bags before harvest, which may further impede local availability of the PICS bags, resulting in lower sales. As such, vendors may not have been inclined to stock a new product that sold more slowly.

4.4.2. Inventory Management and Timing of Supply of PICS Bags

Inventory management, including timing and capacity, can constrain the development of the PICS bag distribution [23]. Distributors waited until the harvest season to place orders from manufacturers. In some cases, the late order might have been explained by challenges in forecasting the demand for the bags before the harvest begins and limited access to credit. Concerns included overstocking the bags and managing unsold inventories. The challenge of supplying enough bags during the harvest season could be surmounted by progressively manufacturing and stocking bags before the demand peaks. This requires access to affordable working capital (by both manufacturers and distributors) and perhaps historical sales data to predict imminent demand as the harvest season approaches.
In addition to late supply, there were PICS stockouts, particularly in Tanzania, during the peak demand for PICS bags. These were also noted in West and Central Africa [26]. When stockouts occur, even when there is demand, this suggests a lack of inventory management capacity (including technical and/or financial) either from the vendor, distributor, or manufacturer. Distributors in Tanzania were better at timing the market and stocking up in advance of market demand, while the vendors waited until peak demand before moving the bags. To address issues of late ordering and stockouts, manufacturers have incentivized distributors and vendors to purchase bags at discounted prices several months before harvest when the factory is less busy. Coordination among supply chain actors is needed to improve the availability of PICS bags, during, or shortly after harvest. This is a delicate balance that requires capacity in inventory management to have a smooth and timely supply of PICS bags to farmers.

4.4.3. Supply Chain Development Strategy

One important constraint to the local availability and sales of PICS bags was the approach used in developing the supply chain for PICS bags which, early on, focused mainly on recruiting ag-input dealers as vendors of the technology. As mentioned earlier, PICS bags serve dual purposes as a container and as pest control or protectant. However, earlier efforts to develop the distribution network focused on PICS bags as a replacement for pesticides purchased by farmers in ag-input shops. Consequently, the initial supply chain activities recruited primarily ag-input dealers as PICS bag vendors, while paying less attention to other distribution channels such as woven bag vendors and retailers. Although the ag-input dealers sell a range of products, including seeds, fertilizers, and chemicals, they mainly focus on pre-production or production inputs and less on post-production technology such as PICS bags. Similar to findings in West and Central Africa [23], this oversight would later play a significant role in the marketing and distribution of the bags in all the countries, particularly in Uganda, where the marketing efficiency was the lowest. It is often the case that farmers will visit ag-input dealer shops for pre-production and production inputs but purchase post-production storage containers, such as woven bags from other sources. Leveraging post-production input distribution networks would help improve PICS bag availability among smallholder farmers in rural areas.

4.5. Access to Capital

Access to capital can impede supply chain activities [31,32]. Distributors claimed that access to credit during peak demand for PICS bags (when capital is needed the most) was one of the major challenges in increasing sales and reducing stockouts. This is not specific to PICS bags, as credit access by ag-inputs dealers to increase the stock of fertilizer at planting is a major issue in East Africa [30,33]. In general, supplier credit and family funds adequately compensate for the lack of access to capital to start a business. However, additional capital to improve inventory management might be required to address issues of timely supply and stockouts (for stocking enough bags before and during the peak of demand).

4.6. Pricing of PICS Bags

The price of the PICS bags at the farm level varied by country and depended on several factors, including the cost of manufacturing, logistics (transport, etc.), and the margins. Pricing is a constraint to PICS bag marketing, and from the manufacturer’s perspective, the constant depreciation of local currencies is a major issue affecting price setting. Admittedly, PICS bags can cost up to five times the cost of woven bags in these countries. However, PICS bags, unlike PP bags, are used three times on average and do not require pesticides to be effective [34]. In addition, there are potential quality premiums for grains stored in the PICS bags from no usage of chemical pesticides on grains stored [24]. Given PICS bags serve as storage containers like woven bags, it is not unlikely that farmers focus on the woven bag prices without accounting for other costs and health implications of applying chemicals to stored grains. Farmers using woven bags must invest in purchasing and applying insecticides, often several times during the same storage period. Thus, PICS bags are overall profitable and have a higher return than regular woven bags over their lifetime [7,24,25]. Therefore, more enlightenment and re-training on the (health and reduced insecticide costs) benefits of the technology may improve the valuation of the technology among farmers [18,25,26].

5. Conclusions

This study examines the PICS supply chain and documents supply-side constraints and challenges. Many important findings have emerged through this study.
First, some of the supply-side constraints identified included poor inventory management capacity and pricing (i.e., upfront cost) of PICS bags. Inventory management can be improved through better forecasting using a combination of prior sale records and forecasts of farmers’ harvests.
Second, evidence suggests that marketing inefficiency was fueled by a high-profit margin at the distributor level, disincentivizing vendors and retailers at the lower level of the distribution network to sell more PICS bags to farmers. Facilitating an environment for market competition upstream (e.g., distributors and vendors) through incentives may create efficiency gains to lower prices and make bags available in rural areas.
Third, access to capital or high-interest rates can often impede the acquisition of PICS bags by distributors and vendors. Overall, evidence shows that private savings and supplier credits largely compensate for this market failure. Given the impact of lack of credit leading to late supply and stockouts, increasing access to capital by distributors and vendors (with low financial capacity) during peak season would improve availability.
Lastly, the initial supply chain approach that primarily focused on ag-input dealers as the marketing channels had limitations in improving PICS bag availability among farmers. Diversified and innovative PICS retail networks (e.g., the youth reseller model in Ethiopia and sales through PP woven bag network and general merchandise stores in Tanzania) will enhance the availability of the bags in local and rural communities/markets.
Future efforts to improve the supply chain include (i) scaling the use of hermetic storage by securing finance for smallholder farmers so that they can store more grain at harvest (instead of selling when prices are lowest) and sell later when prices are high; (ii) using digital solutions to make PICS bags available and accessible to farmers in rural areas; and (iii) collecting or buying back PICS bags that are no longer viable for hermetic storage purposes for recycling.

Author Contributions

Conceptualization, D.B.; methodology, D.B. and O.J.O.; software, O.J.O. and D.B.; validation, O.J.O. and D.B.; formal analysis, O.J.O.; investigation, O.J.O.; resources, D.B.; data curation, O.J.O. and D.B.; writing—original draft preparation, O.J.O.; writing—review and editing, O.J.O. and D.B.; visualization, O.J.O. and D.B.; supervision, D.B.; project administration, D.B.; funding acquisition, D.B. All authors have read and agreed to the published version of the manuscript.

Funding

We thank the Bill and Melinda Gates Foundation (BMGF) for supporting this study under the PICS3 project (grant# INV-006972) funded to Purdue University.

Institutional Review Board Statement

The study was conducted according to the guidelines of the Declaration of Helsinki and approved by the Institutional Review Board (or Ethics Committee) of Purdue University (protocol code 1405014885).

Informed Consent Statement

Informed consent was obtained from all subjects involved in the study.

Data Availability Statement

Raw data are not publicly available, though the data may be made available on request from the corresponding author.

Acknowledgments

We are grateful to all PICS (manufacturers, distributors, vendors, retailers, etc.) and non-PICS (NGOs, government extension agents, woven bag vendors, etc.), actors, and farmers who devoted their time to respond to the questionnaires. We further acknowledge the logistics support provided by PICS partners in all three countries during data collection. Lastly, we thank Wilfred Thembo and Jean Njiru, who implemented the survey in Uganda and Tanzania.

Conflicts of Interest

Dieudonne Baributsa is a co-founder of PICS Global Inc. (Doha, Qatar), a social enterprise that commercializes postharvest technologies (including PICS bags) to smallholder farmers around the world and hence declares a conflict of interest. The other authors declare no conflict of interest. The funder (Bill and Melinda Gates Foundation) had no role in the design of the study; in the collection, analysis, or interpretation of data; in the writing of the manuscript, or in the decision to publish the results.

References

  1. Santos, C.A.F.; Da Costa, D.C.C.; Da Silva, W.R.; Boiteux, L.S. Genetic analysis of total seed protein content in two cowpea crosses. Crop Sci. 2012, 52, 2501–2506. [Google Scholar] [CrossRef] [Green Version]
  2. Gitonga, Z.M.; De Groote, H.; Kassie, M.; Tefera, T. Impact of metal silos on households’ maize storage, storage losses and food security: An application of a propensity score matching. Food Policy 2013, 43, 44–55. [Google Scholar] [CrossRef]
  3. Larochelle, C.; Alwang, J.R. Impacts of Improved Bean Varieties on Food Security in Rwanda Impacts of Improved Bean Varieties on Food Security in Rwanda. In Proceedings of the Agricultural and Applied Economics Association, 2014 Annual Meeting, Minneapolis, Minnesota, 27–29 July 2014; pp. 1–27. [Google Scholar]
  4. Basu, K.; Wong, M. Evaluating seasonal food storage and credit programs in east Indonesia. J. Dev. Econ. 2015, 115, 200–216. [Google Scholar] [CrossRef] [Green Version]
  5. Mutiga, S.K.; Mushongi, A.A.; Kangéthe, E.K. Enhancing Food Safety through Adoption of Long-Term Technical Advisory, Financial, and Storage Support Services in Maize Growing Areas of East Africa. Sustainability 2019, 11, 2827. [Google Scholar] [CrossRef] [Green Version]
  6. Abdoulaye, T.; Ainembabazi, J.H.; Alexander, C.; Baributsa, D.; Kadjo, D.; Moussa, B.; Omotilewa, O.; Ricker-Gilbert, J.; Shiferaw, F. Postharvest Loss of Maize and Grain Legumes in Sub-Saharan Africa: Insights from Household Survey Data in Seven Countries; EC-807-W; Purdue Extension: West Lafayette, IN, USA, 2016. [Google Scholar]
  7. Jones, M.; Alexander, C.; Lowenberg-DeBoer, J. A simple methodology for measuring profitability of on-farm storage pest management in developing countries. J. Stored Prod. Res. 2014, 58, 67–76. [Google Scholar] [CrossRef]
  8. WorldBank. Missing Food: The Case of Postharvest Grain Losses in Sub-Saharan Africa; The World Bank: Washington, DC, USA, 2011. [Google Scholar]
  9. Lipinski, B.; Hanson, C.; Lomax, J.; Kitinoja, L.; Waite, R.; Searchinger, T. Toward a Sustainable Food System: Reducing Food Loss and Waste; International Food Policy Research Institute (IFPRI): Washington, DC, USA, 2016; pp. 23–31. [Google Scholar]
  10. Stathers, T.; Holcroft, D.; Kitinoja, L.; Mvumi, B.M.; English, A.; Omotilewa, O.; Kocher, M.; Ault, J.; Torero, M. A scoping review of interventions for crop postharvest loss reduction in sub-Saharan Africa and South Asia. Nat. Sustain. 2020, 3, 821–835. [Google Scholar] [CrossRef]
  11. Affognon, H.; Mutungi, C.; Sanginga, P.; Borgemeister, C. Unpacking Postharvest Losses in Sub-Saharan Africa: A Meta-Analysis. World Dev. 2015, 66, 49–68. [Google Scholar] [CrossRef] [Green Version]
  12. De Groote, H.; Kimenju, S.C.; Likhayo, P.; Kanampiu, F.; Tefera, T.; Hellin, J. Effectiveness of hermetic systems in controlling maize storage pests in Kenya. J. Stored Prod. Res. 2013, 53, 27–36. [Google Scholar] [CrossRef]
  13. Ndewga, M.K. Effectiveness and economics of hermetic bags for maize storage: Results of a randomized controlled trial in Kenya. Crop Prot. 2016, 90, 17–26. [Google Scholar]
  14. Njoroge, A.W.; Affognon, H.D.; Mutungi, C.M.; Manono, J.; Lamuka, P.O.; Murdock, L.L. Triple bag hermetic storage delivers a lethal punch to Prostephanus truncatus (Horn) (Coleoptera: Bostrichidae) in stored maize. J. Stored Prod. Res. 2014, 58, 12–19. [Google Scholar] [CrossRef]
  15. Williams, S.B.S.B.; Baributsa, D.; Woloshuk, C. Assessing Purdue Improved Crop Storage (PICS) bags to mitigate fungal growth and aflatoxin contamination. J. Stored Prod. Res. 2014, 59, 190–196. [Google Scholar] [CrossRef]
  16. Murdock, L.L.; Margam, V.; Baoua, I.; Balfe, S.; Shade, R.E. Death by desiccation: Effects of hermetic storage on cowpea bruchids. J. Stored Prod. Res. 2012, 49, 166–170. [Google Scholar] [CrossRef]
  17. Baributsa, D.; Lowenberg-DeBoer, J.; Murdock, L.; Moussa, B. Profitable chemical-free cowpea storage technology for smallholder farmers in Africa: Opportunities and challenges. Gates Open Res. 2019, 3, 853. [Google Scholar]
  18. Baributsa, D.; Njoroge, A.W. The use and profitability of hermetic technologies for grain storage among smallholder farmers in eastern Kenya. J. Stored Prod. Res. 2020, 87, 101618. [Google Scholar] [CrossRef] [PubMed]
  19. Mainville, D.; Ness-Edelstein, B. AgResults Evaluation: Kenya On-Farm Storage Challenge Project. Sustainability Assessment; Prepared for the U.K. Foreign, Commonwealth, and Development Office and the AgResults Steering Committee; Abt Associates: Rockville, MD, USA, 2021. [Google Scholar]
  20. Baributsa, D.; Ignacio, M.C. Developments in the use of hermetic bags for grain storage. In Advances in Postharvest Management of Cereals and Grains; Maier, D.E., Ed.; Burleigh Dodds Science Publishing: Cambridge, UK, 2020; ISBN 978-1-78676-352-5. [Google Scholar]
  21. Govereh, J.; Muchetu, R.G.; Mvumi, B.M.; Chuma, T. Analysis of distribution systems for supply of synthetic grain protectants to maize smallholder farmers in Zimbabwe: Implications for hermetic grain storage bag distribution. J. Stored Prod. Res. 2019, 84, 101520. [Google Scholar] [CrossRef]
  22. Baributsa, D.; Abdoulaye, T.; Lowenberg-DeBoer, J.; Dabiré, C.; Moussa, B.; Coulibaly, O.; Baoua, I. Market building for post-harvest technology through large-scale extension efforts. J. Stored Prod. Res. 2014, 58, 59–66. [Google Scholar] [CrossRef]
  23. Nouhoheflin, T.; Coulibaly, J.Y.; D’Alessandro, S.; Aitchédji, C.C.; Damisa, M.; Baributsa, D.; Lowenberg-DeBoer, J.; Stephen, D.A.; Aitchédjid, C.C.; Damisae, M.; et al. Management lessons learned in supply chain development: The experience of PICS bags in West and Central Africa. Int. Food Agribus. Manag. Rev. 2017, 20, 427–438. [Google Scholar] [CrossRef]
  24. Omotilewa, O.J.; Ricker-Gilbert, J.; Ainembabazi, J.H. Subsidies for Agricultural Technology Adoption: Evidence from a Randomized Experiment with Improved Grain Storage Bags in Uganda. Am. J. Agric. Econ. 2019, 101, 753–772. [Google Scholar] [CrossRef] [Green Version]
  25. Rabé, M.M.; Baoua, I.B.; Baributsa, D. Adoption and Profitability of the Purdue Improved Crop Storage Technology for Grain Storage in the South-Central Regions of Niger. Agronomy 2021, 11, 2470. [Google Scholar] [CrossRef]
  26. Moussa, B.; Abdoulaye, T.; Coulibaly, O.; Baributsa, D.; Lowenberg-DeBoer, J. Adoption of on-farm hermetic storage for cowpea in West and Central Africa in 2012. J. Stored Prod. Res. 2014, 58, 77–86. [Google Scholar] [CrossRef]
  27. Baba, S.H.; Wani, M.H.; Zargar, B.A.; Wani, S.A.; Kubrevi, S.S. Pesticide Delivery System in Apple Growing Belt of Kashmir Valley. Agric. Econ. Res. Rev. 2012, 25, 435–444. [Google Scholar]
  28. Shayashone Youth Entrepreneurship in Ethiopia. Available online: https://shayashone.com/eventandstories/youth-entrepreneurship-ethiopia (accessed on 15 September 2022).
  29. AGRA. Assessment of Fertilizer Distribution Systems and Opportunities for Developing Fertilizer Blends; Alliance for a Green Revolution in Africa: Nairobi, Kenya, 2018. [Google Scholar]
  30. Benson, T.; Kirama, S.L.; Selejio, O. The Supply of Inorganic Fertilizers to Smallholder Farmers in Tanzania; International Food Policy Research Institute (IFPRI): Washington, DC, USA, 2013. [Google Scholar]
  31. Lee, C.H.; Rhee, B.-D. Trade credit for supply chain coordination. Eur. J. Oper. Res. 2011, 214, 136–146. [Google Scholar] [CrossRef]
  32. Sodhi, M.S.; Tang, C.S. Social enterprises as supply-chain enablers for the poor. Socioecon. Plann. Sci. 2011, 45, 146–153. [Google Scholar] [CrossRef]
  33. Chianu, J.N.; Mairura, F.; Ekise, I.; Chianu, J.N. Farm input marketing in western Kenya: Challenges and opportunities. Afr. J. Agric. Res. 2008, 3, 167–173. [Google Scholar]
  34. Baributsa, D.; Djibo, K.; Lowenberg-DeBoer, J.; Moussa, B.; Baoua, I. The fate of triple-layer plastic bags used for cowpea storage. J. Stored Prod. Res. 2014, 58, 97–102. [Google Scholar] [CrossRef]
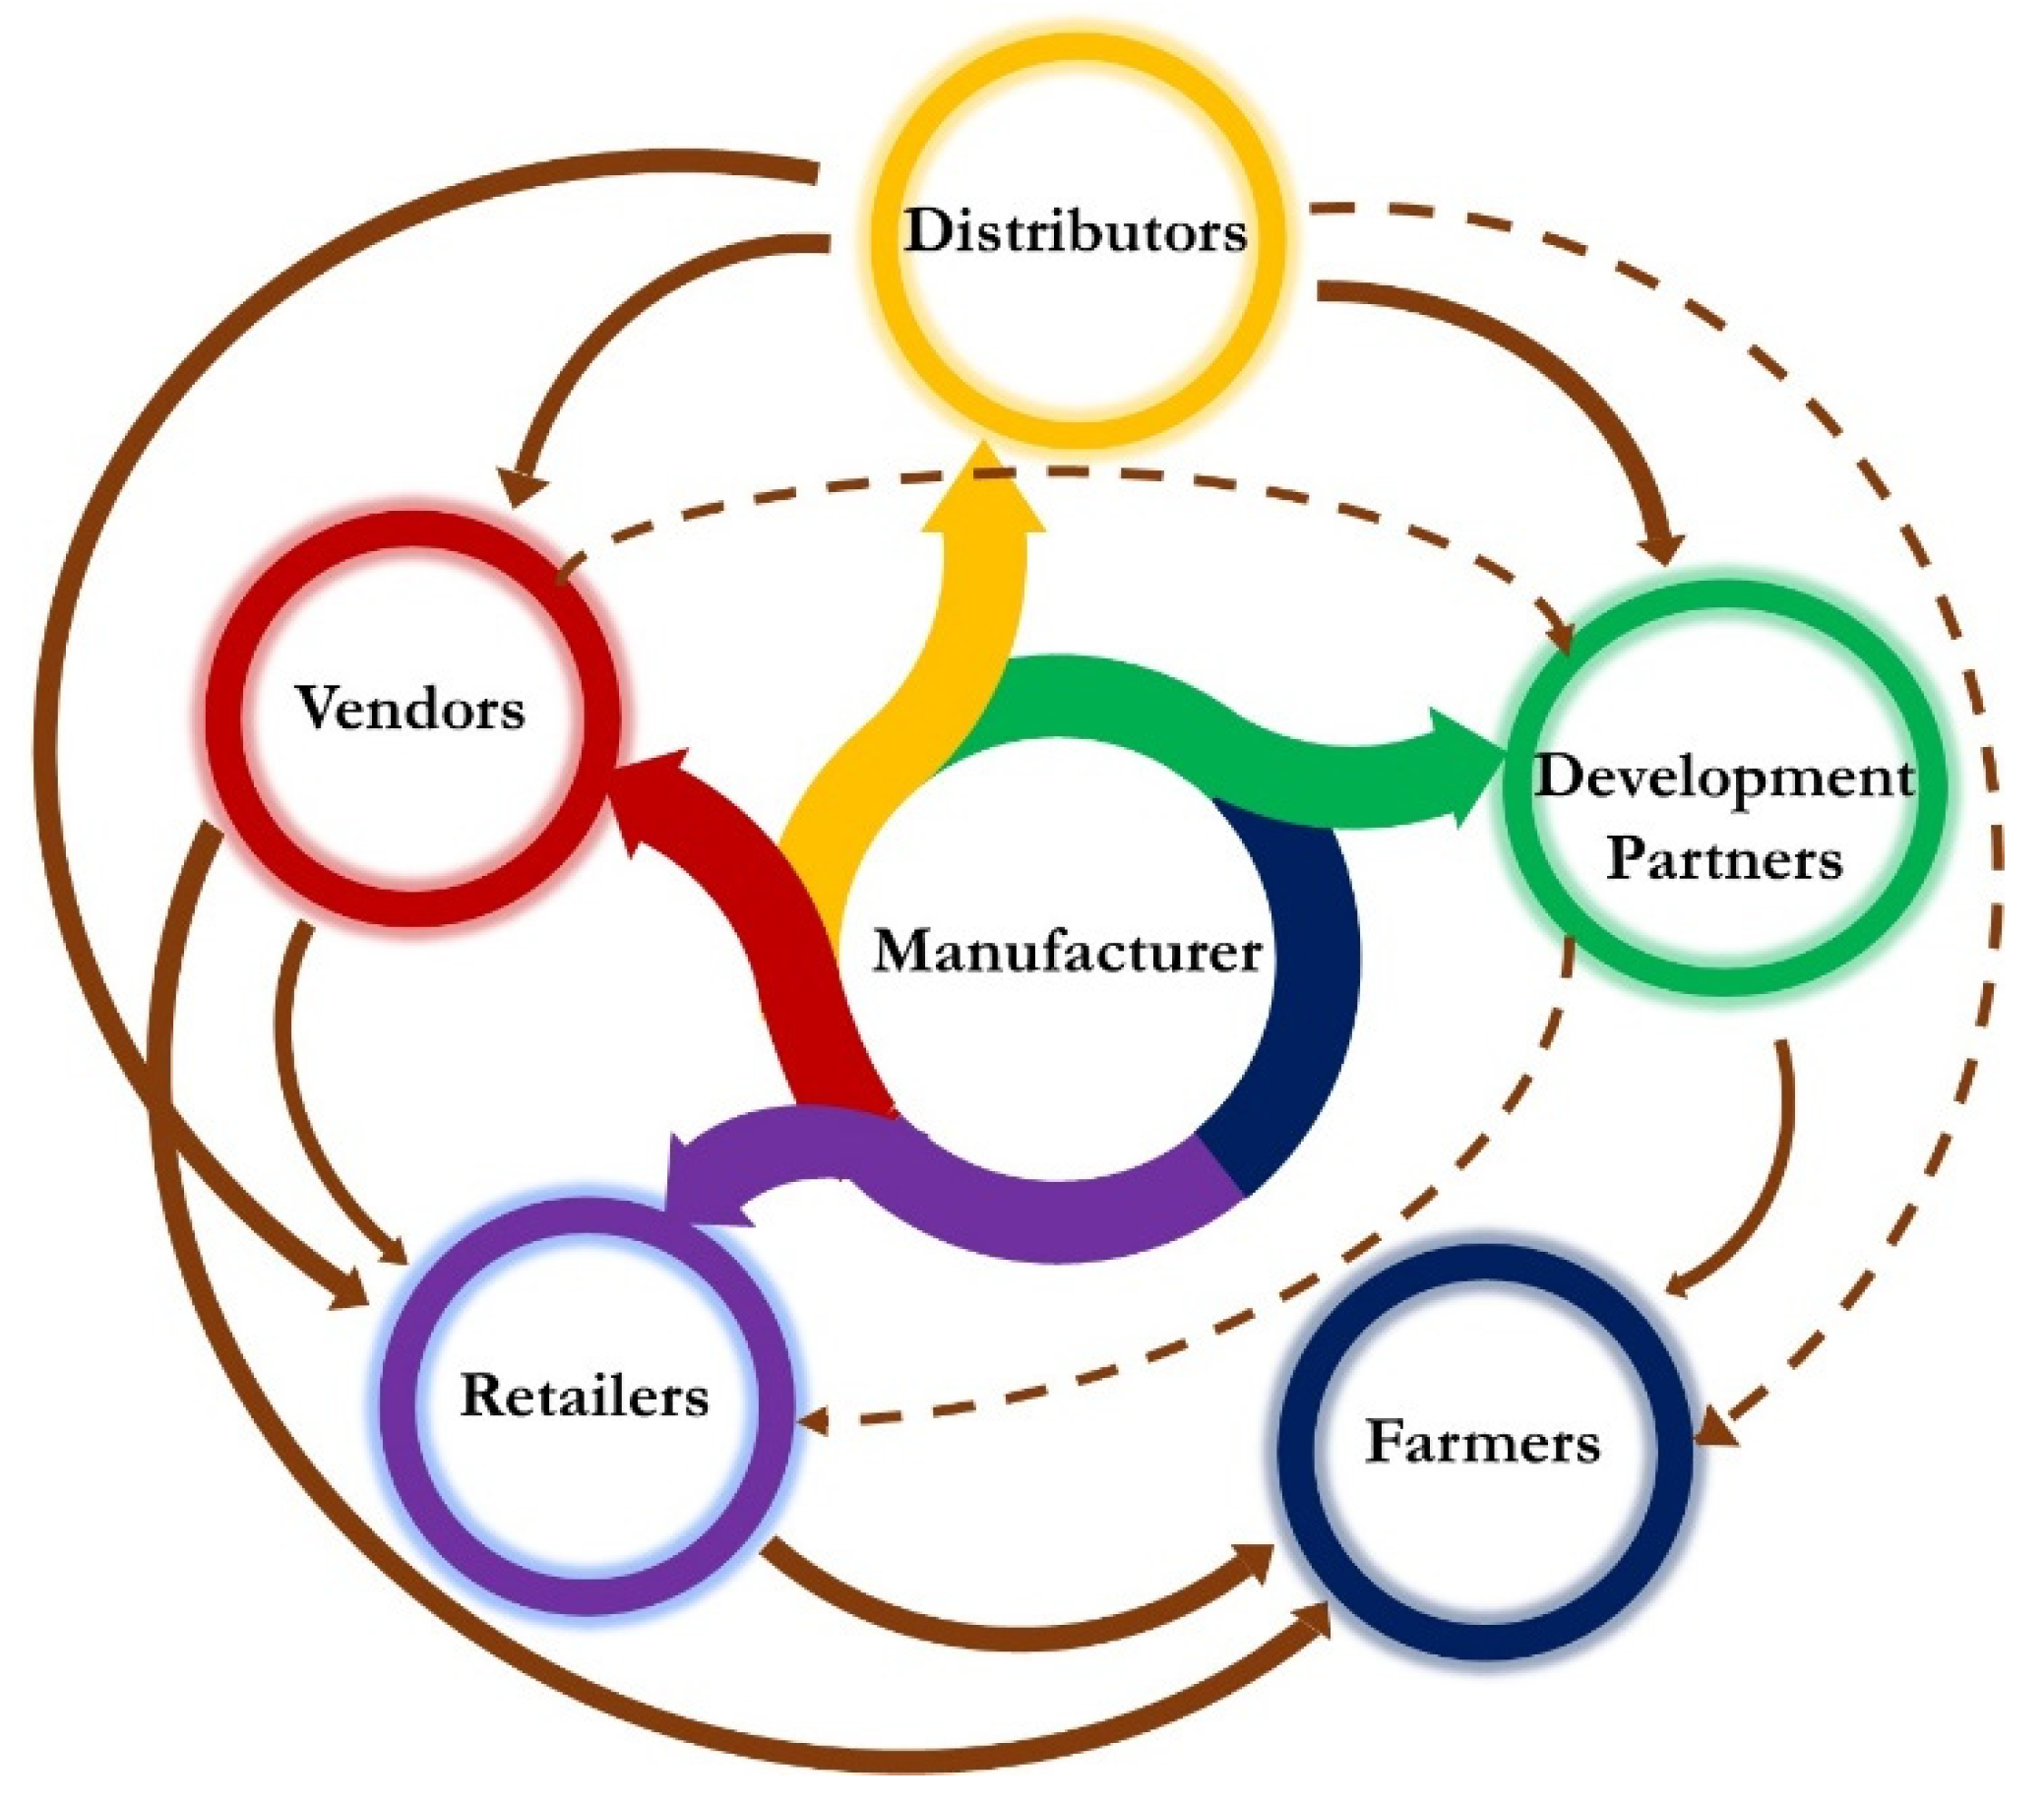
Figure 1. Relationship among Purdue Improved Crop Storage (PICS) bag supply chain actors. The solid arrows indicate direct relationships between actors, while the dotted lines indicate uncommon but sometimes observed links between supply chain actors. Source: Authors’ creation based on data collected during the study.
Sustainability 14 12579 g001
Figure 2. Sales of PICS bags in Ethiopia, Tanzania, and Uganda since the introduction of the technology in each country in 2014 until the survey was conducted in 2017.
Sustainability 14 12579 g002
Figure 3. Main lines of businesses of vendors selling PICS bags in Ethiopia, Tanzania, and Uganda during 2017–2018.
Sustainability 14 12579 g003
Figure 4. Marketing efficiency of the PICS bags in Ethiopia, Tanzania, and Uganda.
Sustainability 14 12579 g004
Figure 5. Computed and reported margins on PICS bags for distributors in Ethiopia, Tanzania, and Uganda.
Sustainability 14 12579 g005
Figure 6. Monthly PICS bag sales by manufacturers in (a) Ethiopia and (b) Tanzania (percent of annual sales) and farmers storing grain or distributors and vendors selling PICS bags each month (percent) in (a) Ethiopia, (b) Tanzania, and (c) Uganda. There was no manufacturer in Uganda, hence, no data were reported.
Sustainability 14 12579 g006
Table 1. Supply chain study area and survey period in Ethiopia, Tanzania, and Uganda.
CountryRegion (District)Survey Period
High-performingLow-performing
EthiopiaOromia (Jimma, Limu)Southern Nations, Nationalities, and Peoples’ Region (SNNPR; Butajira, Walaita Sodo, Sawla, and Arba Minch)April, 2018
TanzaniaSouthern Highlands (Mbeya, Mbinga, Mwanza)Dar es SalaamJanuary, 2018
UgandaNorthern (Lira, Gulu, Aduku)Eastern (Iganga, Jinja, Lugazi, Bugiri, Mbale)November, 2017
Table 2. Actors interviewed during the supply chain study in Ethiopia, Tanzania, and Uganda.
CountryManufacturerDistributorVendorsDevelopment Partners/NGOsFamers Focus GroupsTotal
Ethiopia11275842
Tanzania12123725
Uganda02156831
Total2554142398
Publisher’s Note: MDPI stays neutral with regard to jurisdictional claims in published maps and institutional affiliations.