Abstract
The central part of Chile has been in severe unprecedented drought for more than ten years, becoming a water-stressed area. ESVAL, one of the main water utilities in the Chilean water sector, is responsible for delivering potable water to the population and securing long-term supply in the vast majority of this area. In order to achieve this goal, ESVAL is implementing different measures, with pressure management being one of them. This paper aims to describe the works executed in La Calera city to implement a new advanced pressure management scheme on an existing pressure-reducing valve with two main targets: reducing leakage and improving the level of service to the customers. The results show that advance pressure management generates a 10.12% reduction in the minimum night flow while, at the same time, helping to improve the level of service to the customers reducing the number of times pressure falls below the minimum target set by ESVAL by 52%. It is concluded that pressure management facilitates quick water savings by optimizing the performance of existing pressure-reducing valves.
1. Introduction
Water utilities across the world are facing common challenges in delivering water with the right level of service and quality to their customers [1]. One of the major challenges is related to water distribution networks aging quickly, and the rate of leakage and water lost through them increasing [2]. Water loss has become a major problem for three main reasons: it directly impacts the utility’s economic performance, reputation and associated economic activities [3], increases energy losses and expenses as more water needs to be treated [4] and could also generate a potential entry door of contaminants to the water distribution network (WDN) [5], especially in intermittent supply conditions [6]. Indeed, network pollution is identified as a major concern in the United States [7]. Due to this, water distribution companies are establishing different leakage management strategies to address this problem and reduce losses [8]. Future sustainable WDN will require smart technologies, relying on information and communication for better water management. A review of different approaches for this is facilitated by Kanakoudis and Tsitsifli [9].
The International Water Association (IWA) identifies four basic pillars in a leakage management policy: active leakage control, asset management, speed and quality of repairs and Pressure Management (PM) [10]. Out of these four techniques, PM has proven to be one of the most efficient methods to address leakage reduction in WDN due to the direct relationship between the network operating pressure and water lost by leakages and burst frequency and the occurrence of new leakages [11,12]. The impact of PM depends on the pressure [13] and on pipe materials [14]: pipe breaks in cast iron and asbestos cement pipes could be reduced by 18% to 30% by reducing the average supply pressure [15]. Network operating pressure is also directly related to customer demand; thus, PM is an efficient tool in water scarcity scenarios to secure constant and reliable service to customers with the right level of pressure for the whole day [16]. However, PM for demand management and consumption reduction is not as widely used as it is for leakage reduction purposes.
Worldwide, many WDNs are operating at a pressure higher than required, so the rate of water loss can be reduced by reducing and adjusting the pressure [17]. PM has been employed in some of the largest non-revenue water (NRW) reduction projects implemented all over the world, such as West Manila in the Philippines [18], New Providence island in the Bahamas [19] and in several countries of the European Union [20]. A good review of several case study references in different countries employing diverse PM schemes for different targets can be found in the literature [21]. The use of advanced PM models is not just limited to WDN: the literature shows a reference for the application on buildings to reduce water consumption between 20% and 100% [22].
There are several ways to manage pressure in a WDN to reduce leakage. A review of these methods can be found in the literature [23]. One of the simplest ways is by optimizing water levels in storage tanks. Generally, the level is kept lower during the night when the demand is lower and not so much pressure is required in the network. This method does not involve major investment, but its application is limited to operating conditions and the location and availability of storage tanks [24]. Another common method is by optimizing pump scheduling hours [25]. This method has a major disadvantage: pump optimizing hours for leakage reduction usually contradicts energy-saving targets [26]. However, in this case, the use of pumps as turbines under excess flow and pressure conditions to maximize energy recovery has been proven to provide economic benefits to water utilities [27]. The third method is by isolating different parts of the WDN and creating district-metered areas (DMA). The creation of DMAs has been traditionally based on a trial and error method, making its application difficult for vast WDNs. Recent modeling techniques using algorithms have given impressive results in this regard [28]. DMAs are used for PRV implementation [29] and for the localization of leaks in conjunction with internal valve operation and water meter reading [30].
The use of PRVs in WDN could be considered the most used technique for pressure management, with existing many references in the literature describing its application to improve network performance and water supply [31]. Existing work in the literature describes the different types of control that can be implemented on PRVs [32], simulation of the performance [33], the optimal location and setting of PRVs on the WDN [34], including the cost analysis of the implementation [35]. The first reference for the use of this type of valve found in the literature dates from 1879 [36]. Currently, the latest research on the use of these types of valves evaluates the balance between pressure reduction and water age inside the pipes and the potential impact on water quality [37]; the age of water in pipes increases as the pressure decreases. Performance under low flow conditions is also addressed in recent years in the literature [38]; at A flow below 0.7 L/s, PRVs tend to show unstable behavior.
While Chile has made a remarkable effort over the last decades to achieve a universal level of coverage in water supply, the country is still facing a huge challenge regarding NRW reduction [39]. The NRW in Chile is estimated at a value of 33–34% [40,41], with a total annual cost of 197 million USD [42]. Water loss is a major concern for the utilities in Chile since water scarcity problems and water use conflicts have arisen over the last years [43,44]. Despite the entire country of Chile having a large amount of water available on average, the country is in first position on the high-risk index of water stress in the world [45]. Water scarcity problems are most common in the central part of the country, where nearly 75% of the total population lives, due to great variability in rainfall patterns [46]. Since 2010, the central part of Chile has been undergoing an unprecedented mega-drought. It has been identified as the worst event in the last 700 years [47]. This mega-drought, which originated as a combination of exceptional climate events and anthropogenic force [48], is negatively impacting the society and the economy of the area [49]. Recent research forecasts that this drought will continue in the near future [50].
ESVAL is a privately owned Chilean water utility, the activity of which is concentrated in the central part of Chile. ESVAL provides drinking water and wastewater service for the vast majority of the Valparaiso and Coquimbo Region. The company supplies water to more than 650,000 customers through nearly 5000 km of pipes. ESVAL runs a sewage network of more than 3000 km [51]. As the central part of Chile is affected by a long drought, ESVAL put in place an aggressive program to reduce leakage and assure long-term water supply to their customers. PM has been one of the techniques employed in this program.
This paper aims to describe and evaluate the results of a PM installation conducted in La Calera city by evaluating the impact of the introduction of the advanced PM scheme on:
- Water saving by the analysis of the Minimum Night Flow (MNF) evolution between the initial situation and the proposed one.
- Evolution of the Total Daily Flow (TDF)
- Level of service to the customers by the evolution of the number of occurrences, the pressure in the critical point will be below the 15 m target set by ESVAL.
The result of this research proves that PM is an effective tool for achieving fast water savings in WDN. Over the last 20 years, 79 cities worldwide have been identified as suffering from drought conditions, including some of the largest megacities, such as Sao Paulo, Cape Town, and Los Angeles [52]. The application of advanced PM models similar to that exposed in this work can help to mitigate water scarcity challenges.
2. Materials and Methods
2.1. Description of Case Study Location
Chile represents an exceptional case in Latin America, where the drinking water and wastewater sector were mainly privatized since 1998 as an attempt to improve the efficiency of the systems. The water utilities are responsible for the construction and operation of the network and must recover the cost through the tariffs. The government-dependent body Superintendencia de Servicios Sanitarios (SISS), looks after the service provided by the utilities and sets the tariffs. Water consumption per capita since the beginning of the century has reduced by 25%. Currently, it is estimated as an average of 140 L per capita per day, presenting big differences between different locations [53].
Located in the Quillota province, Region V, Valparaiso, La Calera is a village in the central zone of Chile on the shores of the Aconcagua river with a population of around 49,000 inhabitants. It is 60 km east of Valparaiso city and 118 km west of the capital, Santiago. Figure 1 shows the study area location.
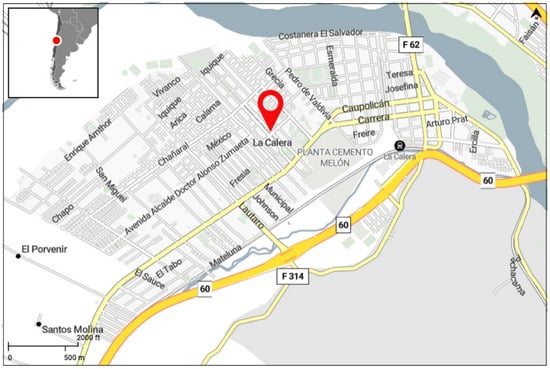
Figure 1.
Study area location.
La Calera city’s water loss was analyzed in detail by Sotomayor in 2012, estimating an NRW value of 47%. This author concluded in his report that losses in La Calera are due to physical losses [54]. This value is higher than other locations run by ESVAL, so it was chosen to implement an advanced pressure management scheme and evaluate the benefits. The advanced pressure management scheme is based on a model that relates the inlet flow versus the headloss between the outlet of the valve and the critical points. This approach is used to achieve maximum pressure reduction in the area while assuring the level of service to the customer, especially during peak demand [20].
The climate in La Calera is mainly Mediterranean, with four seasons well established, including a long dry season during the summer and a cold, wet winter. According to the information published by the Center for Climate and Resilience Research on the CR2 Climate Explorer website [55], the average rainfall in La Calera from 2000 to 2019, was 351 mm, with an average temperate of 15 °C; January is the hottest month and July the coldest.
As of the date of writing this document, Quillota province has been declared a water scarcity zone by the Chilean government [56].
2.2. WDN Description
The water supply in La Calera comes from two different sources: groundwater extractions located in the surrounding area of the city and water coming from the 55” 76 km Las Vegas pipeline transfer system, which supplies water to the Great Valparaiso area. At the inlet of the WDN of La Calera there is a DN300 globe type, diaphragm-actuated resilient disc seal pressure-reducing valve (PRV), which reduces upstream pressure to a steady, pre-determined and lower downstream pressure by introducing local energy losses. The PRV operates regardless of fluctuations in upstream pressure or rate of flow. DN300 PRV is shown in Figure 2.
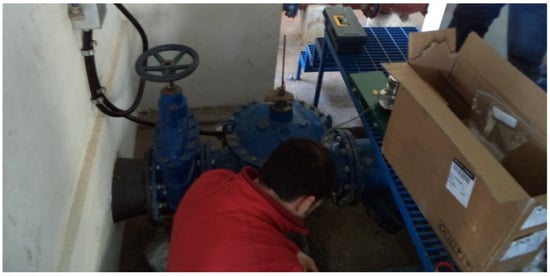
Figure 2.
DN300 PRV supplying water to La Calera city.
The WDN in La Calera is fully gravitational, with a total length of 86.6 km. The pipe sizes range from DN50 to DN300; with sizes below DN100 representing 55% of the total WDN. The main pipe material is asbestos, which represents 53% of the total length of the network. The second largest material in proportion is polyvinyl chloride, PCV, which amounts for 21%. Other materials such as cast iron, high-density polyethylene, HDPE, and galvanized steel appear in minor proportions. The percentage of each pipe material is shown in Figure 3. Asbestos pipes, which represent the highest proportion of the WDN, are among the oldest assets in many WDNs and are usually prone to high leakage rates [57].
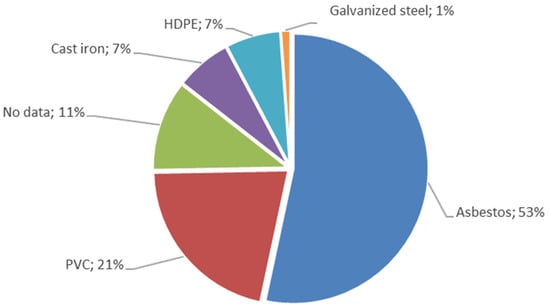
Figure 3.
La Calera WDN pipe materials.
2.3. Hydraulic Control Setup Description
The PRV at the inlet of La Calera is operated by a single hydromechanical diaphragm-actuated spring-loaded pressure-reducing pilot, which keeps a fixed pressure at the outlet of the valve. In parallel to this pilot, a remote electronic controller was installed to command the valve. This controller allows the pressure at the outlet of the valve to be adjusted dynamically as a function of the time or a flow signal coming from a flowmeter.
In order to avoid interactions between the two control trims of the valve, the connection of the existing hydromechanical pilot to the top chamber of the hydraulic valve was isolated using a 3/8” ball valve. In such a way, it can be assured that the valve was only commanded by the controller, without interference from the original control pilot.
The controller is reading simultaneous flow demanded in the La Calera area through a pulse output generated by a DN300 electromagnetic flowmeter located upstream of the PRV on the same line. Before starting all measurements, it was checked that the flowmeter was far enough from the PRV and that it was at least five times the size of the meter, according to the flowmeter technical specification, to avoid any disturbance on the flow readings.
The controller also includes two analog pressure sensors to read pressure upstream and downstream of the PRV. Both the flow and pressure were registered at a 15 min logging interval with a sampling rate of 10 s.
Because of the conditions of the WDN at La Calera, two critical points were identified in the network. A critical point is where the minimum pressure in the WDN is achieved [58]. For this case, the critical point changes from one place to another according to the time of the day due to the demand pattern of La Calera city. During the daylight period, the critical point is P3-1, while during the night, when the consumption is lower, the critical point is P3-2. It is assumed that if the minimum target pressure is achieved at the critical point, the rest of the points of the area will be above the target value. Two pressure loggers were installed at these two points, also with 15 min logging intervals and sampling rates of 10 s. The location of the PRV and the two critical points is shown in Figure 4. The legend includes the elevation of the points in brackets. The blue shaded area is fed by the DN300 PRV. P3-1 is located in one of the furthest points of the PRV, while P3-2 is placed close to a five-story building.
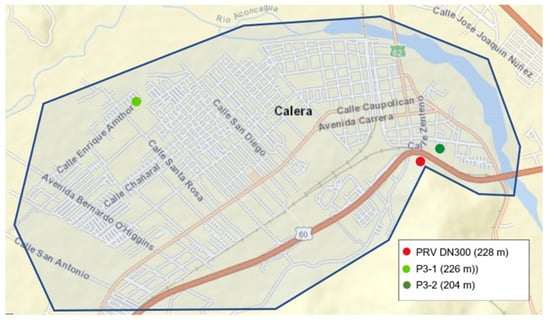
Figure 4.
Location of the PRV and the two critical points.
Below, Figure 5 shows the schematic of the installation and the methodology proposed for this study.
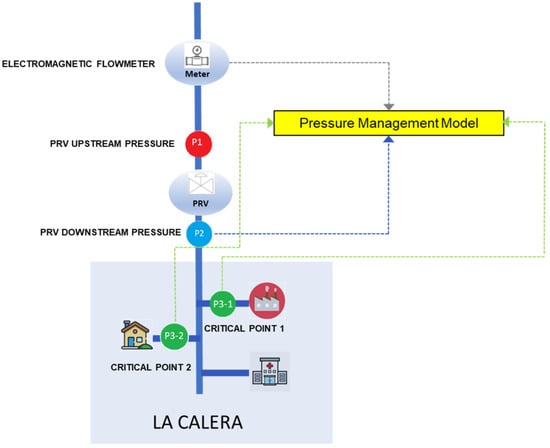
Figure 5.
Installation layout description and methodology proposed for this study.
The target of the trial is achieving 15 m at the critical point. Due to operational reasons, ESVAL proposed the following restrictions to be applied to the model:
- Working days, from Monday till Friday
- ○
- From 00:00 to 06:30, P2 cannot be lower than 18 m nor higher than 24 m.
- ○
- From 06:30 to 00:00, it cannot be lower than 20 m nor higher than 28 m
- Weekends, Saturday and Sunday:
- ○
- From 00:00 to 08:00, P2 cannot be lower than 18 m or higher than 24 m.
- ○
- Peak demand from 08:30 to 19:00, P2 cannot be lower than 20 m nor higher than 30 m.
- ○
- From 19:00 to 00:00, P2 cannot be lower than 20 m nor above 28.
The minimum pressure at the outlet of the valve is proposed to secure the level of service to the customers located just after the PRV. The maximum pressure restriction was proposed to avoid too much pressure in the network, which could generate the appearance of new bursts and breaks in the pipes.
2.4. Optimization Control Curve
The statistical software IBM SPSS25 has been used to obtain the mathematical model to control pressure at the outlet of the valve as a function of the flow demanded in the DMA with the target to keep a fixed pressure at the critical point. During the first 16 days of the installation, the system worked in a fixed outlet mode, mirroring the previous performance of the PRV. A total of 1536 data values have been used to build the model.
The first step in building the control model is outlier detection. For this purpose, the boxplot method was used, as it has been used by several authors in the literature. Hoaglin et al. conducted a study of the percentage of rejected values based on sample size [59]. Carling proposed an improvement in the use of box diagrams for data that do not conform to the Gaussian distribution, replacing quartiles with the median [60]. This method created a box chart showing the minimum value, the first quartile, the average, the third quartile, and the maximum value. Maximum and minimum values are obtained with the following equations:
Minimum = Q1 − 1.5·(Q3 − Q1)
Maximum = Q3 + 1.5·(Q3 − Q1)
The value (Q3 − Q1) is the difference between the third quartile and the first one. The maximum and minimum values are set with a 95% confidence interval for the median. If there are outliers, these will appear above or below the maximum or minimum values. The following figure shows box charts for each of the variables used to build the model. Figure 6a shows the variable flow, and Figure 6b shows the maximum value obtained from the pressure ratios for the two critical points.
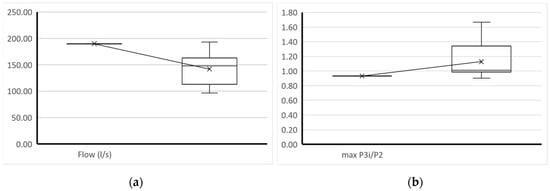
Figure 6.
Box charts used to build the model. (a) Variable flow. (b) The maximum value obtained from the pressure ratios for the two critical points.
None of the 1536 data points are considered outliers. The flow values range from 96.67 to 193.33, while P3i/P2 ranges from 0.9054 to 1.6840.
The regression study allows obtaining a model to relate the flow rate, independent variable, and the maximum value of the quotient between the pressures at the critical points and the pressure at the outlet of the reducing valve (P2), max (P3i/P2) dependent variable. With the selection of the maximum value of the ratio between the pressures, max (P3i/P2,) it is always ensured that the supply requirement at the sampled points is covered.
2.5. Minimum Night Flow and Total Daily Flow
The MNF is commonly used as an indicator to assess losses in WDN and can be used to differentiate between apparent losses and real losses [61]. The existing literature contains several references where the MNF is applied to evaluate the leakage status of a WDN [62]. It is defined as the lowest flow data coming into the supply during the whole 24 h of the day. Typically, for residential areas, this value tends to happen between 2:00 and 4:00 in the morning [10,63], when most of the people are sleeping, and inflow is mainly due to leakage. In this paper, the MNF is measured in L/s.
The TDF is the total amount of water supplied during each of the days of the trail. It will be measured in m3/day.
3. Results and Discussion
3.1. Optimization Model
Several models have been studied: linear, logarithmic, quadratic, potential and exponential. All the models have been obtained with a 95% confidence level. The selection of the best model is made according to the coefficient of determination and the significance level of the coefficients.
Table 1 displays the values of the coefficients and the standard error of each of the models, the generic equation of the model, and the coefficient of determination. In all models, the p-value is equal to 0.000.

Table 1.
Optimization model summary.
The quadratic model was chosen to be implemented for the control of the PRV. This choice is due, first, to the level of significance of each of the coefficients, which are lower than the threshold established at the beginning of the study, 0.05, the limit for the rejection of the null hypothesis and, secondly, to the value of the coefficient of determination (R2), 0.982, which is higher than for the rest of models.
3.2. Data Analysis
The project is split into two different phases, which are described in Figure 6 and Figure 7. Phase 1 corresponds to the original performance of the valve, working on a fixed outlet mode, and phase 2 shows the pressure and flow data when the advanced PM scheme is implemented on the valve. Despite the fact that it would have been ideal for showing all the data in the same graph, the authors decided to include two different graphs in order to be able to see all the information properly in a good manner, avoiding data overlay.
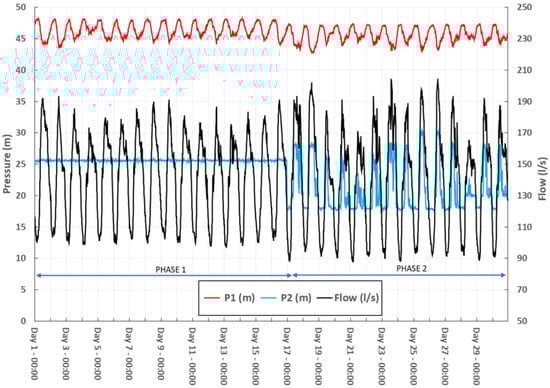
Figure 7.
Phase 1/phase2 flow and pressure at the inlet of La Calera.
Figure 7 displays the pressure and flow at the inlet of La Calera DMA. The red line is the pressure at the inlet of the PRV (P1). The blue line represents the pressure at the outlet of the PRV, the entrance of La Calera DMA (P2). The black line is the flow at the inlet of the DMA. Figure 8 shows the pressure at the two critical points of the DMA. It is represented by the two green lines (P3-1) and (P3-2). During the daytime, at peak demand, P3-2 is more restrictive than P3-1. On the other hand, during the night period, when the consumption is lower, P3-1 is lower than P3-2.
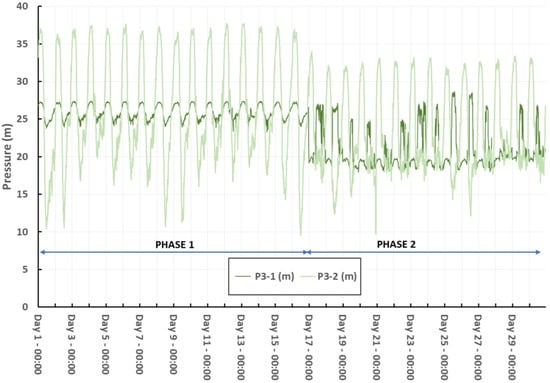
Figure 8.
Phase 1/phase2 La Calera critical pressure points evolution.
The flow follows the typical pattern of a domestic DMA, being lower during the night-time and increasing during the day. This demand pattern is recurrent for all days, as expected for domestic water-demand data [64].
During phase 1, P2 keeps a fixed value of 25.59 m at the outlet of the valve. The pressure at the critical points, P3-1 and P3-2, presents great variation. They are much higher during the night period when the demand is lower, and lower at peak demand when the inlet flow to the La Calera area is higher.
In phase 2, when the PM control model is implemented, P2 varies dynamically according to the demand and the restriction imposed by the optimization control scheme. As a result of this, the pressure in the critical points is reduced during the night period and increased during the day from the original situation. This generates leakage reduction during the night period and increases flow during the day.
The average, maximum and minimum pressure and flow during each of the phases for the different measuring points are summarized in Table 2.
Table 2.
Hydraulic data during the phases of the project.
3.3. Minimum Night Flow and Total Daily Flow
The analysis of the flow data during the 30 days of the project shows that 93.3% of the time, the absolute minimum night flow occurs between 02:00 and 05:00 in the morning. As a result, it was decided to calculate the MNF as the DMA inflow from 02:00 to 05:00 in the morning. Below, Table 3 shows the percentage of times the MNF happens at a determined time of the day.
Table 3.
MNF time occurrence.
The daily evolution of the MNF and TDF during the 30 days of measurement is shown in Figure 9.
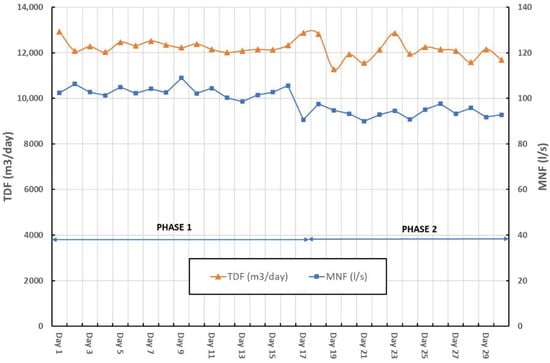
Figure 9.
MNF and TDF evolution.
Since the advanced PM scheme was introduced in the DMA on day 17, there was a reduction in the MNF as a consequence of the night pressure reduction. Despite the reduction in the night flow, TDF remains almost the same since the DMA pressure increases during the day to satisfy the existing demand and improve the level of service to the customers. Table 4 displays the average MNF and TDF during each of the phases.
Table 4.
Average MNF and TDF.
The above data shows how the network operating pressure has a direct impact on the leakage rate and also on water consumption. An MNF reduction of 10.12% against the initial situation is very similar to the results obtained by Fontana [65] on a WDN in Italy. This author also applied advanced PM over an existing PRV.
3.4. Level of Service
Figure 8 shows that the critical point pressure during phase 1 is below the target level of 15 m during some periods. Table 5 displays the number of times the pressure in each of the critical points is below the 15 m target in each of the phases.
Table 5.
Critical pressure point below target.
When the PRV is working in a fixed outlet mode, critical point P3-2 records 82 instances below the target level of 15 m. Over a period of 16 days, this represents 5.3% of the total time. When the advanced PM scheme is implemented, critical point P3-2 records 34 events below the target level. Since phase 2 lasted 14 days, this represents 2.5% of the total time. The introduction of the advanced PM scheme led to a reduction in events below target pressure and, consequently, an improvement in the level of service to the customers.
In order to reduce the number of cases where P3-2 is still below the target of 15 m, the model would need to increase the pressure at the outlet of the PRV during these moments. However, there is a restriction to avoid P2 values higher than 28 m during the weekdays and 30 m during the weekend to avoid excess pressure in the zone, which could generate bursts. It would be required to perform further analysis and simulation on the supply design of the area to avoid these low-pressure events.
The pressure reduction during the night period generates night flow reduction and thus leakage reduction. During the day, pressure is increased at some hours to satisfy demand, and the flow is larger. Figure 10 shows a phase 1/phase 2 comparison of the average hourly La Calera inflow. The graph clearly shows how the flow is reduced during the night period, while it is increased during the day.
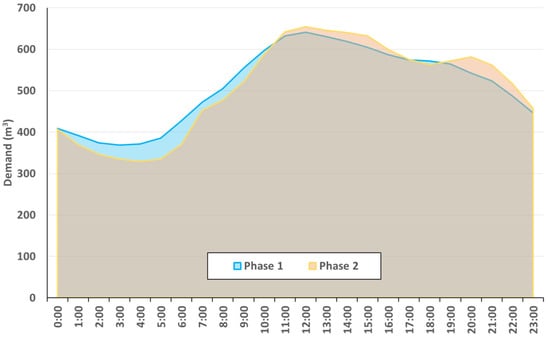
Figure 10.
Phase 1/phase 2 comparison of average hourly La Calera inflow.
4. Conclusions
This paper demonstrates how WDN can be optimized by advanced pressure management with immediate results. The performance of a traditional fixed-outlet PRV can be upgraded by an advanced control model to improve its performance and the benefits achieved on the WDN.
The main conclusions from this article are the following:
- A quadratic adjustment showed the best statistical approach between the inlet flow and the headloss between the outlet of the valve and the critical points. The model was constructed with 14 days of data of former valve performance, and it was implemented immediately after.
- Pressure reduction during the night period generates a 10.12% reduction in the MNF. Since MNF is accepted as an indicator of the leakage level, this result proves the water saving achieved in La Calera city.
- TDF in La Calera kept a similar value when comparing performance under the advanced control model and the original one. The advanced PM scheme allowed a reduction in the inlet flow during the night period but increased it during the peak demand time to better satisfy customer water needs. The reduction in the TDF is only 1.5%.
- Improvement of the level of service. Implementation of the model managed to increase pressure at peak demand to increase the level of service in the area. As a result, the number of events where the pressure in the area was below the target of 15 m was reduced by 52%.
- The advanced PM scheme permits a change in the demand pattern in La Calera, adjusting it to customer consumption needs.
- PM can be used as a fast tool to generate immediate results for leakage saving and level of service improvement. It is advisable to include it within a broader long-term approach that includes activities recommended by the IWA, such as Active Leakage Control, Speed and Quality of Repairs, and Infrastructure Management.
The new optimization model implemented on the valve should also generate a reduction in the burst frequency. It would be great to evaluate this information, but, unfortunately, no data are available. Furthermore, the evaluation of other benefits identified in the literature related to PM, such as asset life extension and reduction of CO2, would be desirable to analyze in future research.
Author Contributions
Conceptualization, A.O.-B., F.I.-B., D.M.-R. and A.-J.P.-M.; investigation, A.O.-B., F.I.-B., D.M.-R. and A.-J.P.-M.; resources, A.O.-B., F.I.-B., D.M.-R. and A.-J.P.-M.; writing—original draft preparation A.O.-B., F.I.-B., D.M.-R. and A.-J.P.-M. All authors have read and agreed to the published version of the manuscript.
Funding
This research received no external funding.
Institutional Review Board Statement
Not applicable.
Informed Consent Statement
Not applicable.
Acknowledgments
The authors would like to thank ESVAL water utility for their contribution, criticism, and support in materializing this paper.
Conflicts of Interest
The authors declare no conflict of interest.
Abbreviations
The following abbreviations have been used in this document:
| DMA | District Metered Area |
| DN | Nominal Diameter |
| HDPE | High-density polyethylene |
| IWA | International Water Association |
| MNF | Minimum Night Flow |
| NRW | Non-Revenue Water |
| P1 | Pressure at the inlet of the pressure-reducing valve |
| P2 | Pressure at the outlet of the pressure-reducing valve |
| P3-1 | Critical point 1 |
| P3-2 | Critical point 2 |
| PM | Pressure management |
| PRV | Pressure reducing valve |
| PVC | Polyvinyl chloride |
| TDF | Total Daily Flow |
| WDN | Water distribution network |
References
- Ortega-Ballesteros, A.; Manzano-Agugliaro, F.; Perea-Moreno, A.-J. Water Utilities Challenges: A Bibliometric Analysis. Sustainability 2021, 13, 7726. [Google Scholar] [CrossRef]
- Erban, L.E.; Walker, H.A. Beyond Old Pipes and Ailing Budgets: Systems Thinking on Twenty-First Century Water Infrastructure in Chicago. Front. Built Environ. 2019, 5, 124. [Google Scholar] [CrossRef] [PubMed]
- AL-Washali, T.; Sharma, S.; Kennedy, M. Methods of Assessment of Water Losses in Water Supply Systems: A Review. Water Resour. Manag. 2016, 30, 4985–5001. [Google Scholar] [CrossRef]
- Monsef, H.; Naghashzadegan, M.; Farmani, R.; Jamali, A. Pressure management in water distribution systems in order to reduce energy consumption and background leakage. J. Water Supply 2018, 67, 397–403. [Google Scholar] [CrossRef]
- Collins, R.; Boxall, J. Influence of Ground Conditions on Intrusion Flows through Apertures in Distribution Pipes. J. Hydraul. Eng. 2013, 139, 1052–1061. [Google Scholar] [CrossRef]
- Fontanazza, C.M.; Notaro, V.; Puleo, V.; Nicolosi, P.; Freni, G. Contaminant Intrusion through Leaks in Water Distribution System: Experimental Analysis. Procedia Eng. 2015, 119, 426–433. [Google Scholar] [CrossRef]
- Allen, M.; Clark, R.; Cotruvo, J.A.; Grigg, N. Drinking Water and Public Health in an Era of Aging Distribution Infrastructure. Public Work. Manag. Policy 2018, 23, 301–309. [Google Scholar] [CrossRef]
- Trow, S.; Farley, M. Developing a strategy for leakage management in water distribution systems. Water Sci. Technol. Water Supply 2004, 4, 149–168. [Google Scholar] [CrossRef]
- Kanakoudis, V.; Tsitsifli, S. Water Networks Management: New Perspectives. Water 2019, 11, 239. [Google Scholar] [CrossRef]
- Thornton, J.; Sturm, R.; Kunke, G. Water Loss Control, 2nd ed.; Mc-Graw Hill: New York, NY, USA, 2008. [Google Scholar] [CrossRef]
- Lambert, A. What do we know about pressure/leakage relationships in distribution systems? In Proceedings of the IWA Specialised Conference, System Approach to Leakage Control and Water Distribution Systems Management, Brno, Czech Republic, 16–18 May 2001. [Google Scholar]
- Garzón, F.; Thornton, J. Nfluencia de la presión en las pérdidas de agua en sistemas de distribución. In Proceedings of the Trabajo Presentado en el XXX Congreso Interamericano de Ingeniería Sanitaria y Ambiental, Punta del Este, Uruguay, 26–30 November 2006. [Google Scholar]
- Van Zyl, J.E.; Cassa, A.M. Modeling elastically deforming leaks in water distribution pipes. J. Hydraul. Eng. 2014, 140, 182–189. [Google Scholar] [CrossRef]
- Greyvenstein, B.; Van Zyl, J.E. An experimental investigation into the pressure-leakage relationship of some failed water pipes. J. Water Supply Res. Technol. 2007, 56, 117–124. [Google Scholar] [CrossRef]
- Jara-Arriagada, C.; Stoianov, I. Pipe breaks and estimating the impact of pressure control in water supply networks. Reliab. Eng. Syst. Saf. 2021, 210, 107525. [Google Scholar] [CrossRef]
- Garmendia, M.; Almandoz, J.; Arrizabalaga, A.; Arregui, F. Pressure management and residential consumption reduction. Water Supply 2019, 19, 236–244. [Google Scholar] [CrossRef]
- Parra, S.; Krause, S.; Krönlein, F.; Günthert, F.W.; Klunke, T. Intelligent pressure management by pumps as turbines in water distribution systems: Results of experimentation. Water Supply 2018, 18, 778–789. [Google Scholar] [CrossRef]
- Dimaano, I. Effort in reducing unaccountable water and economic consideration. Water Pract. Technol. 2015, 10, 50–58. [Google Scholar] [CrossRef]
- Wyatt, A. Case Study: Performance-Based Contract for NRW Reduction and Control -New Providence, Bahamas; Technical Note No. IDB-TN-813; Inter-American Development Bank, Water and Sanitation Division: Washington, DC, USA, 2018. [Google Scholar]
- EU Reference Document Good Practices on Leakage Management WFD CIS WG PoM; European Union: Maastricht, The Netherlands, 2015; ISBN 978-92-79-45069-3. Available online: https://circabc.europa.eu/sd/a/1ddfba34-e1ce-4888-b031-6c559cb28e47/Good%20Practices%20on%20Leakage%20Management%20-%20Main%20Report_Final.pdf (accessed on 21 March 2022).
- Vicente, D.J.; Garrote, L.; Sánchez, R.; Santillán, D. Pressure Management in Water Distribution Systems: Current Status, Proposals, and Future Trends. J. Water Resour. Plan. Manag. 2016, 142, 04015061. [Google Scholar] [CrossRef]
- Javanmard, M.E.; Ghaderi, S.; Sangari, M.S. Integrating energy and water optimization in buildings using multi-objective mixed-integer linear programming. Sustain. Cities Soc. 2020, 62, 102409. [Google Scholar] [CrossRef]
- Ortega-Ballesteros, A.; Muñoz-Rodríguez, D.; Perea-Moreno, A.-J. Advances in Leakage Control and Energy Consumption Optimization in Drinking Water Distribution Networks. Energies 2022, 15, 5484. [Google Scholar] [CrossRef]
- Gupta, A.D.; Bokde, N.; Marathe, D.; Kulat, K. Optimization techniques for leakage management in urban water distribution networks. Water Sci. Technol. Water Supply 2017, 17, 1638–1652. [Google Scholar] [CrossRef]
- Dai, P.D.; Cuong, L.Q.; Van Dai, B. Optimal Pump Scheduling to Pressure Management for Large-Scale Water Distribution Systems. In 2017—Recent Advances in Electrical Engineering and Related Sciences: Theory and Application; Duy, V., Dao, T., Zelinka, I., Kim, S., Phuong, T., Eds.; AETA AETA 2017; Lecture Notes in Electrical Engineering; Springer: Cham, Switzerland, 2018; Volume 465. [Google Scholar] [CrossRef]
- Giustolisi, O.; Laucelli, D.; Berardi, L. Operational Optimization: Water Losses versus Energy Costs. J. Hydraul. Eng. 2013, 139, 410–423. [Google Scholar] [CrossRef]
- Tricarico, C.; Morley, M.S.; Gargano, R.; Kapelan, Z.; Savić, D.; Santopietro, S.; Granata, F.; de Marinis, G. Optimal energy recovery by means of pumps as turbines (PATs) for improved WDS management. Water Supply 2018, 18, 1365–1374. [Google Scholar] [CrossRef]
- Chatzivasili, S.; Papadimitriou, K.; Kanakoudis, V. Optimizing the Formation of DMAs in a Water Distribution Network through Advanced Modelling. Water 2019, 11, 278. [Google Scholar] [CrossRef]
- Khoa Bui, X.; Marlim, M.S.; Kang, D. Water Network Partitioning into District Metered Areas: A State-Of-The-Art Review. Water 2020, 12, 1002. [Google Scholar] [CrossRef]
- Huang, Y.; Zheng, F.; Kapelan, Z.; Savic, D.; Duan, H.F.; Zhang, Q. Efficient leak localization in water distribution systems using multistage optimal valve operations and smart demand metering. Water Resour. Res. 2020, 56, e2020WR028285. [Google Scholar] [CrossRef]
- Latifi, M.; Naeeni, S.T.; Gheibi, M.A. Upgrading the reliability of water distribution networks through optimal use of pressure-reducing valves. J. Water Resour. Plan. Manag. 2018, 144, 04017086. [Google Scholar] [CrossRef]
- Mosetlhe, T.C.; Hamam, Y.; Du, S.; Monacelli, E. A Survey of Pressure Control Approaches in Water Supply Systems. Water 2020, 12, 1732. [Google Scholar] [CrossRef]
- García-Ávila, F.; Avilés-Añazco, A.; Ordoñez-Jara, J.; Guanuchi-Quezada, C.; Flores del Pino, L.; Ramos-Fernández, L. Pressure management for leakage reduction using pressure reducing valves. Case study in an Andean city. Alex. Eng. J. 2019, 58, 1313–1326. [Google Scholar] [CrossRef]
- Araujo, L.S.; Ramos, H.; Coelho, S.T. Pressure Control for Leakage Minimisation in Water Distribution Systems Management. Water Resour. Manag. 2006, 20, 133–149. [Google Scholar] [CrossRef]
- Gomes, R.; Sá Marques, A.; Sousa, J. Identification of the optimal entry points at District Metered Areas and implementation of pressure management. Urban Water J. 2012, 9, 365–384. [Google Scholar] [CrossRef]
- Mateos de Vicente, M. Válvulas Reductoras de Presión. Clasificación, Descripción, Errores Y Soluciones; Librería y Editorial Técnica: Madrid, Spain, 2001; ISBN 84-95279-40-1. [Google Scholar]
- Patelis, M.; Kanakoudis, V.; Kravvari, A. Pressure Regulation vs. Water Aging in Water Distribution Networks. Water 2020, 12, 1323. [Google Scholar] [CrossRef]
- Marsili, V.; Zarbo, R.; Alvisi, S.; Franchini, M. Laboratory Analysis of a Piston-Actuated Pressure-Reducing Valve under Low Flow Conditions. Water 2020, 12, 940. [Google Scholar] [CrossRef]
- Ferro, G.; Mercadier, A.C. Technical efficiency in Chile′s water and sanitation providers. Util. Policy 2016, 43, 97–106. [Google Scholar] [CrossRef]
- Market, G.W. Meeting the World’s Water and Wastewater Needs until 2020; Global Water Intelligence: Oxford, UK, 2017; Volume 1. [Google Scholar]
- Informe de Gestión del Sector Sanitario. 2020. Available online: https://www.siss.gob.cl/586/articles-19431_recurso_1.pdf (accessed on 4 January 2022).
- Liemberger, R. Quantifying the Global Non-Revenue Water Problem. Water Sci. Technol. Water Supply 2018, 19, 831–837. Available online: https://iwaponline.com/ws/article/19/3/831/41417/Quantifying-the-global-non-revenue-water-problem (accessed on 30 January 2022). [CrossRef]
- Rivera, D.; Godoy-Faúndez, A.; Lillo, M.; Costumero, R.; García-Pedrero, Á. Legal disputes as a proxy for regional conflicts over water rights in Chile. J. Hydrol. 2016, 535, 36–45. [Google Scholar] [CrossRef]
- Bórquez, R.; Fuster, R. Energy and Water Policies in Chile, Two Different Endings with Implications in the Water-Energy Nexus. Energies 2021, 14, 3286. [Google Scholar] [CrossRef]
- National Water Stress Ranking. Available online: www.wri.org/blog/2019/08/17-countries-home-one-quarter-world-population-face-extremely-high-water-stress (accessed on 4 January 2022).
- Lajaunie, M.-L.; Scheierling, S.; Zuleta, J.; Chinarro, L.; Vazquez, V. Diagnóstico de la Gestión de los Recursos Hídricos (Spanish); World Bank Group: Washington, DC, USA, 2011; Available online: http://documents.worldbank.org/curated/en/452181468216298391/Chile-Diagn-243-stico-de-la-gesti-243-n-de-los-recursos-h-237-dricos (accessed on 2 July 2022).
- Muñoz, A.A.; Klock-Barría, K.; Alvarez-Garreton, C.; Aguilera-Betti, I.; González-Reyes, Á.; Lastra, J.A.; Chávez, R.O.; Barría, P.; Christie, D.; Rojas-Badilla, M.; et al. Water Crisis in Petorca Basin, Chile: The Combined Effects of a Mega-Drought and Water Management. Water 2020, 12, 648. [Google Scholar] [CrossRef]
- Garreaud, R.D.; Boisier, J.P.; Rondanelli, R.; Montecinos, A.; Sepúlveda, H.H.; Veloso-Aguila, D. The central Chile mega drought (2010–2018): A climate dynamics perspective. Int. J. Climatol. 2020, 40, 421–439. [Google Scholar] [CrossRef]
- Aldunce, P.; Araya, D.; Sapiain, R.; Ramos, I.; Lillo, G.; Urquiza, A.; Garreaud, R. Local Perception of Drought Impacts in a Changing Climate: The Mega-Drought in Central Chile. Sustainability 2017, 9, 2053. [Google Scholar] [CrossRef]
- Fuentes, I.; Fuster, R.; Avilés, D.; Vervoort, W. Water scarcity in central Chile: The effect of climate and land cover changes on hydrologic resources. Hydrol. Sci. J. 2021, 66, 1028–1044. [Google Scholar] [CrossRef]
- Memoria ESVAL. Available online: https://www.ESVAL.cl/media/l4cbiu3d/memoria-anual-ESVAL-2020-%C3%BAltima.pdf (accessed on 20 January 2022).
- Zhang, X.; Chen, N.; Sheng, H.; Ip, C.; Yang, L.; Chen, Y.; Sang, Z.; Tadesse, T.; Lim, T.P.Y.; Rajabifard, A.; et al. Urban drought challenge to 2030 sustainable development goals. Sci. Total Environ. 2019, 693, 133536. [Google Scholar] [CrossRef]
- Donoso, G. Chile. In ‘Global Issues in Water Policy’ Series; Springer: Berlin/Heidelberg, Germany, 2018; 224p, ISBN 978-3-319-76701-7. [Google Scholar]
- Sotomayor Abarzúa, G. Optimización de los Sistemas de Producción, Transferencia y Distribución de Agua Potable en la Localidad de la Calera; Universidad Técnica Federico Santa María: Valparaiso, Chile, 2012. [Google Scholar]
- Center for Climate and Resilience Research. Available online: https://www.cr2.cl/eng/ (accessed on 10 January 2022).
- Dirección General de Agua. Decretos Declaración Zona de Escasez Vigentes. Available online: https://dga.mop.gob.cl/administracionrecursoshidricos/decretosZonasEscasez/Paginas/default.aspx (accessed on 20 January 2022).
- Davis, P.; Silva, D.D.; Marlow, D.; Moglia, M.; Gould, S.; Burn, S. Failure prediction and optimal scheduling of replacements in asbestos cement water pipes. J. Water Supply Res. Technol. Aqua 2008, 57, 239–252. [Google Scholar] [CrossRef]
- McKenzie, R.; Wegelin, W. Implementation of Pressure Management in Municipal Water Supply Systems; IWA Water Press: London, UK, 2009. [Google Scholar]
- Hoaglin, D.C.; Iglewicz, B.; Tukey, J.W. Performance of some resistant rules for outlier labeling. J. Amer. Statist. Assoc. 1986, 81, 991–999. [Google Scholar] [CrossRef]
- Carling, K. Resistant outlier rules and the non-Gaussian case. Comput. Statist. Data Anal. 2000, 33, 249–258. [Google Scholar] [CrossRef]
- Oviedo-Ocaña, E.R.; Dominguez, I.C.; Celis, J.; Blanco, L.C.; Cotes, I.; Ward, S.; Kapelan, Z. Water-loss management under data scarcity: Case study in a small municipality in a developing country. J. Water Resour. Plan. Manag. 2020, 146, 05020001. [Google Scholar] [CrossRef]
- Marzola, I.; Alvisi, S.; Franchini, M. Minimum Night Flow Analysis and Application of the Fixed and Variable Area Discharges Model for Characterizing Leakage in the Gorino Ferrarese (FE-Italy) District. Environ. Sci. Proc. 2020, 2, 2008. [Google Scholar] [CrossRef]
- Lambert, A. Water Losses Management and Techniques, 1st ed.; Water Supply, IWA Publishing: London, UK, 2002; Volume 2, pp. 1–20. [Google Scholar]
- Alvisi, S.; Franchini, M.; Marinelli, A. A short-term, pattern-based model for water-demand forecasting. J. Hydroinform. 2007, 9, 39–50. [Google Scholar] [CrossRef]
- Fontana, N.; Giugni, M.; Glielmo, L.; Marini, G.; Zollo, R. Real-time control of pressure for leakage reduction in water distribution network: Field experiments. J. Water Resour. Plan. Manag. 2018, 144, 04017096. [Google Scholar] [CrossRef]
Publisher’s Note: MDPI stays neutral with regard to jurisdictional claims in published maps and institutional affiliations. |
© 2022 by the authors. Licensee MDPI, Basel, Switzerland. This article is an open access article distributed under the terms and conditions of the Creative Commons Attribution (CC BY) license (https://creativecommons.org/licenses/by/4.0/).