


Assessment of Arsenic Contamination in Groundwater and Associated Human Health Risk

 ,
,  , , ,
, , ,  , and
, and
Abstract
:1. Introduction
2. Materials and Methods
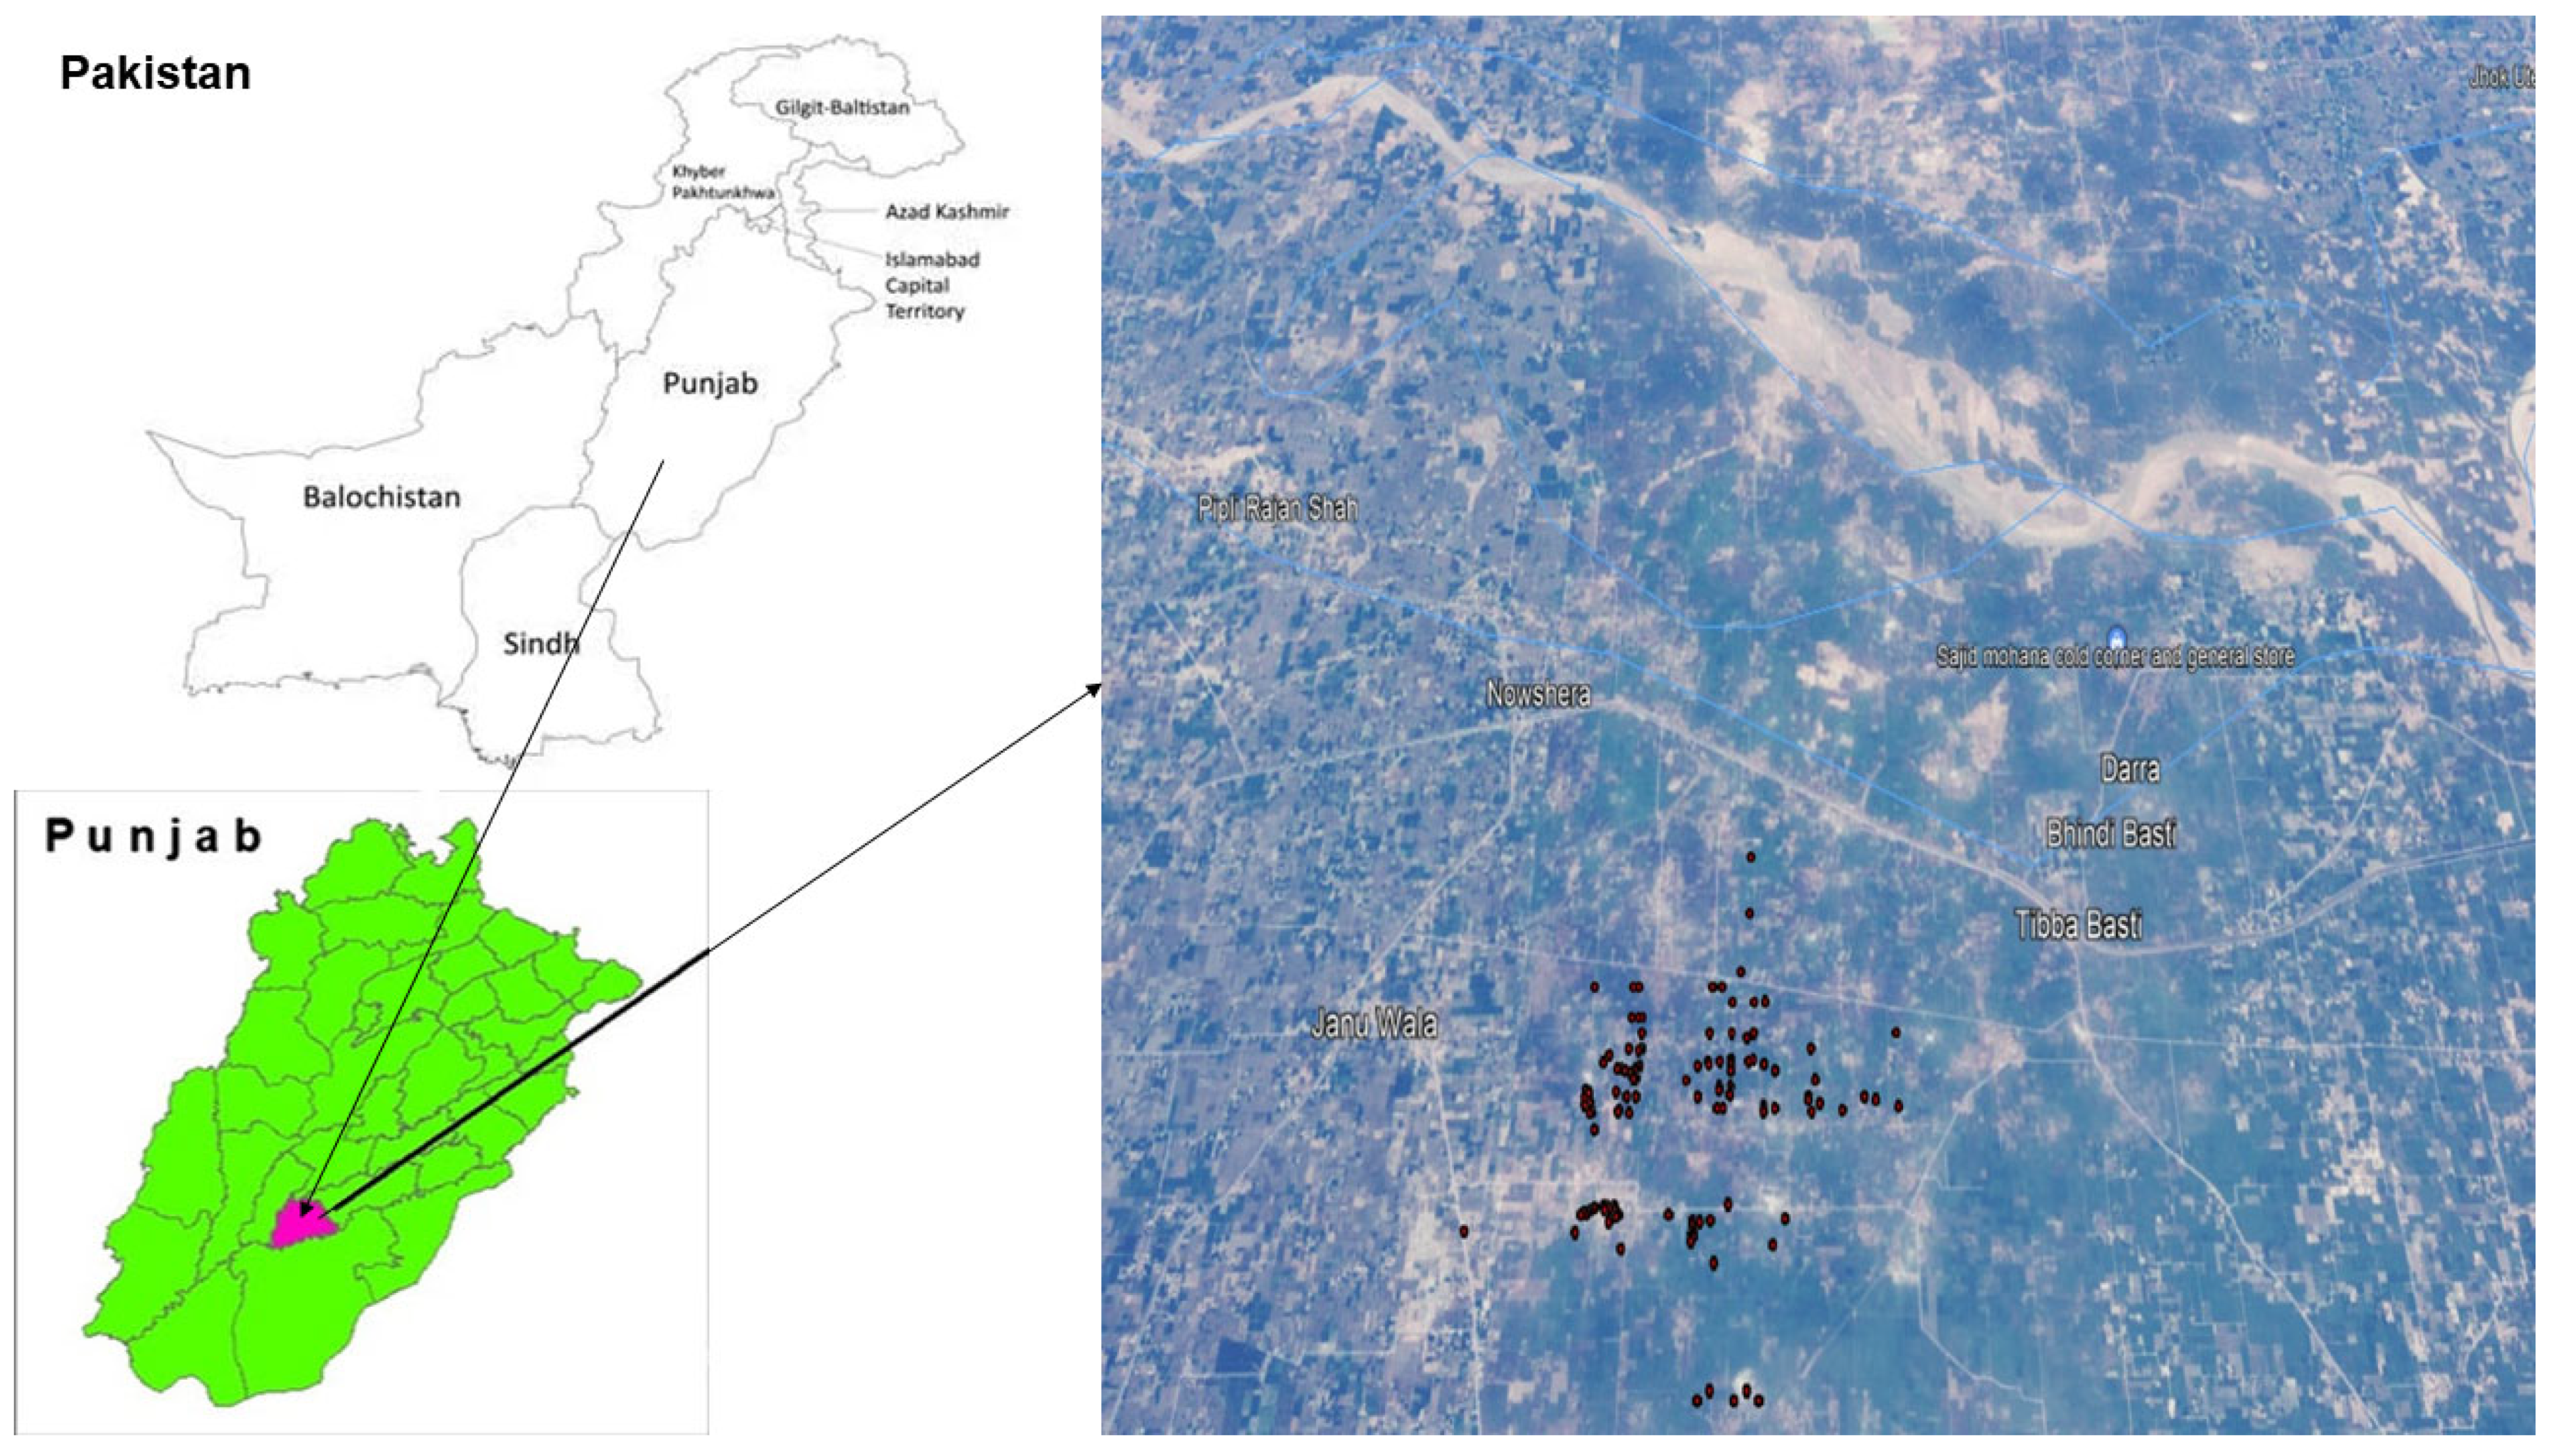
2.1. Description of the Area
2.2. Groundwater Sampling
2.3. Sample Preservation and Quality Assurance
2.4. Analytical Procedures
2.5. Metal’s Analysis
2.6. Human Health Risk Assessment
- ED = exposure duration (assumed to be 10 and 18 for children and adolescent, respectively, and 67 years each for male and female, which is comparable with earlier studies from Pakistan and other countries),
- C = arsenic concentration in water (µg L−1),
- IR = ingestion rate of water (L day−1),
- EF = exposure frequency (365 days year−1),
- AT = average lifetime (24,495 days) and
- BW = body weight (13 for children, 28 for adolescents, 72 for male and 53 for female in kgs) [37].
2.7. Statistical Analysis
2.8. Geographic Information System (GIS) Analysis
3. Results
3.1. Correlation between the Studied Parameters
3.2. Health Risk Assessment of Arsenic
4. Discussion
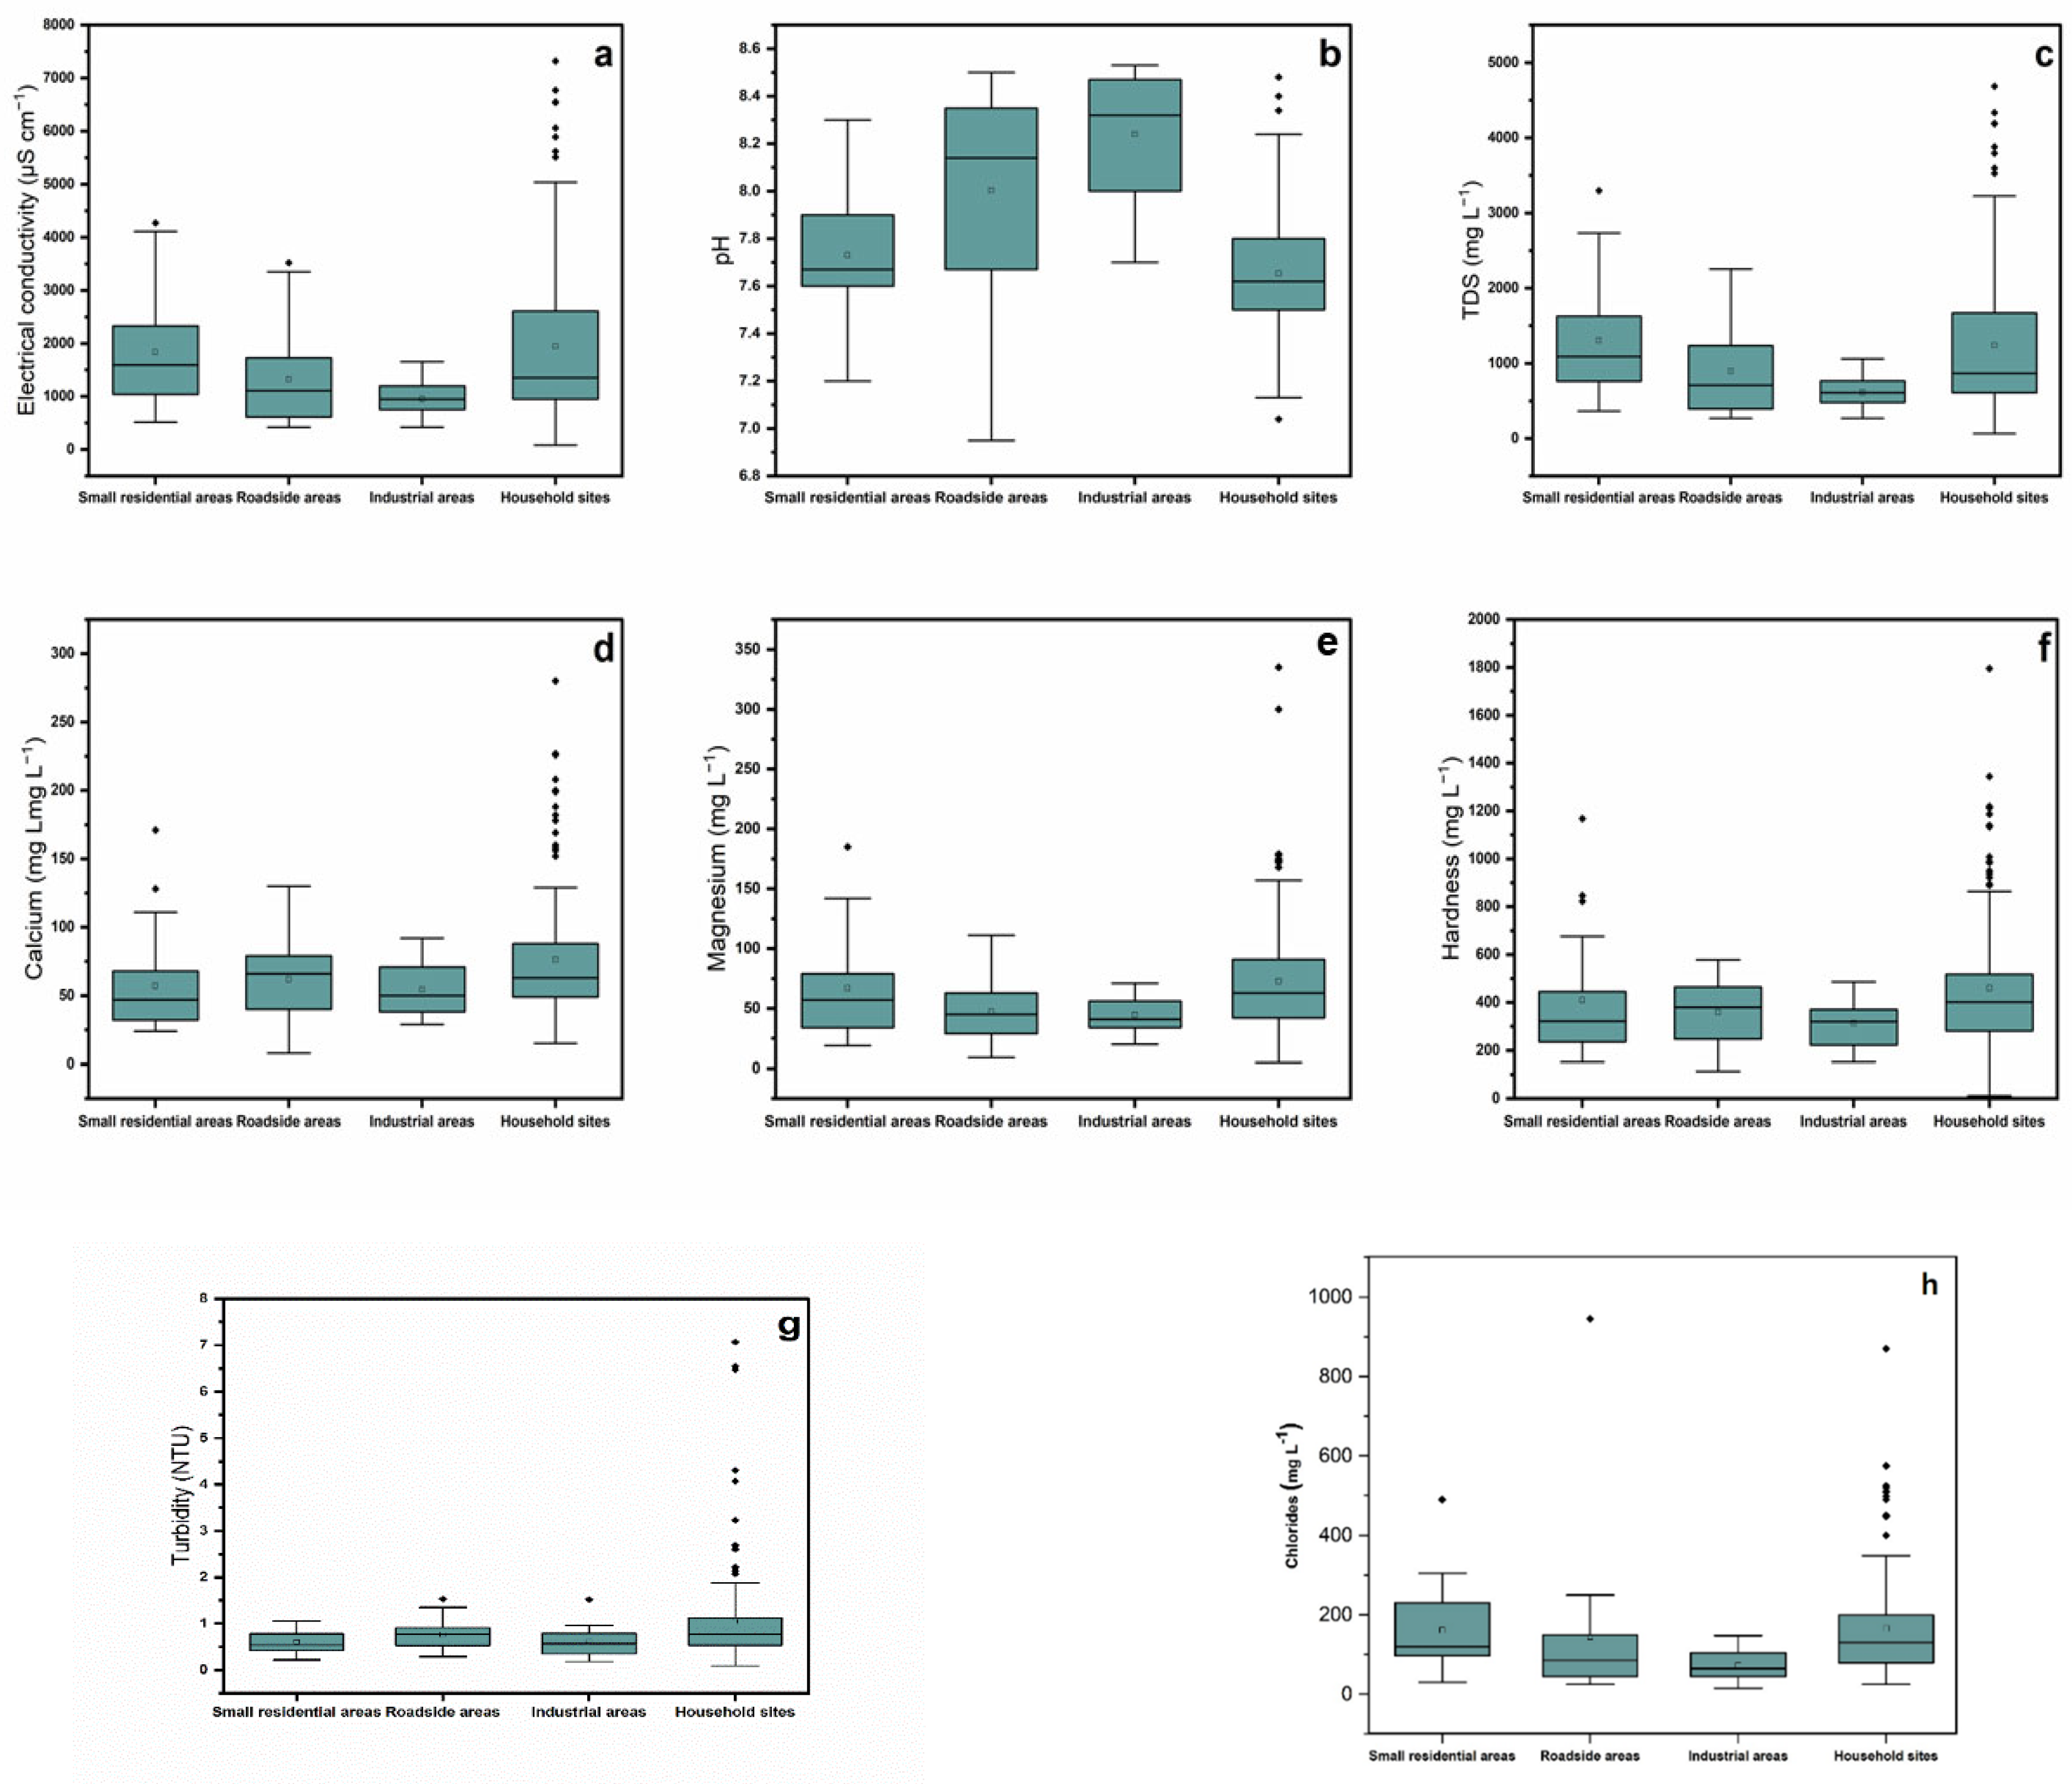
4.1. Physico-Chemical Characteristics of Groundwater
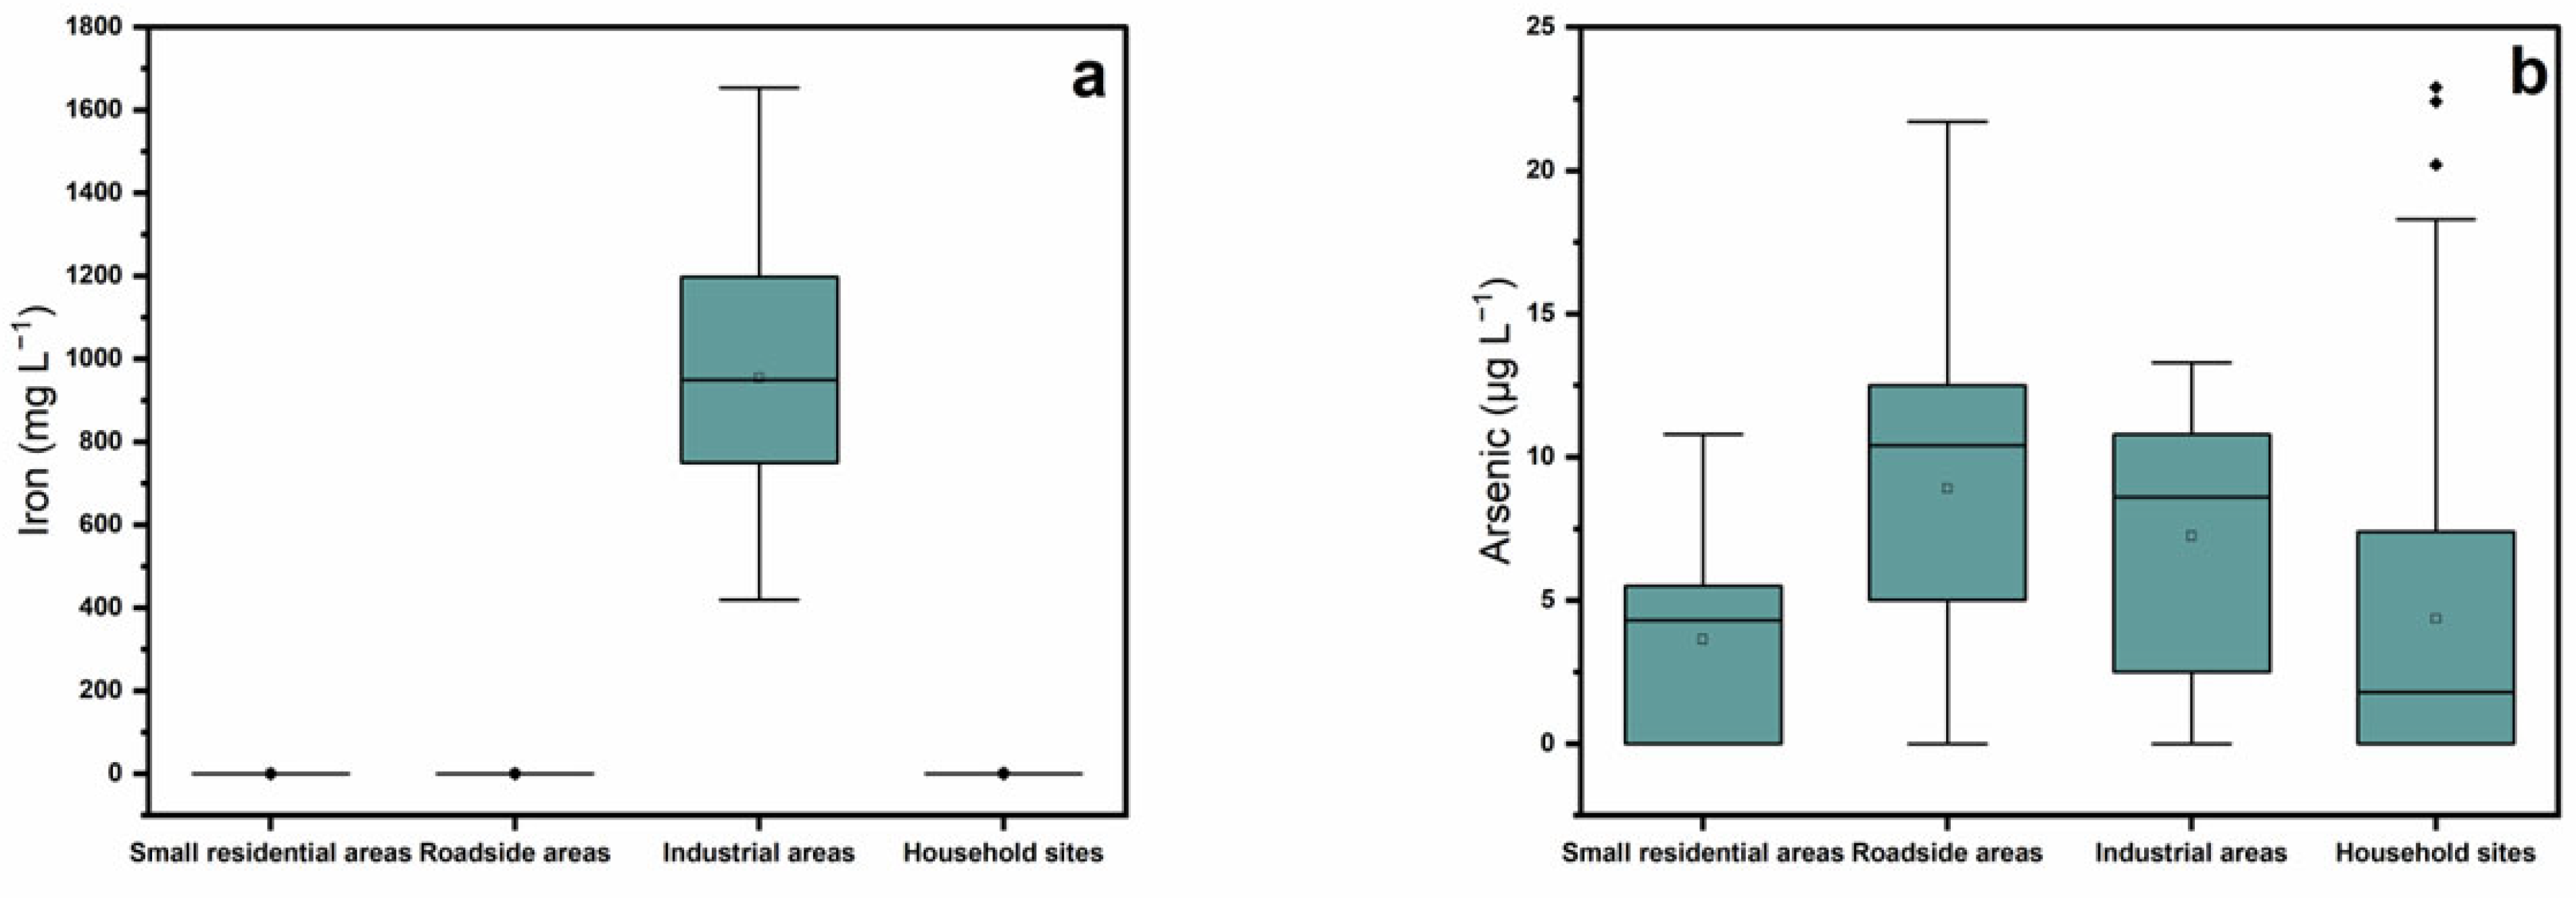
4.2. Metals (As and Fe) Concentration in Groundwater
4.3. Health Risk Assessment of As-Contaminated Water Consumption
5. Conclusions
- To overcome the groundwater contamination with anion and cations, the outdated sewerage system needs to be renovated/repaired, since seepage of wastewater into the groundwater and consequential contamination is largely attributed to wear and tear of an aged sewage treatment system.
- Water filtration plants at large scales and local scale filtration technologies should be adopted for arsenic and other metals removal from ground/drinking water.
- Proper management of wastewater and solid wastes is necessary to avoid groundwater pollution.
- Water And Sanitation Agencies (WASA) across Pakistan should comply with the WHO standards for drinking water and supply clean drinking water to the areas affected by As pollution.
- WASA should properly monitor the groundwater quality in rural areas to avoid health risks associated with As-contaminated water used for drinking purposes.
Author Contributions
Funding
Institutional Review Board Statement
Informed Consent Statement
Data Availability Statement
Acknowledgments
Conflicts of Interest
References
- Jackson, R.B.; Carpenter, S.R.; Dahm, C.N.; McKnight, D.M.; Naiman, R.J.; Postel, S.L.; Running, S.W. Water in a changing world. Ecol. Appl. 2001, 11, 1027–1045. [Google Scholar] [CrossRef]
- Khan, N.I.; Bruce, D.; Naidu, R.; Owens, G. Implementation of food frequency questionnaire for the assessment of total dietary arsenic intake in Bangladesh: Part B, preliminary findings. Environ. Geochem. Health 2009, 31, 221–238. [Google Scholar] [CrossRef] [PubMed]
- Khan, N.I.; Owens, G.; Bruce, D.; Naidu, R. An effective dietary survey framework for the assessment of total dietary arsenic intake in Bangladesh: Part-A—FFQ design. Environ. Geochem. Health 2009, 31, 207–220. [Google Scholar] [CrossRef] [PubMed]
- Hughes, M.F. Arsenic toxicity and potential mechanisms of action. Toxicol. Lett. 2002, 133, 1–16. [Google Scholar] [CrossRef]
- World Health Organization. Lead in Drinking-Water: Background Document for Development of WHO Guidelines for Drinking-Water Quality; No. WHO/SDE/WSH/03.04/09; World Health Organization: Geneva, Switzerland, 2003.
- Jiang, J.-Q.; Ashekuzzaman, S.; Jiang, A.; Sharifuzzaman, S.; Chowdhury, S.R. Arsenic contaminated groundwater and its treatment options in Bangladesh. Int. J. Environ. Res. Public Health 2013, 10, 18–46. [Google Scholar] [CrossRef] [PubMed]
- Ahmad, S.A.; Khan, M.H.; Haque, M. Arsenic contamination in groundwater in Bangladesh: Implications and challenges for healthcare policy. Risk Manag. Health Policy 2018, 11, 251–261. [Google Scholar] [CrossRef] [PubMed]
- Raessler, M. The arsenic contamination of drinking and groundwaters in Bangladesh: Featuring biogeochemical aspects and implications on public health. Arch. Environ. Contam. Toxicol. 2018, 75, 1–7. [Google Scholar] [CrossRef] [PubMed]
- Richards, L.A.; Casanueva-Marenco, M.J.; Magnone, D.; Sovann, C.; van Dongen, B.E.; Polya, D.A. Contrasting sorption behaviours affecting groundwater arsenic concentration in Kandal Province, Cambodia. Geosci. Front. 2019, 10, 1701–1713. [Google Scholar] [CrossRef]
- Li, Z.; Yang, Q.; Yang, Y.; Xie, C.; Ma, H. Hydrogeochemical controls on arsenic contamination potential and health threat in an intensive agricultural area, northern China. Environ. Pollut. 2020, 256, 113455. [Google Scholar] [CrossRef]
- Ravindra, K.; Mor, S. Distribution and health risk assessment of arsenic and selected heavy metals in Groundwater of Chandigarh, India. Environ. Pollut. 2019, 250, 820–830. [Google Scholar] [CrossRef]
- Liu, C.-W.; Wu, M.-Z. Geochemical, mineralogical and statistical characteristics of arsenic in groundwater of the Lanyang Plain, Taiwan. J. Hydrol. 2019, 577, 123975. [Google Scholar] [CrossRef]
- Nguyen, T.P.M.; Nguyen, T.P.T.; Bui, T.H.; Nguyen, T.H. Concentration of arsenic in groundwater, vegetables, human hair and nails in mining site in the Northern Thai Nguyen province, Vietnam: Human exposure and risks assessment. Hum. Ecol. Risk Assess. Int. J. 2019, 25, 602–613. [Google Scholar] [CrossRef]
- Shaji, E.; Santosh, M.; Sarath, K.; Prakash, P.; Deepchand, V.; Divya, B. Arsenic contamination of groundwater: A global synopsis with focus on the Indian Peninsula. Geosci. Front. 2021, 12, 101079. [Google Scholar] [CrossRef]
- Farooqi, Z.U.R. Groundwater pollutants and their impacts on human health and possible remediation approaches: A review. Plant Environ. 2020, 1, 1–23. [Google Scholar]
- Patil, P.; Badgujar, S.; Warke, A. Evaluation of Ground water quality in Ganesh Colony area of Jalgaon city. Orient. J. Chem. 2001, 17, 283–286. [Google Scholar]
- Szatyłowicz, E.; Skoczko, I. Studies on the Efficiency of Groundwater Treatment Process with Adsorption on Activated Alumina. J. Ecol. Eng. 2017, 18, 211–218. [Google Scholar] [CrossRef]
- Szatyłowicz, E.; Skoczko, I. The Use of Activated Alumina and Magnetic Field for the Removal Heavy Metals from Water. J. Ecol. Eng. 2018, 19, 61–67. [Google Scholar] [CrossRef]
- Daud, M.; Nafees, M.; Ali, S.; Rizwan, M.; Bajwa, R.A.; Shakoor, M.B.; Arshad, M.U.; Chatha, S.A.S.; Deeba, F.; Murad, W. Drinking water quality status and contamination in Pakistan. BioMed Res. Int. 2017, 2017, 7908183. [Google Scholar] [CrossRef]
- Stollenwerk, K.G. Geochemical Processes Controlling Transport of Arsenic in Groundwater: A Review of Adsorption. In Arsenic In Ground Water: Geochemistry and Occurrence, Welch, A.H., Stollenwerk, K.G., Eds.; Springer: Boston, MA, USA, 2003; pp. 67–100. [Google Scholar]
- García, M.G.; Sracek, O.; Fernández, D.S.; del Valle Hidalgo, M. Factors affecting arsenic concentration in groundwaters from Northwestern Chaco-Pampean Plain, Argentina. Environ. Geol. 2007, 52, 1261–1275. [Google Scholar] [CrossRef]
- Vongphuthone, B.; Kobayashi, M.; Igarashi, T. Factors affecting arsenic content of unconsolidated sediments and its mobilization in the Ishikari Plain, Hokkaido, Japan. Environ. Earth Sci. 2017, 76, 645. [Google Scholar] [CrossRef]
- Bondu, R.; Cloutier, V.; Rosa, E.; Benzaazoua, M. A review and evaluation of the impacts of climate change on geogenic arsenic in groundwater from fractured bedrock aquifers. Water Air Soil Pollut. 2016, 227, 296. [Google Scholar] [CrossRef]
- Saha, N.; Rahman, M.S. Groundwater hydrogeochemistry and probabilistic health risk assessment through exposure to arsenic-contaminated groundwater of Meghna floodplain, central-east Bangladesh. Ecotoxicol. Environ. Saf. 2020, 206, 111349. [Google Scholar] [CrossRef] [PubMed]
- Ali, W.; Mushtaq, N.; Javed, T.; Zhang, H.; Ali, K.; Rasool, A.; Farooqi, A. Vertical mixing with return irrigation water the cause of arsenic enrichment in groundwater of district Larkana Sindh, Pakistan. Environ. Pollut. 2019, 245, 77–88. [Google Scholar] [CrossRef]
- Abbas, Y.; Majeed, S.; Ali, S.; Ahmad, H.B.; Akhtar, N.; Yokota, H. Design of Gravel-Sand Filter for Arsenic Removal: A Case Study of Muzaffargarh District in Pakistan. Water Environ. Res. 2018, 90, 2106–2113. [Google Scholar] [CrossRef] [PubMed]
- Mahar, M.T.; Khuhawar, M.Y.; Jahangir, T.M.; Baloch, M.A. Determination of arsenic contents in groundwater of district Rahim Yar Khan southern Punjab, Pakistan. Arab. J. Geosci. 2015, 8, 10983–10994. [Google Scholar] [CrossRef]
- Arshad, N.; Imran, S. Assessment of arsenic, fluoride, bacteria, and other contaminants in drinking water sources for rural communities of Kasur and other districts in Punjab, Pakistan. Environ. Sci. Pollut. Res. 2017, 24, 2449–2463. [Google Scholar] [CrossRef]
- Murtaza, B.; Nazeer, H.; Amjad, M.; Imran, M.; Shahid, M.; Shah, N.S.; Farooq, A.B.U.; Murtaza, G. Hydrogeochemical investigation of arsenic in drinking water of schools and age dependent risk assessment in Vehari District, Punjab Pakistan: A multivariate analysis. Environ. Sci. Pollut. Res. 2020, 27, 30530–30541. [Google Scholar] [CrossRef]
- Rasool, A.; Farooqi, A.; Masood, S.; Hussain, K. Arsenic in groundwater and its health risk assessment in drinking water of Mailsi, Punjab, Pakistan. Hum. Ecol. Risk Assess. Int. J. 2016, 22, 187–202. [Google Scholar] [CrossRef]
- Anwar, M.; Rani, M. Ground drinking water and its consequences on health of residents; a case study of selected areas in bahawalpur city. Sindh Univ. Res. J.-SURJ (Sci. Ser.) 2013, 45. [Google Scholar]
- Waqas, H.; Shan, A.; Khan, Y.G.; Nawaz, R.; Rizwan, M.; Rehman, M.S.-U.; Shakoor, M.B.; Ahmed, W.; Jabeen, M. Human health risk assessment of arsenic in groundwater aquifers of Lahore, Pakistan. Hum. Ecol. Risk Assess. Int. J. 2017, 23, 836–850. [Google Scholar] [CrossRef]
- Gul, M.; Mashhadi, A.F.; Iqbal, Z.; Qureshi, T.I. Monitoring of arsenic in drinking water of high schools and assessment of carcinogenic health risk in Multan, Pakistan. Hum. Ecol. Risk Assess. Int. J. 2020, 26, 2129–2141. [Google Scholar] [CrossRef]
- Muhammad, H.A.; Sediq, K.N.; Sdiq, K.H. Comparative Quality Analysis between Tap Water and Bottled Water. Aro-Sci. J. Koya Univ. 2021, 9, 42–45. [Google Scholar] [CrossRef]
- Association, A.P.H.; Association, A.W.W.; Federation, W.P.C.; Federation, W.E. Standard Methods for the Examination of Water and Wastewater; American Public Health Association: Washington, DC, USA, 1912; Volume 2. [Google Scholar]
- Behari, J.R.; Prakash, R. Determination of total arsenic content in water by atomic absorption spectroscopy (AAS) using vapour generation assembly (VGA). Chemosphere 2006, 63, 17–21. [Google Scholar] [CrossRef]
- USEPA, J. Guidance for Data Quality Assessment: Practical Methods for Data Analysis; US-EPA: New York, NY, USA, 1998.
- Spellman, C.D.; Tasker, T.L.; Goodwill, J.E.; Strosnider, W.H.J. Potential Implications of Acid Mine Drainage and Wastewater Cotreatment on Solids Handling: A Review. J. Environ. Eng. 2020, 146, 03120010. [Google Scholar] [CrossRef]
- Zhang, Y.; Xu, B.; Guo, Z.; Han, J.; Li, H.; Jin, L.; Chen, F.; Xiong, Y. Human health risk assessment of groundwater arsenic contamination in Jinghui irrigation district, China. J. Environ. Manag. 2019, 237, 163–169. [Google Scholar] [CrossRef]
- Shyamala, R.; Shanthi, M.; Lalitha, P. Physicochemical analysis of borewell water samples of Telungupalayam area in Coimbatore district, Tamilnadu, India. E-J. Chem. 2008, 5, 924–929. [Google Scholar] [CrossRef]
- Selvakumar, S.; Chandrasekar, N.; Kumar, G. Hydrogeochemical characteristics and groundwater contamination in the rapid urban development areas of Coimbatore, India. Water Resour. Ind. 2017, 17, 26–33. [Google Scholar] [CrossRef]
- Khan, A.; Khan, S.A.; Saeed, Z.; Naz, B. Impact of Leachate Percolation on Groundwater Quality near the Municipal Open Dumpsite (Jam Chakro): A Case Study of Surjani Town, Karachi, Pakistan. Int. J. Ground Sediment Water 2020, 10, 541–556. [Google Scholar]
- Hussain, R.; Khattak, S.A.; Ali, L.; Sattar, S.; Zeb, M.; Hussain, M.L. Impacts of the linear flowing industrial wastewater on the groundwater quality and human health in Swabi, Pakistan. Environ. Sci. Pollut. Res. 2021, 28, 56741–56757. [Google Scholar] [CrossRef]
- Ahsan, W.A.; Ahmad, H.R.; Farooqi, Z.U.R.; Sabir, M.; Ayub, M.A.; Rizwan, M.; Ilic, P. Surface water quality assessment of Skardu springs using Water Quality Index. Environ. Sci. Pollut. Res. 2021, 28, 20537–20548. [Google Scholar] [CrossRef]
- Kenoyer, G.J.; Bowser, C.J. Groundwater chemical evolution in a sandy silicate aquifer in northern Wisconsin: 1. Patterns and rates of change. Water Resour. Res. 1992, 28, 579–589. [Google Scholar] [CrossRef]
- Rabeiy, R.E. Assessment and modeling of groundwater quality using WQI and GIS in Upper Egypt area. Environ. Sci. Pollut. Res. 2018, 25, 30808–30817. [Google Scholar] [CrossRef] [PubMed]
- Madu, A.; Eze, C.; Otuokere, I. Investigation of the Possible Impact of Seismic Explosive Energy Sources on the Turbidity of Groundwater in Sagbama, Niger Delta, Nigeria. Int. J. Basic Appl. Chem. Sci. 2016, 6, 8–13. [Google Scholar]
- Solodar, A.; Bawab, O.; Levy, S.; Kadas, G.J.; Blaustein, L.; Greenbaum, N. Comparing grey water versus tap water and coal ash versus perlite on growth of two plant species on green roofs. Sci. Total Environ. 2018, 633, 1272–1279. [Google Scholar]

| Age Group | IR (L/Day) | BW (kg) | EF (Days) | ED (Years) | AT (Days) |
|---|---|---|---|---|---|
| Children | 1 | 13 | 365 | 10 | 3650 |
| Adolescents | 1.5 | 28 | 365 | 18 | 6570 |
| Adult male | 2 | 72 | 365 | 67 | 24,455 |
| Adult female | 2 | 53 | 365 | 67 | 24,455 |
| Parameter | WHO | Small Residential (n = 23) | Roadside (n = 21) | Industrial Areas (n = 15) | Household Areas (n = 141) | ||||||||
|---|---|---|---|---|---|---|---|---|---|---|---|---|---|
| Med | Range | Mean ± SD | Med | Range | Mean ± SD | Med | Range | Mean ± SD | Med | Range | Mean ±SD | ||
| As (µg L−1) | 10 | 1.96 | 0–11.23 | 3.30 ± 3.20 | 3.97 | 0–11.21 | 4.81 ± 3.97 | 3.96 | 0–11.54 | 4.42 ± 3.96 | 2.11 | 0–14.33 | 3.85 ± 2.10 |
| EC (µS cm−1) | 1000 | 1227 | 81–7320 | 1791 ± 1096 | 1110 | 421–3520 | 1326 ± 891 | 950 | 420–1654 | 954 ± 328 | 1351 | 81–7320 | 194 ± 14.94 |
| pH (unitless) | 6.5–8.5 | 7.67 | 6.95–8.50 | 7.74 ± 0.28 | 8.14 | 6.95–8.50 | 8.00 ± 0.43 | 8.32 | 7.7–8.5 | 8.24 ± 0.22 | 7.62 | 7.04–8.48 | 7.65 ± 0.24 |
| Fe (mg L−1) | 0.30 | ND | 0–2 | 0.12 ± 0.19 | ND | 0–0.99 | 0.06 ± 0.21 | ND | 0–0.99 | 0.08 ± 0.002 | ND | 0–2 | 0.13 ± 0.37 |
| Ca (mg L−1) | 75 | 56 | 8–280 | 70.9 ± 36.6 | 66 | 8–130 | 61.8 ± 30.2 | 50 | 29–92 | 54.2 ± 18.9 | 63 | 15–280 | 76.2 ± 48.1 |
| Mg (mg L−1) | 150 | 55.5 | 335 | 67.2 ± 41.8 | 45 | 9–111 | 47.0 ± 23.7 | 41 | 20–71 | 44.5 ± 15.9 | 63 | 5–3365 | 72.6 ± 49.7 |
| Cl (mg L−1) | <250 | 118 | 15–945 | 156 ± 102 | 85 | 25–945 | 144 ± 195 | 65 | 15–148 | 72.5 ± 35.9 | 130 | 25–870 | 166 ± 129 |
| Hardness as CaCO3 (mg L−1) | 500 | 373 | 12–1795 | 432 ± 248 | 379 | 114–578 | 358 ± 132 | 320 | 152–486 | 313 ± 102 | 401 | 12–1795 | 460 ± 285 |
| Turbidity (NTU) | <5 | 0.75 | 0.09–7.07 | 0.93 ± 0.22 | 0.77 | 0.29–1.53 | 0.76 ± 0.33 | 0.57 | 0.19–1.52 | 0.62 ± 0.34 | 0.77 | 0.09–7.07 | 1.03 ± 1.0 |
| TDS (mg L−1) | 1000 | 798 | 63–4685 | 1162 ± 804 | 710 | 269–2253 | 896 ± 606 | 608 | 269–1059 | 611 ± 210 | 865 | 63–4685 | 1239 ± 962 |
| pH | Turbidity | TDS | Ca2+ | Mg2+ | Hardness | Cl− | Fe | EC | As | |
|---|---|---|---|---|---|---|---|---|---|---|
| pH | 1 | |||||||||
| Turbidity | −0.548 (0.451) | 1 | ||||||||
| TDS | −0.979 (0.020) | 0.371 (0.628) | 1 | |||||||
| Ca2+ | −0.682 (0.317) | 0.985 (0.014) * | 0.523 (0.476) | 1 | ||||||
| Mg2+ | −0.954 (0.045) * | 0.532 (0.467) | 0.924 (0.075) | 0.662 (0.337) | 1 | |||||
| Hardness | −0.975 (0.024) * | 0.703 (0.296) | 0.912 (0.087) | 0.813 (0.186) | 0.960 (0.039) * | 1 | ||||
| Cl− | −0.931 (0.068) | 0.502 (0.497) | 0.925 (0.074) | 0.624 (0.375) | 0.780 (0.219) | 0.872 (0.127) | 1 | |||
| Fe+ | −0.629 (0.370) | 0.870 (0.129) | 0.478 (0.521) | 0.893 (0.106) | 0.743 (0.256) | 0.782 (0.217) | 0.413 (0.586) | 1 | ||
| EC | −0.998 (0.001) * | 0.523 (0.476) | 0.983 (0.016) * | 0.660 (0.339) | 0.963 (0.036) * | 0.971 (0.028) * | 0.918 (0.081) | 0.625 (0.374) | 1 | |
| As | 0.767 (0.232) | −0.165 (0.834) | −0.796 (0.203) | −0.306 (0.693) | −0.897 (0.102) | −0.739 (0.260) | −0.513 (0.486) | −0.548 (0.451) | −0.794 (0.205) | 1 |
| Area | Gender | ADD (mg kg−1 day−1) | HQ | CR | |||||||||
|---|---|---|---|---|---|---|---|---|---|---|---|---|---|
| Mean | Median | Range | SD | Mean | Median | Range | SD | Mean | Median | Range | SD | ||
| Small residential areas (n = 23) | Children | 2.4 × 10⁻¹ | 1.5 × 10⁻¹ | 0–8.6 × 10⁻¹ | 0.24 | 811.65 | 502.82 | 0–2879.48 | 822.14 | 1.6 × 10⁻¹ | 1.0 × 10⁻¹ | 0–5.7 × 10⁻¹ | 0.16 |
| Adolescents | 1.7 × 10⁻¹ | 1.0 × 10⁻¹ | 0–6.0 × 10⁻¹ | 0.17 | 589.83 | 350.17 | 0–2005.35 | 572.56 | 1.1 × 10⁻¹ | 7.0 × 10⁻² | 0–4.0 × 10⁻¹ | 0.11 | |
| Male | 9.1 × 10⁻² | 5.4 × 10⁻² | 0–3.1 × 10⁻¹ | 0.08 | 305.84 | 181.57 | 0–1039.81 | 296.88 | 6.1 × 10⁻² | 3.6 × 10⁻² | 0–2.0 × 10⁻¹ | 0.05 | |
| Female | 5.0 × 10⁻² | 6.0 × 10⁻² | 0–1.5 × 10⁻¹ | 0.05 | 169.57 | 200.12 | 0–502.64 | 185.78 | 3.0 × 10⁻¹ | 4.0 × 10⁻² | 0–1.0 × 10⁻¹ | 0.04 | |
| Roadside areas (n = 21) | Children | 3.7 × 10⁻¹ | 3.0 × 10⁻¹ | 0–4.2 × 10⁻¹ | 2.18 | 1234.21 | 1018.92 | 0–1423.07 | 729.82 | 2.4 × 10⁻¹ | 2.0 × 10⁻¹ | 0–2.8 × 10⁻¹ | 0.14 |
| Adolescents | 2.5 × 10⁻¹ | 2.1 × 10⁻¹ | 0–6.0 × 10⁻¹ | 0.15 | 859.53 | 709.60 | 0–2001.78 | 508.26 | 1.7 × 10⁻¹ | 1.4 × 10⁻¹ | 0–4.0 × 10⁻¹ | 0.10 | |
| Male | 1.3 × 10⁻¹ | 1.1 × 10⁻¹ | 0–3.1 × 10⁻¹ | 0.07 | 445.68 | 367.94 | 0–1037.96 | 263.54 | 8.9 × 10⁻² | 7.3 × 10⁻² | 0–2.0 × 10⁻¹ | 0.05 | |
| Female | 1.2 × 10⁻¹ | 7.4 × 10⁻² | 0–4.2 × 10⁻¹ | 0.12 | 415.48 | 246.66 | 0–1412.57 | 403.31 | 8.3 × 10⁻² | 4.9 × 10⁻² | 0–2.8 × 10⁻¹ | 0.08 | |
| Industrial areas (n = 15) | Children | 3.4 × 10⁻¹ | 3.0 × 10⁻¹ | 0–8.8 × 10⁻¹ | 0.26 | 1134.01 | 1015.38 | 0–2958.97 | 874.52 | 2.2 × 10⁻¹ | 2.0 × 10⁻¹ | 0–5.9 × 10⁻¹ | 0.17 |
| Adolescents | 2.3 × 10⁻¹ | 2.1 × 10⁻¹ | 0–6.1 × 10⁻¹ | 0.18 | 789.76 | 707.14 | 0–2060.71 | 609.04 | 1.5 × 10⁻¹ | 1.4 × 10⁻¹ | 0–4.1 × 10⁻¹ | 0.12 | |
| Male | 1.2 × 10⁻¹ | 1.1 × 10⁻¹ | 0–3.2 × 10⁻¹ | 0.09 | 409.50 | 366.66 | 0–106,651 | 315.80 | 8.0 × 10⁻² | 7.3 × 10⁻² | 0–2.1 × 10⁻¹ | 0.06 | |
| Female | 9.0 × 10⁻² | 8.7 × 10⁻² | 0–2.5 × 10⁻¹ | 0.07 | 323.93 | 290.04 | 0–845.24 | 249.81 | 6.4 × 10⁻² | 5.0 × 10⁻² | 0–1.6 × 10⁻¹ | 0.04 | |
| Household sites (n = 141) | Children | 3.0 × 10⁻¹ | 2.8 × 10⁻¹ | 0–1.2 × 100 | 0.25 | 1028.33 | 935.89 | 0–4041.02 | 865.06 | 2.0 × 10⁻¹ | 1.8 × 10⁻¹ | 0–8.0 × 10⁻¹ | 0.17 |
| Adolescents | 1.1 × 10⁻¹ | 1.0 × 10⁻¹ | 0–4.3 × 10⁻¹ | 0.09 | 371.34 | 337.96 | 0–1459.25 | 312.38 | 7.4 × 10⁻² | 6.7 × 10⁻² | 0–2.91 × 10⁻¹ | 0.06 | |
| Male | 1.7 × 10⁻¹ | 1.1 × 10⁻¹ | 0–3.3 × 10⁻¹ | 0.19 | 355.94 | 147.13 | 0–794.33 | 880.46 | 3.3 × 10⁻² | 1.0 × 10⁻¹ | 0–2.6 × 10⁻¹ | 0.44 | |
| Female | 1.5 × 10⁻¹ | 1.3 × 10⁻¹ | 0–5.9 × 10⁻¹ | 0.12 | 504.46 | 459.11 | 0–1982.38 | 424.37 | 1.0 × 10⁻¹ | 9.0 × 10⁻² | 0–3.9 × 10⁻¹ | 0.08 | |
| Safety limits [37] | 5 × 10⁻⁸ | 1 × 10⁻⁴ | 10−6 | ||||||||||
Publisher’s Note: MDPI stays neutral with regard to jurisdictional claims in published maps and institutional affiliations. |
© 2022 by the authors. Licensee MDPI, Basel, Switzerland. This article is an open access article distributed under the terms and conditions of the Creative Commons Attribution (CC BY) license (https://creativecommons.org/licenses/by/4.0/).
Share and Cite
Riaz, R.M.Y.; Murtaza, G.; Farooqi, Z.U.R.; Ali, S.; Aziz, H.; Mahboob, S.; Al-Ghanim, K.A.; Owens, G.; Ahmad, H.R.; Riaz, U. Assessment of Arsenic Contamination in Groundwater and Associated Human Health Risk. Sustainability 2022, 14, 12460. https://doi.org/10.3390/su141912460
Riaz RMY, Murtaza G, Farooqi ZUR, Ali S, Aziz H, Mahboob S, Al-Ghanim KA, Owens G, Ahmad HR, Riaz U. Assessment of Arsenic Contamination in Groundwater and Associated Human Health Risk. Sustainability. 2022; 14(19):12460. https://doi.org/10.3390/su141912460
Chicago/Turabian StyleRiaz, Rana Muhammad Yasir, Ghulam Murtaza, Zia Ur Rahman Farooqi, Shafaqat Ali, Humera Aziz, Shahid Mahboob, Khalid A. Al-Ghanim, Gary Owens, Hamaad Raza Ahmad, and Umair Riaz. 2022. "Assessment of Arsenic Contamination in Groundwater and Associated Human Health Risk" Sustainability 14, no. 19: 12460. https://doi.org/10.3390/su141912460
APA StyleRiaz, R. M. Y., Murtaza, G., Farooqi, Z. U. R., Ali, S., Aziz, H., Mahboob, S., Al-Ghanim, K. A., Owens, G., Ahmad, H. R., & Riaz, U. (2022). Assessment of Arsenic Contamination in Groundwater and Associated Human Health Risk. Sustainability, 14(19), 12460. https://doi.org/10.3390/su141912460