
Numerical Simulation of Seepage and Stability of Tailing Dams: A Case Study in Ledong, China


Abstract
:1. Introduction
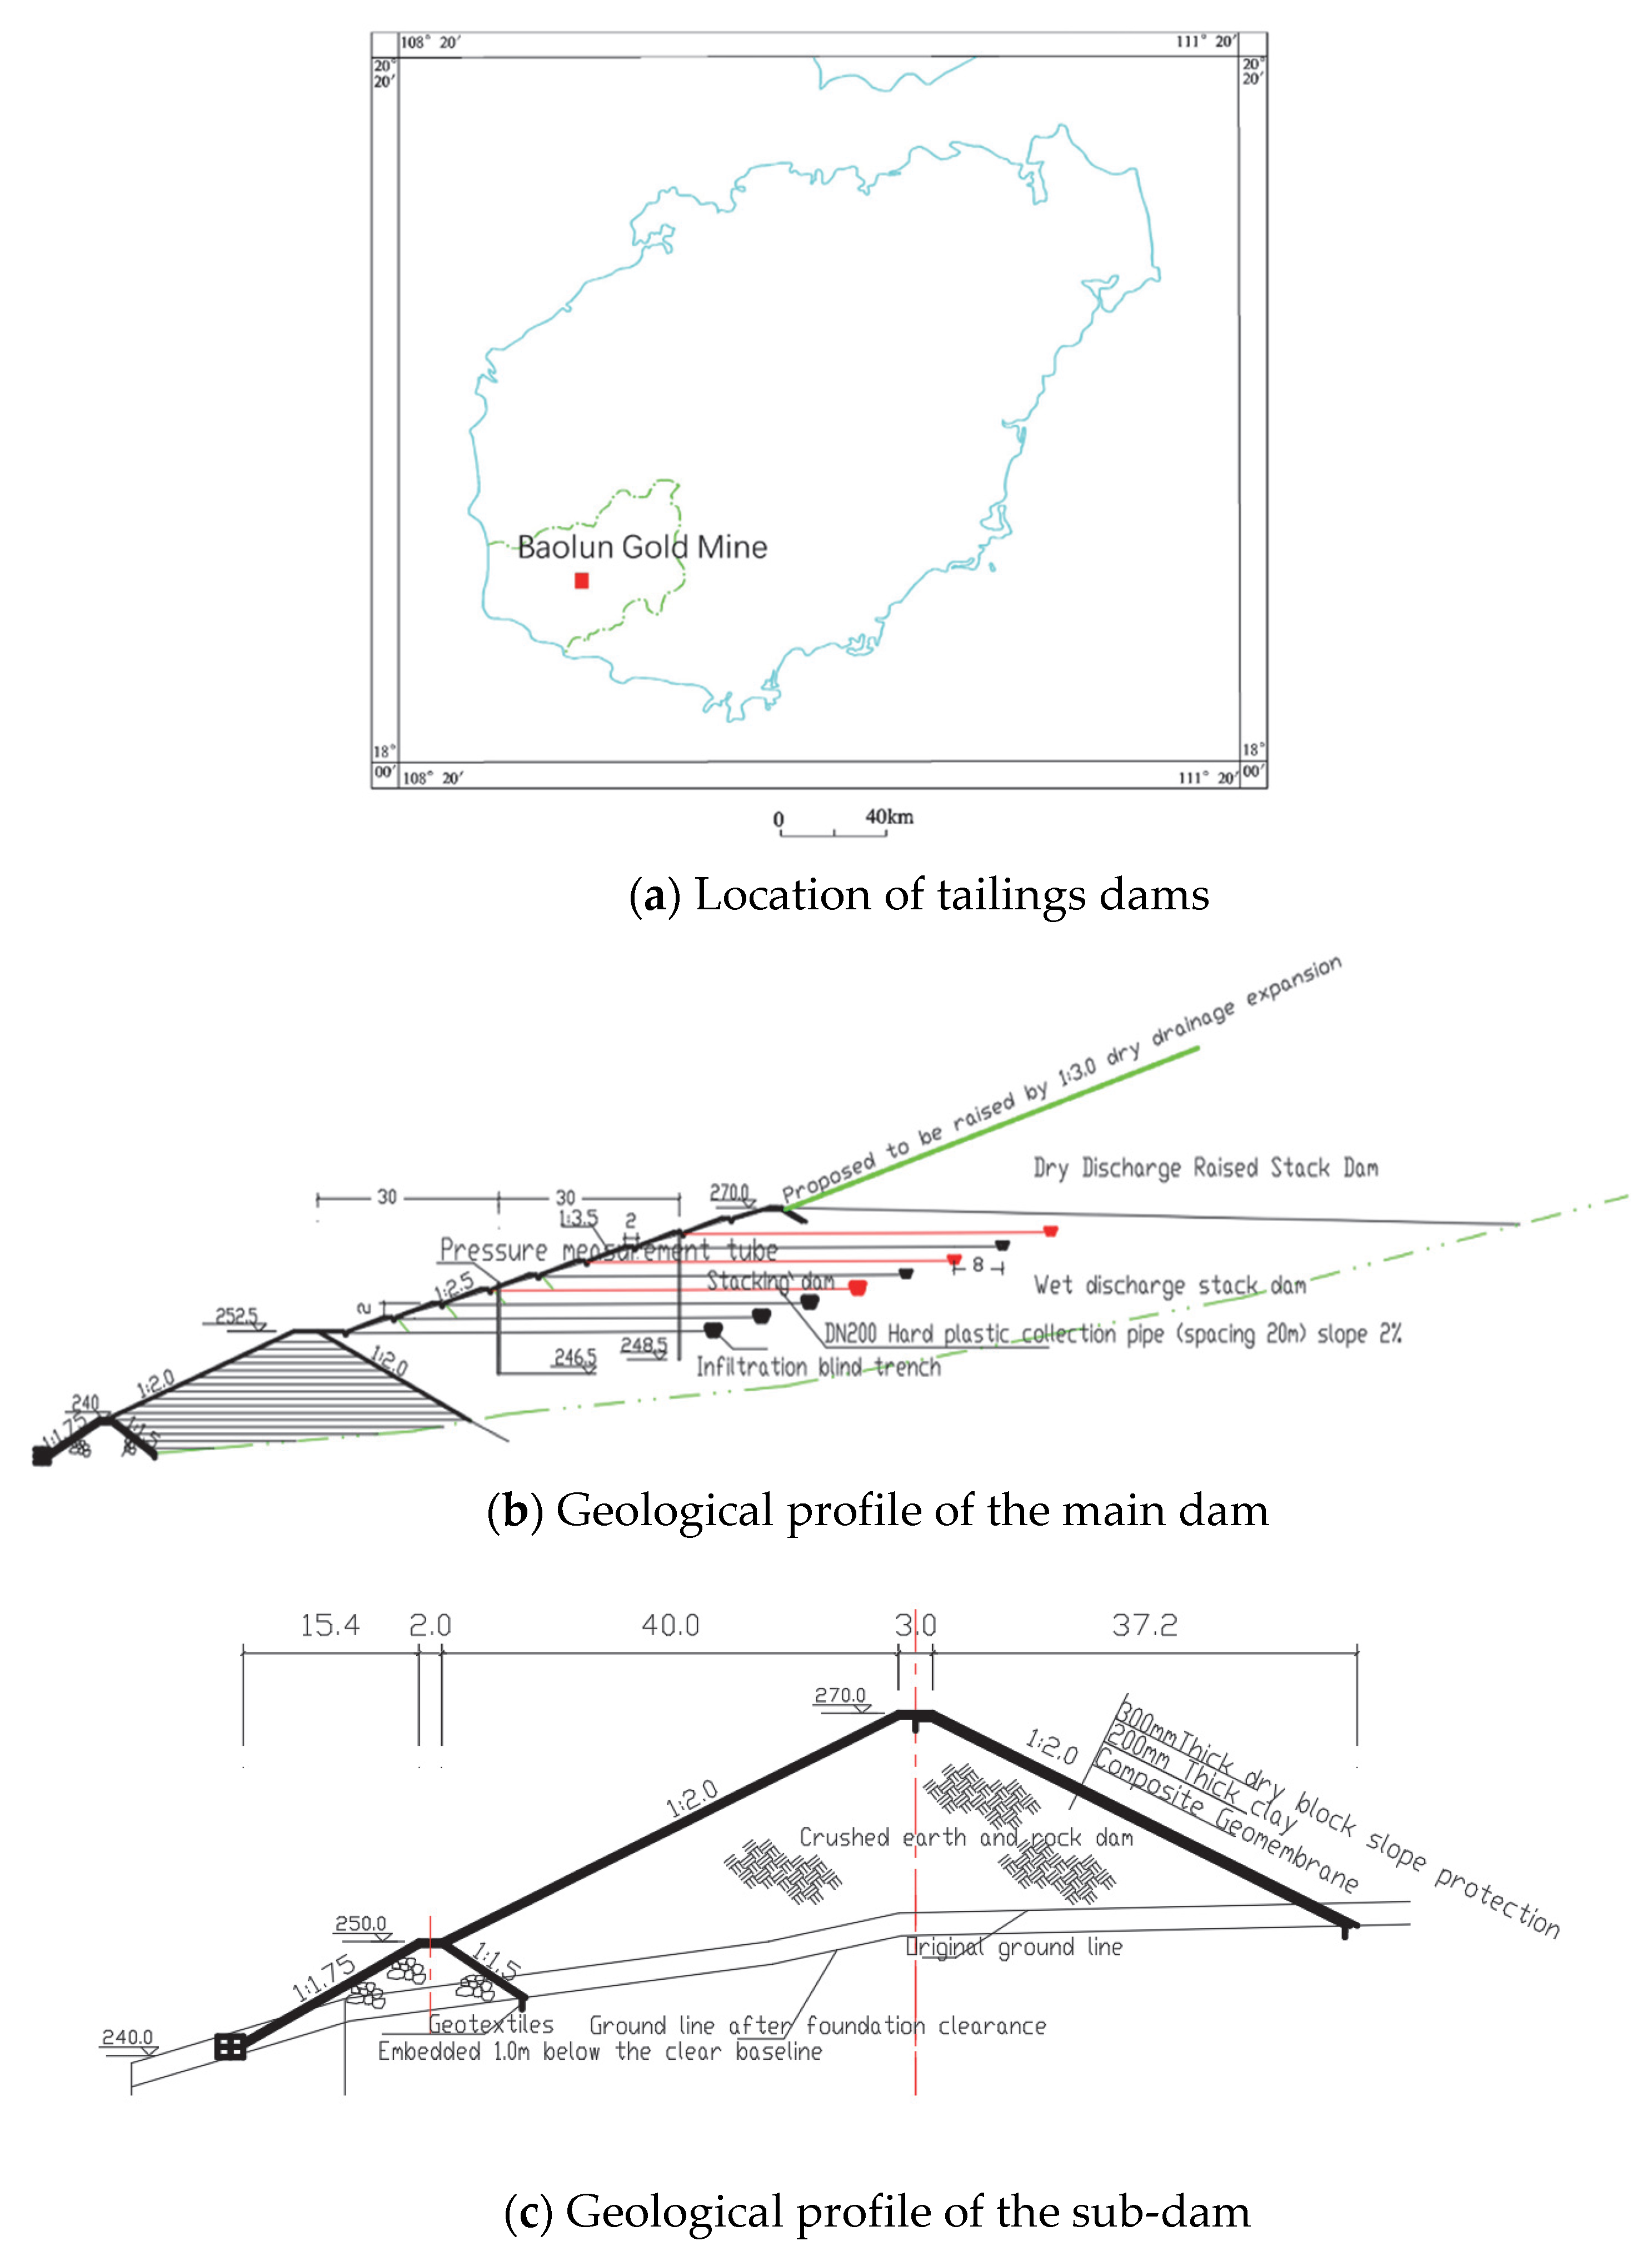
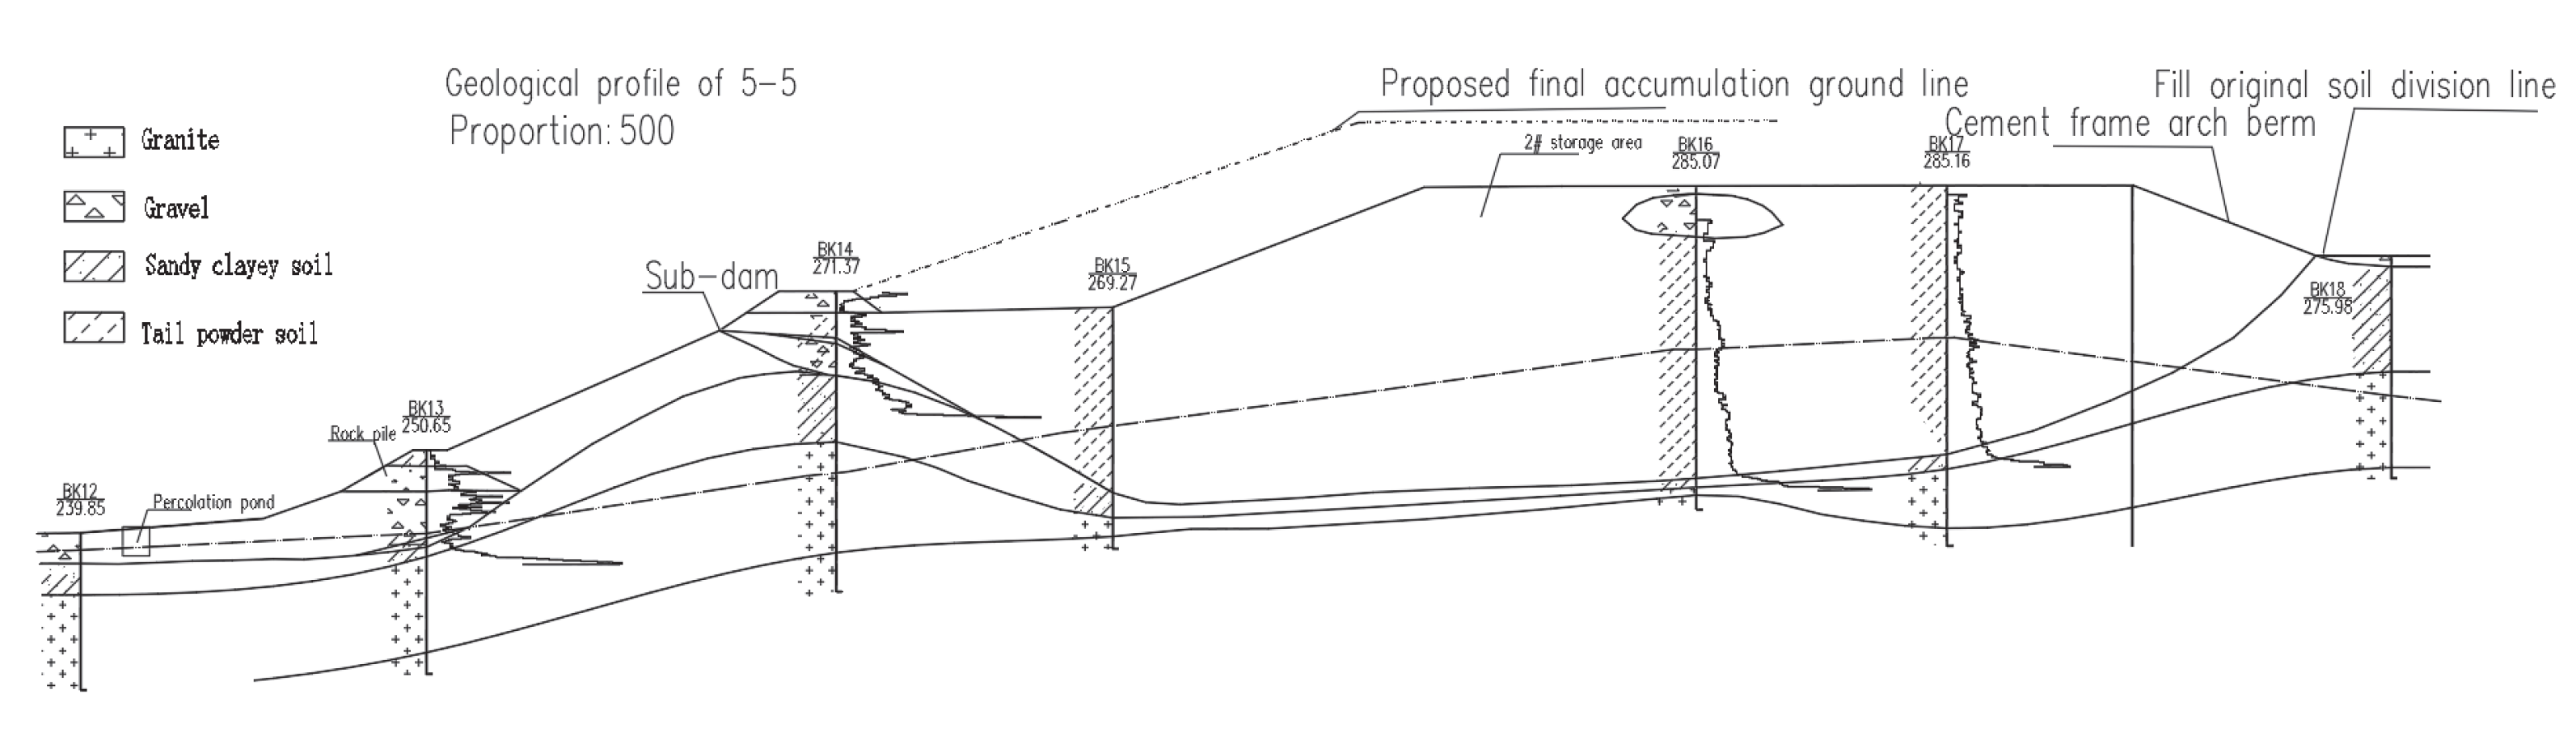
2. Project Overview
3. Seepage Modeling Analysis of Tailings Dam
3.1. Theoretical Representation of Numerical Models
3.2. Basic Assumptions
3.3. Boundary Conditions and Material Parameters
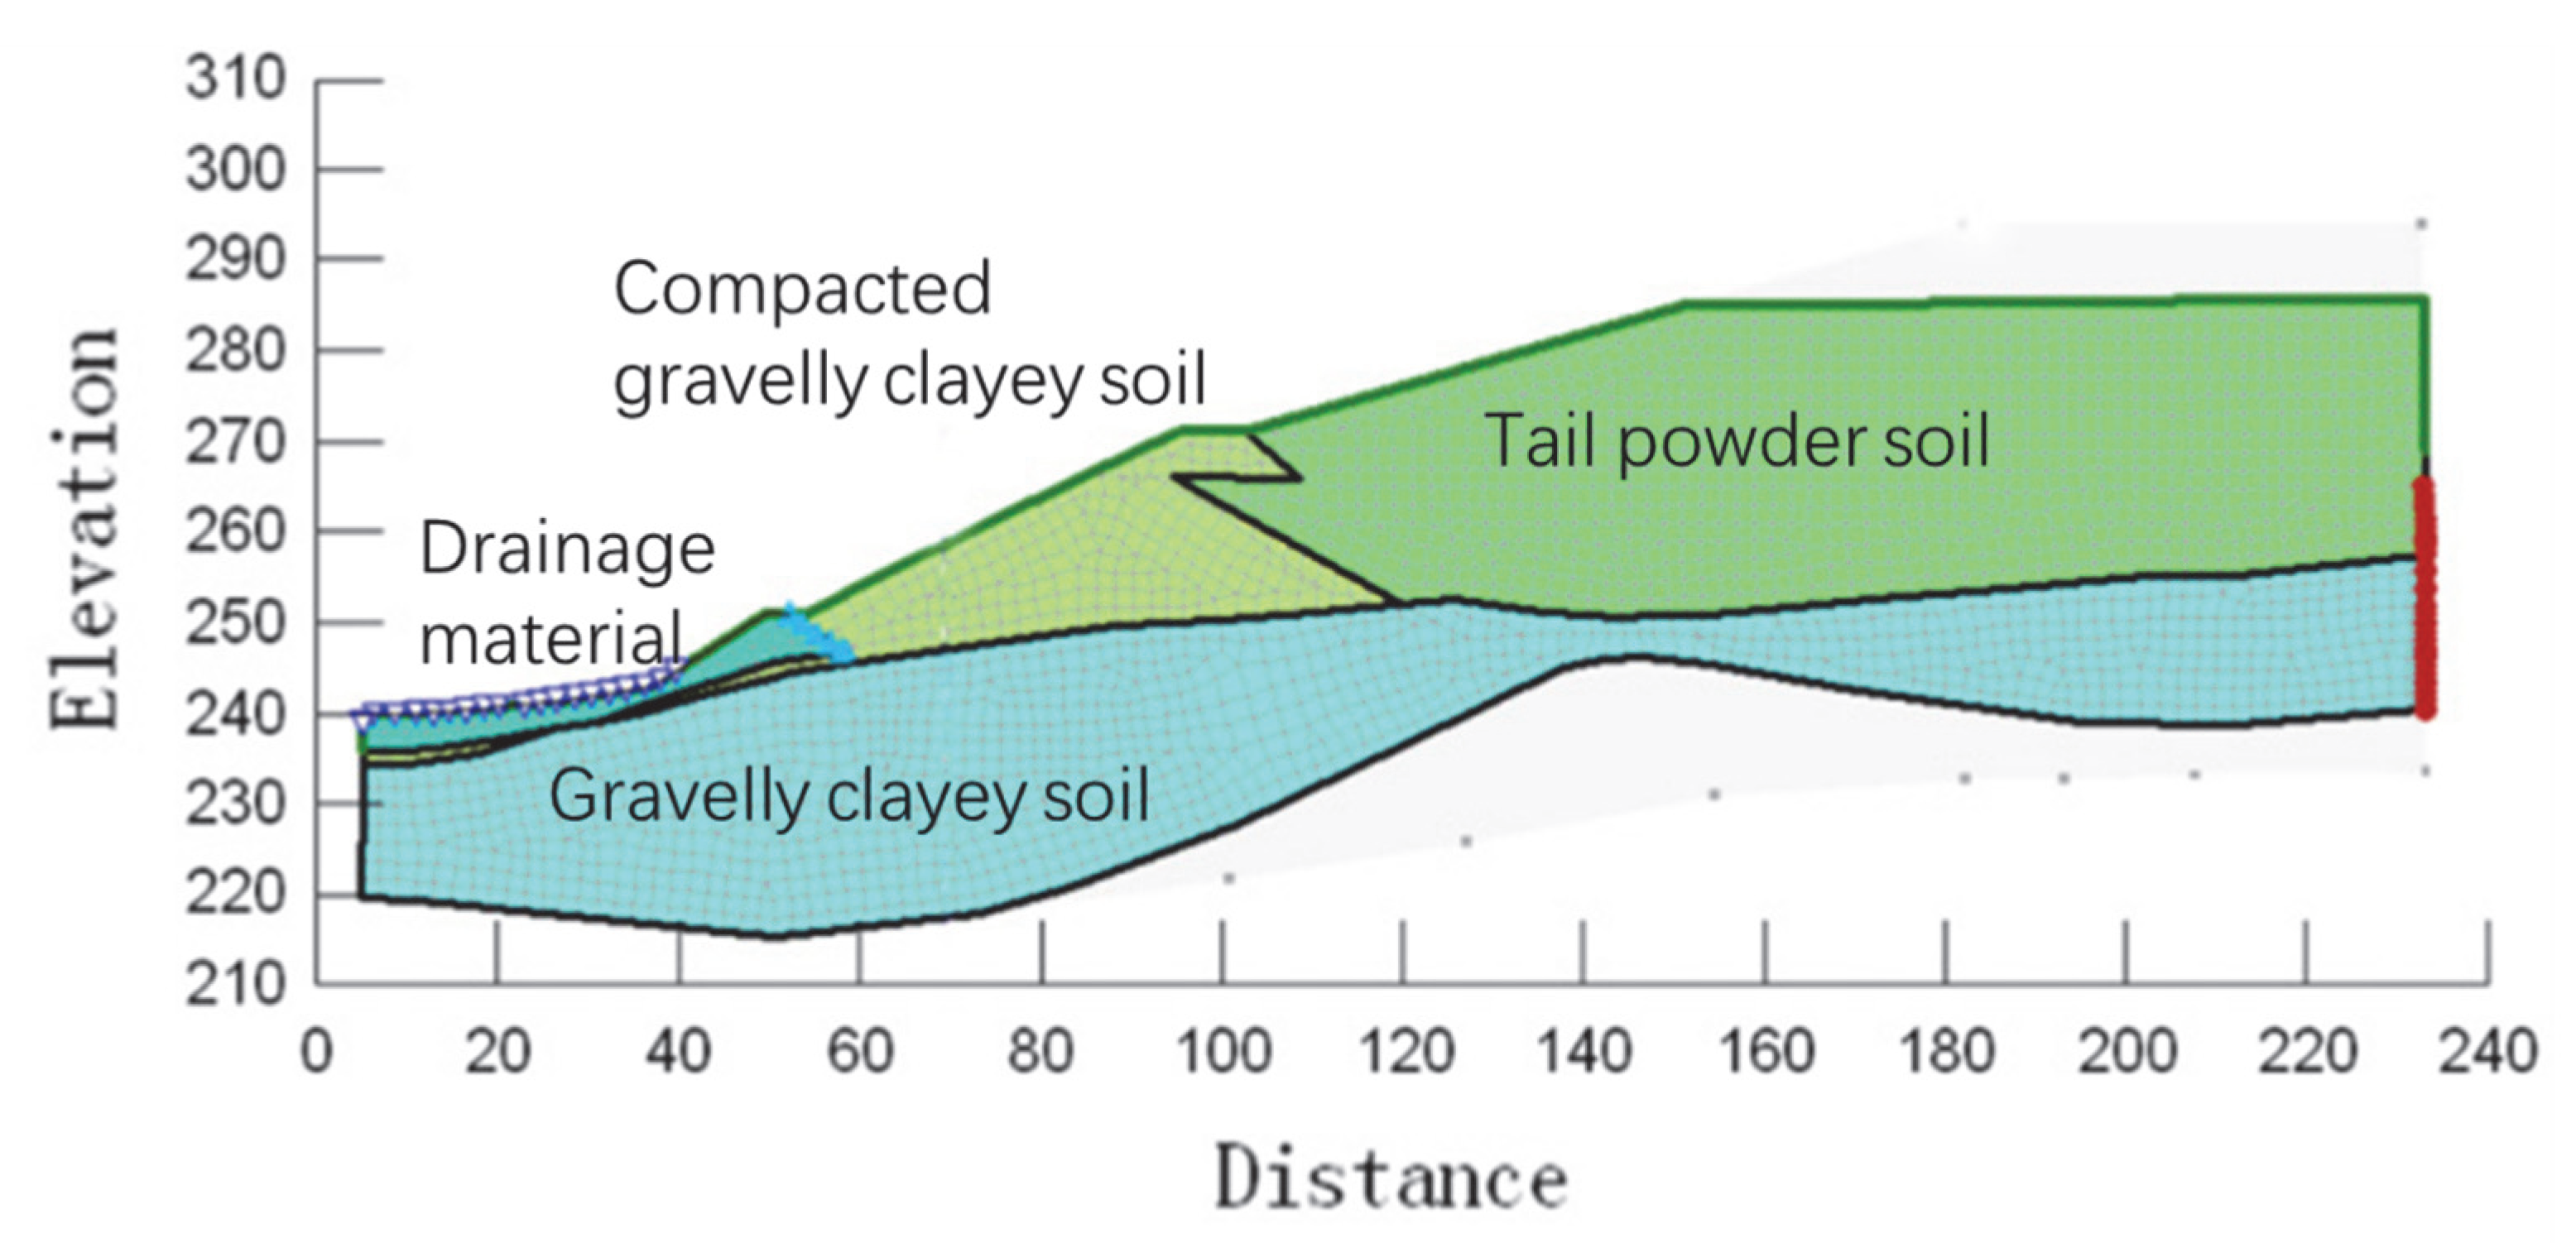
3.4. Numerical Model
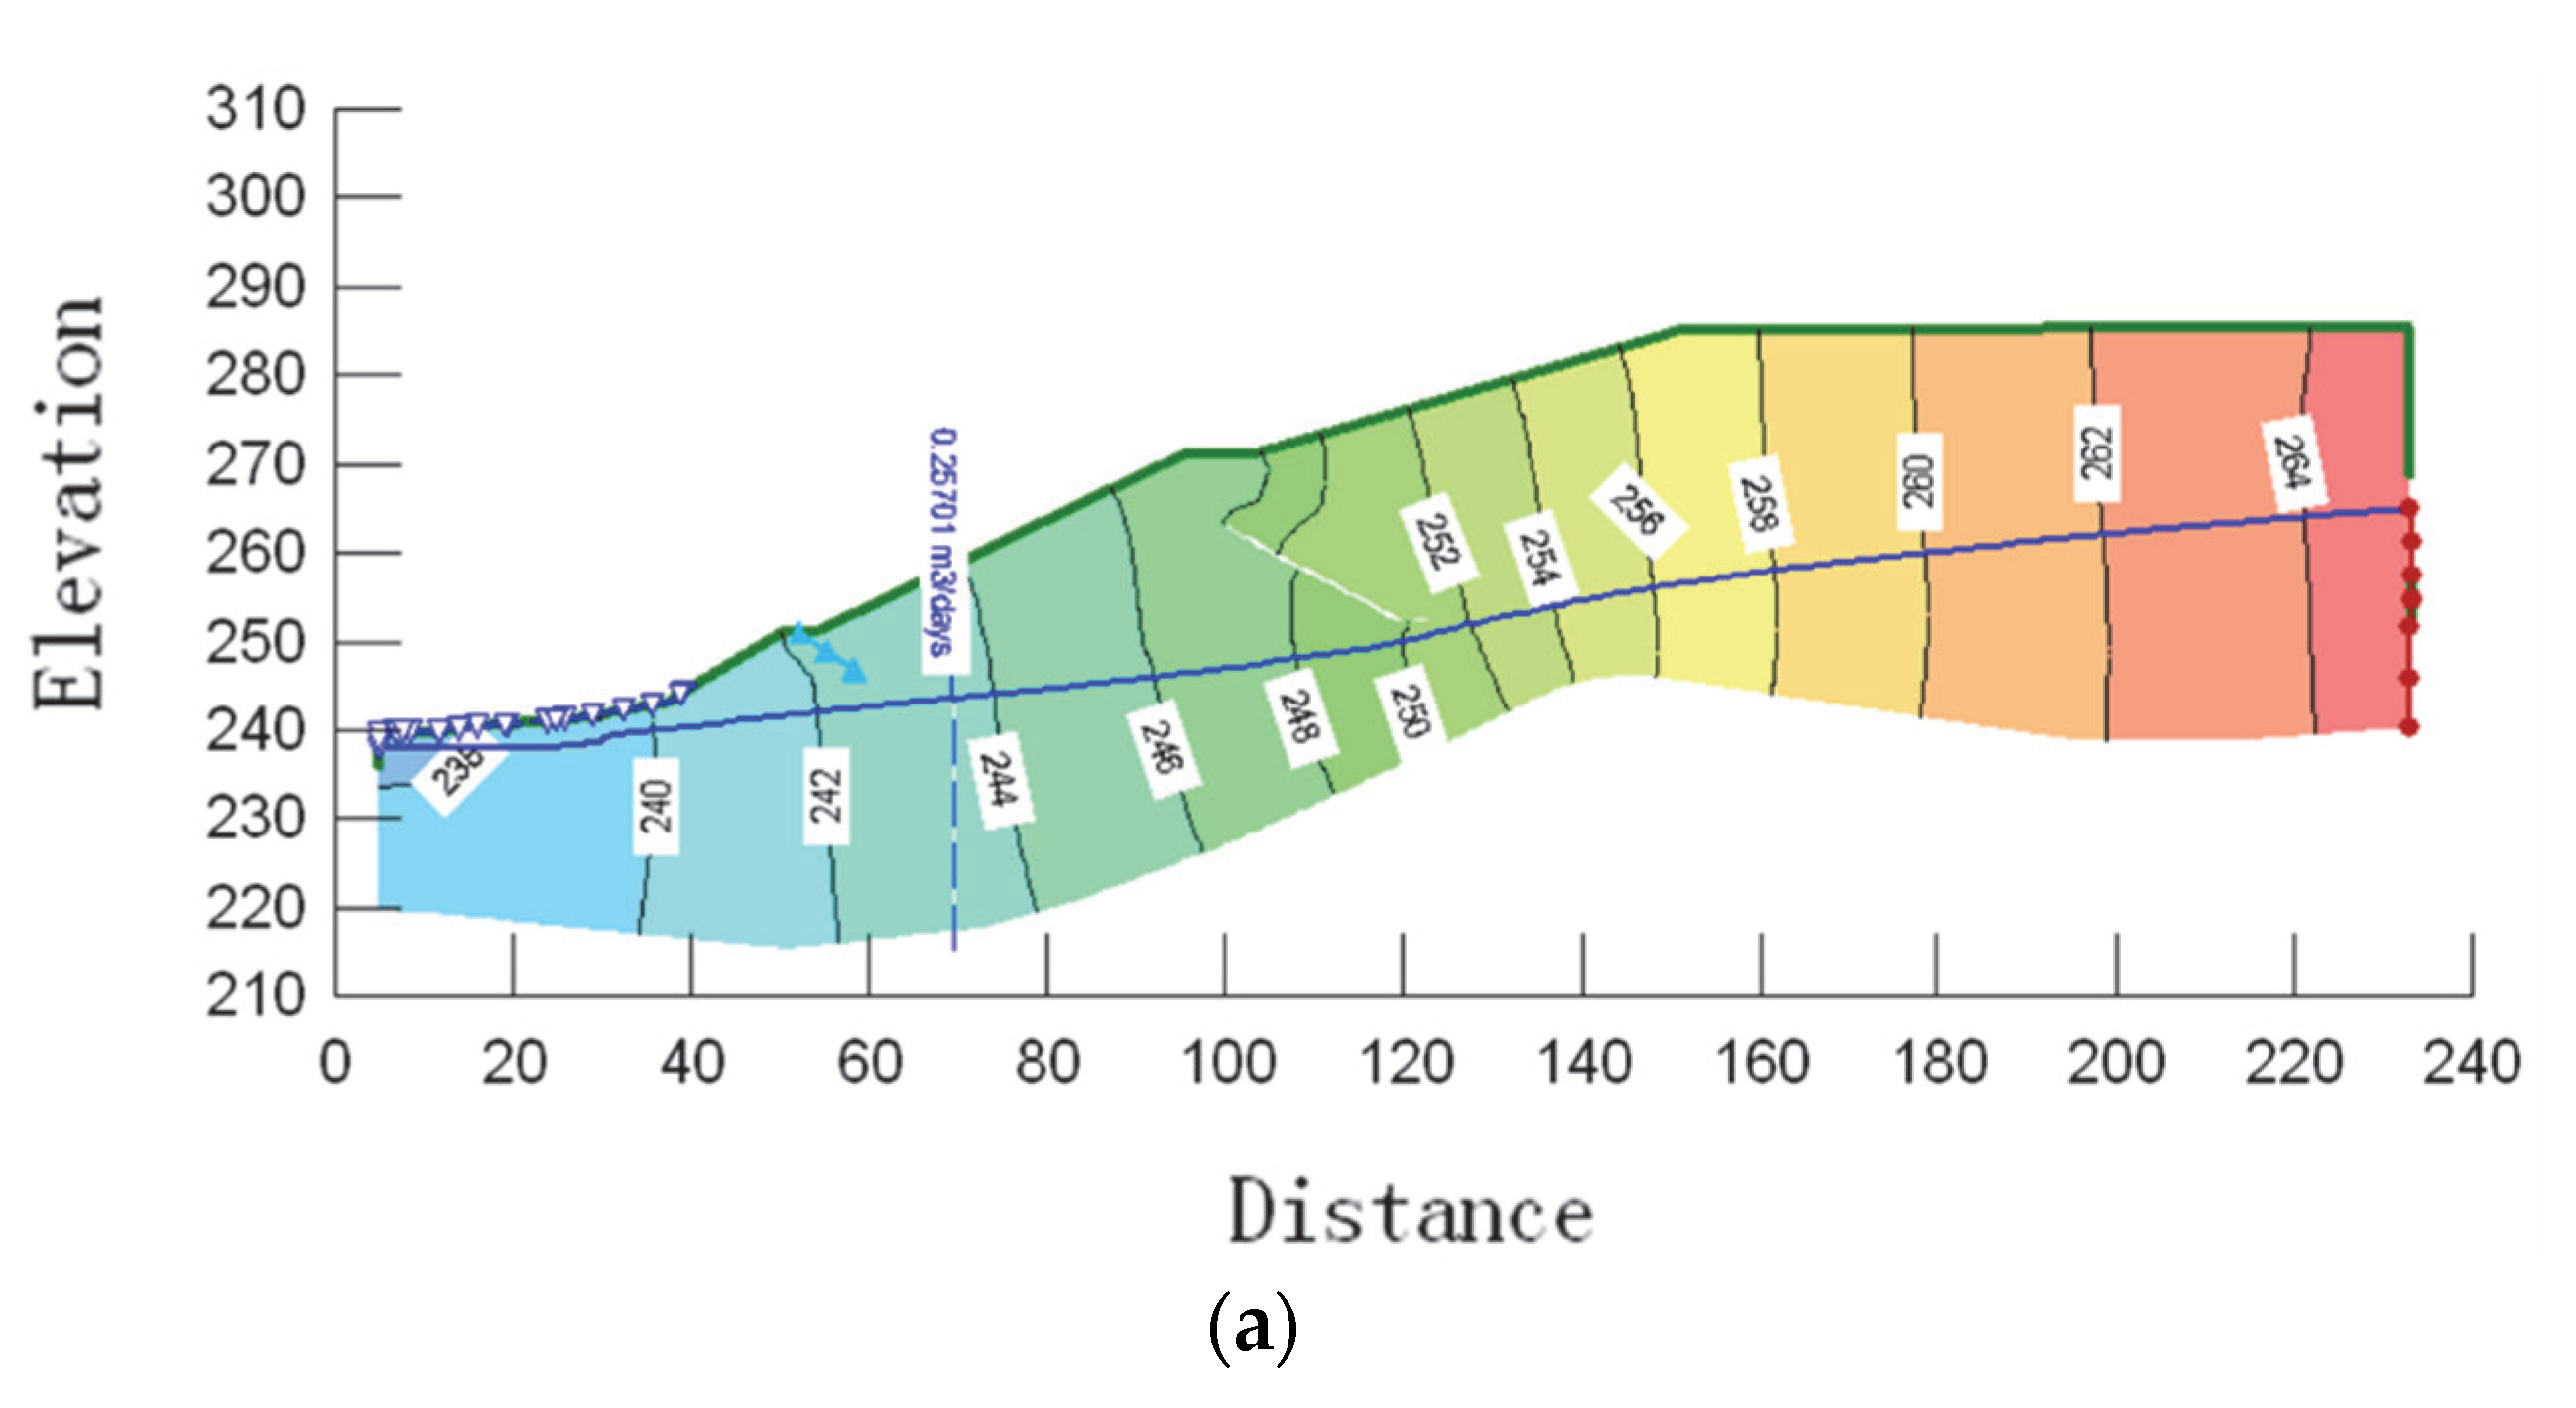
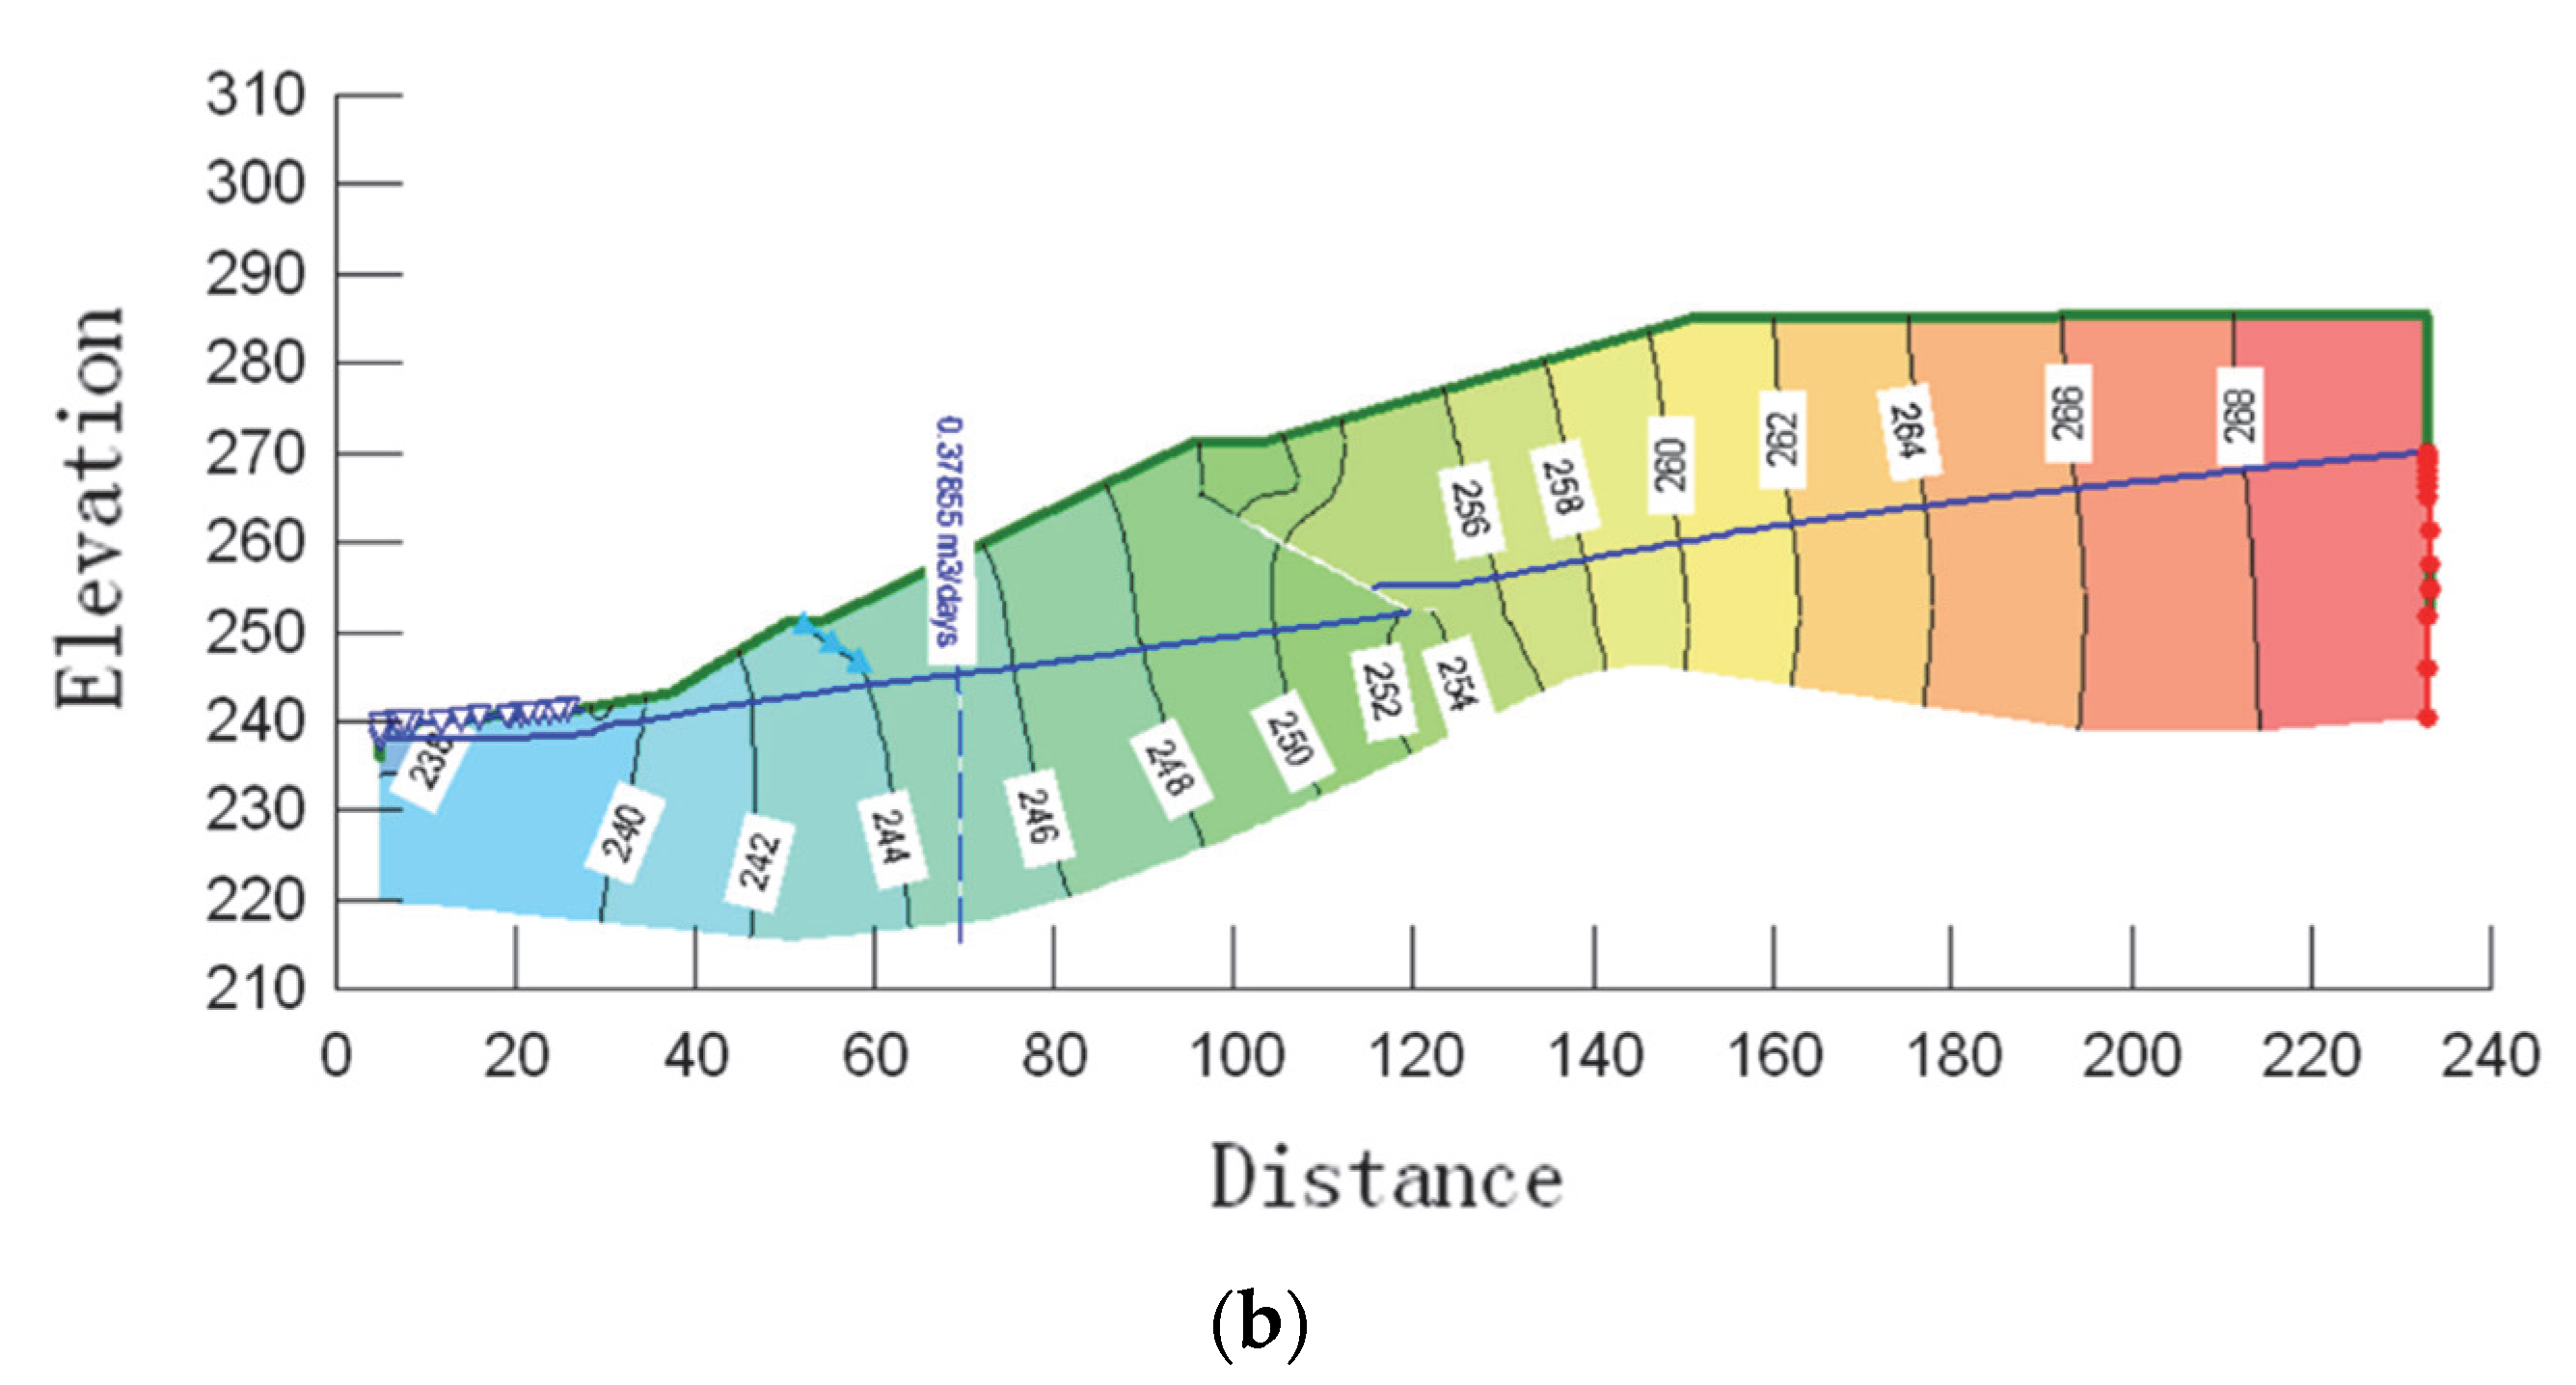
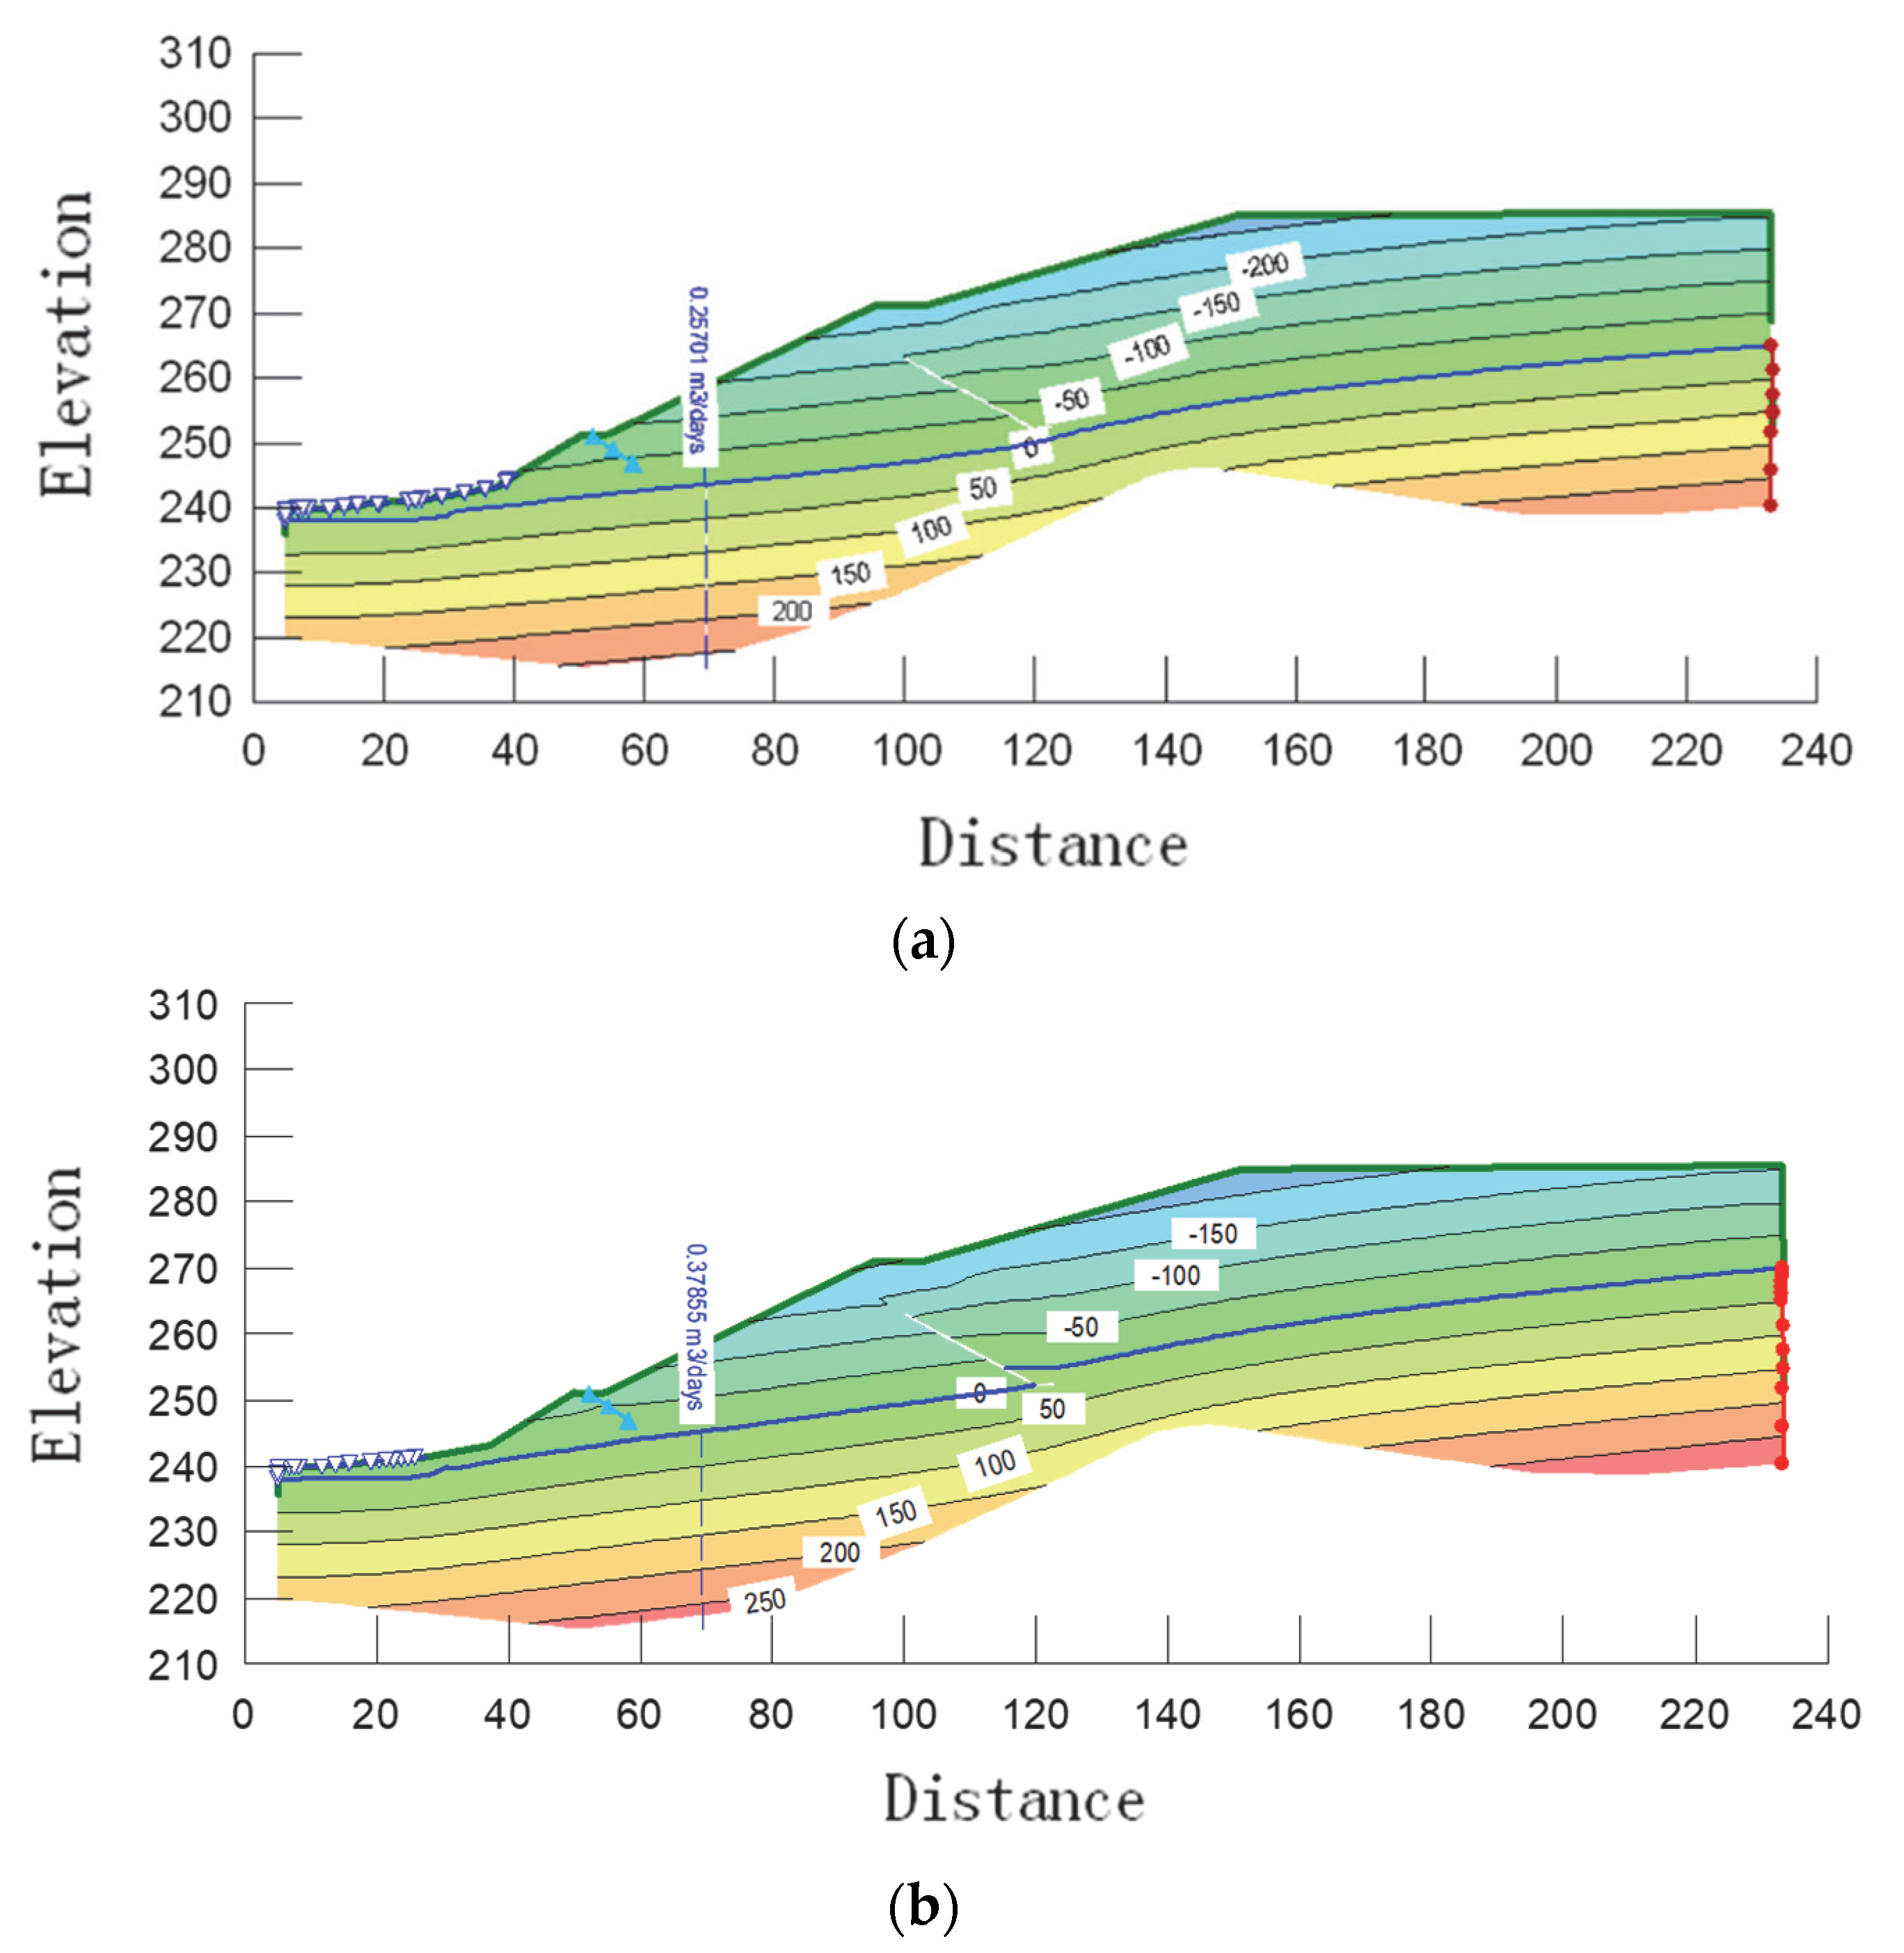
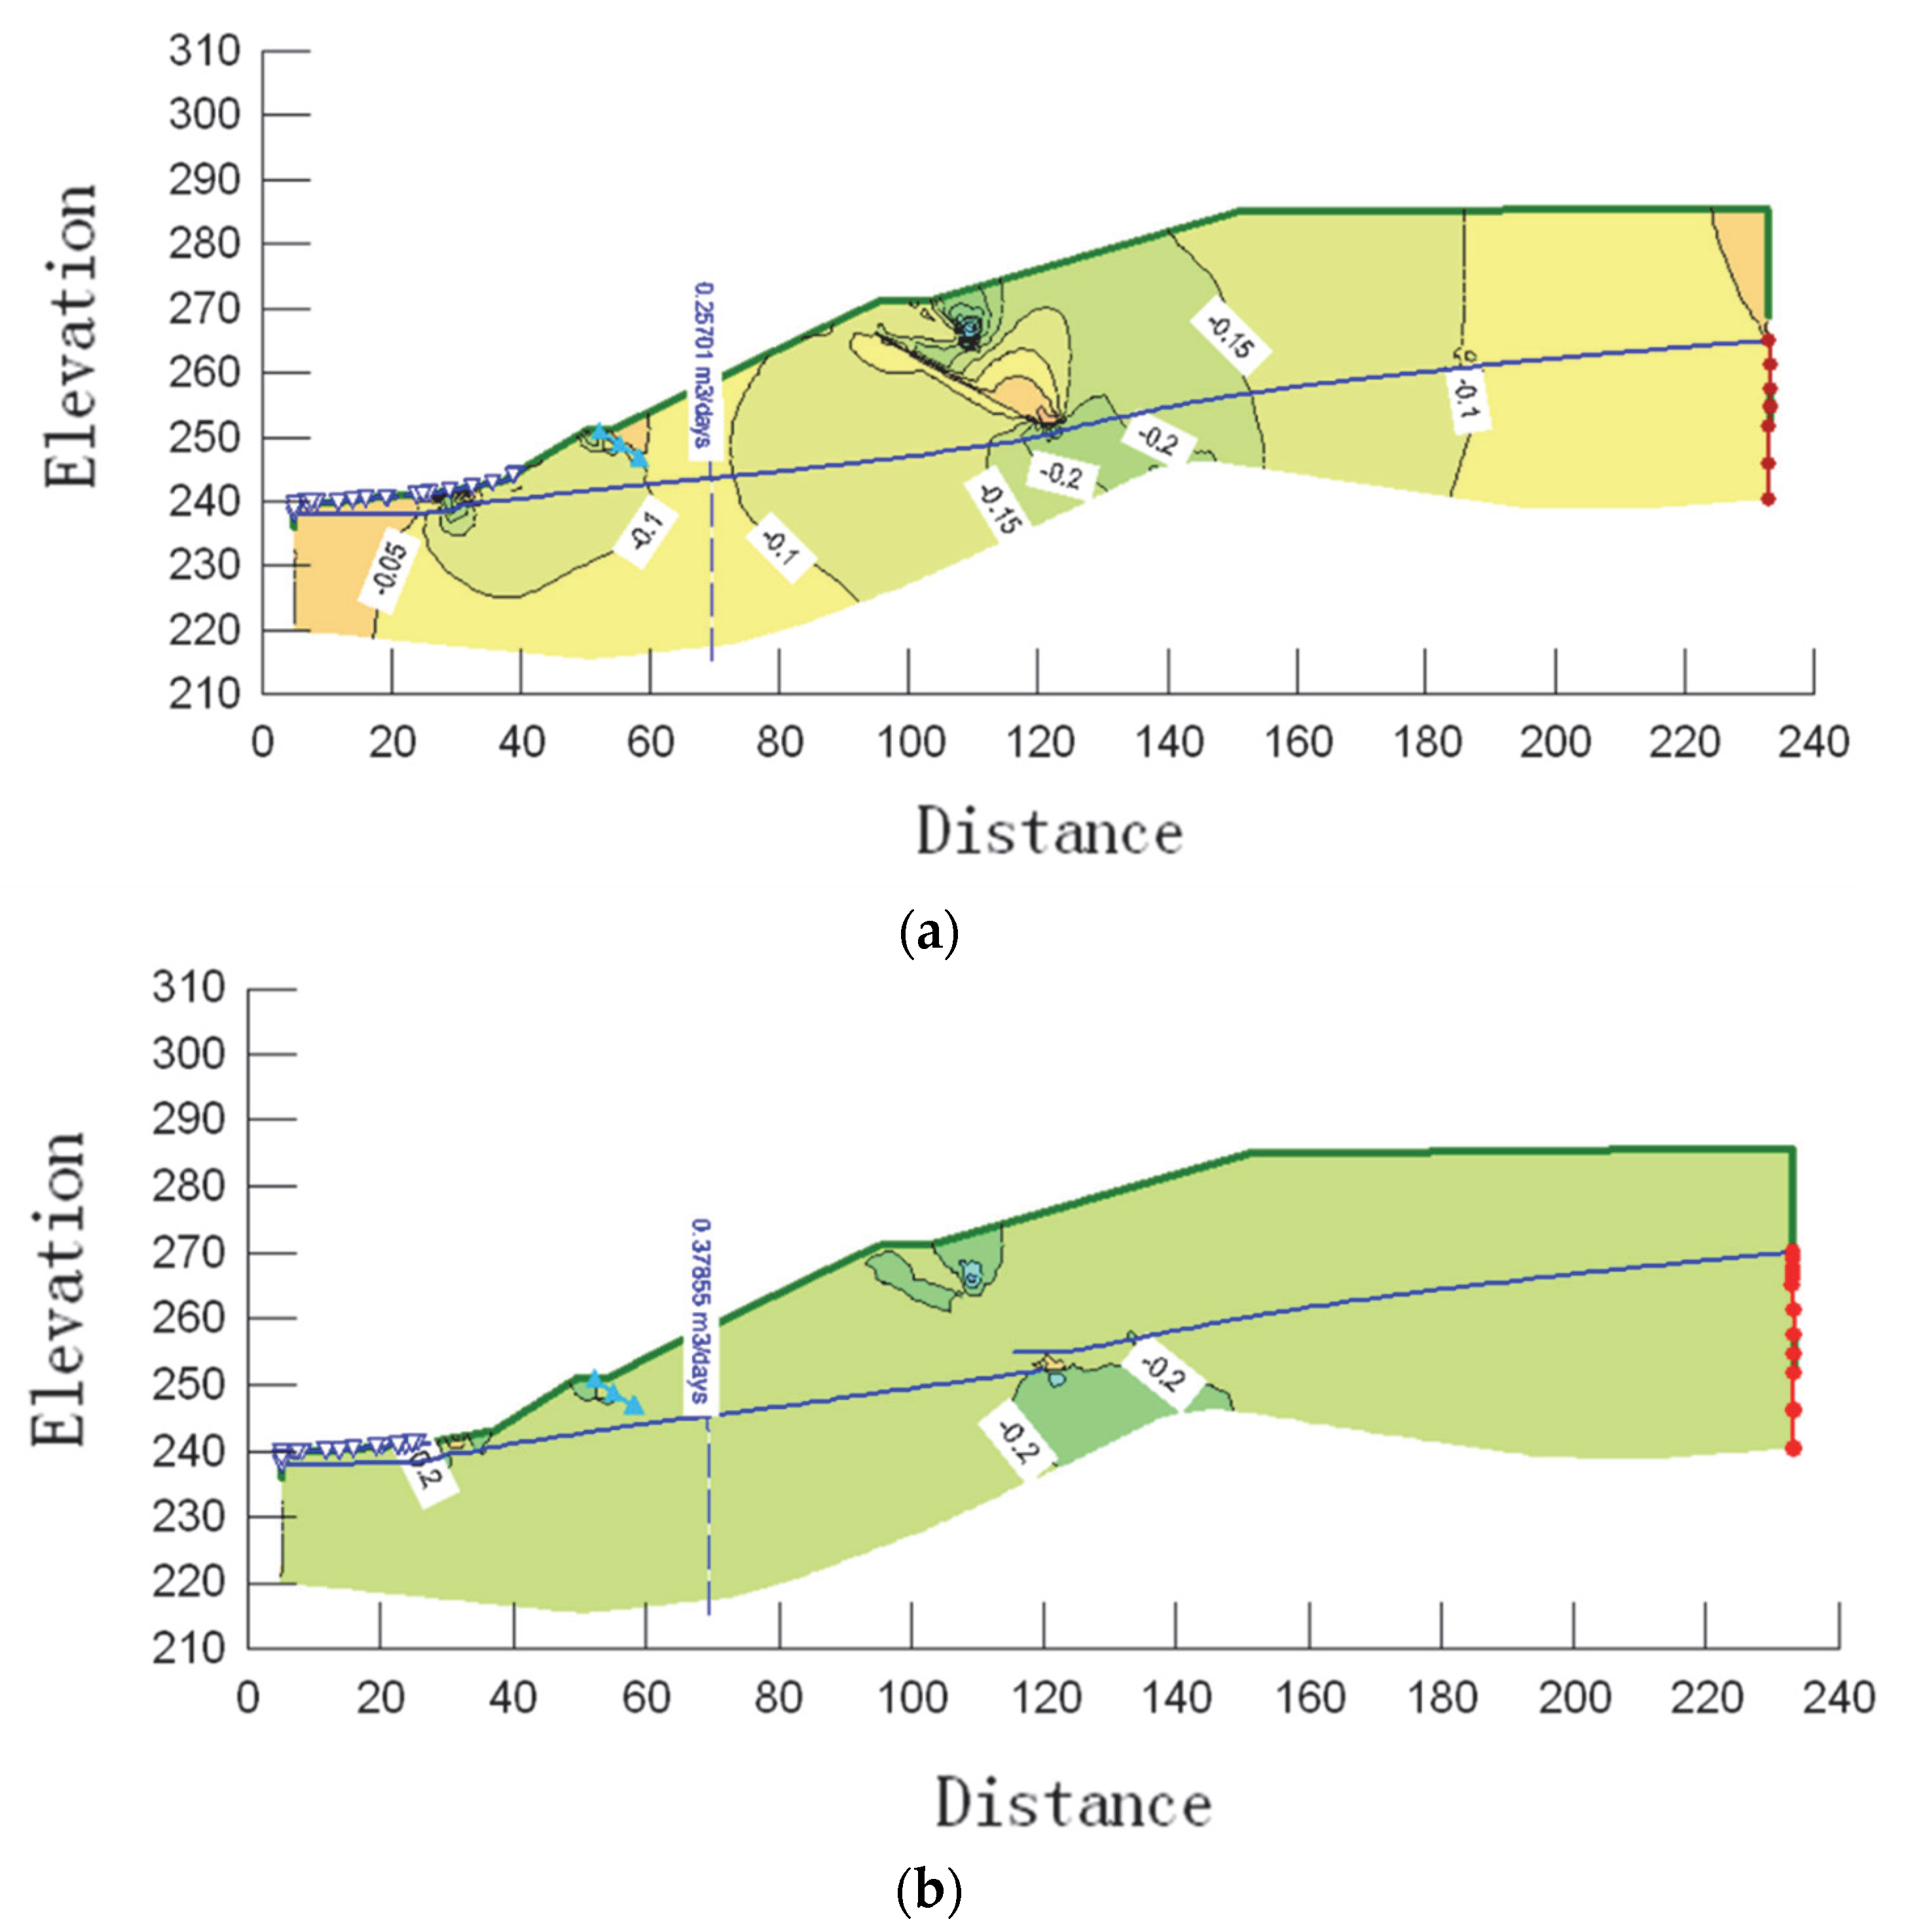
4. Results and Discussion
4.1. Main Dam
4.2. Sub Dam
5. Conclusions
Author Contributions
Funding
Institutional Review Board Statement
Informed Consent Statement
Data Availability Statement
Acknowledgments
Conflicts of Interest
References
- Wang, K.; Yang, P.; Hudson-Edwards, K.A.; Lyu, W.; Yang, C.; Jing, X. Integration of DSM and SPH to Model Tailings Dam Failure Run-Out Slurry Routing Across 3D Real Terrain. Water 2018, 10, 1087. [Google Scholar] [CrossRef]
- Wang, X.; Zhan, H.; Wang, J.; Li, P. The Stability of Tailings Dams under Dry-Wet Cycles: A Case Study in Luonan, China. Water 2018, 10, 1048. [Google Scholar] [CrossRef]
- Zhang, C.; Chai, J.; Cao, J.; Xu, Z.; Qin, Y.; Lv, Z. Numerical Simulation of Seepage and Stability of Tailings Dams: A Case Study in Lixi, China. Water 2020, 12, 742. [Google Scholar] [CrossRef]
- Yagüe, S.; Sánchez, I.; Vigil de la Villa, R.; García-Giménez, R.; Zapardiel, A.; Frías, M. Coal-Mining Tailings as a Pozzolanic Material in Cements Industry. Minerals 2018, 8, 46. [Google Scholar] [CrossRef]
- Asghari, M.; Noaparast, M.; Shafaie, S.Z.; Ghassa, S.; Chehreh Chelgani, S. Recovery of coal particles from a tailing dam for environmental protection and economical beneficiations. Int. J. Coal Sci. Technol. 2018, 5, 253–263. [Google Scholar] [CrossRef]
- Wei, Z.; Yin, G.; Wang, J.G.; Wan, L.; Li, G. Design, construction and management of tailings storage facilities for surface disposal in China: Case studies of failures. Waste Manag. Res. 2013, 31, 106–112. [Google Scholar] [CrossRef]
- Li, Q.; Li, S.L.; Chen, J. The current situation and prospect of safety monitoring of tailing ponds on a trial basis. Chin. J. Geol. Hazard Control 2011, 22, 99–106. [Google Scholar]
- Blight, G.E. Destructive mudflows as a consequence of tailings dyke failures. Proc. Inst. Civ. Eng. Geotech. Eng. 1997, 125, 9–18. [Google Scholar] [CrossRef]
- Shakesby, R.A.; Whitlow, J.R. Failure of a mine waste dump in Zimbabwe: Causes and consequences. Environ. Geol. Water Sci. 1991, 18, 143–153. [Google Scholar] [CrossRef]
- Kemper, T.; Sommer, S. Estimate of Heavy Metal Contamination in Soils after a Mining Accident Using Reflectance Spectroscopy. Environ. Sci. Technol. 2002, 36, 2742–2747. [Google Scholar] [CrossRef]
- Hudson-Edwards, K.A.; Macklin, M.G.; Miller, J.R.; Lechler, P.J. Sources, distribution and storage of heavy metals in the Río Pilcomayo, Bolivia. J. Geochem. Explor. 2001, 72, 229. [Google Scholar] [CrossRef]
- Psarropoulos, P.N.; Tsompanakis, Y. Stability of tailings dams under static and seismic loading. Can Geotech. J. 2008, 45, 663–675. [Google Scholar] [CrossRef]
- Jakka, R.S.; Ramana, G.V.; Datta, M. Seismic Slope Stability of Embankments Constructed with Pond Ash. Geotech. Geol. Eng. 2011, 29, 821–835. [Google Scholar] [CrossRef]
- Rico, M.; Benito, G.; Salgueiro, A.R.; Díez-Herrero, A.; Pereira, H.G. Reported tailings dam failures: A review of the European incidents in the worldwide context. J. Hazard. Mater. 2008, 152, 846–852. [Google Scholar] [CrossRef]
- Rico, M.; Benito, G.; Díez-Herrero, A. Floods from tailings dam failures. J. Hazard. Mater. 2008, 154, 79–87. [Google Scholar] [CrossRef]
- Yin, G.; Li, G.; Wei, Z.; Wan, L.; Shui, G.; Jing, X. Stability analysis of a copper tailings dam via laboratory model tests: A Chinese case study. Miner. Eng. 2011, 24, 122–130. [Google Scholar] [CrossRef]
- Kwak, M.; James, D.F.; Klein, K.A. Flow behaviour of tailings paste for surface disposal. Int. J. Miner. Process. 2005, 77, 139–153. [Google Scholar] [CrossRef]
- McWhorter, D.B.; Nelson, J.D. Seepage in the partially saturated zone beneath tailings impoundments. Min. Eng. 1980, 32, 4. Available online: https://www.osti.gov/etdeweb/biblio/5111853 (accessed on 21 August 2022).
- Stauffer, P.A.; Obermeyer, J.R. Pore Water Pressure Conditions in Tailing Dams. In Hydraulic Fill Structures; ASCE: Reston, VA, USA, 1988; pp. 924–939. Available online: https://cedb.asce.org/CEDBsearch/record.jsp?dockey=0058045 (accessed on 21 August 2022).
- Rykaart, M.; Fredlund, M.; Stianson, J. Modelling tailings dam flux boundary condition with 3D seepage software. Ground Eng. 2002, 35, 28–30. [Google Scholar]
- Özer, A.T.; Bromwell, L.G. Stability assessment of an earth dam on silt/clay tailings foundation: A case study. Eng. Geol. 2012, 151, 89–99. [Google Scholar] [CrossRef]
- Zhao, J.; Ji, W.; Liu, Z. Surveying of geological sections of tailings dams and its effect on seepage field calculation. Met. Mine 2003, 12, 24–27. [Google Scholar]
- Lu, M.; Cu, L. Three-dimensional seepage analysis for complex topographical tailings dam. Rock Soil Mech. 2006, 27, 1176–1180. [Google Scholar]
- Zhang, L.T.; Qi, Q.L.; Xiong, B.L.; Zhang, J. Numerical simulation of 3-D seepage field in tailing pond and its practical application. Procedia Eng. 2011, 12, 170–176. [Google Scholar] [CrossRef]
- Lee, B.; Oh, S. Modified electrical survey for effective leakage detection at concrete hydraulic facilities. J. Appl. Geophys. 2018, 149, 114–130. [Google Scholar] [CrossRef]
- Meggyes, T.; Niederleithinger, E.; Witt, K.J.; Csövári, M.; Kreft-Burman, K.; Engels, J.; McDonald, C.; Roehl, K.E. Enhancing the Safety of Tailings Management Facilities. Soil Sediment Contam. Int. J. 2008, 17, 323–345. [Google Scholar] [CrossRef]
- Coulibaly, Y.; Belem, T.; Cheng, L. Numerical analysis and geophysical monitoring for stability assessment of the Northwest tailings dam at Westwood Mine. Int. J. Min. Sci. Technol. 2017, 27, 701–710. [Google Scholar] [CrossRef]
- Zardari, M.A. Stability of Tailings Dams: Focus on Numerical Modelling. Published online 2011. Available online: http://urn.kb.se/resolve?urn=urn:nbn:se:ltu:diva-18427 (accessed on 20 September 2022).
- GEO-SLOPE International Ltd. User’s Guide to SEEP/W, a Software for Unsaturated Soil Seepage Analysis; Metallurgical Industry Press: Beijing, China, 2011. [Google Scholar]
- Qi, Q.; Zhang, L. Numerical Simulation and Engineering Application of Seepage Field in Tailings Ponds; China Water Conservancy and Hydropower Press: Beijing, China, 2011. [Google Scholar]
- Xie, D. Unsaturated Soil Mechanics; Higher Education Press: Beijing, China, 2015. [Google Scholar]
- Fredlund, D.G.; Xing, A.; Fredlund, M.D.; Barbour, S.L. The relationship of the unsaturated soil shear strength to the soil-water characteristic curve. Can Geotech. J. 1996, 33, 440–448. [Google Scholar] [CrossRef]
- Ministry of Water Resources of the People’s Republic of China. Specification for Geological Survey of Hydraulic and Hydropower Projects; China Planning Press: Beijing, China, 2009. [Google Scholar]
- Yang, J.; Qu, J.; Mi, Q.; Li, Q. A CNN-LSTM Model for Tailings Dam Risk Prediction. IEEE Access 2020, 8, 206491–206502. [Google Scholar] [CrossRef]
- Li, Q.; Geng, J.; Song, D.; Nie, W.; Saffari, P.; Liu, J. Automatic recognition of erosion area on the slope of tailings dam using region growing segmentation algorithm. Arab J. Geosci. 2022, 15, 438. [Google Scholar] [CrossRef]
- Li, Q.; Chen, Z.; Zhang, B.; Li, B.; Lu, K.; Lu, L.; Guo, H. Detection of Tailings Dams Using High-Resolution Satellite Imagery and a Single Shot Multibox Detector in the Jing–Jin–Ji Region, China. Remote Sens. 2020, 12, 2626. [Google Scholar] [CrossRef]


| Abbreviation/ Symbol | Parameter | Value | Unit | |
|---|---|---|---|---|
| Tailings Silts | Gravelly Clay Loam | |||
| θs | Volumetric heat capacity of the soil particles | 0.397 | 0.4535 | m3/m3 |
| d10 | Thermal conductivity of the soil mixture | 0.005 | 0.003 | mm |
| d60 | Material parameters accounting for the particle shape effect | 0.056 | 0.7 | mm |
| WL | liquid limit | 28.82 | 37.2 | % |
| mV | Volume compression coefficient of soil | 0.0001 | 0.000264 | kPa−1 |
| Ksat | Saturated water hydraulic conductivity | 2 × 10⁻⁴ | 1 × 10⁻⁴ | cm/s |
| a | fitting parameters | 25 | 60 | kPa |
| n | fitting parameters | 1.5 | 1.5 | 1 |
| m | fitting parameters | 1 | 0.85 | 1 |
| Allowed Hydraulic Ratio Drop | Permeability Deformation Type | |||||
|---|---|---|---|---|---|---|
| Fluid Type | Transition Type | Tube Surge Type | ||||
| Cu ≤ 3 | 3 < Cu ≤ 5 | Cu ≥ 5 | Cascading Continuity | Cascading Discontinuity | ||
| J | 0.25~0.35 | 0.35~0.50 | 0.50~0.80 | 0.25~0.40 | 0.15~0.25 | 0.10~0.20 |
| Soil Sample | The Main Physical Indicators Used for Discrimination and Calculation | Type of Infiltration Deformation | Critical Hydraulic Ratio Drop | Allowable Hydraulic Ratio Drop | Location | ||||
|---|---|---|---|---|---|---|---|---|---|
| Cu | Viscous Particle Content | IP | GS | n | |||||
| Tail powder soil | 11.3 | 11% | 9.83 | 2.66 | 0.397 | Fluid type | 1.00 | 0.50 | Dam body |
| Gravelly clayey soil | 330 | 13% | 13.63 | 2.67 | 0.4535 | Fluid type | 0.912 | 0.45 | Dam base soil |
Publisher’s Note: MDPI stays neutral with regard to jurisdictional claims in published maps and institutional affiliations. |
© 2022 by the authors. Licensee MDPI, Basel, Switzerland. This article is an open access article distributed under the terms and conditions of the Creative Commons Attribution (CC BY) license (https://creativecommons.org/licenses/by/4.0/).
Share and Cite
Yang, J.; Hu, J.; Wu, Y.; Zhang, B. Numerical Simulation of Seepage and Stability of Tailing Dams: A Case Study in Ledong, China. Sustainability 2022, 14, 12393. https://doi.org/10.3390/su141912393
Yang J, Hu J, Wu Y, Zhang B. Numerical Simulation of Seepage and Stability of Tailing Dams: A Case Study in Ledong, China. Sustainability. 2022; 14(19):12393. https://doi.org/10.3390/su141912393
Chicago/Turabian StyleYang, Jianxin, Jun Hu, Yuwei Wu, and Boyang Zhang. 2022. "Numerical Simulation of Seepage and Stability of Tailing Dams: A Case Study in Ledong, China" Sustainability 14, no. 19: 12393. https://doi.org/10.3390/su141912393
APA StyleYang, J., Hu, J., Wu, Y., & Zhang, B. (2022). Numerical Simulation of Seepage and Stability of Tailing Dams: A Case Study in Ledong, China. Sustainability, 14(19), 12393. https://doi.org/10.3390/su141912393