Abstract
Taking the S823 airfoil as the research object, this study investigates the influence of different types of leading-edge erosion on the aerodynamic performance of airfoil by using the computational fluid dynamics method. The effect of leading-edge erosion on the inception of stall vortex is also analysed. The results show that when the angle of attack (AoA) is greater than 5°, the leading-edge erosion results in a significant decrease in the lift coefficient and an increase in the drag coefficient. The deterioration in the drag coefficient of the airfoil caused by leading-edge erosion is much greater than that of the lift coefficient. Moreover, the maximum promotion rate of the drag coefficient can reach 357% at Re = 300,000. The exacerbation of the erosion level leads to a dramatic expansion of the stall vortex on the airfoil suction side at a large AoA and results in a reduction in the pressure difference between the pressure and suction sides of the airfoil. This is also the reason erosion causes the degradation of the aerodynamic performance of the wind turbine airfoil. This work is beneficial to establish the reasonable maintenance cycle of the wind turbine blades working in a sand blown environment.
1. Introduction
Owing to the threat of global warming and the depletion of fossil fuel reserves, the development of renewable energy has received increasing attention. Among the various renewable energy sources, wind energy is considered the most cost-effective of all currently developed renewable energy sources. However, onshore wind turbine blades are often eroded by natural elements such as sand, rain, and snow [,]. With the development of offshore wind, the blades of offshore wind turbines can also be eroded by rain and salt haze []. As a key component of wind turbine energy conversion, turbine blades eroded by the external environment during operation will suffer from increased blade roughness and will result in a decrease in the blade aerodynamic performance. As a result, the annual power generation of the wind turbine is reduced and the intended service life of the blade is shortened []. According to the computational fluid dynamics (CFD) analysis on an NREL 5 MW wind turbine that had not been maintained for 12 years, the annual power generation of wind turbines had been reduced by 4% due to erosion [].
The pitting, cracks, pits, and delamination of wind turbine blades are caused by different degrees of erosion under various environmental conditions []. The surface roughness of blades is deteriorated due to erosion, and the leading edge of the blade is the most serious region of blade erosion [,]. SAREEN et al. [] studied the erosion generated by the leading edge of DU 96-W-180 through experiments. Their results show that leading-edge erosion led to a remarkable increase in drag and a significant decrease in lift near the upper corner of the pole curve. Ge et al. [] used numerical simulation to study the erosion of S809 airfoil. They found that the maximum lift coefficient decreased by 35–61%, and the drag coefficient increased sharply by 131%–217%. Li et al. [] established a geometric model of leading-edge erosion by modifying the leading edge of the wind airfoil type. Their results indicated that leading edge erosion aggravates flow separation near the trailing edge. Therefore, leading-edge erosion has a great influence on the aerodynamic properties of airfoils. Through numerical simulation, Wang et al. [] studied the variation in flow field of S809 airfoil under different erosion levels. Their results validated that when the erosion depth was constant, the increase in erosion thickness could lead to flow separation at the leading edge and trailing edge. Ravishankara et al. [] implemented roughness models in a different turbulence model, and the various integral boundary layer quantities in the presence of erosion roughness were investigated using this model. Cappugi et al. [] presented a simulation-based technology that could rapidly and accurately estimate the wind turbine energy field losses due to blade leading-edge erosion. This technology makes it possible to estimate the wind power energy loss caused by erosion in a few minutes. Pathak et al. [] found that a coating with a 15%wt filler concentration had a relatively low erosion rate. Moreover, there are other studies focusing on the suppression of erosion [,,]. There is a consensus on the above studies that the leading-edge erosion not only results in the reducing of the energy conversion efficiency of wind turbines but also increasing additional maintenance costs []. The development of leading-edge erosion goes through a process from distributed erosion pits to centralized erosion pits. However, most studies have only analyzed the effect of one type of erosion morphology on the performance of airfoil. The influence of different erosion morphologies on airfoil performance still lacks quantitative analysis.
To provide a theoretical basis for blade protection, the influence of different types of leading-edge erosion morphology on the airfoil performance are studied in this paper. The aerodynamic performance and the flow field around the eroded airfoil at different Reynolds numbers are analyzed using the CFD method. Based on these results, the effects of different types of leading-edge erosion morphology on the lift and drag of the airfoil are obtained. In addition, the relationship between different types of leading-edge erosion morphologies and the stall phenomenon is analyzed.
2. Erosion Type
The variation of airfoil performance under different leading-edge erosion depths and thicknesses is of great significance for the safety and maintenance of turbine blades. According to the depth of the leading-edge erosion morphological features, the erosion is divided into sand holes (0.51 mm), small pits (2.54 mm), and delamination (3.81 mm) []. In wind turbine blades (Vestas V47) that have been working in the desert for 12 years without maintenance [], the severity of the erosion of the leading edge increases towards the blade tip. The blade leading edge has been delaminated at 90% and 95% from the hub, but the depth and width of the delamination at 95% are the largest. At the blade section 85% away from the hub, large pitting corrosion is found at the centre of the leading edge of the airfoil. Figure 1a shows the original geometry of the S823 airfoil. Its chord length c is 152.4 mm and the maximum thickness t is 33.9 mm. On the basis of the erosion characteristics of the blade leading edge in actual operation, five types of eroded airfoil with different erosion levels at the leading edge are established. In the Eroded Airfoil A (EAA), a single small-scale erosion pit is found in the middle of the leading edge. As the erosion develops further, distributed erosion pits begin to appear. Moreover, the erosion morphology of the leading edge develops into the morphology, as displayed by the Eroded Airfoil A1 (EAA1). When the erosion worsens, the small-scale distributed erosion pits and middle erosion pits become connected. Then, large-scale erosion pits are formed in the middle of the leading edge, as displayed in the Eroded Airfoil B (EAB). Subsequently, the distributed erosion pits form again, and the Eroded Airfoil B1 (EAB1) is generated. Finally, a large material spalling is formed by further development of the erosion and the connection of the large-scale erosion pits. Then, the Eroded Airfoil C (EAC) is generated. All of the erosion morphologies are shown in Figure 1.
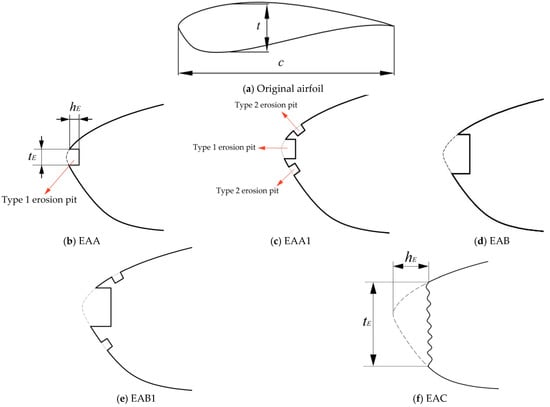
Figure 1.
Original airfoil and leading-edge erosion structure.
For all of the eroded airfoil, the thickness of the erosion is expressed in tE, and the depth of erosion is expressed in hE. The relative erosion thickness is the ratio of the erosion width to the maximum thickness of the airfoil, and the relative erosion depth is the ratio of erosion depth to the chord of the airfoil. Table 1 shows the detailed erosion characteristic data of the leading-edge erosion morphology.

Table 1.
Data of leading-edge erosion morphology.
3. Simulation Method
3.1. Governing Equation and Flow Field Solution Process
The governing equation of the CFD method includes continuity equation, momentum equation, and energy equation. The general form of the governing equation is []:
where ϕ is a universal variable that can represent solving variables such as u, v, w, and T; Γϕ is the generalised diffusion coefficient of general variables; and Sϕ is the generalised source term.
This paper uses the commercial solver ANSYS CFX for the numerical simulation. The geometry is established by UG and the grid is generated by ICEM CFD. The whole CFD solution process adopted in this paper is given in Figure 2. Following the solution process, the aerodynamic performance of the original airfoil and the eroded airfoil are obtained.
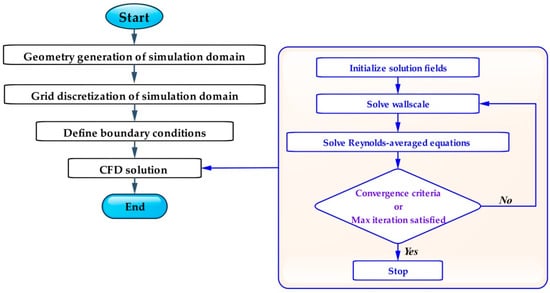
Figure 2.
Flow chart of the CFD simulation.
3.2. Simulation Domain and Mesh
As presented in Figure 3a, the simulation domain is a 2D domain. The simulation domain is composed of a semicircle and a rectangle. The distance between the airfoil leading-edge and the semicircle boundary is 10c. The distance between the trailing edge and the rectangular boundary is 15c, where c is the chord length of the airfoil. The domain in the ANSYS CFX is presented in Figure 3b.
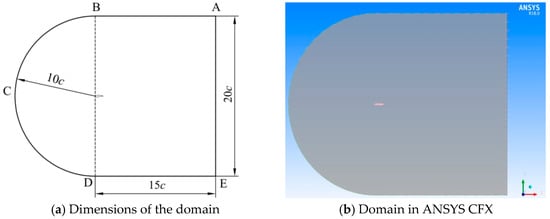
Figure 3.
Simulation domain.
The simulation domain is discretized by a block structured grid. The boundary layer grid at the leading-edge erosion position is encrypted. Thus, the flow details at the erosion position of leading edge and the airfoil wall can be captured accurately. Four sets of grids are generated to carry out the grid independence verification. The detailed grid information is listed in Table 2.
Table 2.
Detailed information of the grids.
The simulation domain is discretized by these four grid schemes respectively. And then the lift and drag coefficients of the original airfoil at Re = 2 × 10⁵ is used as a criterion to determine the independence of grid. The results are given in Figure 4. For the lift and drag coefficient, when the number of grids reaches 363,512, the relative difference between grid scheme 3 and grid scheme 4 is less than 2%. Considering the calculation time, the grid scheme 3 is chosen as the final grid scheme.
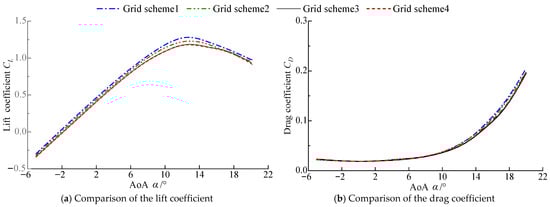
Figure 4.
Grid independence verification.
After grid independence verification, the number of grids is identified as 245,915. The value of y+ on the airfoil wall ranges from 1 to 5, thus satisfying the requirements of the SST k-ω turbulence model. Figure 5 presents the grid around the airfoil.
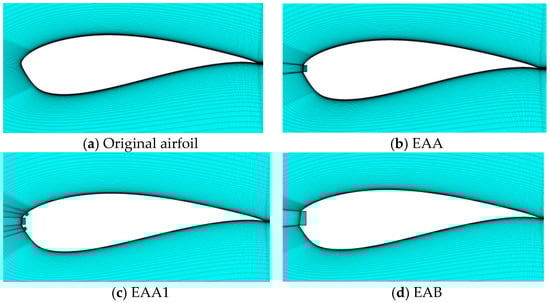
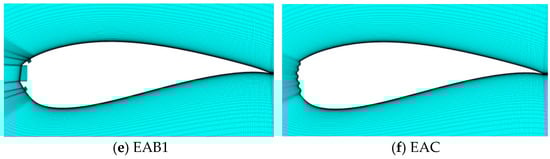
Figure 5.
Grid around the airfoil.
3.3. Boundary Conditions
For the domain shown in Figure 3, line segments AB and DE are defined as the symmetry and semi-arc is defined as the velocity inlet. Line segment AE is defined as the outlet. The inlet velocity is obtained based on the equation of the Reynolds number shown in Equation (2). The flow direction is given on the basis of the angle of attack (AoA). The static pressure at the outlet boundary is 0 Pa. A non-slip boundary condition is applied on the airfoil wall.
where Uin is the free stream velocity and also the inlet velocity of the domain, c is the chord length of the airfoil, ρ is the density of the fluid, and μ is the dynamic viscosity of the fluid.
To solve the governing equations, they must be solved using the turbulence model as a supplementary equation. In this paper, the SST k-ω turbulence model is used to solve the Reynolds averaged Navier–Stokes equations. The SST k-ω turbulence model takes into account the propagation of the turbulent shear stress and accurately predicts the flow separation under adverse pressure gradient [,]. The application of this turbulence model ensures accurate simulation of the stall vortex near the airfoil. Before analyzing the influence of leading-edge erosion on the aerodynamic performance of the S823 airfoil, the simulated aerodynamic performance data of the original airfoil are compared with the experimental data. Figure 6 provides the results of the comparison.
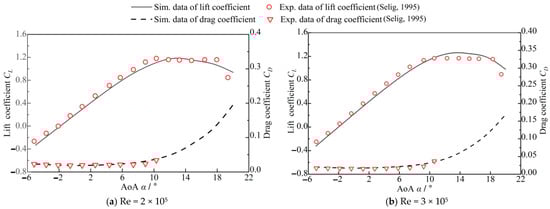
Figure 6.
Lift and drag coefficients of S823 airfoil [].
As presented in Figure 6, the simulation method used in this paper demonstrates a satisfactory performance. The variation trend in the lift and drag coefficients obtained by the numerical simulation are consistent with the experimental data. Within the calculated range of AoA, the lift and drag coefficients are successfully estimated because of the good agreement between the simulation data and experimental data. The result validates that the simulation method adopted in this paper can be used to analyze the effect of leading-edge erosion on the aerodynamic performance of the airfoil.
4. Results and Discussion
Based on the CFD simulation method, the effects of different types of leading-edge erosion on the aerodynamic performance of the airfoil are analyzed.
4.1. Lift and Drag Coefficients
According to the CFD simulation, the aerodynamic performance of five different types of eroded airfoil is obtained for Reynolds numbers of 200,000 and 300,000, respectively. The performance of each type of eroded airfoil is compared with that of the original airfoil in Figure 7.
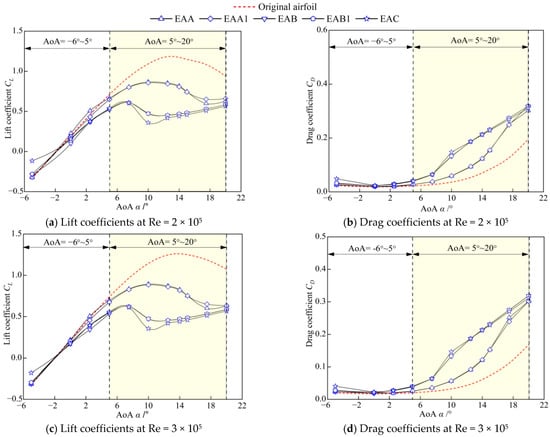
Figure 7.
Comparison of the aerodynamic performance between the original and eroded airfoils.
As shown in Figure 7, when AoA is lower than 5°, the difference in lift coefficients between EAA, EAA1, and the original airfoil is relatively small. The maximum deviation of the lift coefficient between EAA and the original airfoil is 14.45%. The same deviation is 8.8% between EAA1 and the original airfoil. They all occurred at Reynolds numbers equal to 2 × 10⁵. Compared with the original airfoil, the maximum increment of the drag coefficient of the EAA and EAA1 are 22.6% and 25.6%, respectively. It follows that the difference in drag coefficients between EAA, EAA1, and the original airfoil is greater than the difference in the lift coefficient.
With AoA greater than 5°, the leading-edge erosion results in a significant reduction in lift coefficient and an increase in the drag coefficient. This phenomenon becomes significant when the erosion thickness tE increases. In Figure 7a,c, the critical stall AoA of EAA and EAA1 is 10°, and the critical stall AoA of EAB, EAB1, and EAC has been moved forward to 7.5°. They are all smaller than the critical stall angle of the original airfoil. Therefore, an increase in erosion thickness tE inevitably causes the critical stall AoA of the airfoil to move forward, which reduces the effective working range of the airfoil. However, the lift and drag coefficient of EAA and EAA1 is similar. The same applies to EAB and EAB1. Because the erosion thickness tE of EAA and EAA1 is the same, this is also true for EAB and EAB1. Thus, it is revealed that the Type 1 erosion pit at the center of the leading edge is the main factor affecting the aerodynamic performance of airfoils.
To quantitatively analyze the effect of leading-edge erosion on the aerodynamic performance of airfoil, this paper calculates the deviation rate of the aerodynamic performance coefficient between the eroded airfoil and the original airfoil. The deviation rate is calculated using Equation (3). The deviation rates of the aerodynamic performance for each type of eroded airfoil are presented in Figure 8.
where xa is the aerodynamic performance of the original airfoil and xb is the aerodynamic performance of the eroded airfoil.
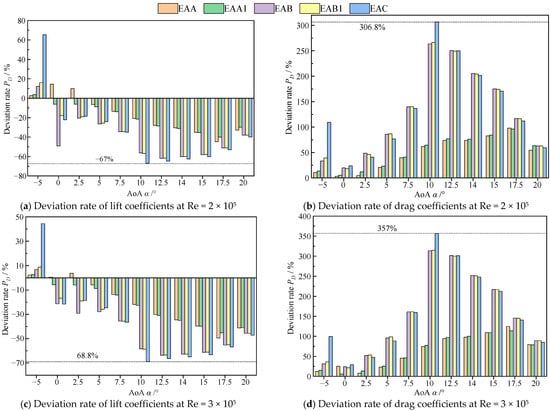
Figure 8.
Performance deviation between the eroded and original airfoil.
As shown in Figure 8a,c, the maximum reduction rate in the lift coefficient of the eroded airfoils is 67% at Re = 2 × 10⁵ and 68.8% at Re = 3 × 10⁵. The largest deviations in lift coefficients for both Reynolds number cases are caused by EAC. The distribution of the deviation rate indicates that the deviation rate of the aerodynamic performance coefficient is basically the same in EAA and EAA1. Moreover, the deviation rate of the aerodynamic performance coefficient is basically the same in EAB and EAB1. Hence, the erosion morphology in the middle of the leading edge is the key factor determining the decrease in the lift coefficient. The distributed erosion pits have little effect on the aerodynamic performance coefficient of the airfoil.
At the condition of AoA = −5°, the lift coefficient of the eroded airfoil is increased compared with that of the original airfoil. Firstly, the lift coefficients of all airfoils are negative at this condition. Then, the eroded airfoil has only a small absolute value for its lift coefficient at this condition due to the leading-edge erosion. However, a negative lift coefficient with a large absolute value is generated by the original airfoil at this condition. Therefore, the lift coefficient of the original airfoil is smaller than that of the eroded airfoil at a negative AoA.
In Figure 8b,d, the maximum promotion rate of the drag coefficient of the eroded airfoil is 306.8% at Re = 2 × 10⁵ and 357% at Re = 3 × 10⁵. The drag coefficient of the eroded airfoil is raised by more than 50% when the AoA is greater than 10°. Thus, the drag coefficient deteriorates more severely than the lift coefficient after the leading edge of the airfoil is eroded. This phenomenon validates that the influence of the leading-edge erosion is more significant on the drag coefficient than on the lift coefficient. The dramatic rise in the drag coefficient also becomes the main source for the deterioration of the aerodynamic performance of eroded airfoil.
4.2. Pressure Distribution around the Airfoil
As mentioned above, the critical stall AoA of the eroded airfoil is 7.5° and 10°. At the critical stall condition, the aerodynamic performance of the airfoil deteriorates. The most significant phenomenon is that the lift coefficient begins to decrease. The lift force of the airfoil is derived from the pressure difference in the airfoil. Hence, the reason for the drop in the lift coefficient can be elucidated by analyzing the pressure distribution change. Taking the airfoil working at Re = 300,000 as the object, the pressure distributions on the airfoil at AoA equal to 7.5°, 10°, and 15° are presented in Figure 9.
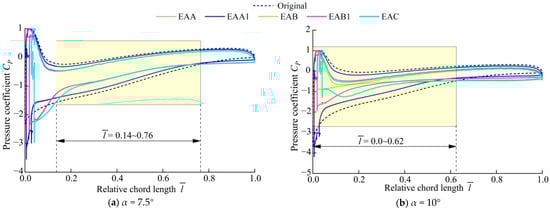
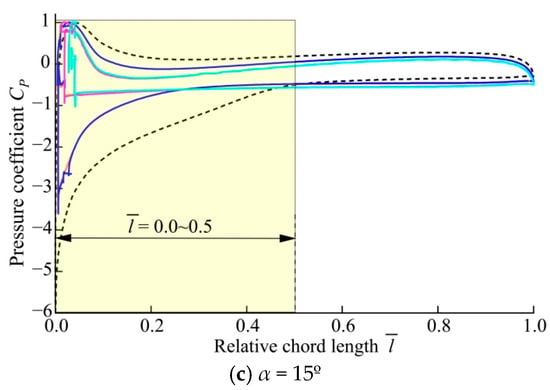
Figure 9.
Pressure distributions on the airfoil.
In Figure 9a, within the range of the relative chord length of 0.14–0.76, the pressure difference between the suction and pressure surfaces of the eroded airfoil is significantly reduced compared with the original airfoil. Severe pressure difference reductions occur in EAB, EAB1 and EAC. A similar situation is presented in Figure 9b. The relative chord length range in which the pressure difference decreases is from 0.0 to 0.62. Figure 9c shows a similar situation. Within the range of relative chord length of 0.0–0.5, the pressure difference of the eroded airfoil is sharply reduced. The pressure difference for the eroded airfoil is greatly different from that for the original airfoil. Thus, the lift in the eroded airfoil must be much lower than that of the original airfoil. Figure 10 shows the pressure around the eroded and original airfoil at the condition of AoA = 10°.
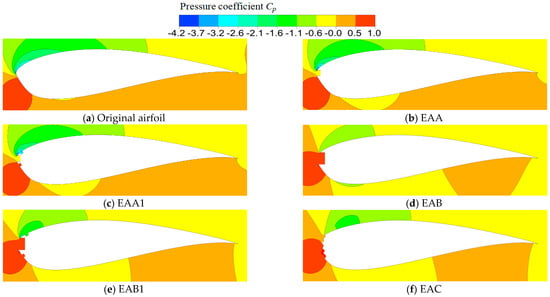
Figure 10.
Pressure around the original and erosion airfoil (α = 10°, Re = 3 × 10⁵).
In Figure 10, with the aggravation of erosion, the high-pressure region located at the leading edge of the airfoil suction side gradually transfers to the centre of the airfoil leading-edge. This transfer phenomenon causes the pressure difference at the leading edge to decrease, resulting in a drop in the lift coefficient.
4.3. Analysis of Flow Characteristics
To examine the relationship between the leading-edge erosion and the stall vortex, the flow field around the airfoil at the conditions of Re = 3 × 10⁵ is given in Figure 11a. Compared with the original airfoil, the critical stall AoA of the five types of eroded airfoil are moved forward. When AoA reaches 15°, the original airfoil and the eroded airfoil work in a deep stall state. At this moment, a pair of reverse stall vortexes is formed at the trailing edge of the airfoil, which results in severe deterioration of the aerodynamic performance. For all of the eroded airfoil, flow separation first appears at the tailing edge of EAB, EAB1, and EAC. With the increase in AoA, the separation flow becomes more severe and results in the expansion of the separation vortex. For the condition of AoA = 10°, the scale of the stall vortex caused by EAB and EAC is significantly expanded, while the stall vortex caused by the other airfoils is still attached on the tailing edge of the airfoil. With the further increase in AoA, the stall vortex begins to depart from the airfoil surface. Especially for EAB, EAB1, and EAC, the stall vortex has occupied a large area near the suction side of the airfoil.
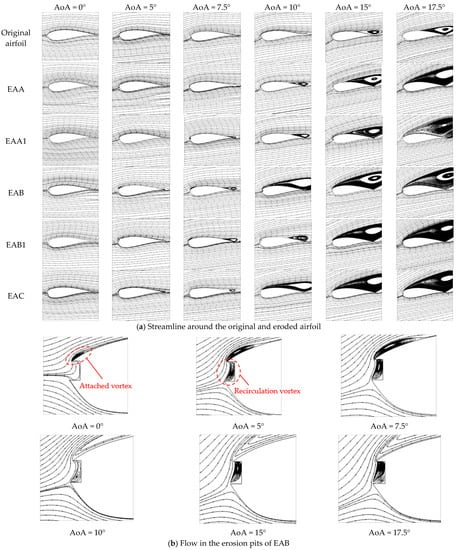
Figure 11.
Streamline around the airfoil at different AoA (Re = 3 × 10⁵).
Figure 11b shows evident vortices in the erosion pits at the leading edge. It can be found that a recirculation vortex was formed in the erosion pit. This vortex will result in further rotation of the sand particles and will enlarge the relative erosion thickness of the erosion pits. Furthermore, an attached vortex is formed downstream of the center erosion pit. The scale of this attached vortex increases with AoA. When AoA is greater than 10°, this attached vortex is fused into the stall vortex to form a large-scale vortex area, and then deteriorates the lift coefficient of the airfoil.
5. Conclusions
In this paper, the influence of different degrees of erosion for the leading edge on the aerodynamic performance and flow characteristics of the wind turbine airfoil are investigated. Several conclusions can be obtained, as follows:
(1) At different Reynolds numbers, the aerodynamic performance coefficients deteriorated significantly with the increase in relative erosion thickness. Therefore, the relative erosion thickness is the primary factor that results in performance deterioration.
(2) The deterioration of drag coefficient caused by leading-edge erosion is much greater than that of the lift coefficient. The most abrasive airfoil EAC can make the drag coefficient 357% higher than that of the original airfoil. Therefore, the sharp rise in the drag coefficient due to leading-edge erosion is the main reason for the deterioration of the airfoil aerodynamic performance.
(3) The reduction in pressure difference between the airfoil pressure and the suction side is the main reason for the drop in the eroded airfoil lift coefficient. In addition, the critical stall AoA would be moved forward because of the leading-edge erosion, thereby reducing the effective working region of the airfoil.
Author Contributions
X.W.: methodology, writing—original draft, writing—review and editing. Z.T.: writing—original draft. N.Y.: data curation, investigation. G.Z.: writing—original draft, investigation. All authors have read and agreed to the published version of the manuscript.
Funding
This research was supported by the National Key R&D Program of China (grant no. 2018YFB1501900).
Institutional Review Board Statement
Not applicable.
Informed Consent Statement
Not applicable.
Data Availability Statement
Not applicable.
Conflicts of Interest
The authors declare no conflict of interest.
References
- Junlei, C.; Jihui, W.; Aiqing, N. A review on rain erosion protection of wind turbine blades. J. Coat. Technol. Res. 2019, 16, 15–24. [Google Scholar]
- Deshun, L.; Chengze, W.; Yinran, L. Numerical simulation of wind turbine blade erosion in sandy environment. Acta Energ. Sol. Sin. 2018, 3, 627–632. [Google Scholar]
- Yan, W.; Ruifeng, H.; Ping, W. Research on the aerodynamicand flow field characteristics of s809 airfoil based on the leading edge erosion modeling. Acta Energ. Sol. Sin. 2017, 38, 607–615. [Google Scholar]
- Han, W.; Kim, J.; Kim, B. Effects of contamination and erosion at the leading edge of blade tip airfoils on the annual energy production of wind turbines. Renew. Energy 2018, 115, 817–823. [Google Scholar] [CrossRef]
- Im, H.; Kim, B. Numerical study on the effect of blade surface deterioration by erosion on the performance of a large wind turbine. J. Renew. Sustain. Energy 2019, 11, 063308. [Google Scholar] [CrossRef]
- Bartolomé, L.; Teuwen, J. Prospective challenges in the experimentation of the rain erosion on the leading edge of wind turbine blades. Wind. Energy 2019, 22, 140–151. [Google Scholar] [CrossRef]
- Dai, L.; Yao, S.; Wang, X.; Kang, S. Numerical investigation of wind turbine blades erosion characteristics impacted by air flow containing sand particles. Acta Energ. Sol. Sin. 2018, 39, 247–252. [Google Scholar]
- Sareen, A.; Sapre, C.A.; Selig, M.S. Effects of leading edge erosion on wind turbine blade performance. Wind. Energy 2014, 17, 1531–1542. [Google Scholar] [CrossRef]
- Mingwei, G.; Huan, Z.; Ying, W. Effects of leading edge defects on aerodynamic performance of the S809 airfoil. Energy Convers. Manag. 2019, 195, 466–479. [Google Scholar]
- Li, D.; Wang, C.; Li, Y.; Li, R.; Zhao, Z.; Chen, X. Influence of blade leading edge erosion features on aerodynamic characteristics of wind turbine airfoil. Trans. Chin. Soc. Agric. Eng. 2017, 33, 269–275. [Google Scholar]
- Ravishankara, A.K.; Ozdemir, H.; van der Weide, E. Analysis of leading edge erosion effects on turbulent flow over airfoils. Renew. Energy 2021, 172, 765–779. [Google Scholar] [CrossRef]
- Cappugi, L.; Castorrini, A.; Bonfiglioli, A.; Minisci, E.; Campobasso, M.S. Machine learning-enabled prediction of wind turbine energy yield losses due to general blade leading edge erosion. Energy Convers. Manag. 2021, 245, 114567. [Google Scholar] [CrossRef]
- Pathak, S.M.; Kumar, V.P.; Bonu, V.; Latha, S.; Mishnaevsky, L., Jr.; Lakshmi, R.V.; Bera, P.; Barshilia, H.C. Solid particle erosion studies of ceramic oxides reinforced water-based PU nanocomposite coatings for wind turbine blade protection. Ceram. Int. 2022. [Google Scholar] [CrossRef]
- Zhu, C.; Qiu, Y.; Feng, Y.; Wang, T.; Li, H. Combined effect of passive vortex generators and leading-edge roughness on dynamic stall of the wind turbine airfoil. Energy Convers. Manag. 2022, 251, 115015. [Google Scholar] [CrossRef]
- Kuthe, N.; Mahajan, P.; Ahmad, S.; Mishnaevsky, L., Jr. Engineered anti-erosion coating for wind turbine blade protection: Computational analysis. Mater. Today Commun. 2022, 31, 103362. [Google Scholar] [CrossRef]
- Mishnaevsky, L., Jr.; Hasager, C.B.; Bak, C.; Tilg, A.M.; Bech, J.I.; Rad, S.D.; Fæster, S. Leading edge erosion of wind turbine blades: Understanding, prevention and protection. Renew. Energy 2021, 169, 953–969. [Google Scholar] [CrossRef]
- Herring, R.; Dyer, K.; Martin, F.; Ward, C. The increasing importance of leading edge erosion and a review of existing protection solutions. Renew. Sustain. Energy Rev. 2019, 115, 109382. [Google Scholar] [CrossRef]
- Tao, W. Numerical Heattransfer, 2nd ed.; Xi’an JiaoTong University Press: Xi’an, China, 2001; pp. 5–6. [Google Scholar]
- Zhang, J.; Yuan, Q.; Cong, W.U.; Wang, M. Numerical Simulation on the Effect of Surface Roughness for Large Wind Turbine Blades. Proc. CSEE 2014, 34, 3384–3391. [Google Scholar]
- Al Jubori, A.; Daabo, A.; Al-Dadah, R.K.; Mahmoud, S.; Ennil, A.B. Development of micro-scale axial and radial turbines for low-temperature heat source driven organic Rankine cycle. Energy Convers. Manag. 2016, 130, 141–155. [Google Scholar] [CrossRef]
- Selig, M.S.; Guglielmo, J.J.; BROEREN, A.P.; Giguere, P. Summary of Low Speed Airfoil Data; SOARTECH Publications: Ann Arbor, MI, USA, 1995. [Google Scholar]
Publisher’s Note: MDPI stays neutral with regard to jurisdictional claims in published maps and institutional affiliations. |
© 2022 by the authors. Licensee MDPI, Basel, Switzerland. This article is an open access article distributed under the terms and conditions of the Creative Commons Attribution (CC BY) license (https://creativecommons.org/licenses/by/4.0/).