
Land-Cover-Change Detection with Aerial Orthoimagery Using SegNet-Based Semantic Segmentation in Namyangju City, South Korea

 , ,
, , 
Abstract
:1. Introduction
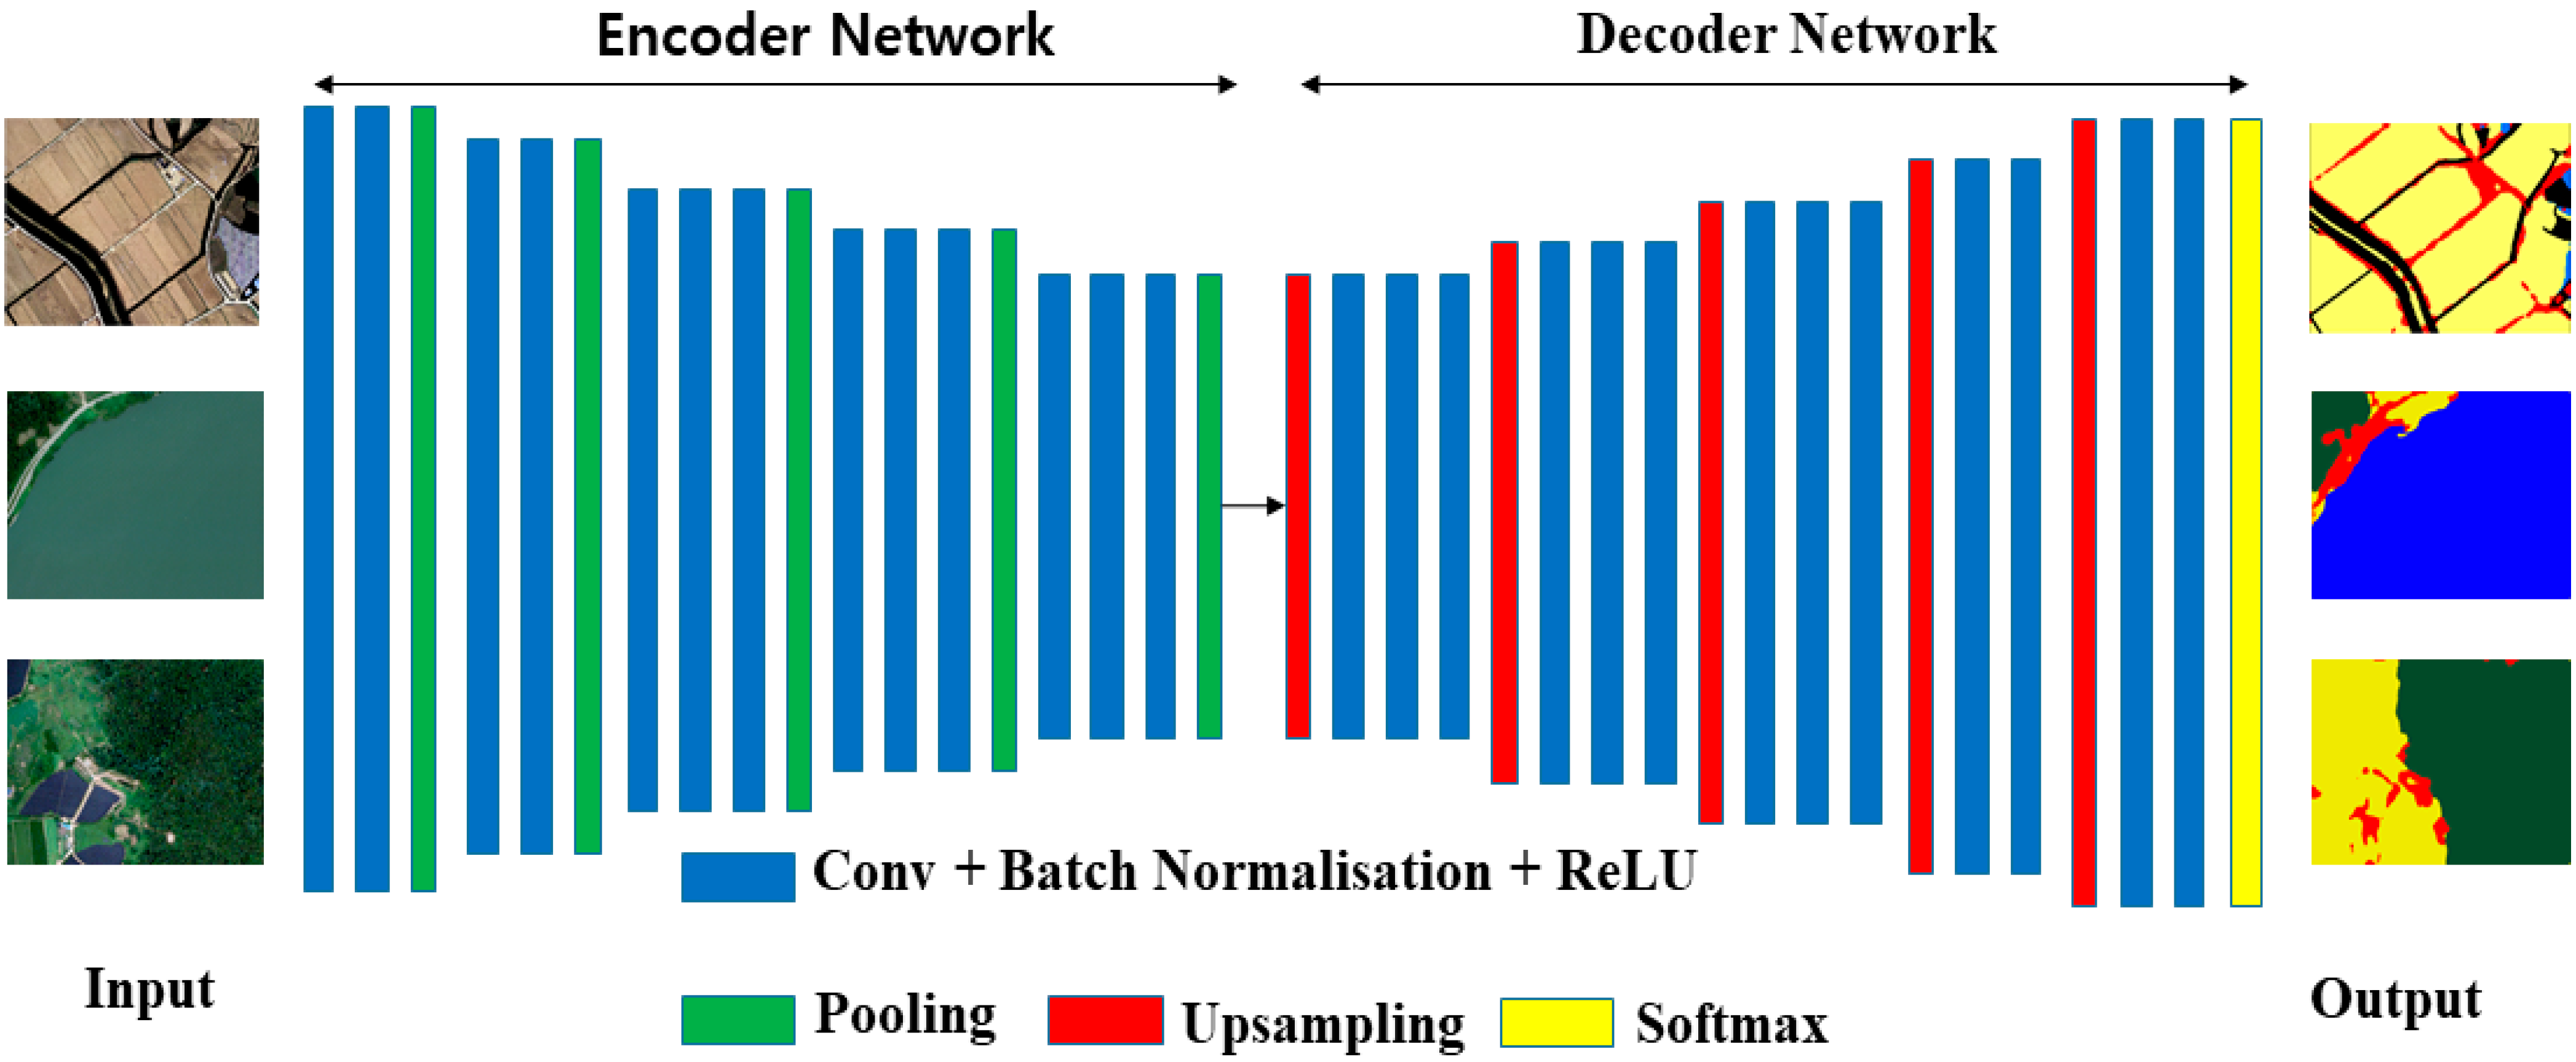
2. Methodology
2.1. Land-Cover Classification
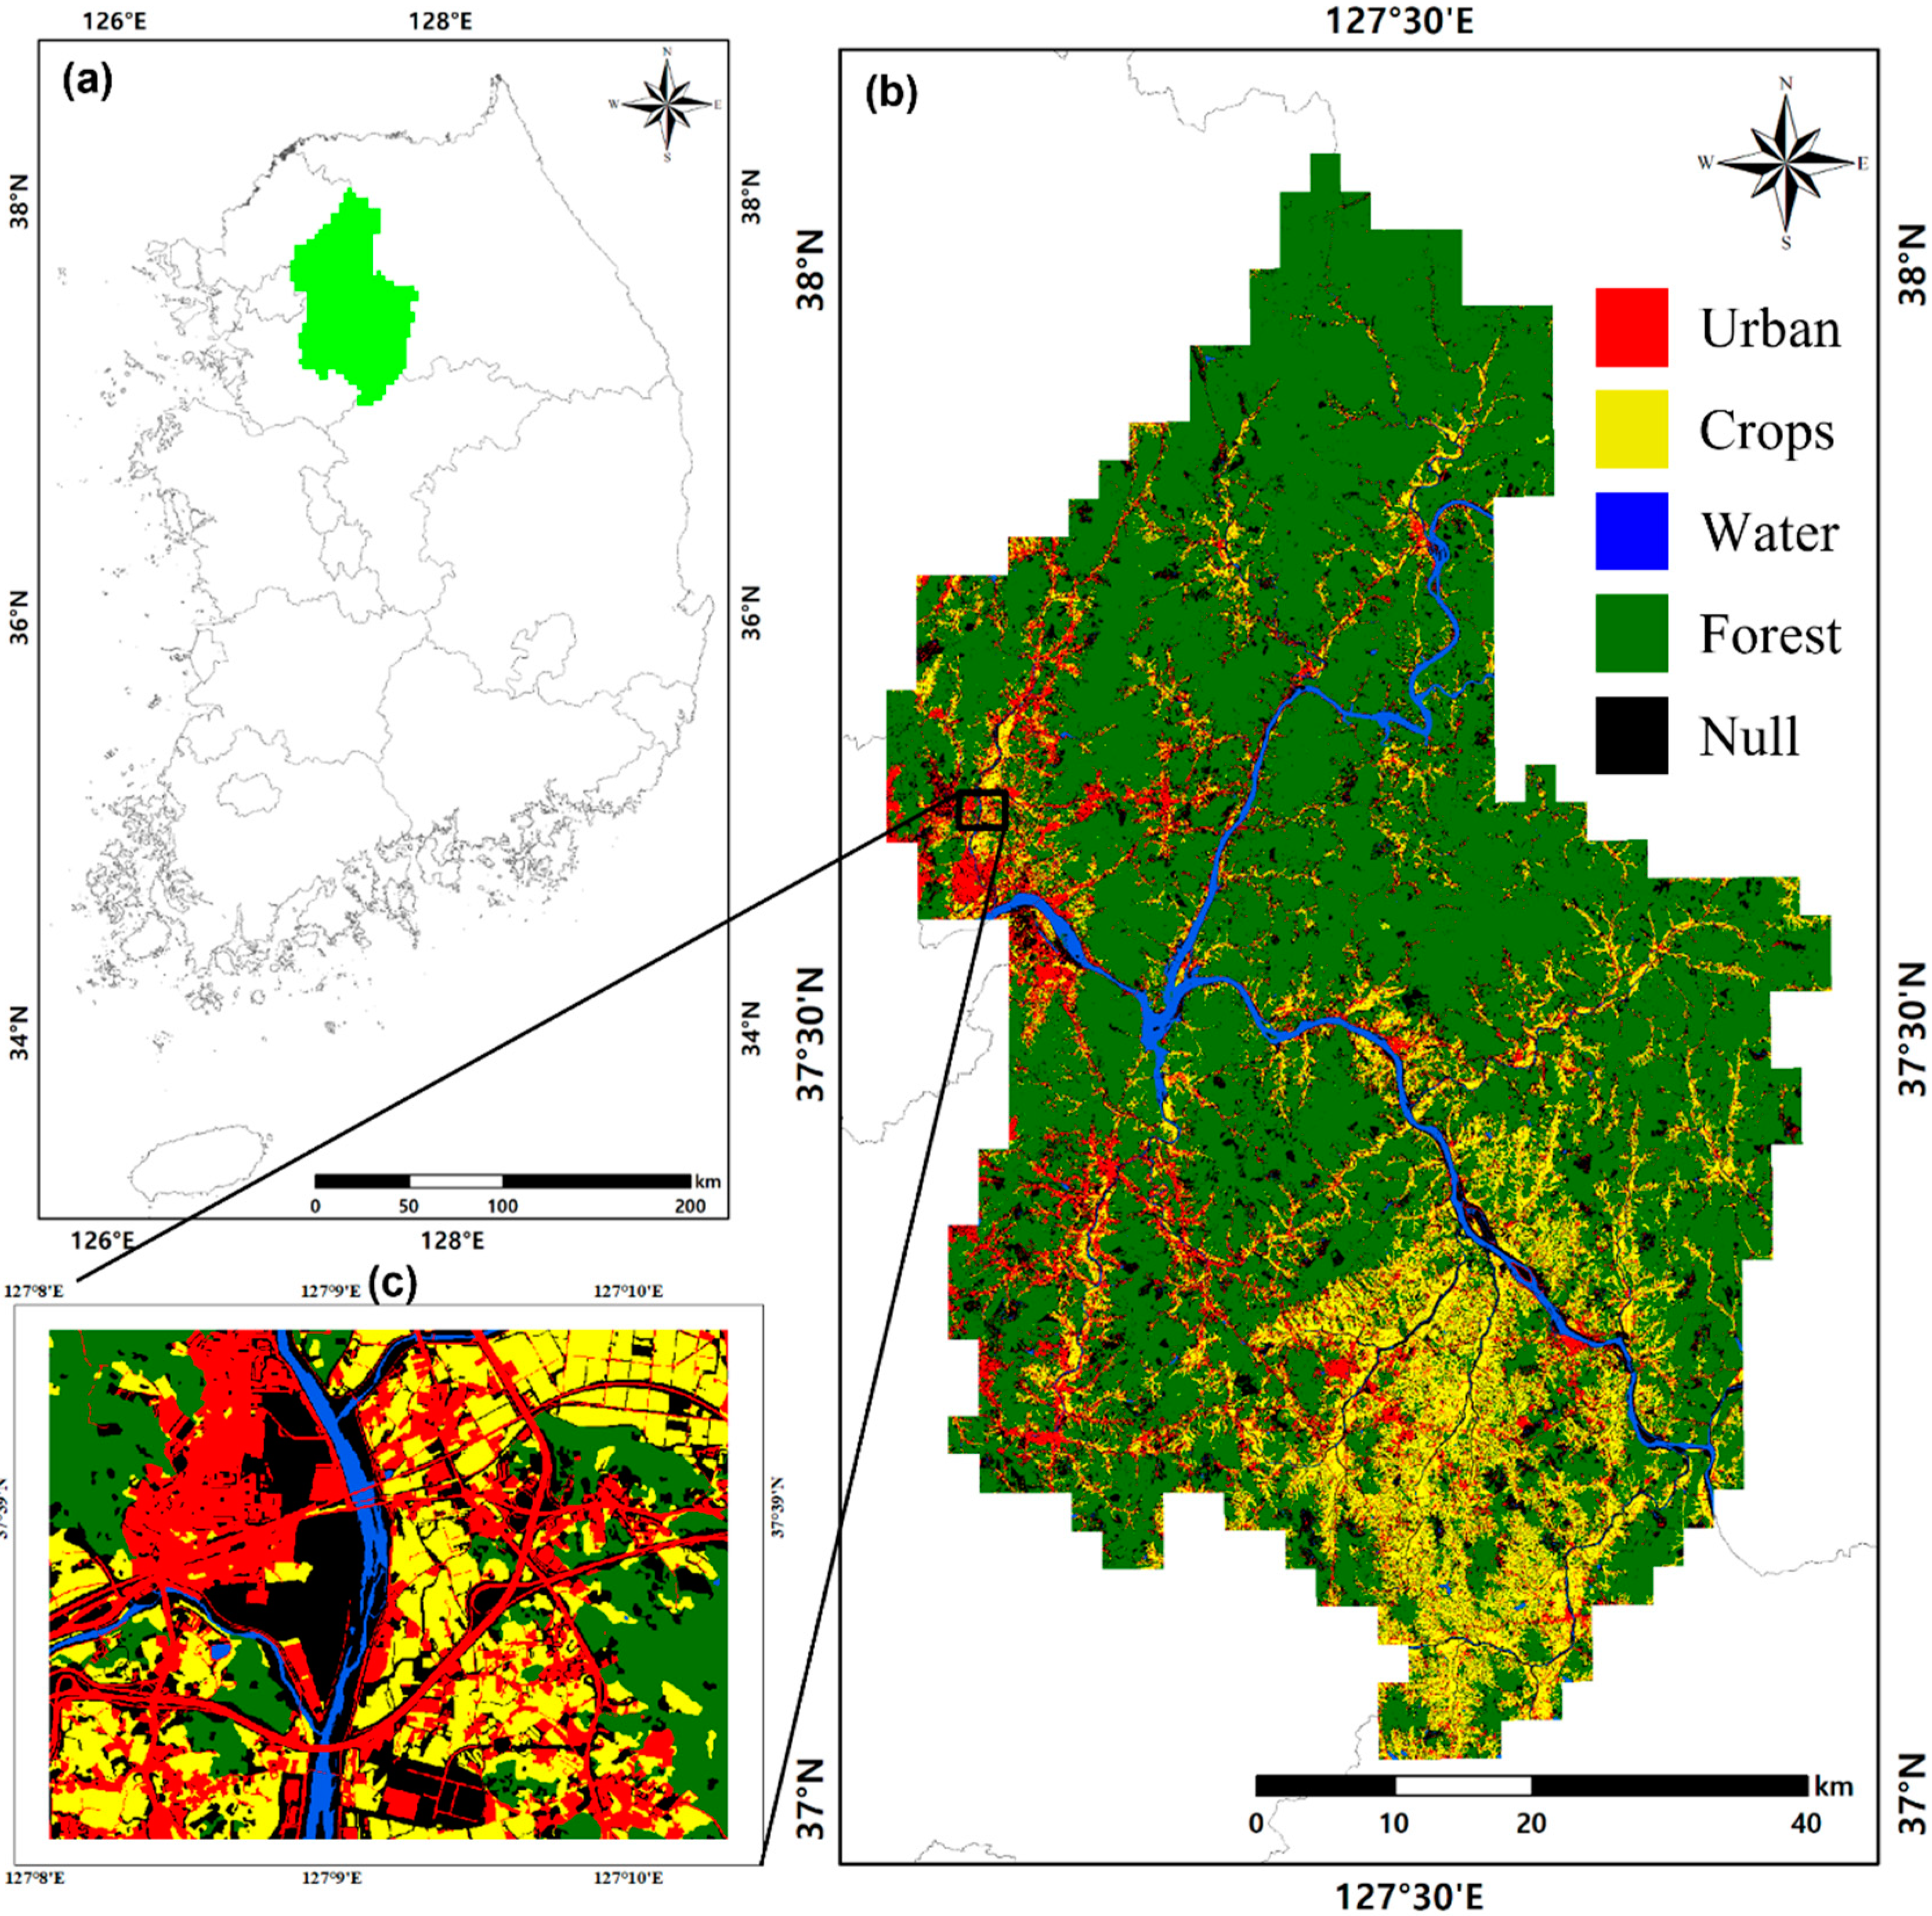
2.2. Study Area and Datasets
3. Results
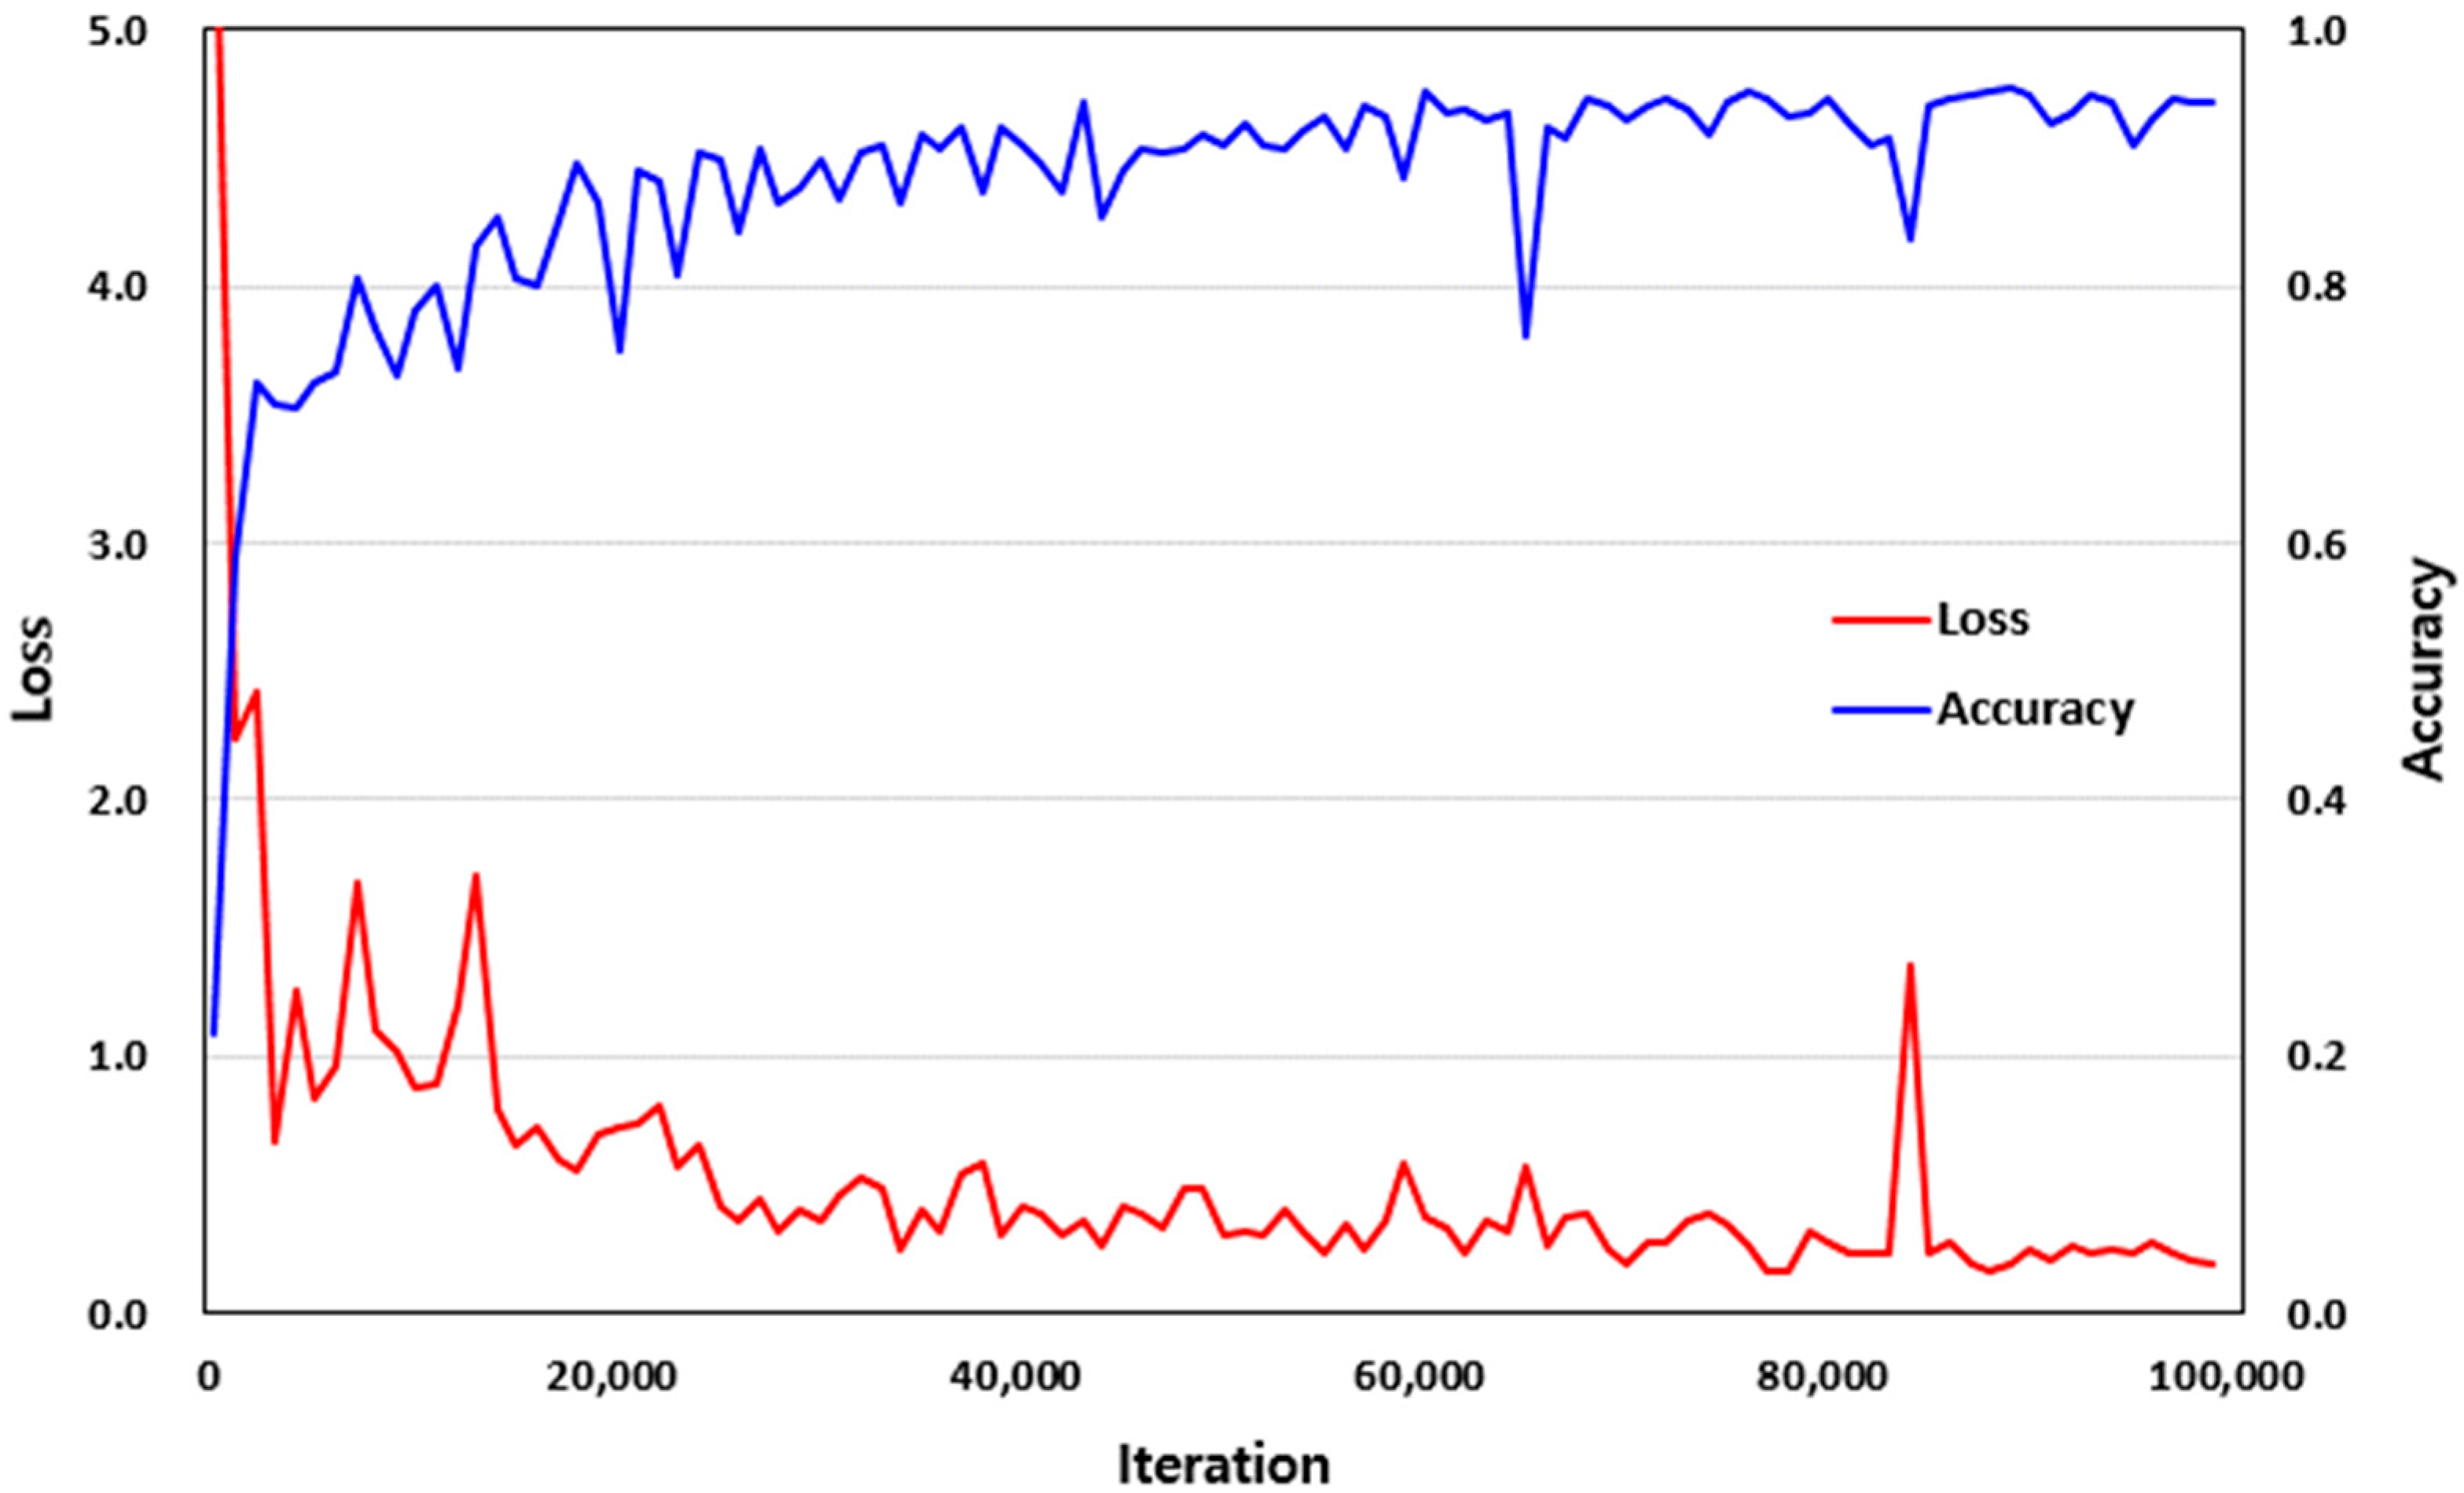
3.1. Hyperparameters
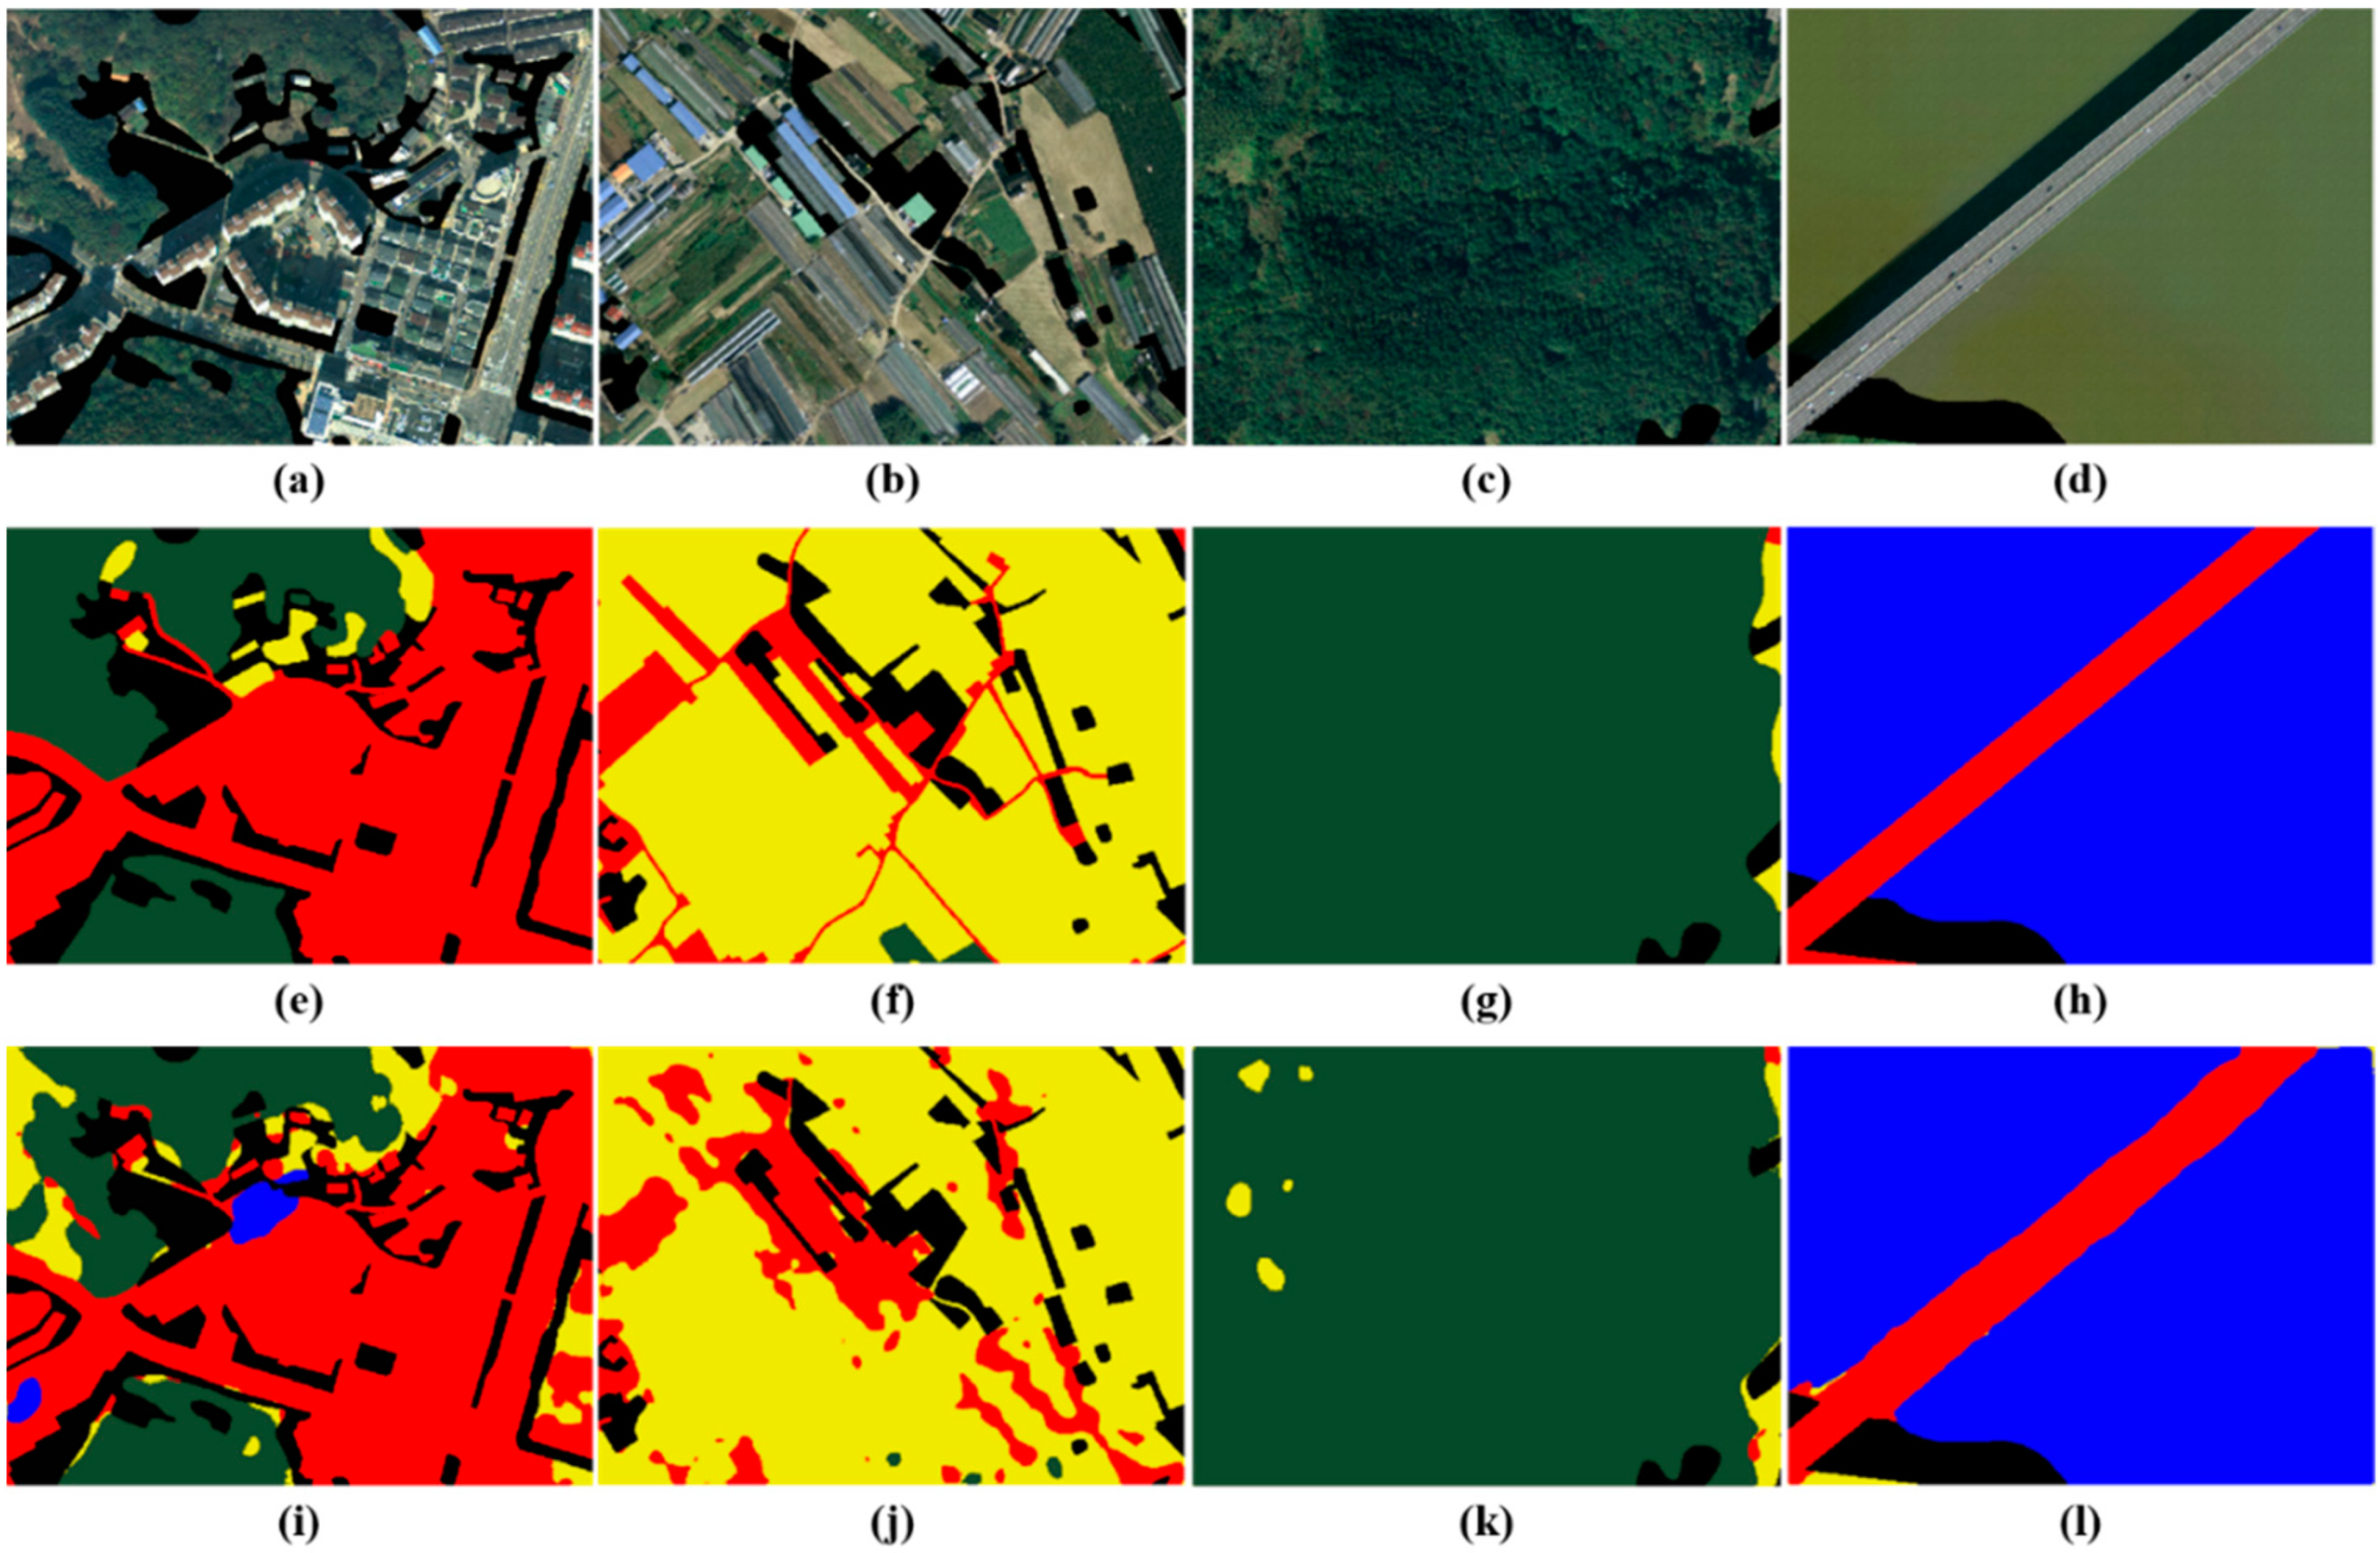
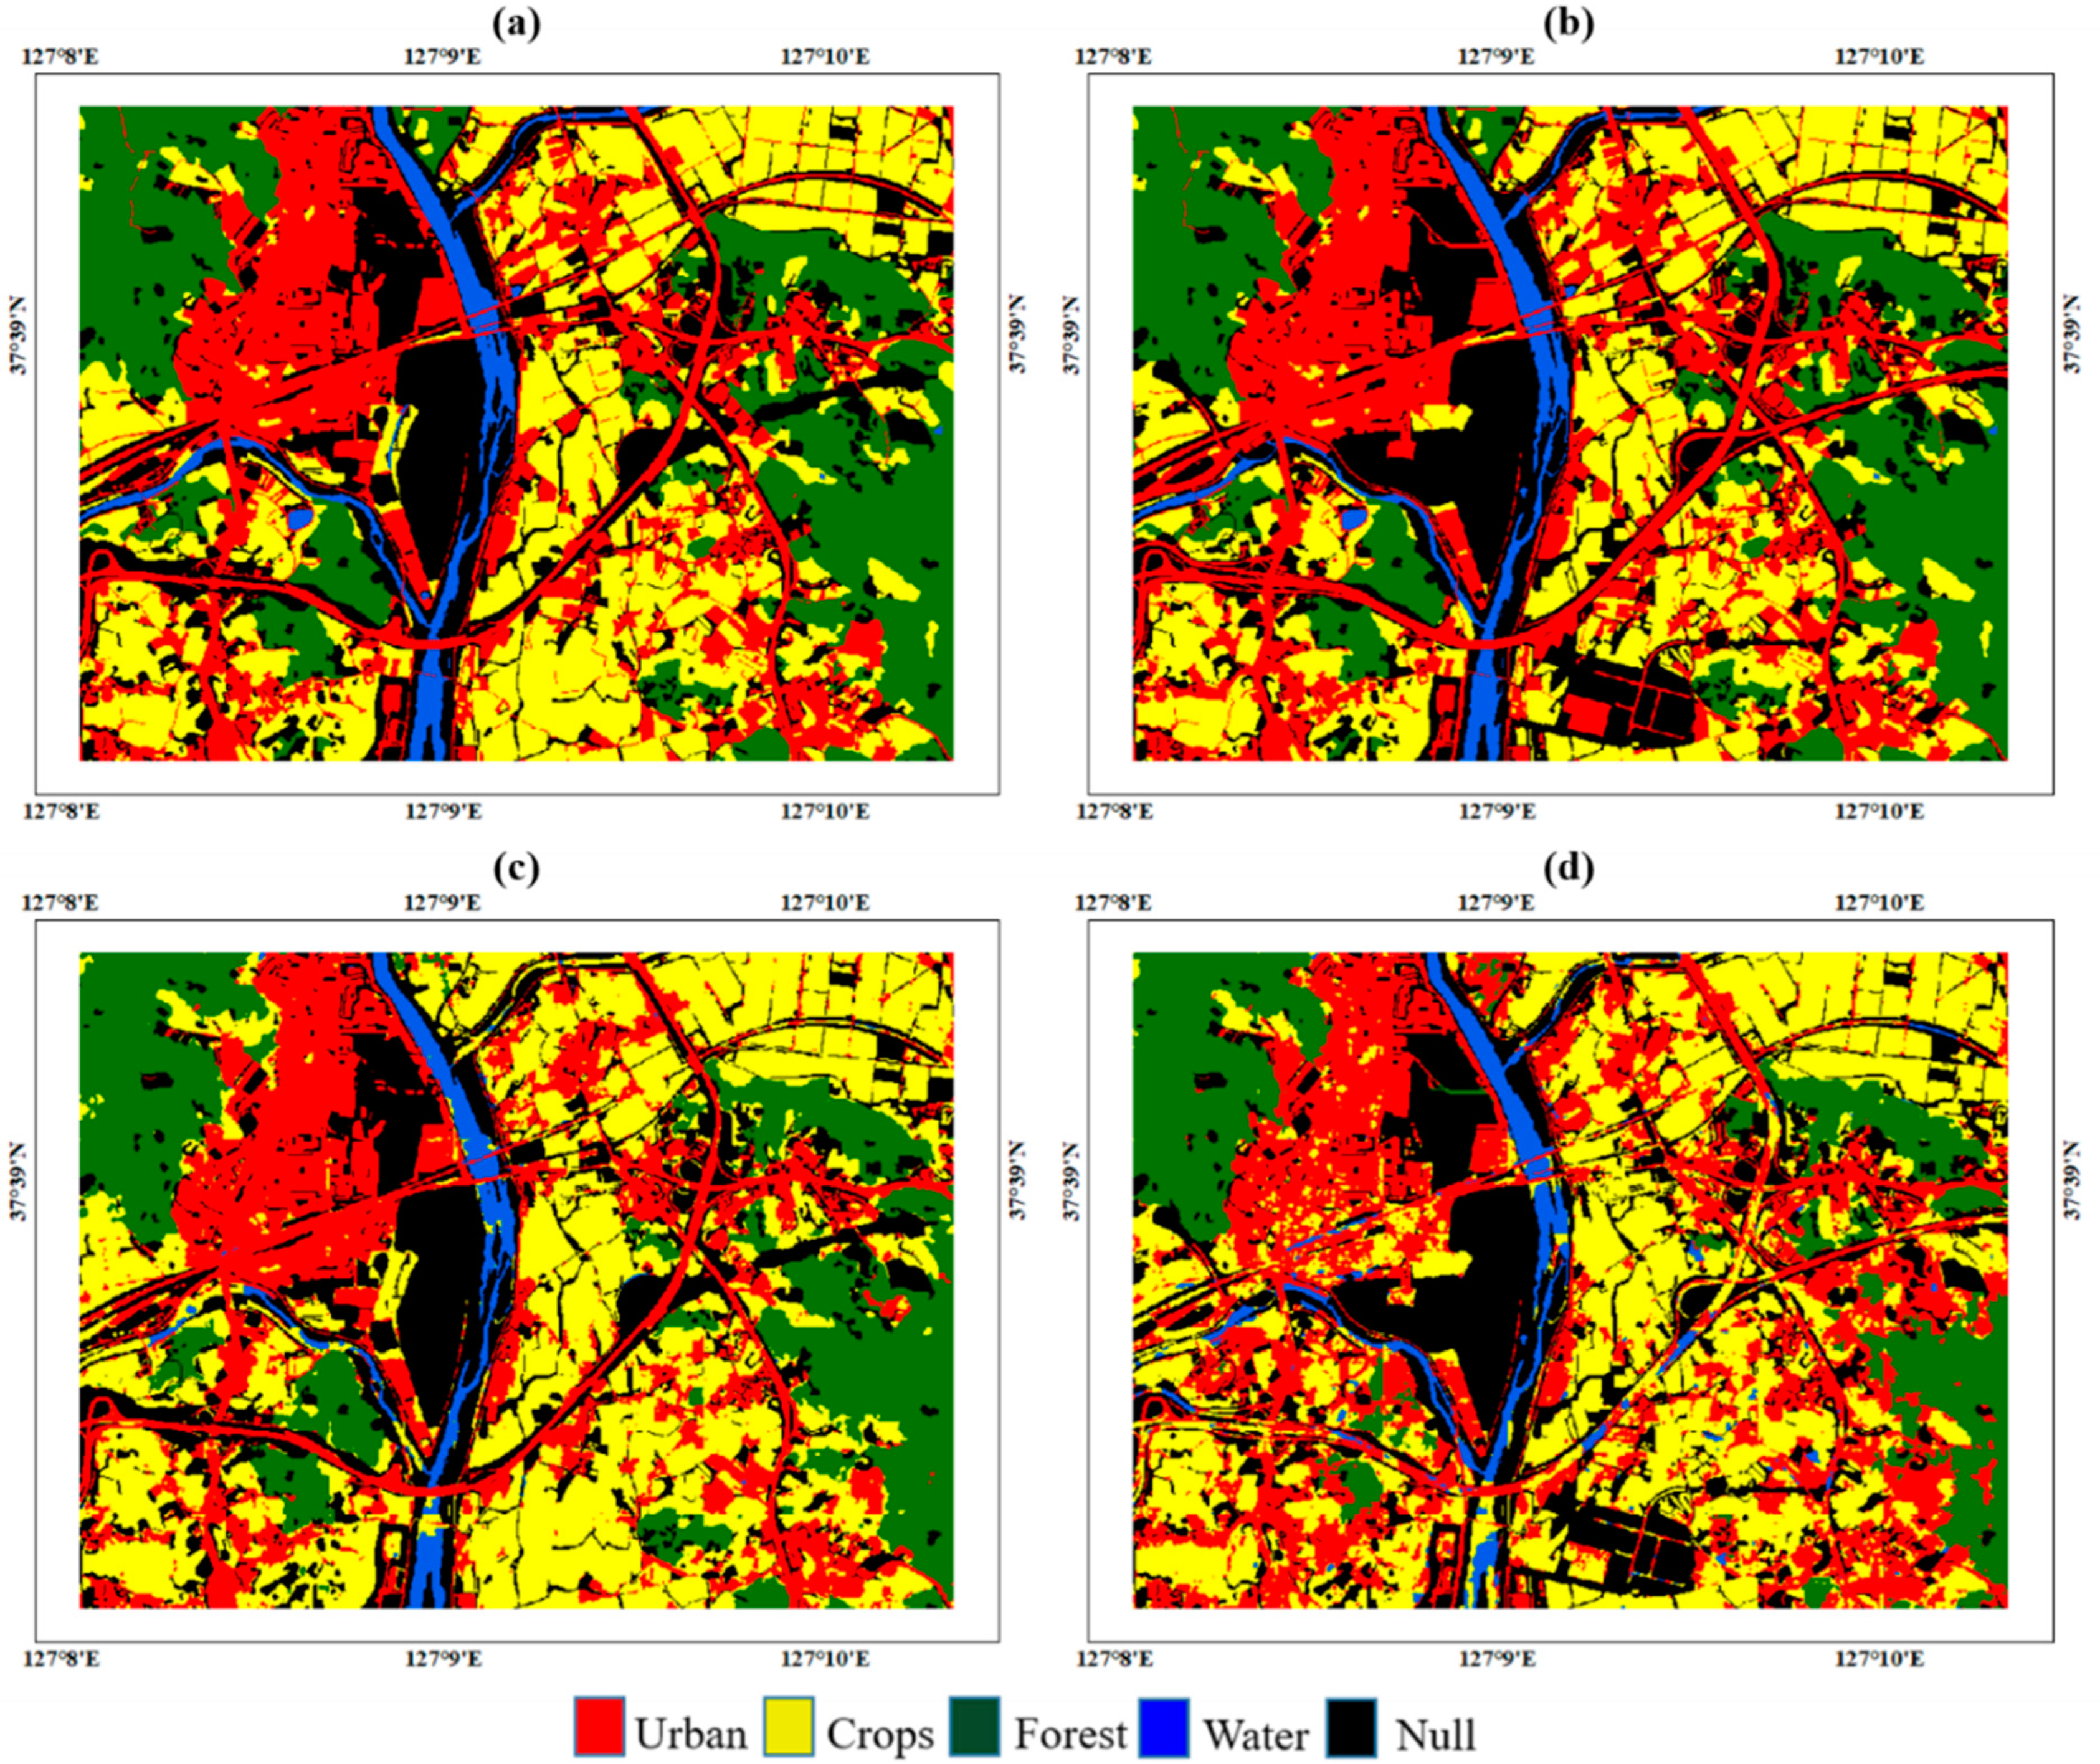
3.2. Land-Cover Classification
3.3. Land-Cover-Change Detection
4. Discussion
5. Conclusions
Author Contributions
Funding
Institutional Review Board Statement
Informed Consent Statement
Conflicts of Interest
References
- Kaul, H.A.; Sopan, I. LULC classification and change detection using high resolution temporal satellite data. J. Environ. 2012, 1, 146–152. [Google Scholar]
- Zhu, Z.; Woodcock, C.E. Continuous change detection and classification of land cover using all available Landsat data. Remote Sens. Environ. 2014, 144, 152–171. [Google Scholar] [CrossRef]
- Alemu, B.; Garedew, E.; Eshetu, Z.; Kassa, H. Land use and land cover changes and associated driving forces in north western lowlands of Ethiopia. Int. Res. J. Agric. Sci. Soil Sci. 2015, 5, 28–44. [Google Scholar]
- Olorunfemi, I.E.; Fasinmirin, J.T.; Olufayo, A.A.; Komolafe, A.A. GIS and remote sensing-based analysis of the impacts of land use/land cover change (LULCC) on the environmental sustainability of Ekiti State, southwestern Nigeria. Environ. Dev. Sustain. 2020, 22, 661–692. [Google Scholar] [CrossRef]
- Chen, J.; Gong, P.; He, C.; Pu, R.; Shi, P. Land-use/land-cover change detection using improved change-vector analysis. Photogramm. Eng. Remote Sens. 2003, 69, 369–379. [Google Scholar] [CrossRef]
- Yirsaw, E.; Wu, W.; Shi, X.; Temesgen, H.; Bekele, B. Land use/land cover change modeling and the prediction of subsequent changes in ecosystem service values in a coastal area of China, the Su-Xi-Chang Region. Sustainability 2017, 9, 1204. [Google Scholar] [CrossRef]
- Hussain, S.; Lu, L.; Mubeen, M.; Nasim, W.; Karuppannan, S.; Fahad, S.; Tariq, A.; Mousa, B.G.; Mumtaz, F.; Aslam, M. Spatiotemporal variation in land use land cover in the response to local climate change using multispectral remote sensing data. Land 2022, 11, 595. [Google Scholar] [CrossRef]
- Hussain, S.; Mubeen, M.; Karuppannan, S. Land use and land cover (LULC) change analysis using TM, ETM+ and OLI Landsat images in district of Okara, Punjab, Pakistan. Phys. Chem. Earth Parts A/B/C 2022, 126, 103117. [Google Scholar] [CrossRef]
- DeFries, R.S.; Townshend, J.R.G. NDVI-derived land cover classifications at a global scale. Int. J. Remote Sens. 1994, 15, 3567–3586. [Google Scholar] [CrossRef]
- Hansen, M.C.; DeFries, R.S.; Townshend, J.R.; Sohlberg, R. Global land cover classification at 1 km spatial resolution using a classification tree approach. Int. J. Remote Sens. 2020, 21, 1331–1364. [Google Scholar] [CrossRef]
- Loveland, T.R.; Reed, B.C.; Brown, J.F.; Ohlen, D.O.; Zhu, Z.; Yang, L.W.M.J.; Merchant, J.W. Development of a global land cover characteristics database and IGBP DISCover from 1 km AVHRR data. Int. J. Remote Sens. 2020, 21, 1303–1330. [Google Scholar] [CrossRef]
- Belward, A.S.; Skøien, J.O. Who launched what, when and why; trends in global land-cover observation capacity from civilian earth observation satellites. ISPRS J. Photogramm. Remote Sens. 2015, 103, 115–128. [Google Scholar] [CrossRef]
- Gómez, C.; White, J.C.; Wulder, M.A. Optical remotely sensed time series data for land cover classification: A review. ISPRS J. Photogramm. Remote Sens. 2016, 116, 55–72. [Google Scholar] [CrossRef]
- Vogelmann, J.E.; Howard, S.M.; Yang, L.; Larson, C.R.; Wylie, B.K.; Van Driel, N. Completion of the 1990s National Land Cover Data Set for the conterminous United States from Landsat Thematic Mapper data and ancillary data sources. Photogramm. Eng. Remote Sens. 2001, 67, 650–655, 657–659, 661–662. [Google Scholar]
- Wulder, M.A.; White, J.C.; Goward, S.N.; Masek, J.G.; Irons, J.R.; Herold, M.; Cohen, W.B.; Loveland, T.R.; Woodcock, C.E. Landsat continuity: Issues and opportunities for land cover monitoring. Remote Sens. Environ. 2008, 112, 955–969. [Google Scholar] [CrossRef]
- Talukdar, S.; Singha, P.; Mahato, S.; Praveen, B.; Rahman, A. Dynamics of ecosystem services (ESs) in response to LULC (LU/LC) changes in the lower Gangetic plain of India. Ecol. Indic. 2020, 112, 106121. [Google Scholar] [CrossRef]
- Rogan, J.; Miller, J.; Stow, D.; Franklin, J.; Levien, L.; Fischer, C. Land-cover change monitoring with classification trees using Landsat TM and ancillary data. Photogramm. Eng. Remote Sens. 2003, 69, 793–804. [Google Scholar] [CrossRef]
- Gislason, P.O.; Benediktsson, J.A.; Sveinsson, J.R. Random forests for land cover classification. Pattern Recognit. Lett. 2006, 27, 294–300. [Google Scholar] [CrossRef]
- Otukei, J.R.; Blaschke, T. Land cover change assessment using decision trees, support vector machines and maximum likelihood classification algorithms. Int. J. Appl. Earth Obs. Geoinf. 2010, 12, S27–S31. [Google Scholar] [CrossRef]
- Thanh Noi, P.; Kappas, M. Comparison of random forest, k-nearest neighbor, and support vector machine classifiers for land cover classification using Sentinel-2 imagery. Sensors 2017, 18, 18. [Google Scholar] [CrossRef]
- LeCun, Y.; Boser, B.; Denker, J.S.; Henderson, D.; Howard, R.E.; Hubbard, W.; Jackel, L.D. Backpropagation applied to handwritten zip code recognition. Neural Comput. 1989, 1, 541–551. [Google Scholar] [CrossRef]
- Long, J.; Shelhamer, E.; Darrell, T. Fully convolutional networks for semantic segmentation. In Proceedings of the IEEE Conference on Computer Vision and Pattern Recognition, Boston, MA, USA, 7–12 June 2015; pp. 3431–3440. [Google Scholar]
- Guo, X.; Nie, R.; Cao, J.; Zhou, D.; Qian, W. Fully convolutional network-based multifocus image fusion. Neural Comput. 2018, 30, 1775–1800. [Google Scholar] [CrossRef] [PubMed]
- Badrinarayanan, V.; Kendall, A.; Cipolla, R. Segnet: A deep convolutional encoder-decoder architecture for image segmentation. IEEE Trans. Pattern Anal. Mach. Intell. 2017, 39, 2481–2495. [Google Scholar] [CrossRef]
- Garcia-Garcia, A.; Orts-Escolano, S.; Oprea, S.; Villena-Martinez, V.; Garcia-Rodriguez, J. A review on deep learning techniques applied to semantic segmentation. arXiv 2017, arXiv:1704.06857. [Google Scholar]
- Lee, S.H.; Han, K.J.; Lee, K.; Lee, K.J.; Oh, K.Y.; Lee, M.J. Classification of Landscape Affected by Deforestation Using High-Resolution Remote Sensing Data and Deep-Learning Techniques. Remote Sens. 2020, 12, 3372. [Google Scholar] [CrossRef]
- Audebert, N.; Le Saux, B.; Lefèvre, S. Segment-before-detect: Vehicle detection and classification through semantic segmentation of aerial images. Remote Sens. 2017, 9, 368. [Google Scholar] [CrossRef]
- Breiman, L. Random forests. Mach. Learn. 2001, 45, 5–32. [Google Scholar] [CrossRef]
- Breiman, L. Bagging predictors. Mach. Learn. 1996, 24, 123–140. [Google Scholar] [CrossRef]
- Chan, J.C.W.; Paelinckx, D. Evaluation of Random Forest and Adaboost tree-based ensemble classification and spectral band selection for ecotope classification using airborne hyperspectral imagery. Remote Sens. Environ. 2008, 112, 2999–3011. [Google Scholar] [CrossRef]
- Vapnik, V.; Guyon, I.; Hastie, T. Support vector machines. Mach. Learn. 1995, 20, 273–297. [Google Scholar]
- Huang, C.; Davis, L.S.; Townshend, J.R.G. An assessment of support vector machines for land cover classification. Int. J. Remote Sens. 2002, 23, 725–749. [Google Scholar] [CrossRef]
- Zhang, P.; Ke, Y.; Zhang, Z.; Wang, M.; Li, P.; Zhang, S. Urban land use and land cover classification using novel deep learning models based on high spatial resolution satellite imagery. Sensors 2018, 18, 3717. [Google Scholar] [CrossRef]
- Bardenet, R.; Brendel, M.; Kégl, B.; Sebag, M. Collaborative hyperparameter tuning. In Proceedings of the International Conference on Machine Learning, Atlanta, GA, USA, 16–21 June 2013; pp. 199–207. [Google Scholar]
- Eigen, D.; Fergus, R. Predicting depth, surface normals and semantic labels with a common multi-scale convolutional architecture. In Proceedings of the IEEE International Conference on Computer Vision, Santiago, Chile, 7–13 December 2015; pp. 2650–2658. [Google Scholar]
- Marçal, A.R.S.; Borges, J.S.; Gomes, J.A.; Pinto Da Costa, J.F. Land cover update by supervised classification of segmented ASTER images. Int. J. Remote Sens. 2005, 26, 1347–1362. [Google Scholar] [CrossRef]
- Cots-Folch, R.; Aitkenhead, M.J.; Martínez-Casasnovas, J.A. Mapping land cover from detailed aerial photography data using textural and neural network analysis. Int. J. Remote Sens. 2007, 28, 1625–1642. [Google Scholar] [CrossRef]
- Cleve, C.; Kelly, M.; Kearns, F.R.; Moritz, M. Classification of the wildland–urban interface: A comparison of pixel-and object-based classifications using high-resolution aerial photography. Comput. Environ. Urban Syst. 2008, 32, 317–326. [Google Scholar] [CrossRef]
- Li, J.; Bortolot, Z.J. Quantifying the impacts of land cover change on catchment-scale urban flooding by classifying aerial images. J. Clean. Prod. 2022, 344, 130992. [Google Scholar] [CrossRef]
- Pashaei, M.; Kamangir, H.; Starek, M.J.; Tissot, P. Review and evaluation of deep learning architectures for efficient land cover mapping with UAS hyper-spatial imagery: A case study over a wetland. Remote Sens. 2020, 12, 959. [Google Scholar] [CrossRef]
- Ning, H.; Li, Z.; Wang, C.; Yang, L. Choosing an appropriate training set size when using existing data to train neural networks for land cover segmentation. Ann. GIS 2020, 26, 329–342. [Google Scholar] [CrossRef]
- Guo, Y.; Wang, F.; Xiang, Y.; You, H. DGFNet: Dual Gate Fusion Network for Land Cover Classification in Very High-Resolution Images. Remote Sens. 2021, 13, 3755. [Google Scholar] [CrossRef]
- Zhang, X.; Liu, L.; Chen, X.; Gao, Y.; Xie, S.; Mi, J. GLC_FCS30: Global land-cover product with fine classification system at 30 m using time-series Landsat imagery. Earth Syst. Sci. Data 2021, 13, 2753–2776. [Google Scholar] [CrossRef]
- Li, Y.; Zhou, Y.; Zhang, Y.; Zhong, L.; Wang, J.; Chen, J. DKDFN: Domain Knowledge-Guided deep collaborative fusion network for multimodal unitemporal remote sensing land cover classification. ISPRS J. Photogramm. Remote Sens. 2022, 186, 170–189. [Google Scholar] [CrossRef]
- Laban, N.; Abdellatif, B.; Ebeid, H.M.; Shedeed, H.A.; Tolba, M.F. Sparse Pixel Training of Convolutional Neural Networks for Land Cover Classification. IEEE Access 2021, 9, 52067–52078. [Google Scholar] [CrossRef]
- Zhang, C.; Harrison, P.A.; Pan, X.; Li, H.; Sargent, I.; Atkinson, P.M. Scale Sequence Joint Deep Learning (SS-JDL) for land use and land cover classification. Remote Sens. Environ. 2020, 237, 111593. [Google Scholar] [CrossRef]
- Atik, S.O.; Ipbuker, C. Integrating convolutional neural network and multiresolution segmentation for land cover and land use mapping using satellite imagery. Appl. Sci. 2021, 11, 5551. [Google Scholar] [CrossRef]

| Model | Urban | Crops | Forests | Water | OA |
|---|---|---|---|---|---|
| SegNet | 93.96 | 87.59 | 88.45 | 96.32 | 91.54 |
| RF | 57.64 | 54.13 | 81.84 | 18.21 | 52.96 |
| SVM | 56.23 | 55.39 | 82.27 | 6.74 | 50.27 |
| 2010 | Level-3 LULC Map | ||||
| Urban | Crops | Forests | Water | Total | |
| Urban | 1,767,918 | 164,988 | 31,417 | 6316 | 1,970,639 |
| Crops | 293,185 | 2,208,976 | 234,389 | 59,618 | 2,796,168 |
| Forests | 8653 | 65,108 | 1,406,746 | 279 | 1,480,786 |
| Water | 5948 | 2393 | 1566 | 178,079 | 187,986 |
| Total | 2,075,704 | 2,441,465 | 1,674,118 | 244,292 | OA = 86.42% |
| 2012 | Level-3 LULC Map | ||||
| Urban | Crops | Forests | Water | Total | |
| Urban | 1,700,829 | 268,580 | 341,239 | 12,164 | 2,322,812 |
| Crops | 485,862 | 1,876,897 | 216,327 | 48,437 | 2,627,523 |
| Forests | 7844 | 17,611 | 1,085,906 | 63 | 1,111,424 |
| Water | 42,403 | 19,280 | 6790 | 172,369 | 240,842 |
| Total | 2,236,938 | 2,182,368 | 1,650,262 | 233,033 | OA = 78.09% |
| Level-3 LULC Map | 2012 | |||||
| Urban | Crops | Forests | Water | Null | Total | |
| Urban | 1,993,829 | 6,787 | - | 35 | 75,053 | 2,075,704 |
| Crops | 77,475 | 2,101,705 | - | 123 | 262,162 | 2,441,465 |
| Forests | 2953 | 2456 | 1,650,262 | - | 18,447 | 1,674,118 |
| Water | 1686 | 990 | - | 221,513 | 20,103 | 244,292 |
| Null | 160,995 | 70,430 | - | 11,362 | 1,788,834 | 2,031,621 |
| Total | 2,236,938 | 2,182,368 | 1,650,262 | 233,033 | 2,164,599 | 8,467,200 |
| SegNet | 2012 | |||||
| Urban | Crops | Forests | Water | Null | Total | |
| Urban | 1,521,808 | 343,943 | 5871 | 26,601 | 72,416 | 1,970,639 |
| Crops | 402,550 | 2,007,863 | 67,501 | 39,808 | 278,446 | 2,796,168 |
| Forests | 269,645 | 152,102 | 1,036,472 | 5,997 | 16,570 | 1,480,786 |
| Water | 7241 | 26,504 | 10 | 145,898 | 8333 | 187,986 |
| Null | 121,568 | 97,111 | 1570 | 22,538 | 1,788,834 | 2,031,621 |
| Total | 2,322,812 | 2,627,523 | 1,111,424 | 240,842 | 2,164,599 | 8,467,200 |
Publisher’s Note: MDPI stays neutral with regard to jurisdictional claims in published maps and institutional affiliations. |
© 2022 by the authors. Licensee MDPI, Basel, Switzerland. This article is an open access article distributed under the terms and conditions of the Creative Commons Attribution (CC BY) license (https://creativecommons.org/licenses/by/4.0/).
Share and Cite
Son, S.; Lee, S.-H.; Bae, J.; Ryu, M.; Lee, D.; Park, S.-R.; Seo, D.; Kim, J. Land-Cover-Change Detection with Aerial Orthoimagery Using SegNet-Based Semantic Segmentation in Namyangju City, South Korea. Sustainability 2022, 14, 12321. https://doi.org/10.3390/su141912321
Son S, Lee S-H, Bae J, Ryu M, Lee D, Park S-R, Seo D, Kim J. Land-Cover-Change Detection with Aerial Orthoimagery Using SegNet-Based Semantic Segmentation in Namyangju City, South Korea. Sustainability. 2022; 14(19):12321. https://doi.org/10.3390/su141912321
Chicago/Turabian StyleSon, Sanghun, Seong-Hyeok Lee, Jaegu Bae, Minji Ryu, Doi Lee, So-Ryeon Park, Dongju Seo, and Jinsoo Kim. 2022. "Land-Cover-Change Detection with Aerial Orthoimagery Using SegNet-Based Semantic Segmentation in Namyangju City, South Korea" Sustainability 14, no. 19: 12321. https://doi.org/10.3390/su141912321
APA StyleSon, S., Lee, S.-H., Bae, J., Ryu, M., Lee, D., Park, S.-R., Seo, D., & Kim, J. (2022). Land-Cover-Change Detection with Aerial Orthoimagery Using SegNet-Based Semantic Segmentation in Namyangju City, South Korea. Sustainability, 14(19), 12321. https://doi.org/10.3390/su141912321