Article

Fallow Deer (Dama dama) Population and Harvest Changes in Europe since the Early 1980s

1
Department of Wildlife Biology and Management, Institute for Wildlife Management and Nature Conservation, Hungarian University of Agriculture and Life Sciences, Páter Károly u. 1., H-2100 Gödöllő, Hungary
2
National Laboratory of Health Security, Hungarian University of Agriculture and Life Sciences, Páter Károly u. 1., H-2100 Gödöllő, Hungary
*
Authors to whom correspondence should be addressed.
Sustainability 2022, 14(19), 12198; https://doi.org/10.3390/su141912198
Submission received: 22 August 2022 / Revised: 21 September 2022 / Accepted: 23 September 2022 / Published: 26 September 2022
(This article belongs to the Special Issue Mammal Status: Diversity, Abundance and Dynamics Volume II)

Abstract

:
Fallow deer is one of the most common and widespread cervid species in Europe. To make informed management decisions on any scale, it is essential to have long-term data on the abundance of populations and their harvest. We provide missing information on the changes and status of fallow deer populations in Europe and analyse the relationships between population and harvest changes using a numerical approach. To conduct our analyses, we collected national statistical data on population sizes and hunting bags for all European countries for four periods: 1984, the mid-2000s, mid-2010s, and early 2020s. The fallow deer population increased five-fold from 1984 to the early 2020s and the harvest increased six-fold in the same period. Although the correlations between the population growth rate and harvest growth rate are not strong, removing outliers strengthened the correlation. This indicates that the hunting effort increases as the population increases. Overall, the lack of some data shows that consistent, reliable data collection (monitoring programs) is needed to efficiently manage the increasing fallow deer populations as a renewable natural resource and mitigate the potential negative impacts in a holistic and responsible manner.

1. Introduction

The fallow deer (Dama dama) is one of the most common cervid species occurring in Europe and the most widespread cervid in the world [1]. It is a western Palaearctic species whose origin from Western Asia can be traced back at least two millennia [2,3]. The species has been introduced to the majority of Europe and is native to only southern Anatolia, Sicily, southern Italy, and the southern Balkan peninsula, as these regions were probably post-glacial refuges [2,4]. The fallow deer is a highly farmed species with fragmented free-ranging populations. Consequently, the species has been reported in all continents but Antarctica [5]. Its successful range expansion is the result of the translocation and introduction to new areas for trophy hunting, ornamental or aesthetical reasons, and game meat production [5]. However, as an alien species, they can have deleterious effects as well, including negative effects on vegetation diversity and structure, competition with native cervids [6,7,8], and the occurrence of diseases [9]. Currently, the fallow deer is listed as one of the most widespread and detrimental non-native mammals in Europe [10]. Therefore, providing information on the status of the species is crucial for effective management.
A comprehensive, up-to-date review on the worldwide distribution of fallow deer has been performed by Esattore et al. (2022) [11], which builds on the review of Chapman & Chapman (1980) [1]. However, they did not include numerical analyses of the population and the harvest of the species throughout time. Therefore, by analysing the population and harvest dynamics, we aim to provide an additional foundation for cervid management in Europe on which to base future management plans. This allows for a better understanding of the expansion of the species in Europe over the last few decades. Moreover, to make informed management decisions, constant and careful monitoring is required so adaptive management implications can be applied. By taking a numerical approach, we aim to provide a bigger picture of the status of the species and its changes over time in Europe as well as analyse the extent to which the harvest is following population changes.
Details on ungulate management and harvesting in various European countries can be found in Putman et al. (2011) and Ahl et al. (2021) [12,13].
In this study, we: (1) compare the magnitude of population and harvest changes of the fallow deer for four different periods, namely 1984, the mid-2000s, mid-2010s, and the early 2020s, based on available national statistical data and (2) analyse the relationship between population size and hunting bags between these four periods.
This paper expands on the work of Burbaitė and Csányi (2009, 2010), which covered the population and harvest changes of roe deer (Capreolus capreolus) and red deer (Cervus elaphus) in Europe [14,15]. As these cervid species have increased in the last four decades, a similar increase is expected for the fallow deer, in both population and hunting bag. It is also hypothesised that there will be a strong correlation between the increase in population size and hunting bags for all periods.

2. Materials and Methods

2.1. Data Collection

Population size and hunting bag data were collected for four different periods: 1984, the mid-2000s, mid-2010s, and early 2020s. These four periods were chosen based on the intervals of five or ten years. as it takes at least five years to detect any long-term changes in deer populations. Moreover, in some countries, population censuses are carried out every five years or more. Data from 1984 was the earliest systematically collected data available for the fallow deer [16]. Data were collected from statistical yearbooks from national statistics websites, national game management databases, as well as other published sources. If no data was publicly available for a specific country, data was then obtained from contacts made with national hunting associations, ministries, and other personal relations with wildlife researchers. Data were collected from all European countries, except for Turkey and the European part of Russia due to geographical reasons and unknown regional coverage of the data. If only a range was provided, instead of a single (estimated) number, we calculated the average based on the range. This was the case for the population estimations in Greece (for 2005) and Luxembourg (for 1984). This study focused on wild or free-ranging fallow deer; therefore, if a distinction was made in the dataset between deer in captivity or in the wild, then data was collected only for wild fallow deer. Data from the mid-2000s was mainly from the 2005/2006 hunting season, data from the mid-2010s was mainly from the 2015/2016 hunting season, and data from the early 2020s was mainly from the 2020/2021 hunting season.
Data for the mid-2000s, mid-2010s, and early 2020s were collected from various sources with added comments (Table 1). Data for 1984 or earlier were obtained from Gill (1990) [16] and from the proceedings of the CIC fallow deer symposium held in Budapest in 1984 [17]; this included the countries Germany, Ireland, Lithuania, Luxembourg, Romania, Spain, Switzerland, Ukraine, and the United Kingdom.
The fallow deer has a scattered but widespread distribution in Europe [3]. They can be found in all European countries; if they are not present in the wild, then they are kept in farms, reserves, or parks [1]. However, it is not uncommon to have free-ranging deer that escaped from enclosures that have developed small but stable populations in the wild (e.g., in Norway). As it is an introduced species with scattered populations, it is difficult to find reliable data about population size. Consequently, data for the fallow deer was not available for ten countries. These countries included Albania (hunting ban and only found in enclosures [53]), Belarus (introduced in 1890 and eradicated by 1920 [54], currently only in enclosures [55]), Bosnia and Herzegovina (only in reserves [56]), Estonia (hardly present due to removal from the wild), Latvia (not a game species and only found in enclosures), Liechtenstein (not a game species), Montenegro, Moldova, Norway (only escaped individuals), and Switzerland (can only be found in wildlife parks).
The reliability of the data sources greatly varied between countries. Various factors such as poaching, under-/overestimation of population sizes, incorrectly reported harvest numbers or causes of mortality other than hunting (roadkill, diseases, etc.) included in the harvest data, and timing of the population census (spring/autumn) may strongly influence actual values. However, a country claiming to have 10,000 deer is much more than 100, which still gives valuable information about the magnitude of the fallow deer population in a country, even though it is not precise; however, these estimations should be considered minimum values [1]. Overall, despite these shortcomings, the data was deemed acceptable for a general overview of the status of the fallow deer in Europe, similar to the papers on roe deer and red deer [14,15].

2.2. Data Analysis

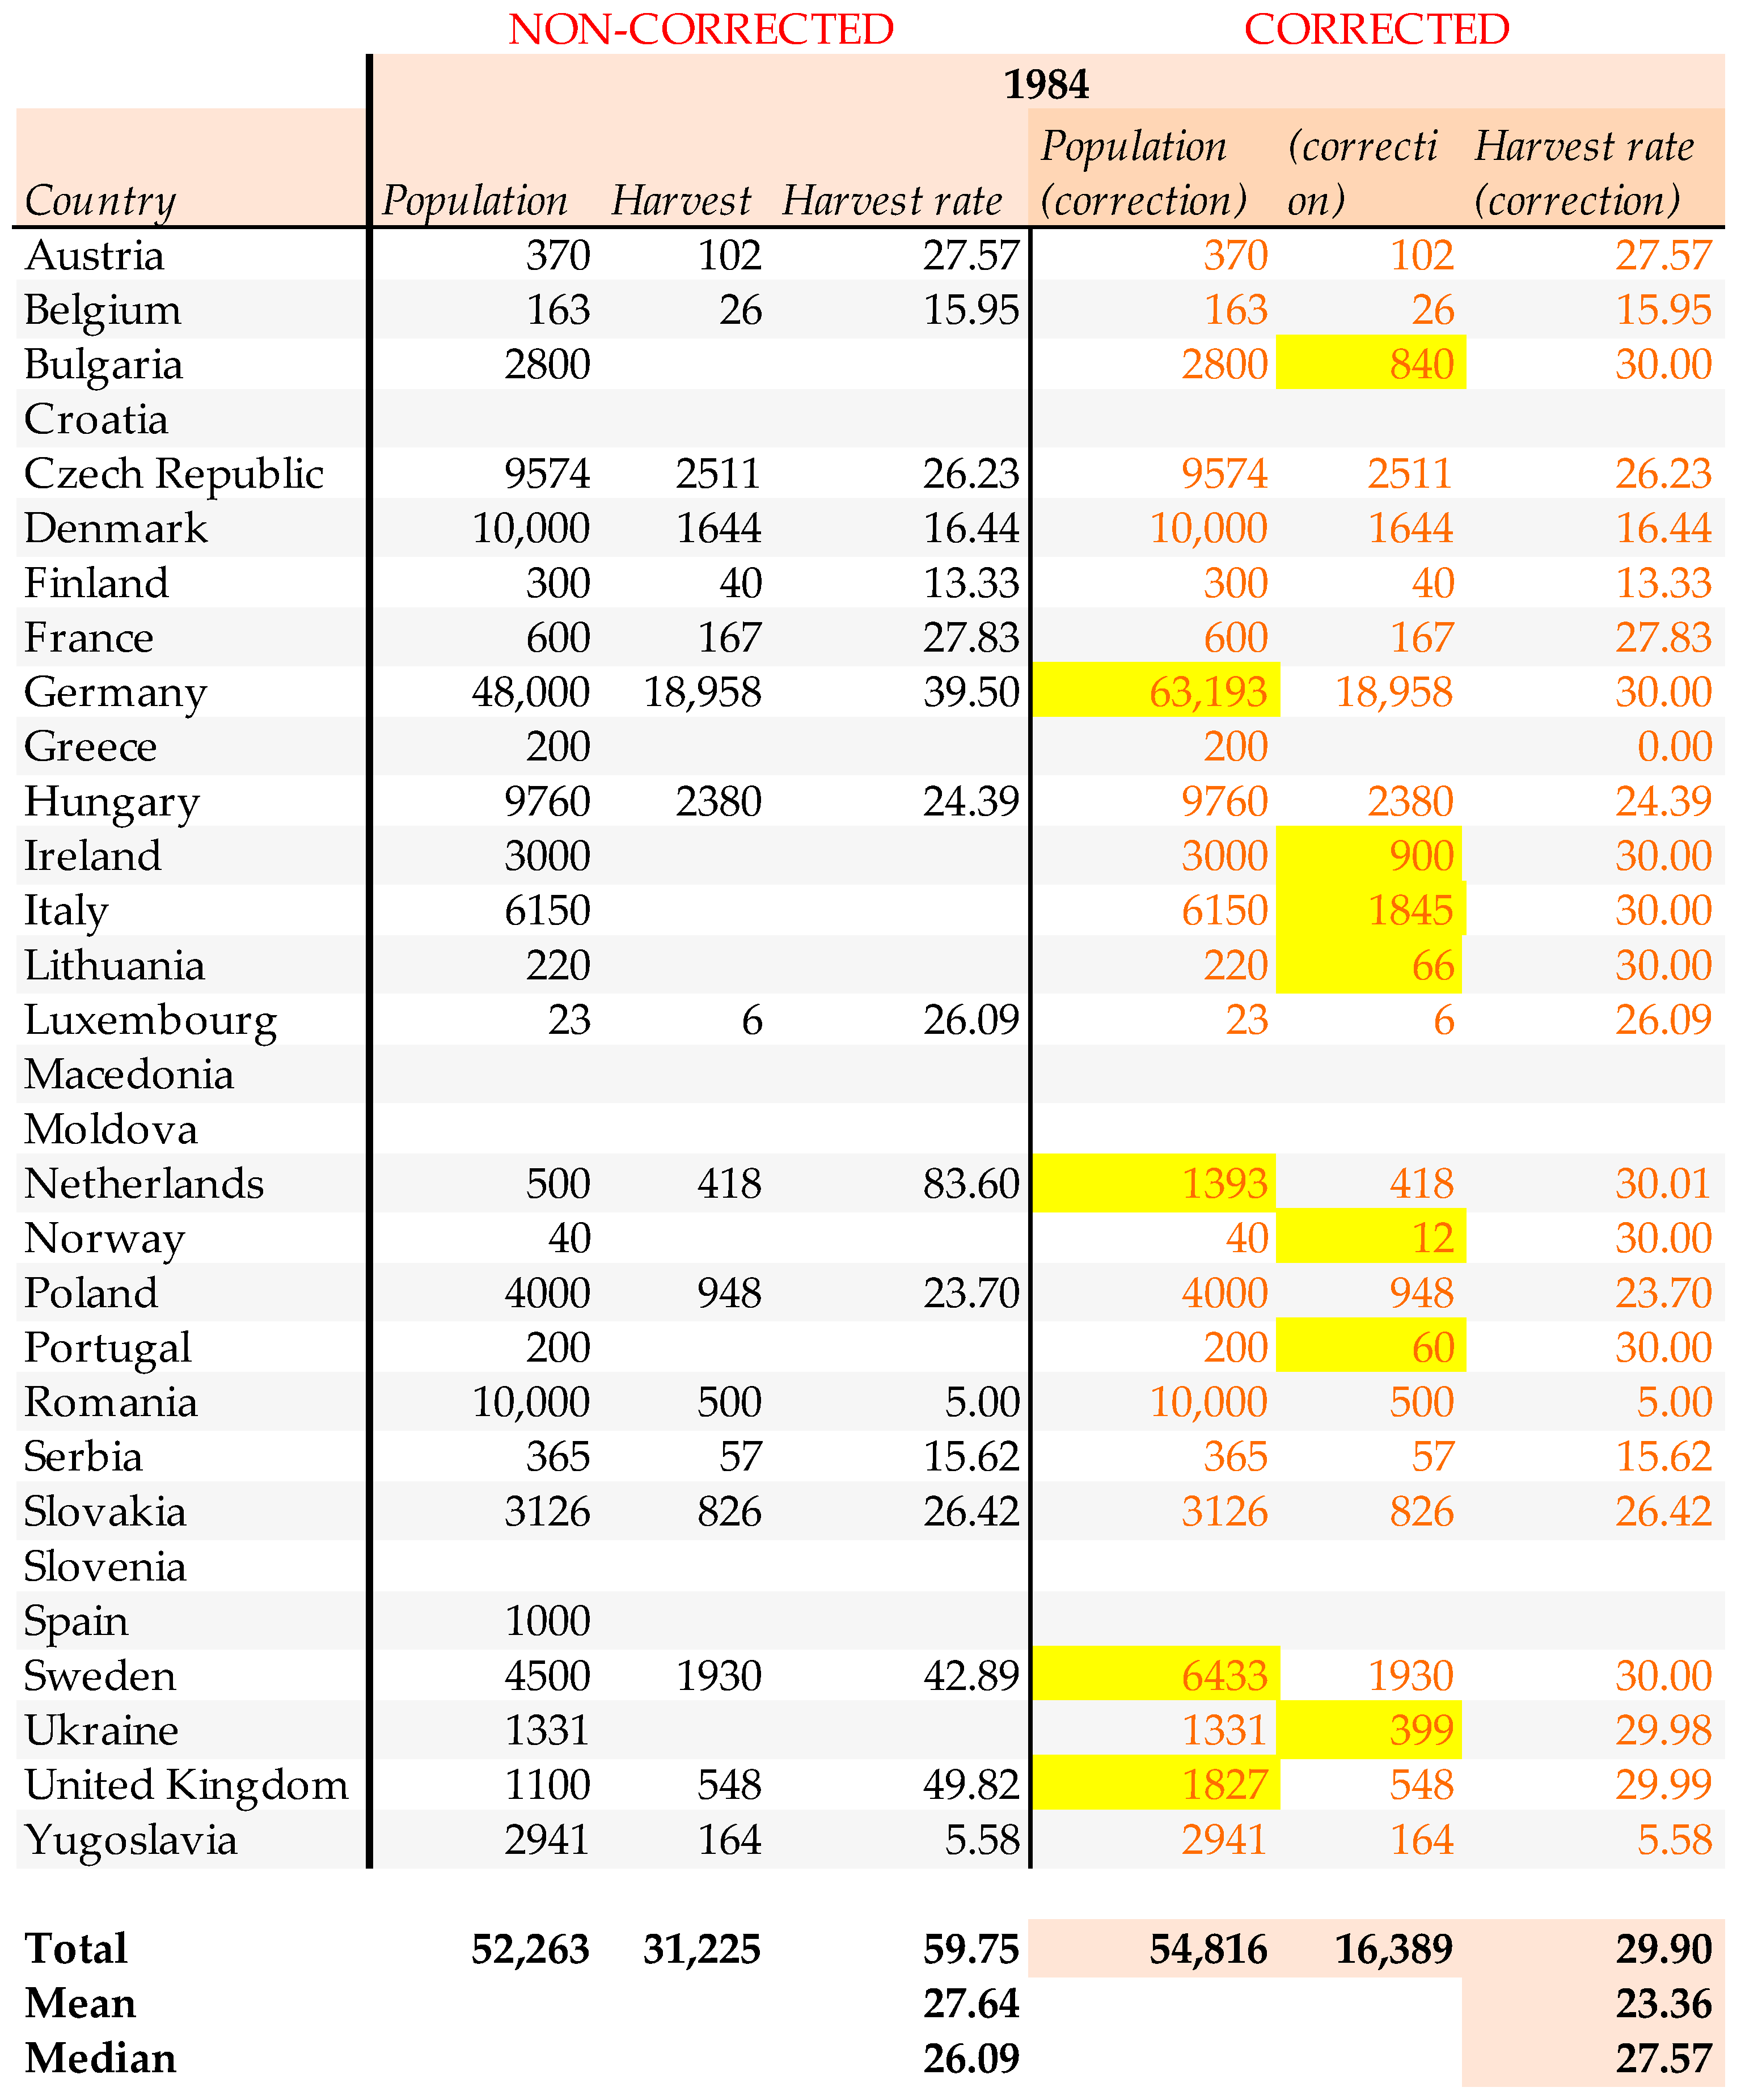
Corrections were made to the population size numbers when the harvest rate exceeded 40%. It can be assumed that a harvest rate higher than 40% is not realistic (unsustainable in the long term) under typical management conditions. Based on model calculations with the use of the sex ratio and average reproduction rate of the population, harvest rates above 30 or 40% result in the long-term overharvest (decline) of the exploited cervid population [57]. Additionally, according to the principles of the behaviour of harvested populations from Silliman and Gutsell (1958) and Caughley (1976), harvest rates that exceed the maximum sustainable yield level can result in extinction if the overharvest is continued over time [58,59]. However, harvest rates below a certain level may result in more resilient populations to compensate for the removed individuals [58,59]. Therefore, the harvest can usually be maximised up to 50% of the carrying capacity [60]. Generally, harvest numbers are considered more precise and more reliable than population censuses as they have large uncertainties [61]. Therefore, in these cases, the harvest rate was changed to a harvest rate of 30% and the population number was calculated based on this 30% rate of removal. For example, the collected data from the Czech Republic in 2021 shows that the population size is 39,058 individuals and the harvest is 30,982 individuals, which gives an unrealistic harvest rate of 79.32% (Appendix A; Figure A4). Therefore, assuming that the harvest size is unbiased (reliable), it was assumed that the harvest rate is 30% and the population size has been corrected according to this, which gives a more acceptable population size of 103,273 individuals. This has been calculated by dividing the harvest by 0.3. If only the hunting bag was given, then it was assumed that this was 30% of the whole population and the population size was calculated according to this by dividing the harvest by 0.3. Corrections were also made when only the population estimation was available in a certain period. Then, it was assumed that the harvest rate is 30% and the hunting bag was calculated according to this, if hunting was permitted in the country in question.
For each country, we calculated the overall fallow deer population and its harvest numbers in Europe, along with the harvest rates (H% = bag/population), growth factor, and average growth rate for the population sizes and harvests for the six periods: 1984–2000s; 1984–2010s; 1984–2020s; 2000s–2010s; 2000s–2020s; 2010s–2020s. The growth factor was calculated by dividing the population size or harvest of one (later) time period by the population size or harvest of the other (earlier) period. The average growth rate (exponential growth rate, r [59]) was calculated by taking the logarithm of the growth factor and dividing it by the difference in years between two time periods.

3. Results

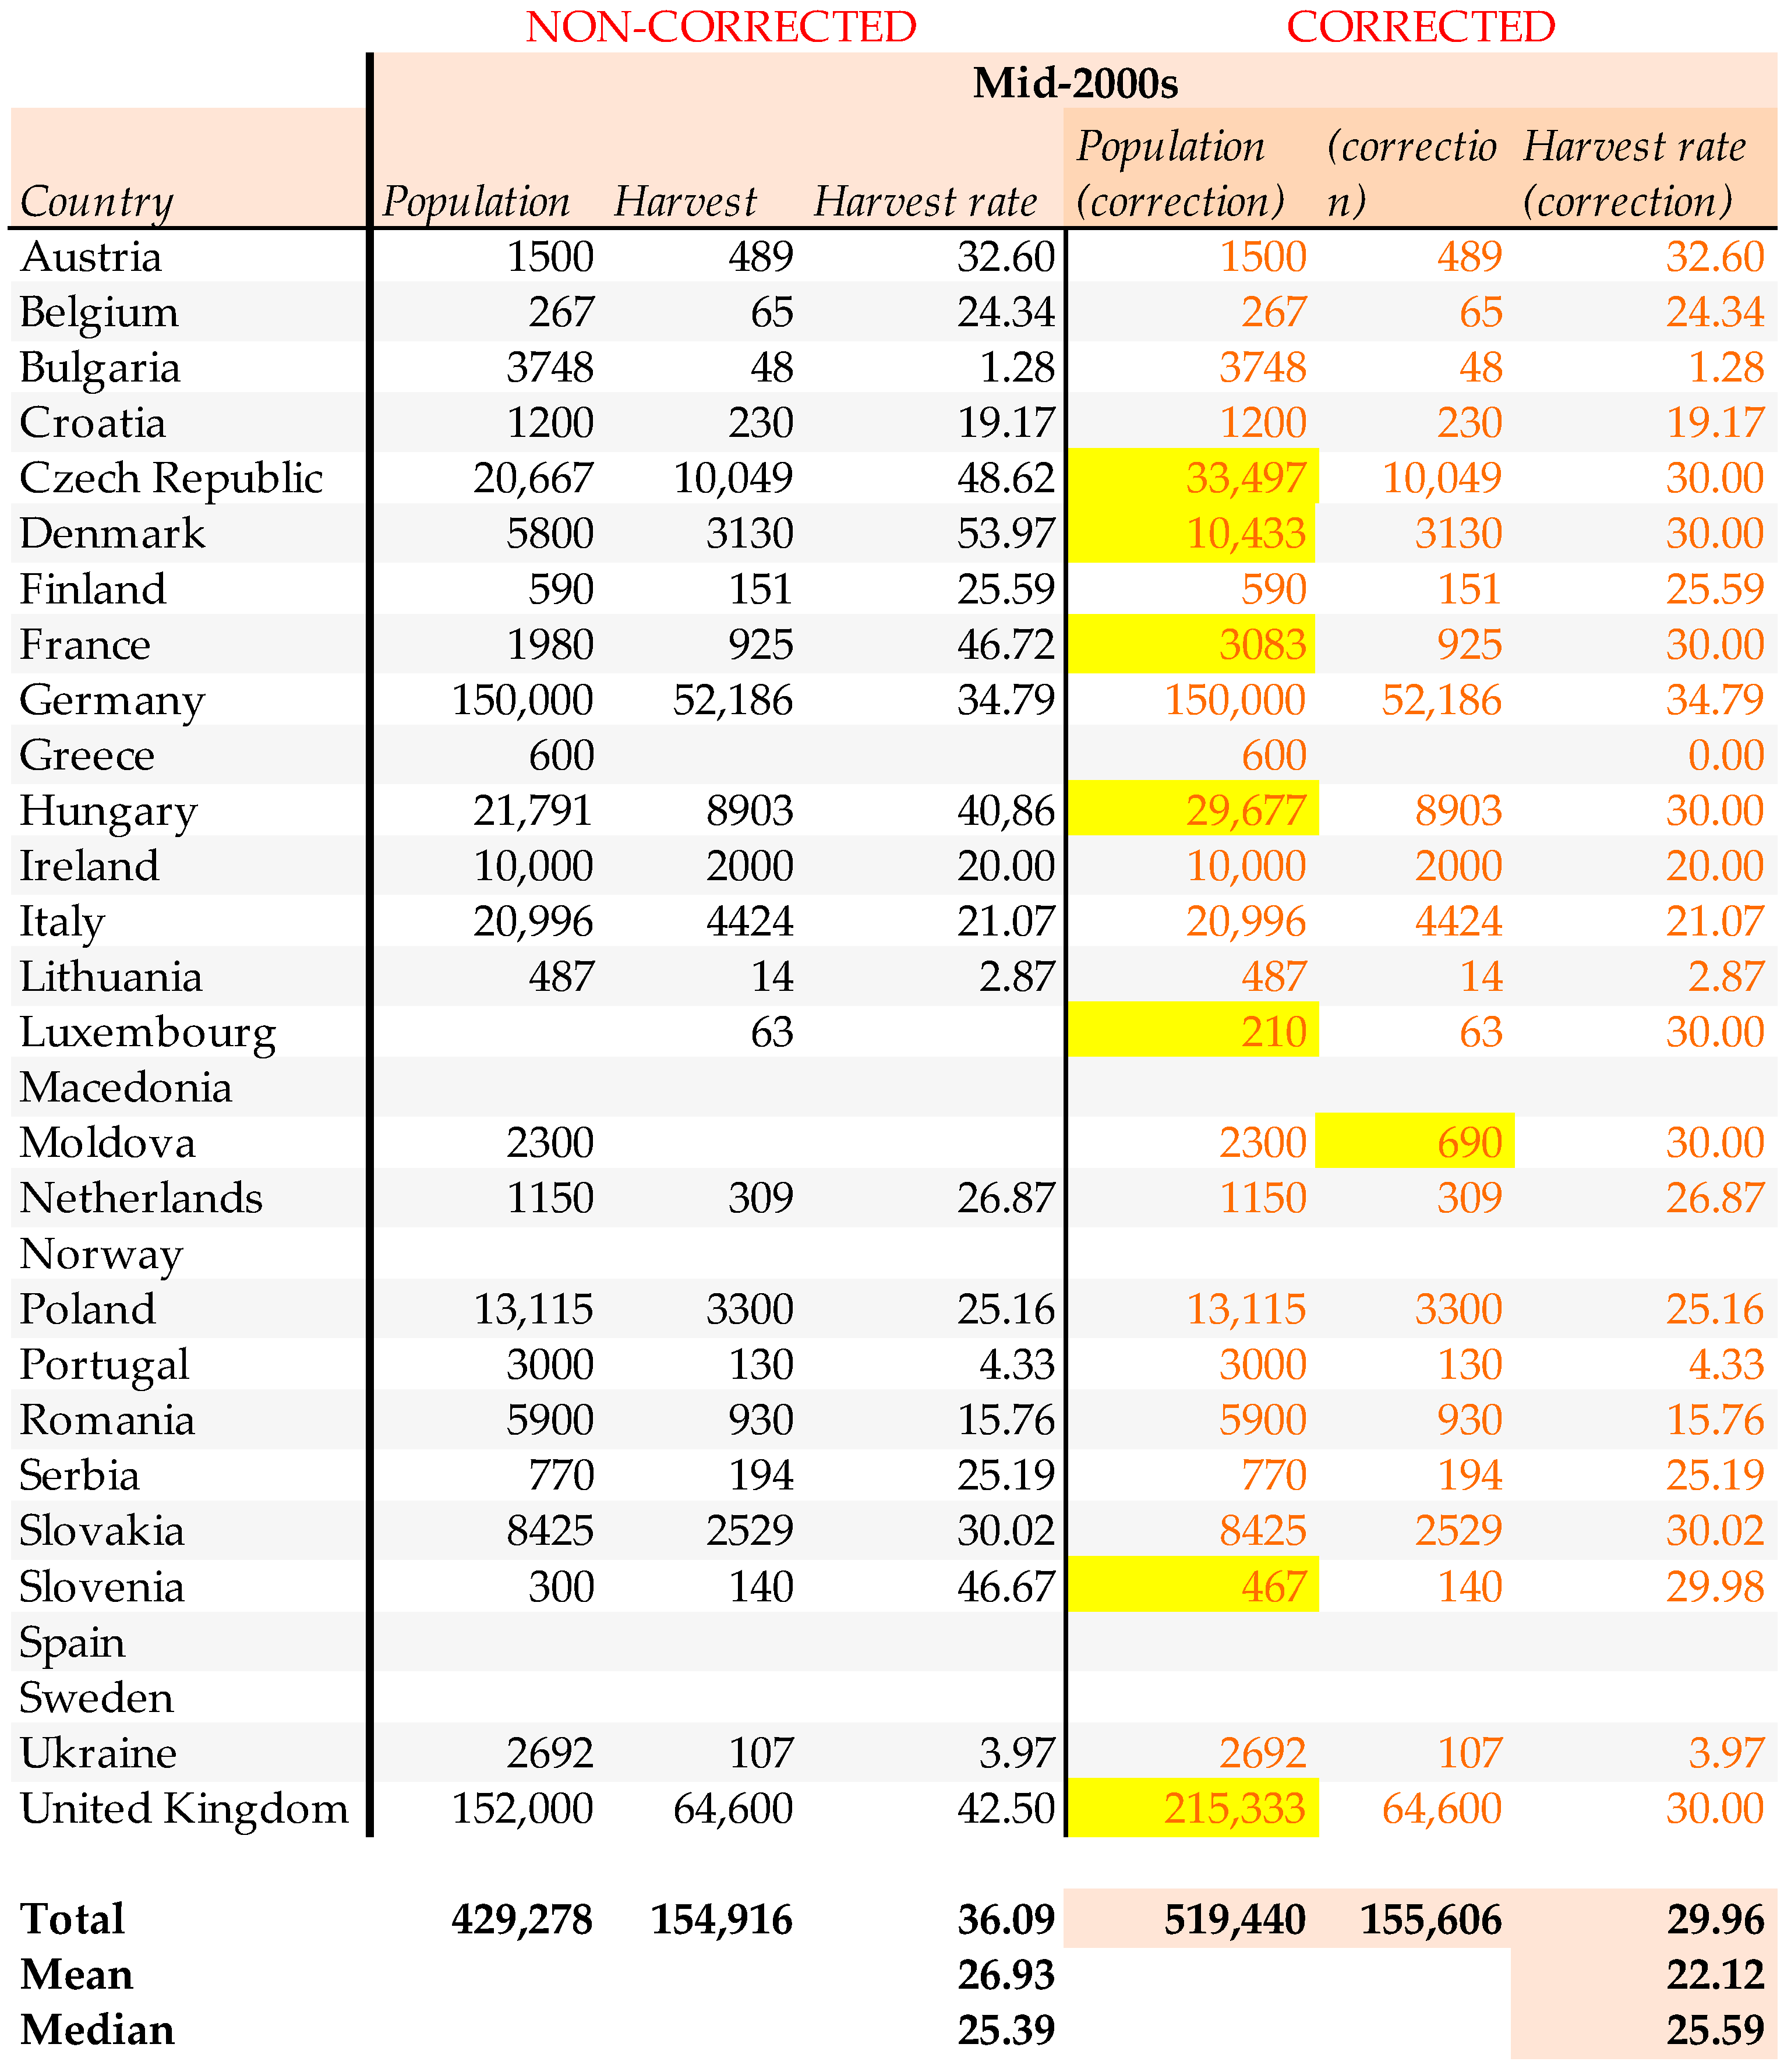
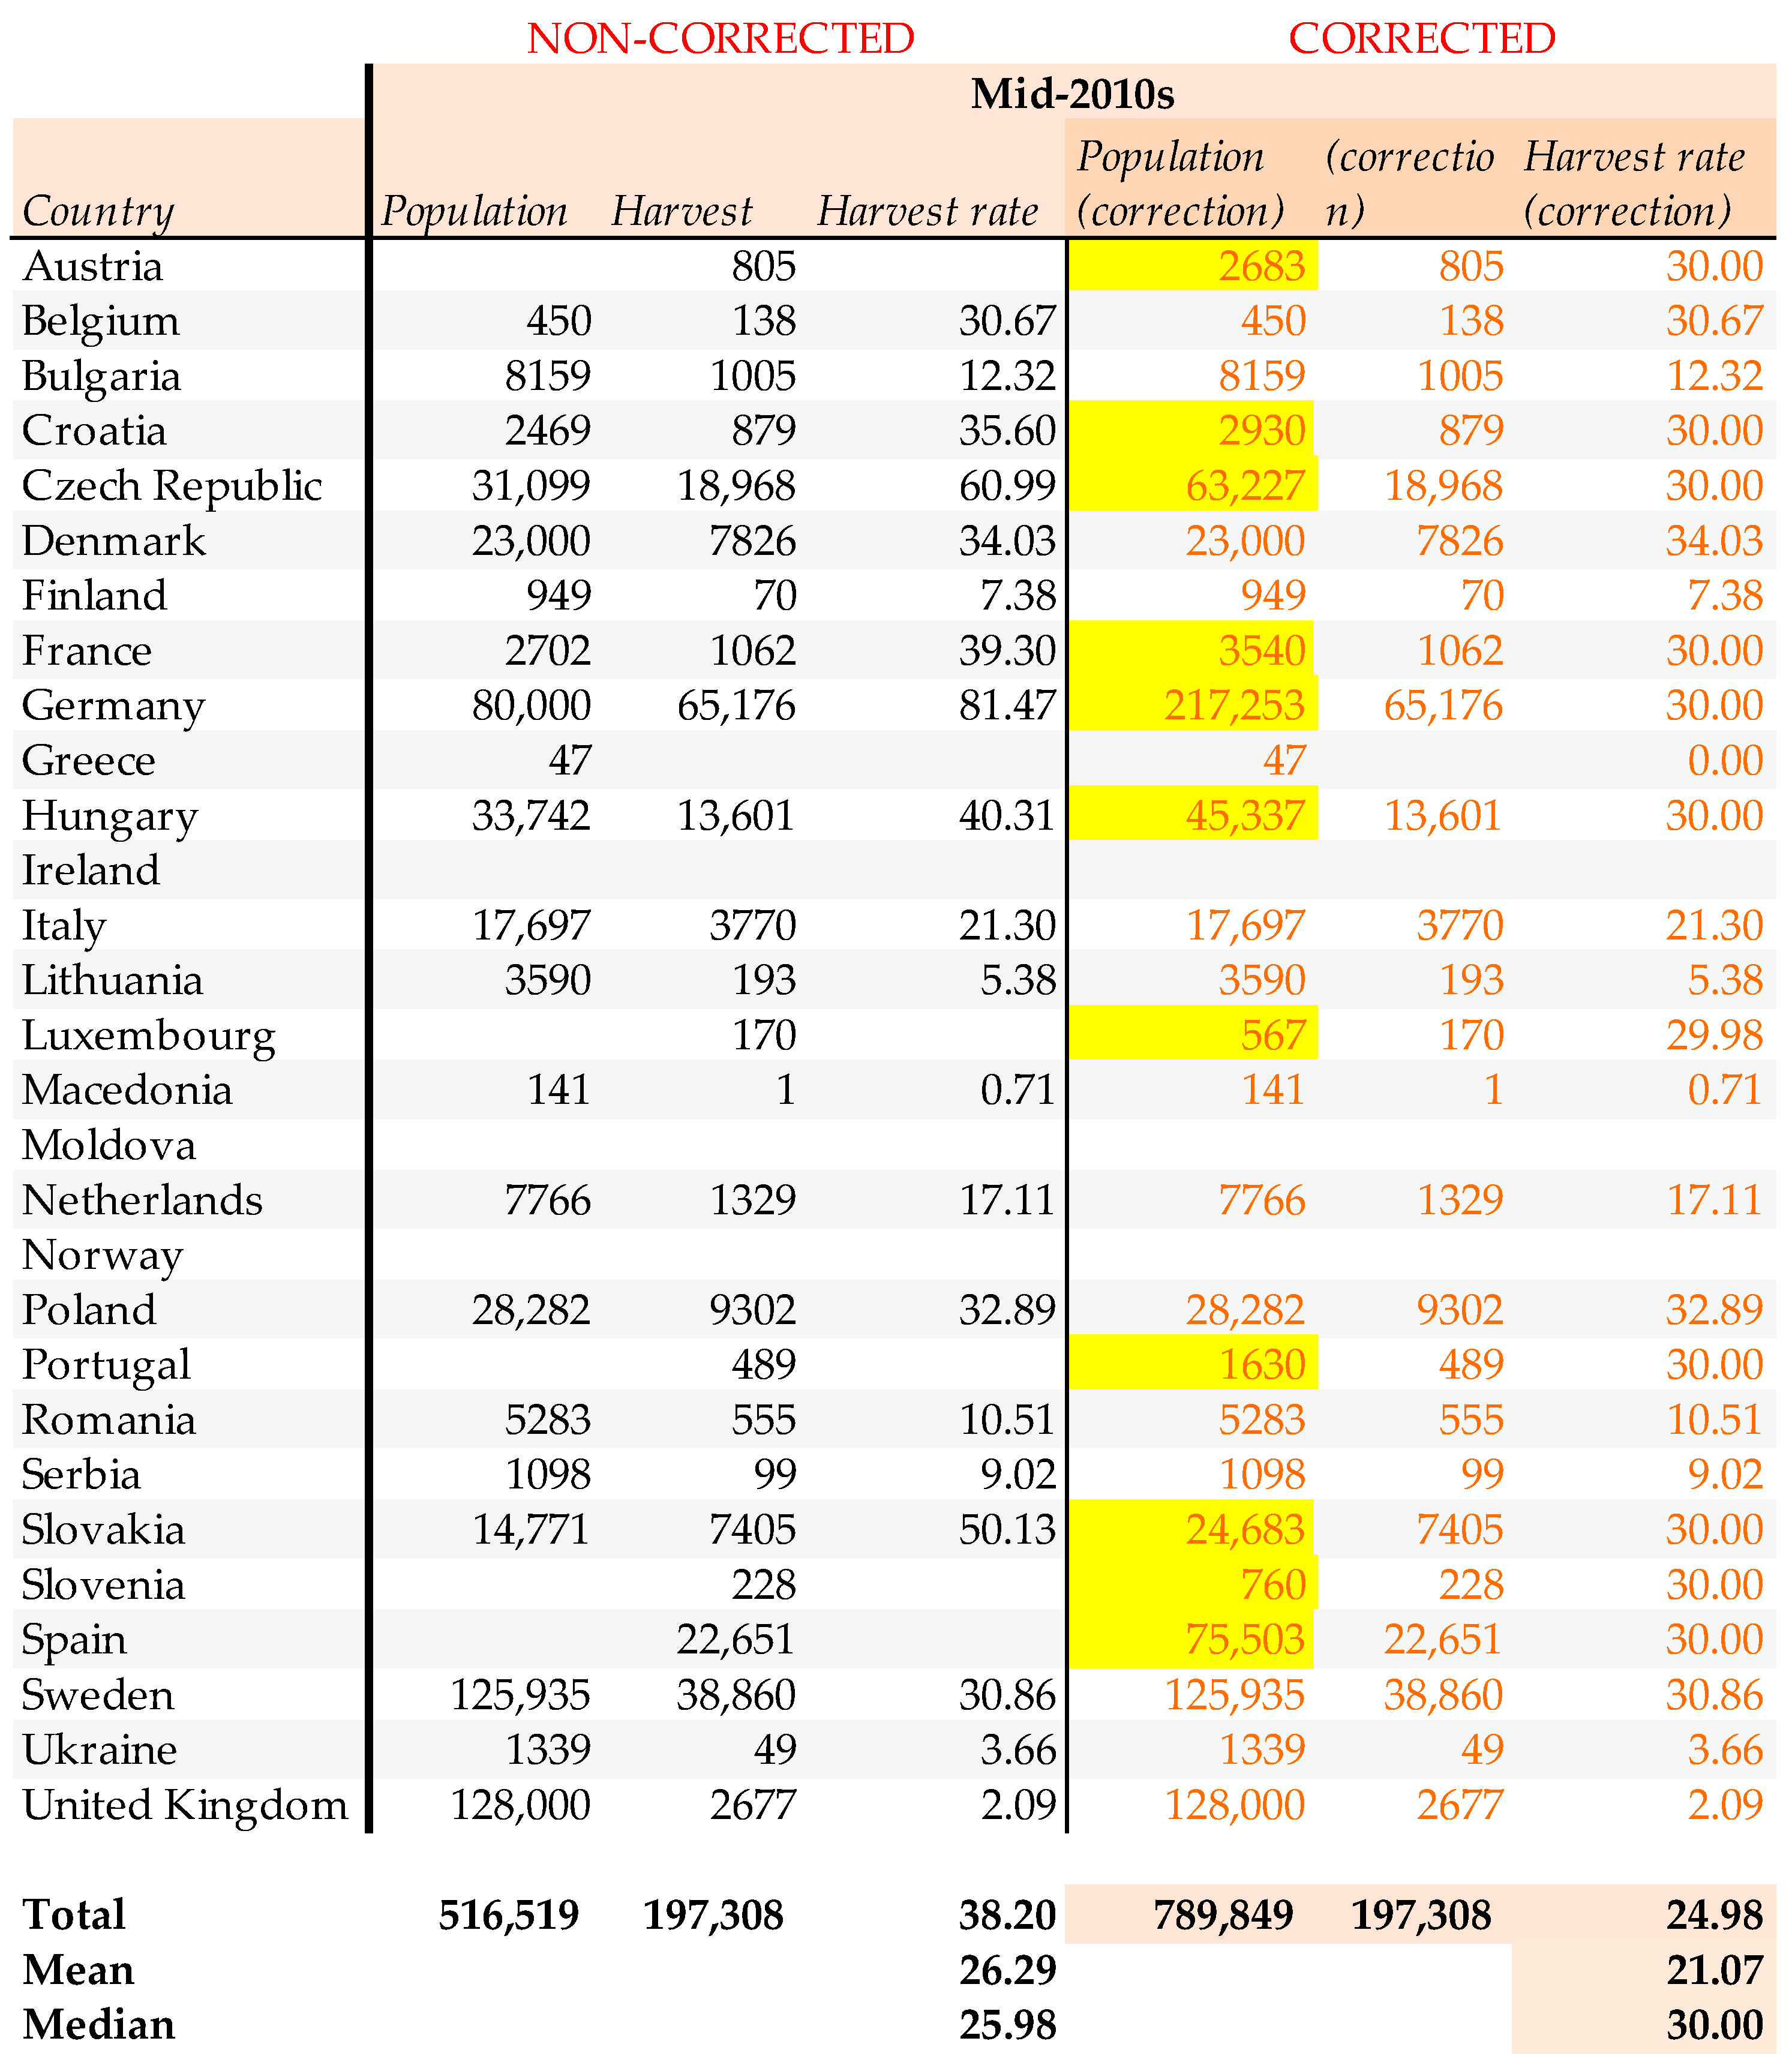
According to the collected data, there are currently at least 634,075 fallow deer in Europe; however, corrected numbers reflected a population of 951,521 individuals. Numbers have significantly increased from 120,263 (138,009 corrected) in 1984 to 429,278 (519,519 corrected) individuals in the mid-2000s, to an increase of 516,519 (789,849 corrected) in the mid-2010s (Figure 1). This suggests that the fallow deer population increased five-fold from 1984 to 2020 and increased almost seven-fold if considering the corrected values.
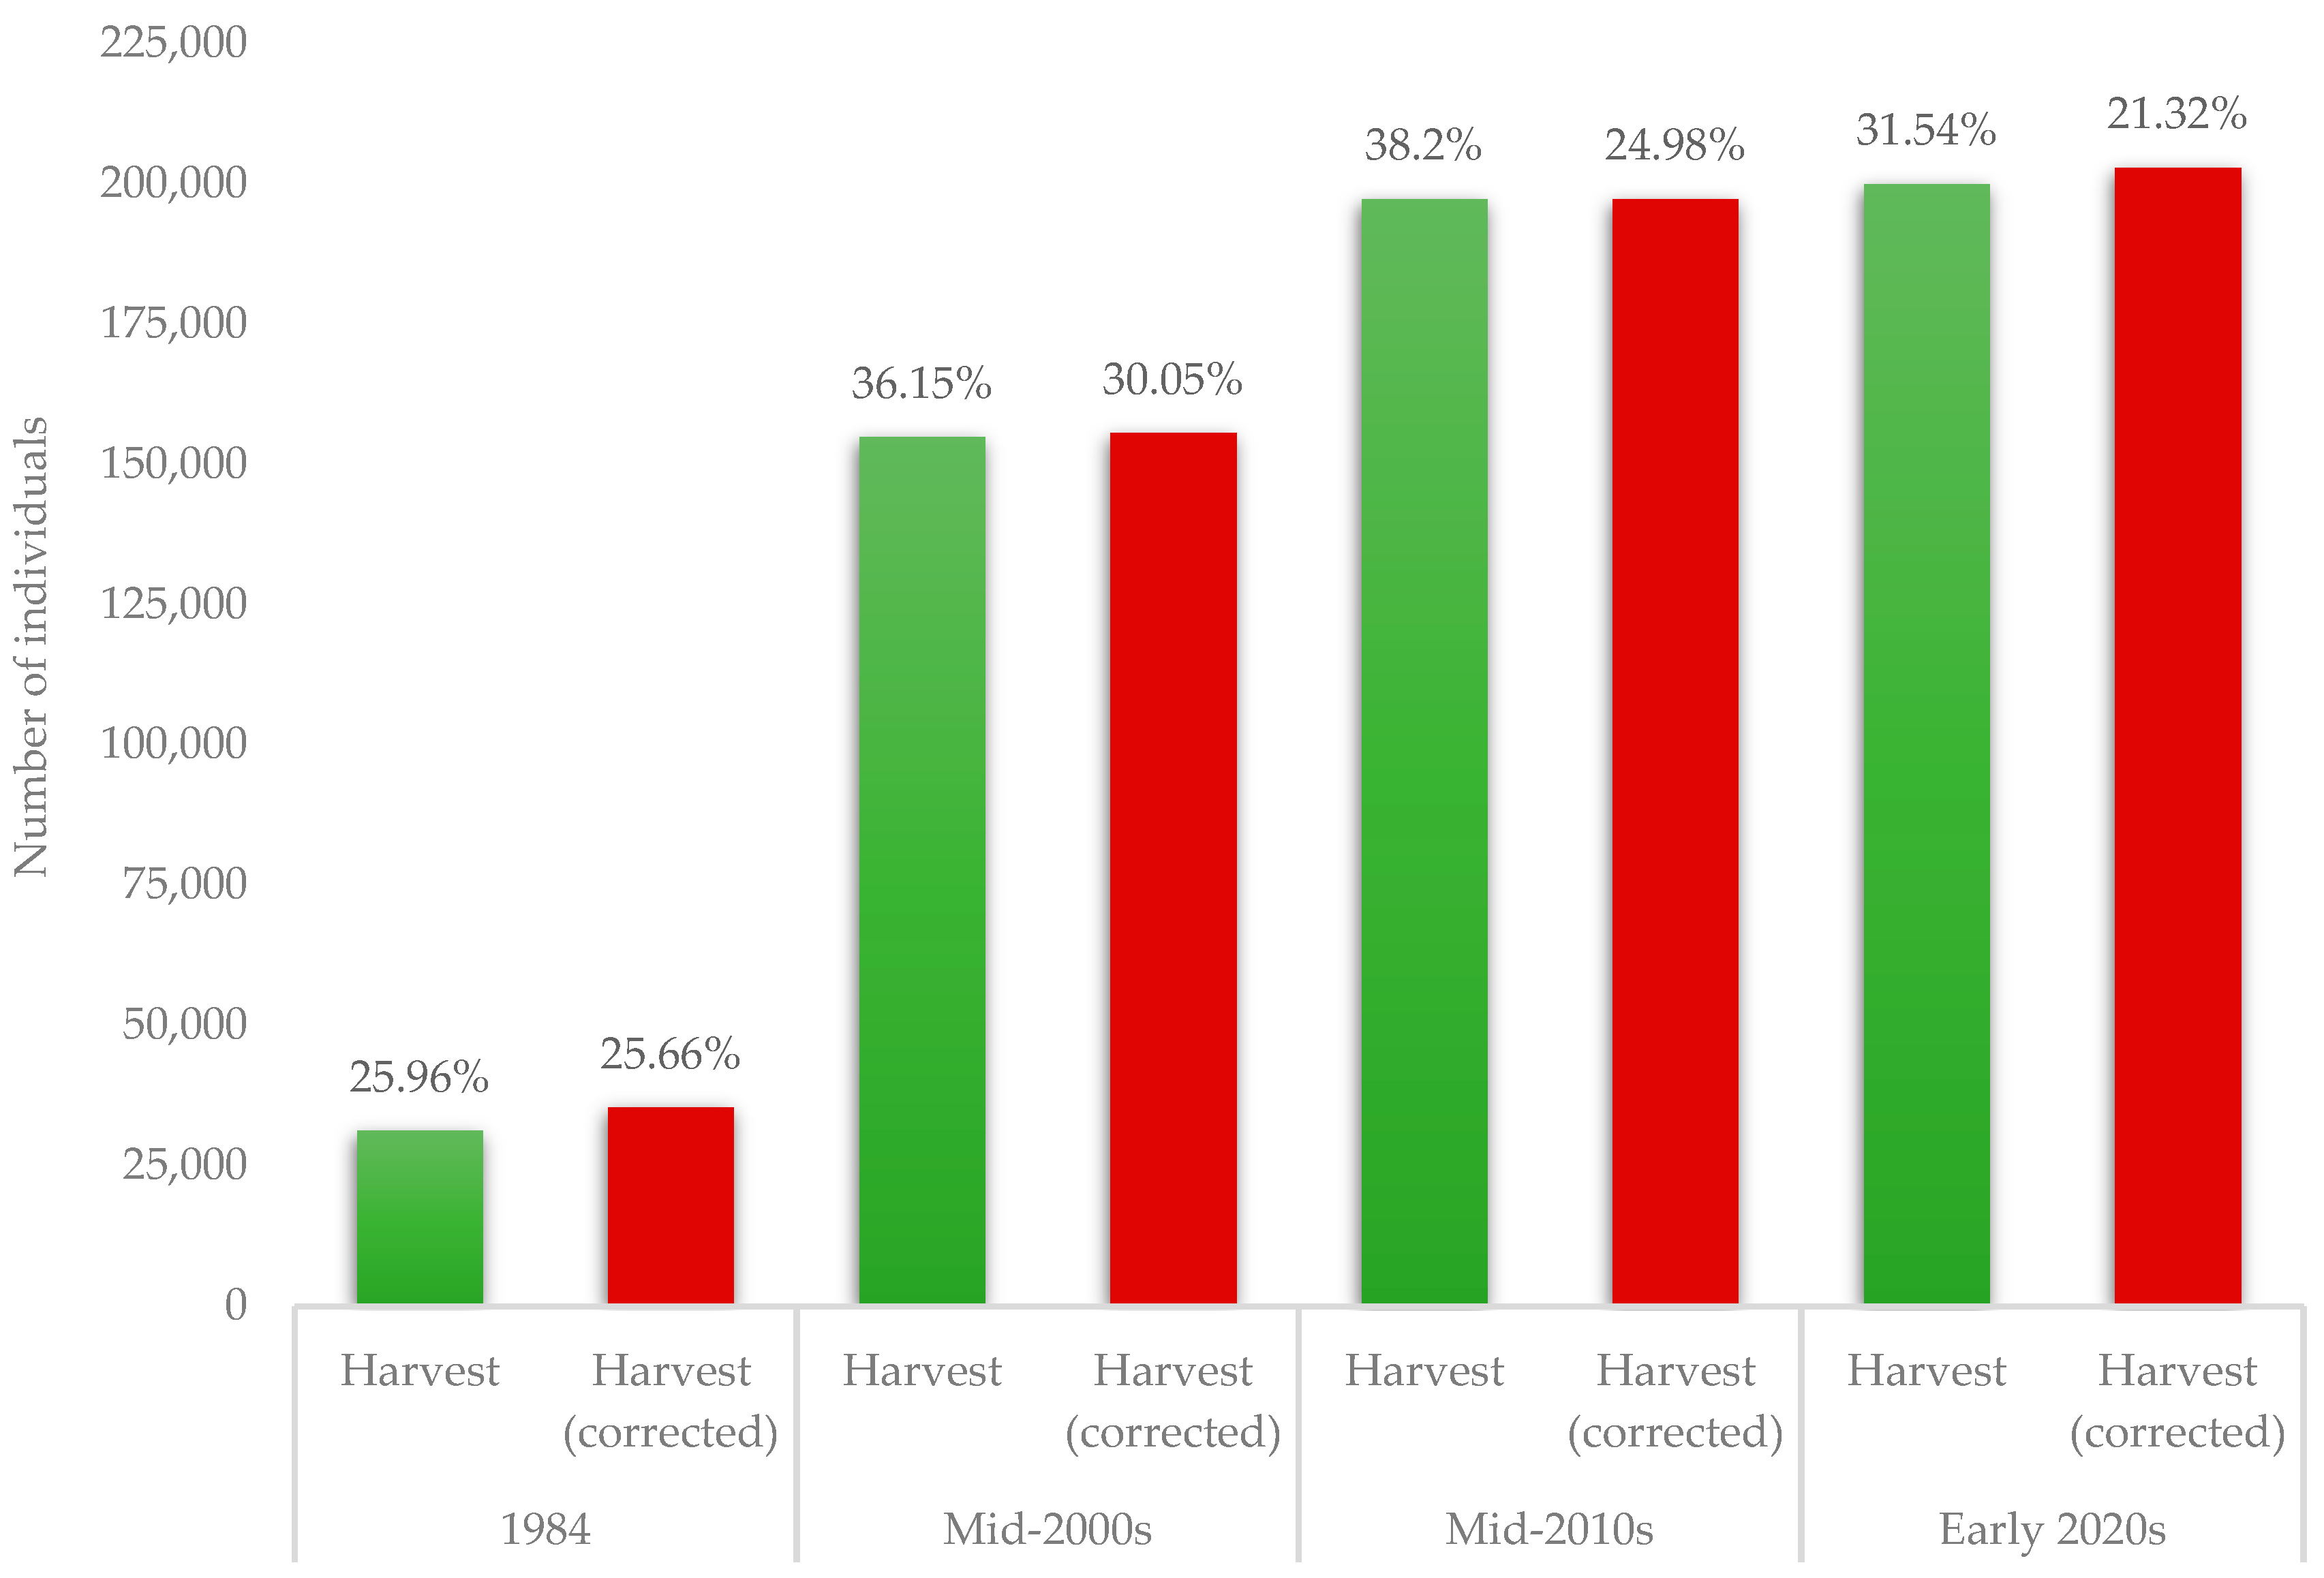
The known harvest was only 31,225 individuals in 1984 and increased to 154,916 individuals in the mid-2000s, with a further increase to 197,308 animals harvested in the mid-2010s, and most recently measured at 199,968 animals harvested (Figure 2). As harvest numbers are less biased than population estimates, the corrected data shows little difference from the non-corrected data, and no difference at all in the mid-2010s, with 35,347 individuals harvested in 1984; 155,606 in 2005; 197,308 in 2015; and 202,896 in 2020. The harvest increased six-fold from 1984 to 2020, as well as for the corrected data.
The overall harvest rate increased from 25.96% in 1984 to 31.54% in 2020; however, corrected numbers actually indicated a decline from 25.66% in 1984 to 21.32% in 2020. This could have been attributed to the increase in population size. The harvest rate was the highest in the mid-2010s at 38.2% when considering the non-corrected numbers a. However, the corrected numbers showed the highest harvest rate in the mid-2000s with 30.05%.

3.1. Period from 1984–2000s

In the period from 1984 to the mid-2000s, fallow deer numbers increased in all countries except for Denmark and Romania. The harvest increased in all countries for this period as well, with only a slight decrease in harvest numbers in the Netherlands; however, this could have been due to a smaller hunting effort. The average growth factor for this period was 9.32 for population size and 3.82 for the harvest, with a relatively strong correlation of R2 = 0.68 (Table 2). The strong correlation indicates that the larger the population growth of the countries, the larger the harvest growth between the two time periods.
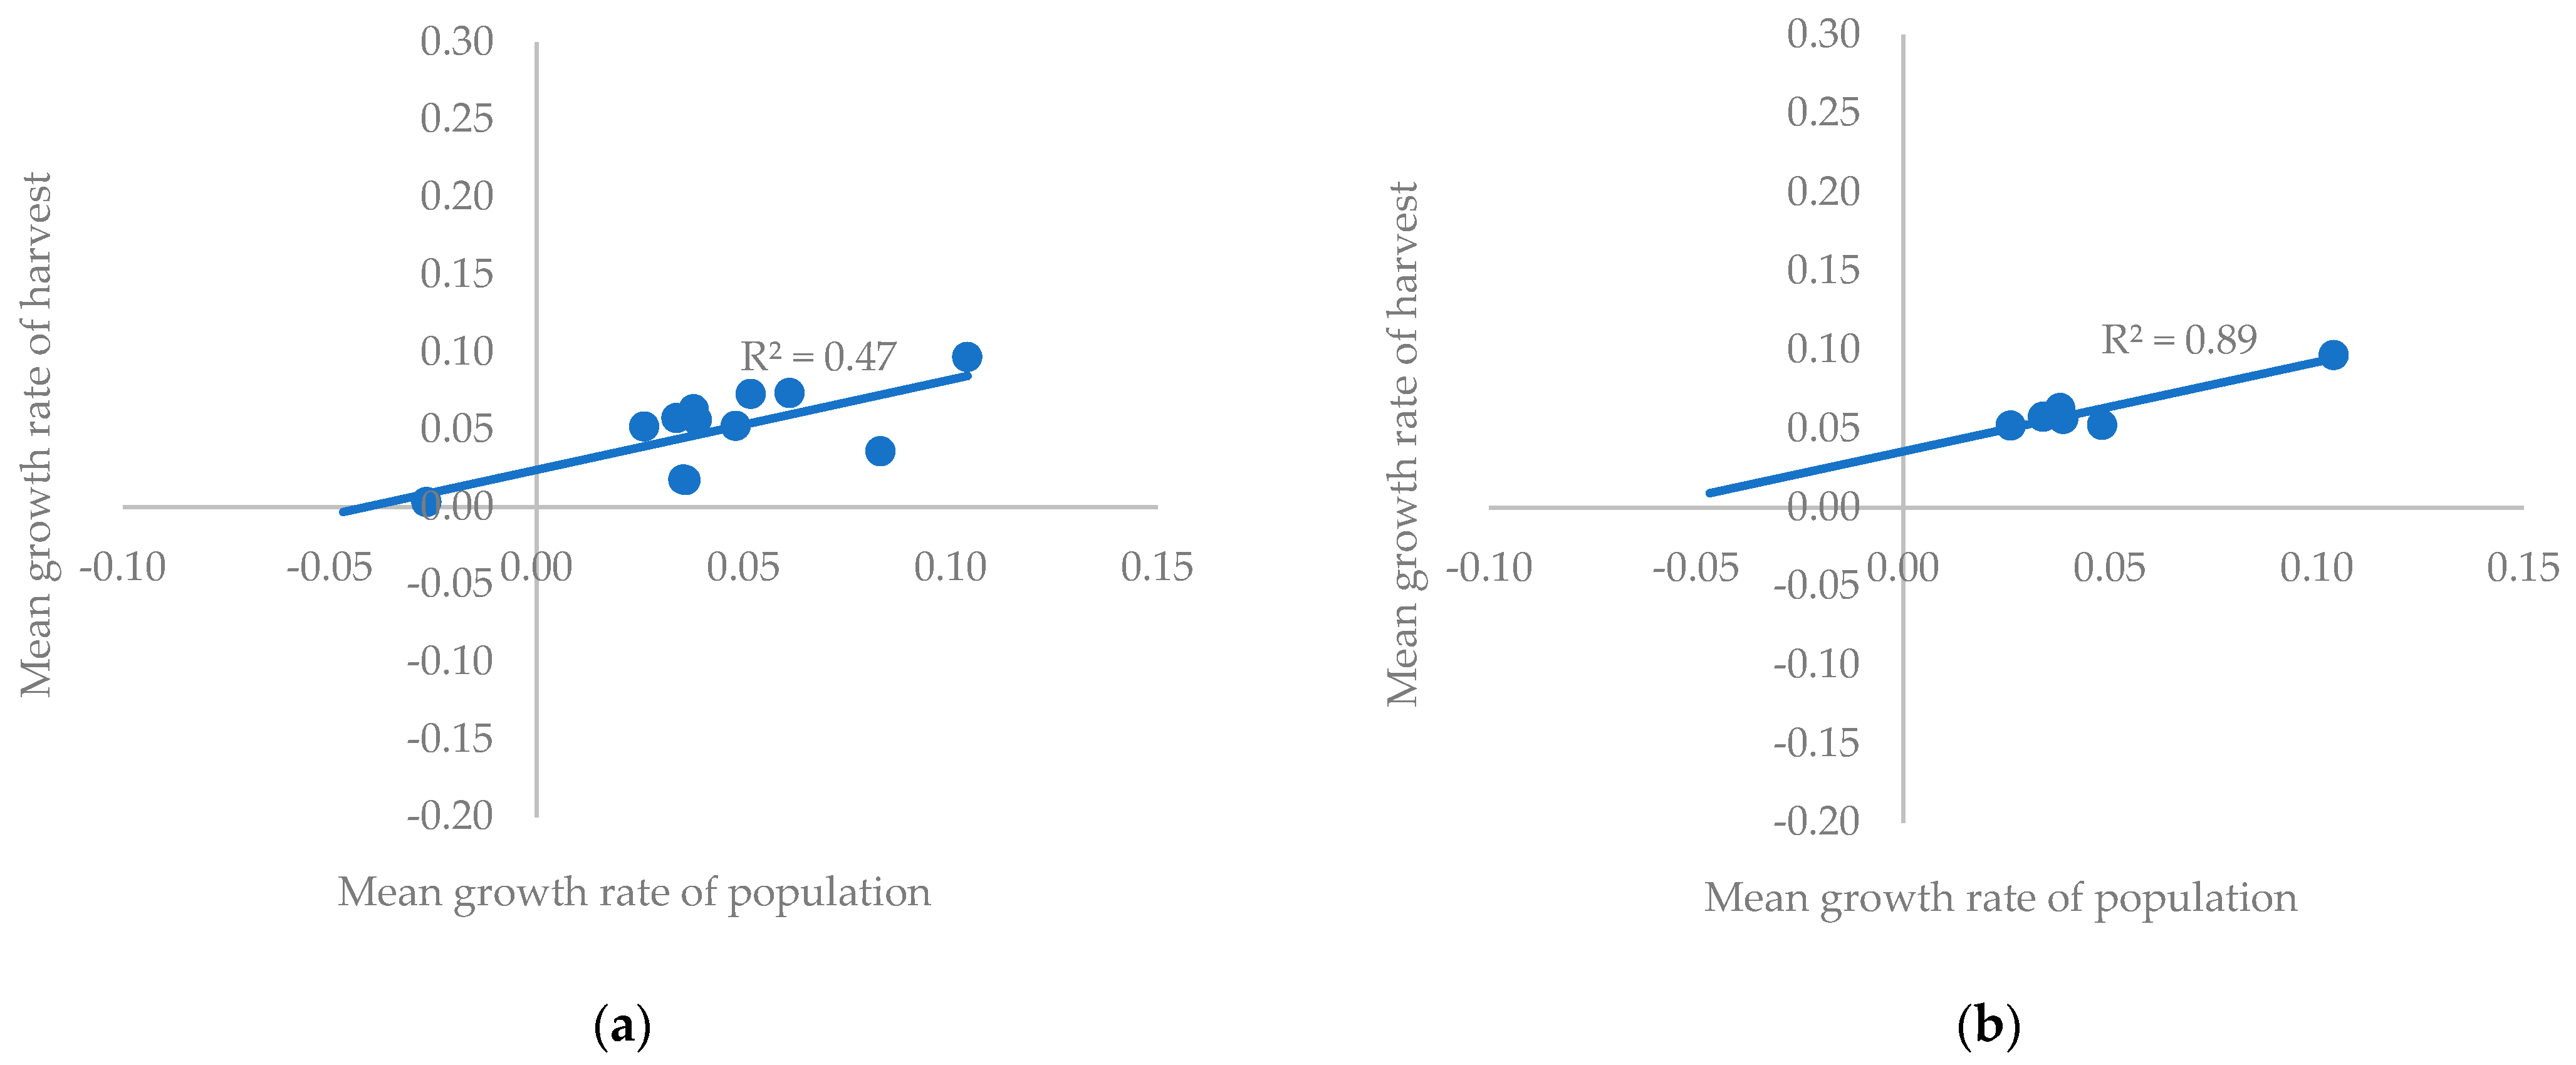
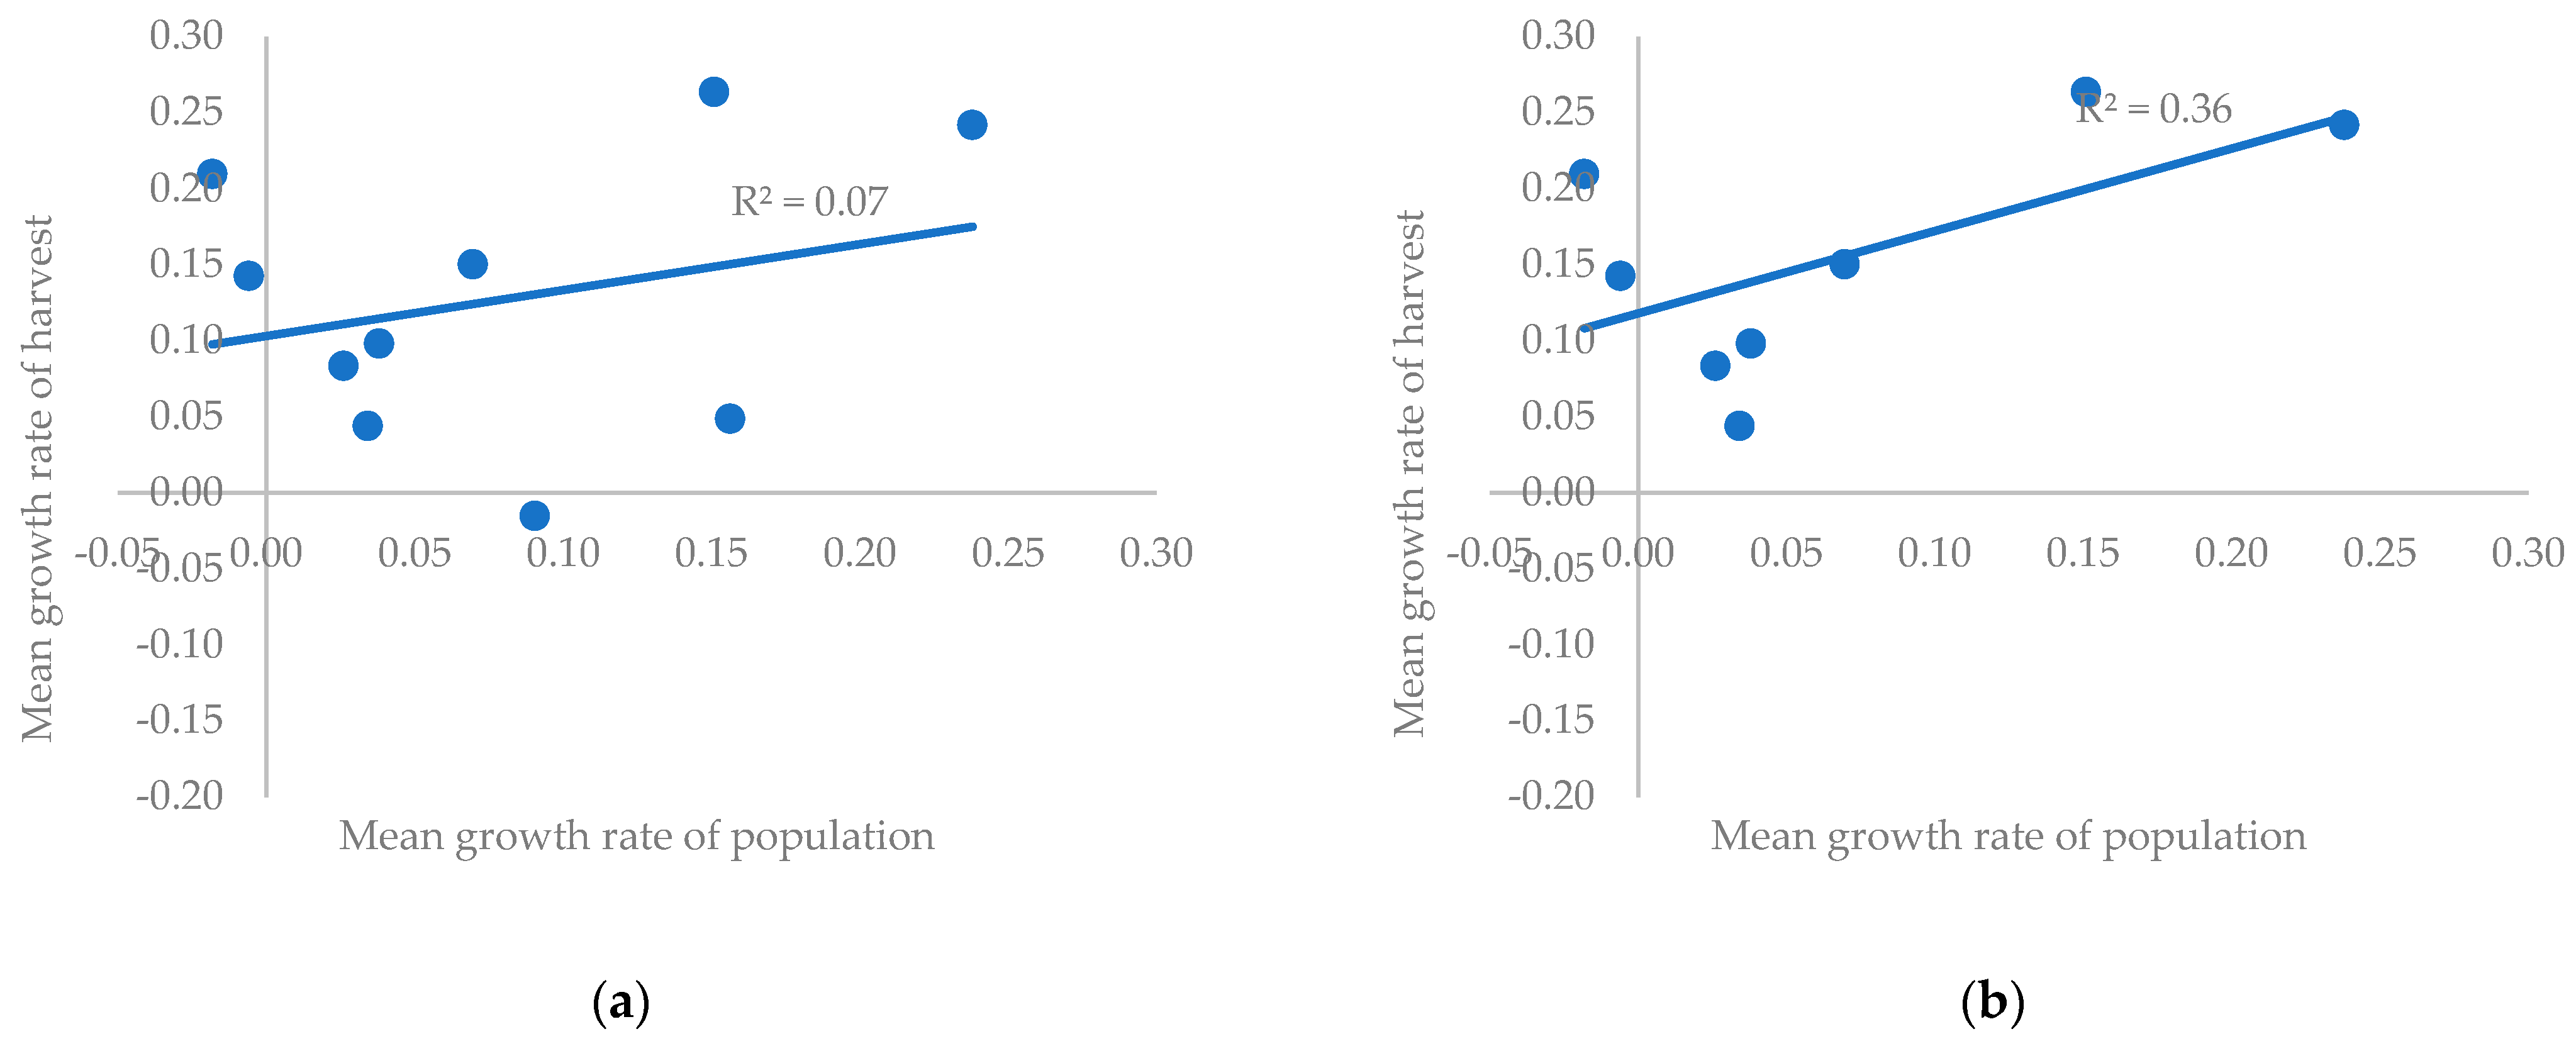
According to the regression analysis of the growth rates, there was a rather weak correlation between the mean growth rate of the population size and harvest for this period (Figure 3). When creating the regression analyses, only non-corrected data were used. However, population sizes were often underestimated, or harvest rates were unusually low compared with the population size, and this created outliers in the dataset. Therefore, when the outlier countries (the Netherlands and Spain) during this period were removed, a much stronger relationship could be observed. This indicates that with a stronger population increase, the hunting pressure increases, and therefore, the harvest as well.

3.2. Period from 1984–2010s

From 1984 to the mid-2010s, the population size decreased only in Greece and Romania; there was no decrease in harvest. The average growth factor was lower compared with the previous, shorter period for the population (5.89), but was higher for the harvest (7.71).
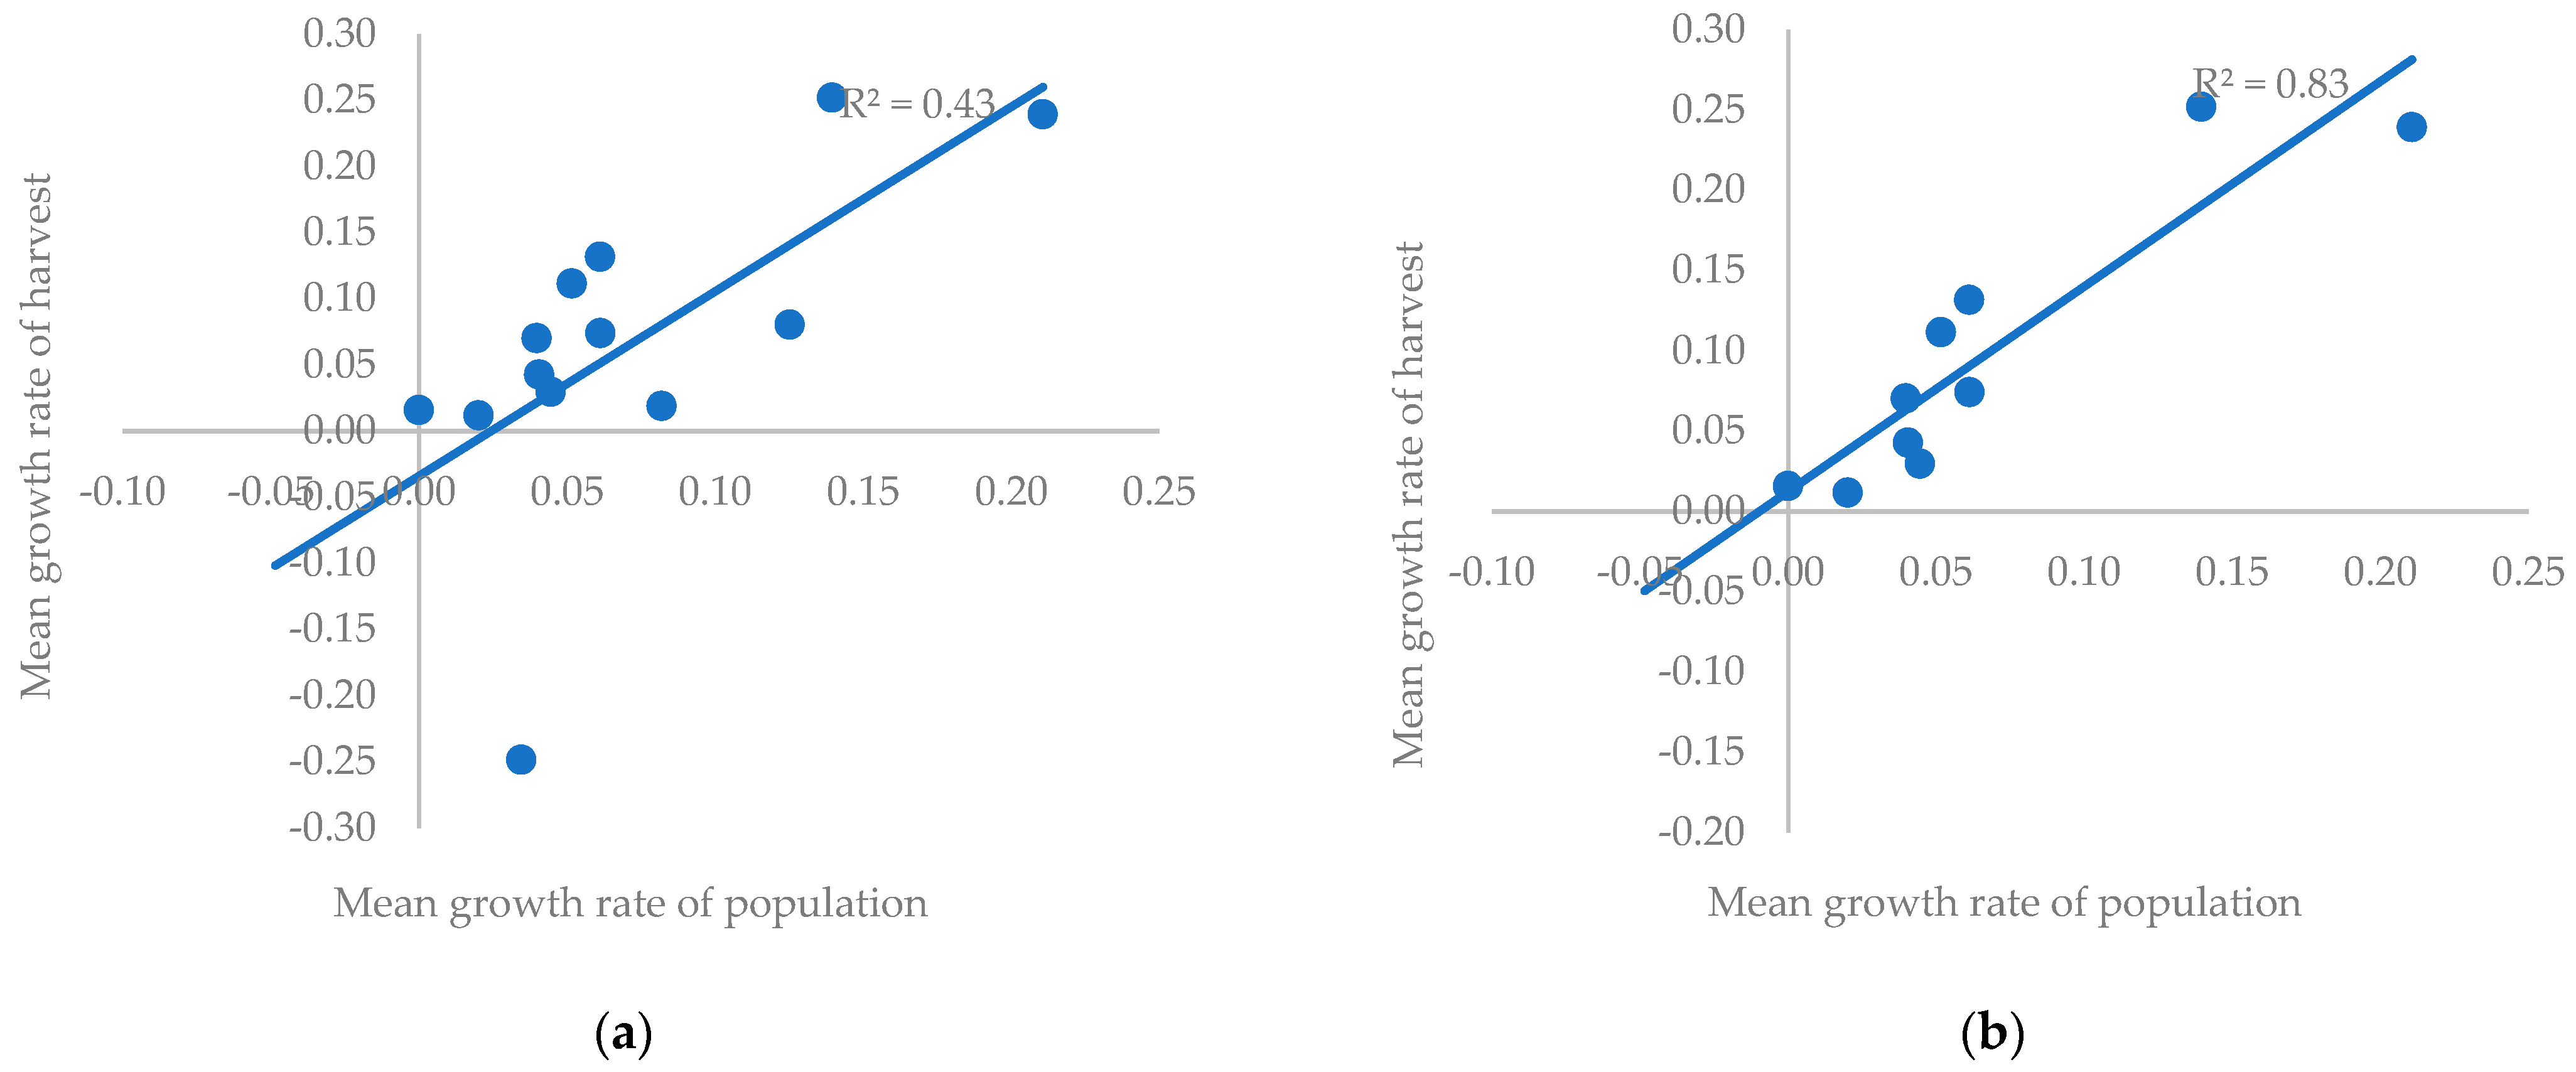
A similar weak correlation could be seen between the average growth rate of the population size and harvest (Figure 4). However, if the Netherlands, Finland, and Serbia were removed as outliers, then a more realistic correlation could be observed, and was the strongest compared with the other periods. The outliers were removed due to a very low harvest compared with the population size.

3.3. Period from 1984–2020s

During the longest period from 1984 to the early 2020s, the fallow deer increased to a large extent in all countries with an average growth factor of 9.27; there was only a slight decrease in Ukraine (0.98). Moreover, there was no decrease in harvest numbers during this period. Fallow deer harvest numbers actually had the highest increase during this period, compared with the other periods, with an average growth factor of 10.85.
Despite the high average growth factors, there was a weak correlation between the annual growth rate of the population size and harvest, even when the outliers were removed (Slovakia and Lithuania) (Figure 5). This could indicate that there was no conscious effort made to increase the hunting pressure on fallow deer as the population was increasing or the populations were drastically underestimated. The outlier Slovakia was removed due to the latter reason; the outlier Lithuania was removed due to its extremely high population growth factor (42.3).

3.4. Period from 2000s–2010s

During a period of approximately ten years, from 2005/2006 to 2015/2016, the fallow deer population and harvest numbers increased, but to a smaller extent. This is also indicated by the low average growth factors (1.97 for population; 3.48 for harvest). The population size decreased in the highest number of countries during this period, namely in Belgium, Germany, Greece, Italy, Romania, Ukraine, and the UK. Harvest numbers decreased in Finland, Italy, Romania, and Serbia.
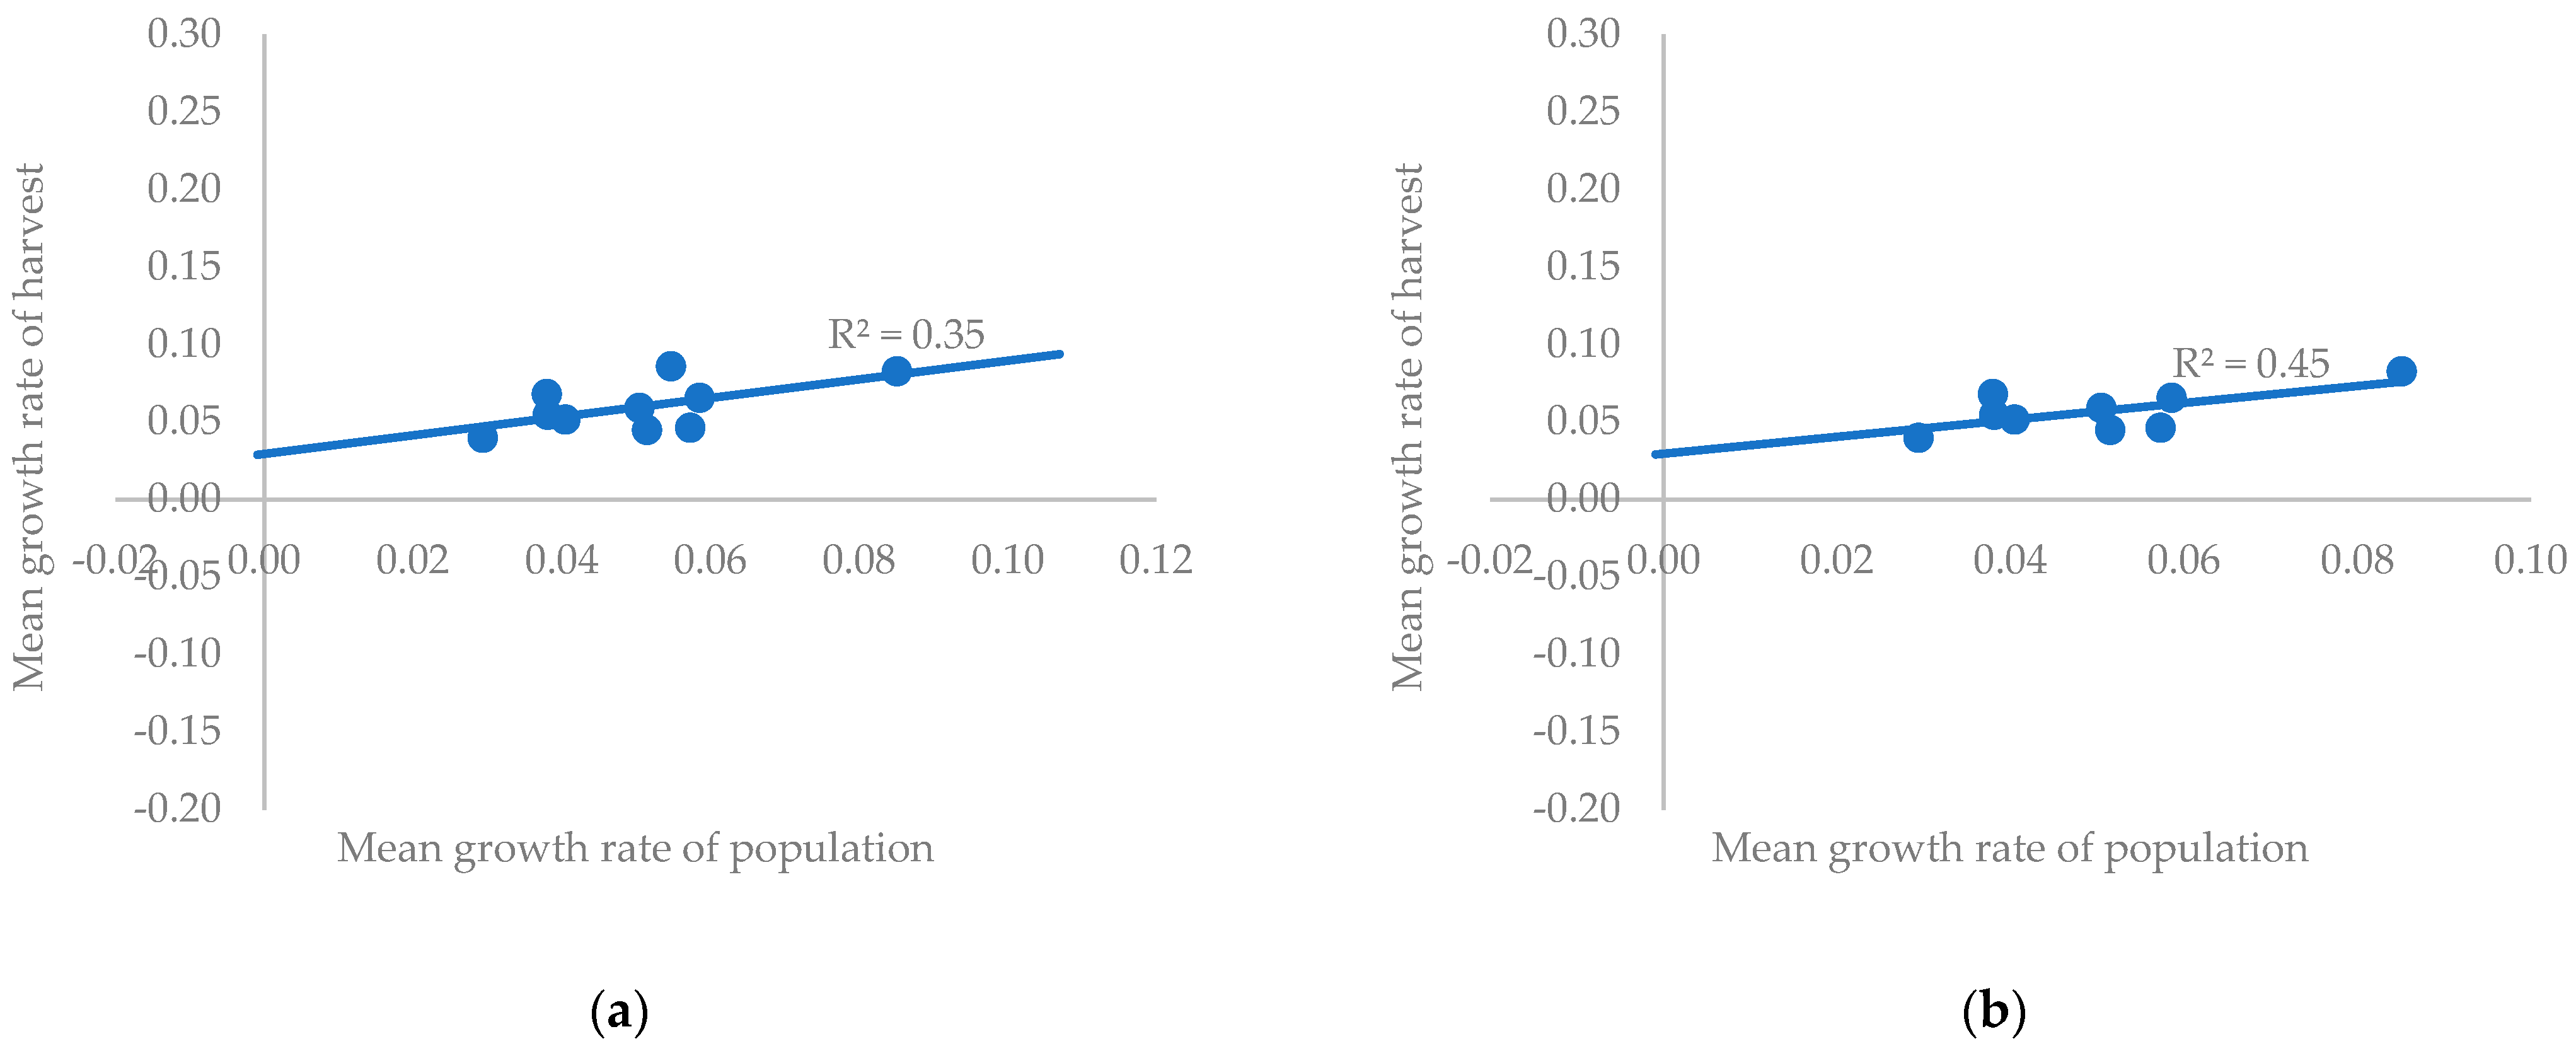
Similar to previous periods, a weak correlation could be found between the average growth rates of the population and harvest numbers (Figure 6). When outliers were removed (Romania, Finland, and Serbia), there was a slightly stronger relationship. The outliers were all countries that had shown a decrease in harvest numbers, which suggests that an increase in population size did not coincide with an increase in harvest.

3.5. Period from 2000s–2020s

From 2005 to 2020, fallow deer numbers increased in all countries except for Ukraine. Harvest numbers decreased only in Sweden and the UK. The average growth factors were quite low compared with the other periods, with 3.97 for the population and 5.52 for the harvest.
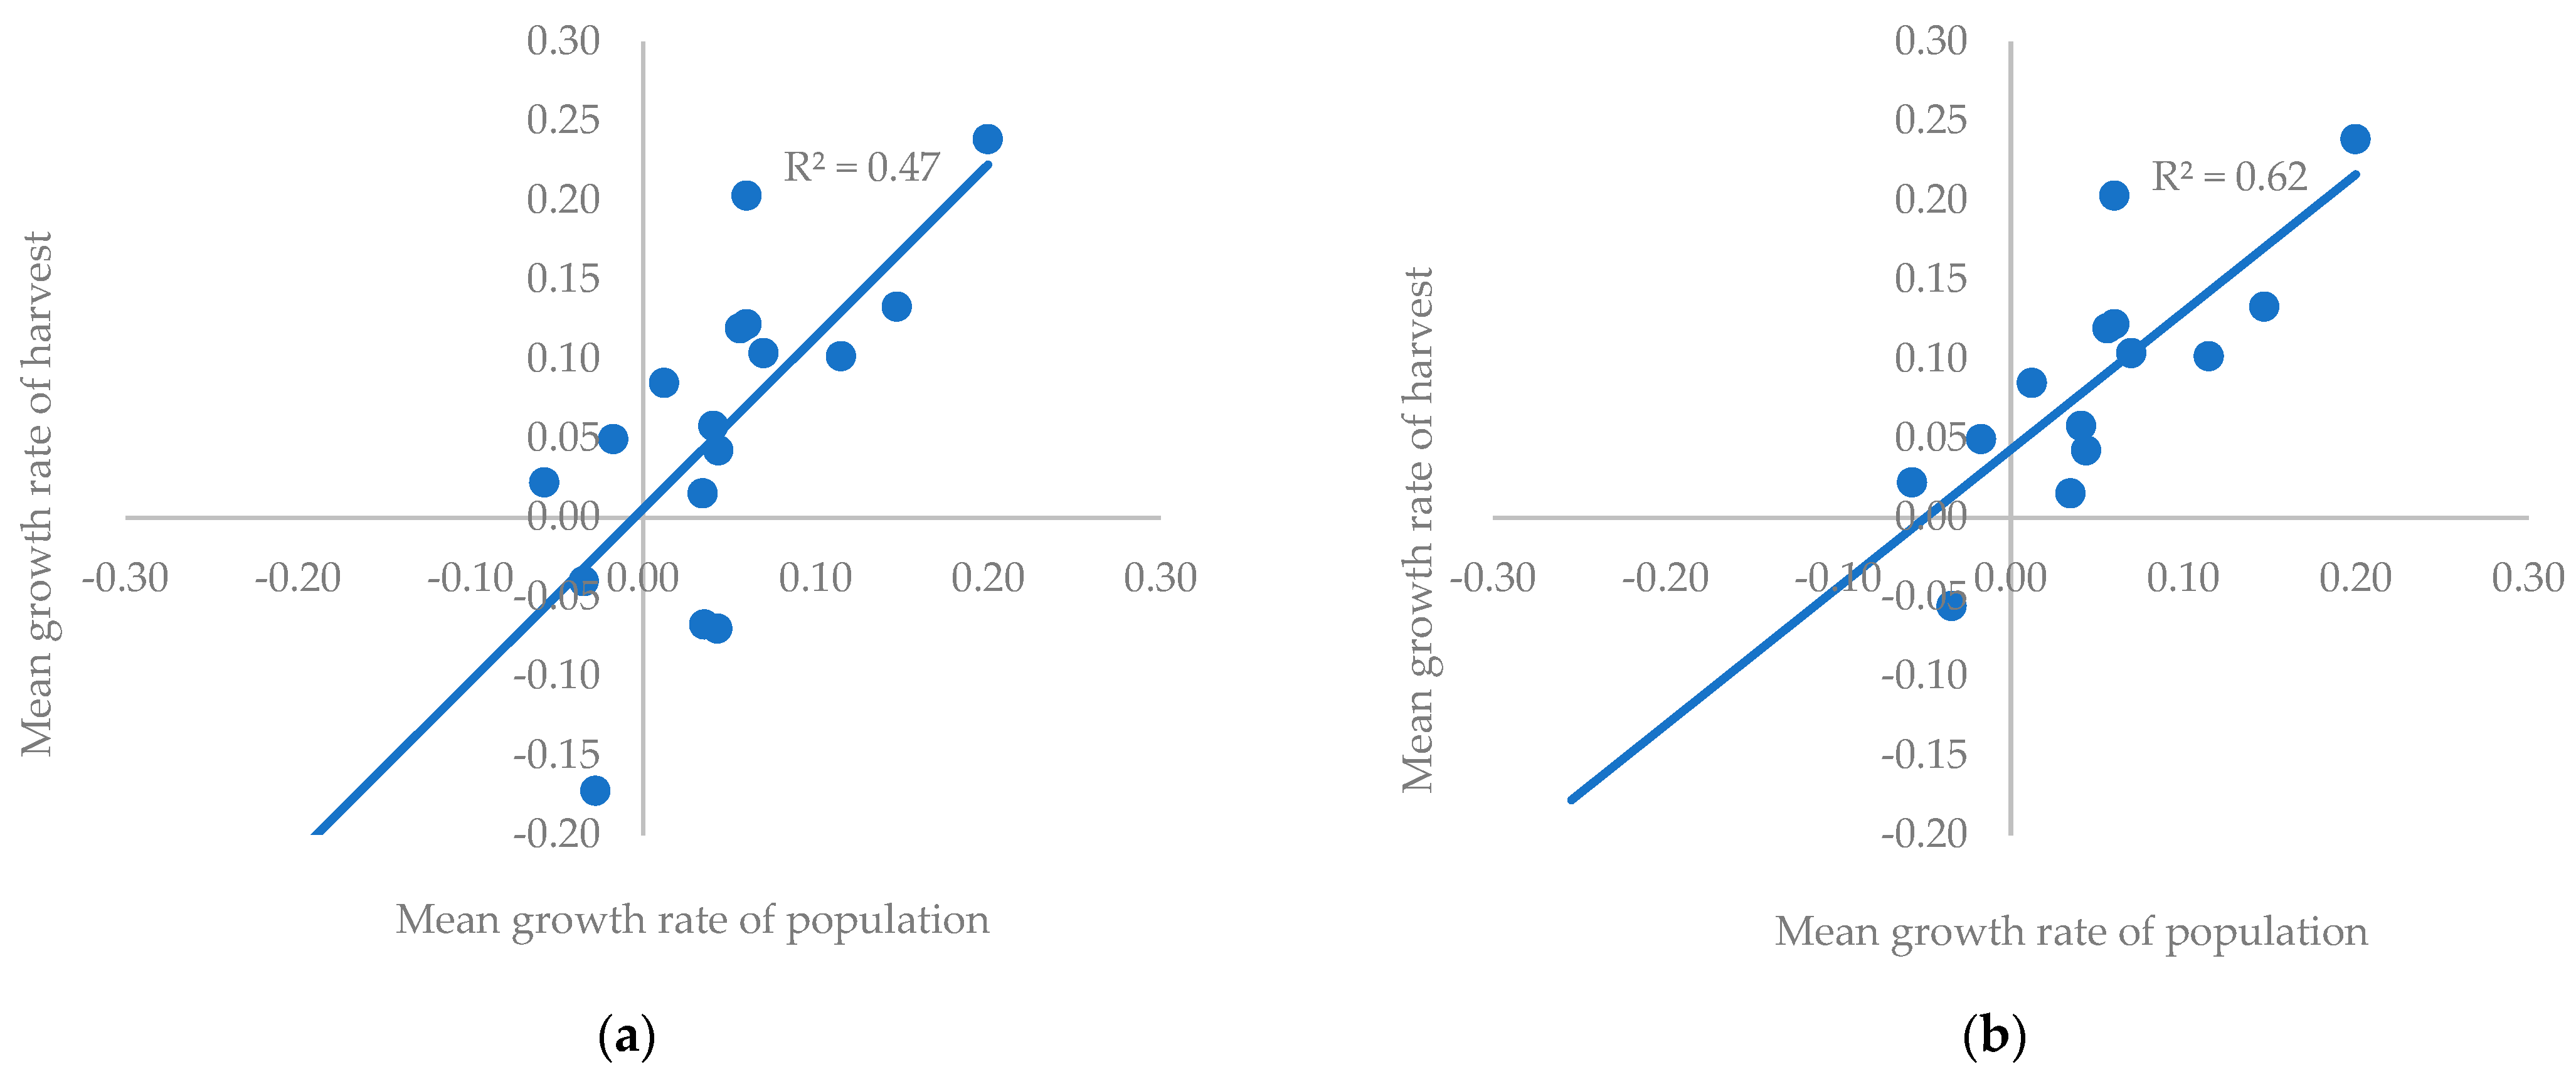
The relationship between the average growth rate of the population and harvest showed a weak correlation; however, removing the outliers (Finland, Demark and the UK) led to a strong correlation (Figure 7). The outliers were removed due to the low harvest compared with population size, especially for the UK because harvest data was only available from Scotland.

3.6. Period from 2010s–2020s

During the shortest period from 2015/2016 to 2020/2021, the fallow deer population showed the least amount of growth and the weakest correlations (Figure 8). The population size decreased in Serbia and Ukraine, and the harvest showed a decrease in Portugal, Sweden, and the UK. The average growth factors were the lowest during this period, with 1.51 for the population size and 1.49 for the harvest.
The removed outliers were the UK and Demark, due to their very low harvest numbers compared with population size. For the UK, this was because harvest data was only available from Scotland.
Altogether, based on the population data, the largest decrease was seen in Romania, where the population decreased in three out of the six periods. This was also the case for roe deer and red deer and could be attributed to unreliable data, high levels of poaching, or unstable political circumstances that resulted in weakened game management [14,15]. Political and economic changes influence wildlife population management scenarios and have been documented for countries in Eastern Europe [62]. The decrease in harvest numbers during the different periods was limited to only a few countries; however, there were different countries decreasing in each period. The exceptions to this were Sweden and the UK, where a decrease could be seen over two periods. The decrease in Sweden could have been due to an increase in large predators (grey wolf (Canis lupus) and, to a lesser extent, the Eurasian lynx (Lynx lynx), resulting in less hunting [63]; the decrease in the UK was due to harvest numbers only being available from Scotland in 2015/2016 and 2018/2019.

4. Discussion

The fallow deer population has increased from over 100,000 to almost 650,000 over the last four decades. However, the corrected (and more probable) numbers show a larger increase, with an overall larger population size: from almost 140,000 to almost one million. The harvest has stayed relatively the same since the mid-2010s, at approximately 200,000, both for corrected and non-corrected numbers. There was a weak correlation between the average growth rate of the population and the harvest. However, when outliers were removed, a much stronger relationship could be seen for the periods 1984–2000s, 1984–2010s, and the mid-2000s–mid-2020s. The outliers were usually countries that had an unusually low harvest compared with the estimated population size. The weak correlations could indicate that, despite the population increase, no efforts were made to harvest more fallow deer, or they could indicate the weakness of data in several European countries. On the other hand, the strong correlations (after outlier removal) show that an increase in population does lead to a larger hunting bag. Similarly, the population growth factor was the strongest between 1984–2000s and 1984–2020s, with almost a ten-fold increase. The growth factor of harvests was the largest between 1984–2010s and 1984–2020s, with an almost eight-fold increase and eleven-fold increase, respectively. This shows that the fallow deer population has significantly increased since the early 1980s.
According to the latest status report of the IUCN, fallow deer are present in 37 European countries [64]. Moreover, the species has been introduced outside of Europe, and can be found in the United States, Argentina, Chile, Peru, Uruguay, South Africa, Australia, New Zealand, the islands in the Fijian group, the Lesser Antilles, and the Pacific coast of Canada [65]. In this study, data was found for 27 countries. However, in the missing 10 countries, fallow deer either had very low numbers or were only kept in enclosures. Therefore, this lack of information would not have significantly impacted the overall populations of (wild) fallow deer.
Moreover, the large difference between corrected and non-corrected population data was due to the underestimation of population sizes. Additionally, fallow deer is a typical farm animal and frequently kept in enclosures and in the majority of the countries, it was not indicated whether the numbers represented deer in captivity or from the wild. Therefore, it could be that the overall population of wild fallow deer was smaller than indicated if deer in enclosures were included in the overall population size. Furthermore, the method of population census (direct or indirect) was not indicated, which could result in inconsistent results between the countries. However, these differences would also be present in the harvest data. Although hunting bags can be less biased, there are national and local differences in hunting effort, which depend on the selection of harvesting locations, harvest strategy, and hunting seasons [66]. Thus, these variations in population censuses and hunting bags could explain the large differences between countries. Despite these differences, increasing trends could clearly be discerned.
Compared with the roe deer and red deer, the fallow deer population increased to a higher extent than expected. Between 1984 and the mid-2000s, both the roe deer and red deer population increased 1.5-fold [14,15], whereas the fallow deer population increased 3.6-fold. Furthermore, the roe deer harvest increased 1.6-fold and the red deer harvest increased 1.7-fold, whereas the fallow deer hunting bag increased 5-fold. This difference could be due to a preference of hunters for roe deer and red deer, which results in stronger management of these species. In fact, the share of game meat is the highest for red deer and roe deer [67,68,69]. These cervids are also considered the most overabundant, according to the scientific literature [70]. Although fallow deer are also known for their ability to reach high densities [71], the stronger population increase compared with the roe and red deer shows that the fallow deer managed to increase their population more despite the higher hunting pressure. The fallow deer had smaller numbers at the beginning of its expansion, which explains the stronger support of managers and hunters for its increase. Consequently, the stronger increase resulted in a higher harvest compared with the roe and red deer. In addition, the fallow deer are able to survive with lower-quality resources [72]. This is a consequence of its long history living in human-dominated areas (hunting gardens, parks, etc.) [1]. Therefore, their adaptation to human-dominated landscapes could be more successful as a result of a higher number of suitable habitats for foraging and cover [73].
The increase in cervids in the last few decades, including fallow deer, can be attributed to multiple factors. The most obvious reasons are an increase in forage in forested areas and the reduction in hunting and natural predators throughout the twentieth century [74]. However, the latter is starting to reverse as wolves, brown bears (Ursus arctos), Eurasian lynx, and wolverines (Gulo gulo) are expanding into countries from which they disappeared at the beginning of the twentieth century [75]. In the future, this could result in declining deer populations in areas with high densities of large carnivores, as in the case of Poland [76] and Scandinavia [77].
As of now, it is essential to have consistent, reliable data collection and monitoring programs in place to tackle local overabundance [78], efficiently manage the increasing population, and close knowledge gaps regarding its worldwide distribution. If the current trend continues, negative impacts such as damage to forestry and agriculture, disease transmission, or vehicle collisions could increase [6,7,8,9,73]. Therefore, fallow deer populations need to be managed on a local level first, based on clearly set objectives, in cooperation with stakeholders. It is essential to emphasise the management of fallow deer based on adaptive harvest management (flexible and responsive) to reduce the population increase, and consequently, potential negative impacts [79]. However, positive impacts like the provision of recreation and game meat should not be overlooked, but instead utilised in a sustainable manner [67,68,69,73]. Thus, full responsibility should be taken for the appropriate and integrated management of the species of fallow deer [73] in a way that ensures sustainability.

Author Contributions

Conceptualization, S.C.; methodology, S.C.; validation, H.B. and S.C.; formal analysis, H.B. and S.C.; investigation, H.B.; data curation, H.B.; writing—original draft preparation, H.B.; writing—review and editing, S.C.; visualization, H.B.; supervision, S.C.; project administration, H.B. All authors have read and agreed to the published version of the manuscript.

Funding

This research was supported by the National Research, Development and Innovation Office within the framework of the National Laboratory for Health Security programme (RRF-2.3.1-21-2022-00006).

Institutional Review Board Statement

Not applicable.

Informed Consent Statement

Not applicable.

Data Availability Statement

Publicly available datasets were analysed in this study. This data can be found here: Austria: https://www.statistik.at/web_en/statistics/Economy/agriculture_and_forestry/livestock_animal_production/hunting/029432.html (accessed on 8 August 2022); Belgium (Flanders): https://grofwildjacht.inbo.be/ (accessed on 8 August 2022); Czech Republic: https://www.czso.cz/csu/czso/home?p_p_id=3&p_p_lifecycle=0&p_p_state=maximized&p_p_mode=view&_3_struts_action=%2Fsearch%2Fsearch&_3_redirect=%2Fc%2Fportal%2Flayout%3Fp_l_id%3D20137706%26p_v_l_s_g_id%3D0&_3_keywords=hunting+&_3_groupId=0&x=0&y=0 (accessed on 8 August 2022); Denmark: https://fauna.au.dk/jagt-og-vildtforvaltning/vildtudbytte/udbyttet-online-siden-1941/soejlediagram (accessed on 8 August 2022); Finland: http://statdb.luke.fi/PXWeb/pxweb/en/LUKE/LUKE__06%20Kala%20ja%20riista__02%20Rakenne%20ja%20tuotanto__16%20Metsastys/?tablelist=true&rxid=61ae8652-2a26-41c0-ab11-996566cbdb43 (accessed on 8 August 2022); Luxembourg: https://lustat.statec.lu/vis?lc=en&tm=game&pg=0&df[ds]=ds-release&df[id]=DF_D2400&df[ag]=LU1&df[vs]=1.0&dq=A..A043%2BA044%2BA045%2BA046%2BA047&ly[rw]=SPECIFICATION&ly[cl]=YEARS (accessed on 8 August 2022); Macedonia: http://makstat.stat.gov.mk/PXWeb/pxweb/en/MakStat/MakStat__Zemjodelstvo__LovRibolov/?rxid=a67499a2-b149-42e1-a32b-170e77d1bf88 (accessed on 8 August 2022); Slovakia: https://gis.nlcsk.org/IBULH/PolovStat/PolovStat (accessed on 8 August 2022); Sweden: https://rapport.viltdata.se/statistik/ (accessed on 8 August 2022).

Acknowledgments

The authors express their gratitude to all whom have provided them with unpublished data to support this study.

Conflicts of Interest

The authors declare no conflict of interest.

Appendix A

Fallow deer population and harvest data collected from European countries for 1984, the mid-2000s, mid-2010s, and early 2020s with calculated harvest rates. Corrected numbers are highlighted in yellow.
Figure A1. Fallow deer population and harvest data collected from European countries for 1984 with calculated harvest rates. Corrected numbers are highlighted in yellow.
Sustainability 14 12198 g0a1
Figure A2. Fallow deer population and harvest data collected from European countries for the mid-2000s with calculated harvest rates. Corrected numbers are highlighted in yellow.
Sustainability 14 12198 g0a2
Figure A3. Fallow deer population and harvest data collected from European countries for the mid-2010s with calculated harvest rates. Corrected numbers are highlighted in yellow.
Sustainability 14 12198 g0a3
Figure A4. Fallow deer population and harvest data collected from European countries for the early 2020s with calculated harvest rates. Corrected numbers are highlighted in yellow.
Sustainability 14 12198 g0a4

References

  1. Chapman, N.G.; Chapman, D.I. The distribution of fallow deer: A worldwide review. Mamm. Rev. 1980, 10, 61–138. [Google Scholar] [CrossRef]
  2. Ludwig, A.; Vernesi, C.; Lieckfeldt, D.; Lattenkamp, E.Z.; Wiethölter, A.; Lutz, W. Origins and patterns of genetic diversity of German fallow deer as inferred by mitochondrial DNA. Eur. J. Wildl. Res. 2012, 58, 495–501. [Google Scholar] [CrossRef]
  3. De Marinis, A.M.; Chirichella, R.; Apollonio, M. Common Fallow Deer Dama dama (Linnaeus, 1758). In Handbook of the Mammals of Europe; Hackländer, K., Zachos, F., Eds.; Springer Nature: Cham, Switzerland, 2022; pp. 1–41. [Google Scholar]
  4. Masseti, M. The postglacial diffusion of the genus Dama Frisch, 1775, in the Mediterranean region. Ric. Biol. Selvag. 1996, 25, 7–29. [Google Scholar]
  5. Chakanya, C.; Muchenje, V.; Hoffman, L.C. The fallow deer (Dama spp.); endangered or not? Zool. Gart. 2016, 85, 160–172. [Google Scholar] [CrossRef]
  6. Relva, M.A.; Nunez, M.A.; Simberloff, D. Introduced deer reduce native plant cover and facilitate invasion of non-native tree species: Evidence for invasional meltdown. Biol. Invasions 2010, 12, 303–311. [Google Scholar] [CrossRef]
  7. Martin, T.G.; Arcese, P.; Scheeder, N. Browsing down our natural heritage: Deer impacts on vegetation structure and songbird populations across an island archipelago. Biol. Cons. 2011, 144, 459–469. [Google Scholar] [CrossRef]
  8. Spear, D.; Chown, S. Non-indigenous ungulates as a threat to biodiversity. J. Zool. 2009, 279, 1–17. [Google Scholar] [CrossRef]
  9. Khoshbakht, R.; Tabatabaei, M.; Aski, H.S.; Shayegh, H. Distribution of Salmonella, Arcobacter, and thermophilic Campylobacter spp. among Persian fallow deer (Dama mesopotamica) populationin Dasht-e-Arzhan wildlife refuge, southern Iran. Comp. Clin. Pathol. 2015, 24, 777–781. [Google Scholar] [CrossRef]
  10. Genovesi, P.; Bacher, S.; Kobelt, M.; Pascal, M.; Scalera, R. Alien Mammals of Europe. In Handbook of Alien Species in Europe; Invading Nature—Springer Series in Invasion Ecology; Springer: Dordrecht, The Netherlands, 2009; Volume 3, pp. 119–128. [Google Scholar]
  11. Esattore, B.; Saggiomo, L.; Sensi, M.; Francia, V.; Cherin, M. Tell me what you eat and I’ll tell you…where you live: An updated review of the worldwide distribution and foraging ecology of the fallow deer (Dama dama). Mamm. Biol. 2022, 102, 321–338. [Google Scholar] [CrossRef]
  12. Putman, R.; Apollonio, M.; Andersen, R. Ungulate Management in Europe: Problems and Practices; Cambridge University Press: New York, NY, USA, 2011; pp. 1–395. [Google Scholar]
  13. Ahl, M.; Elmhagen, B.; Bergqvist, G. Survey of methods for harvest reporting of game species in Europe. Viltforum 2021, 2020/5, 1–49. [Google Scholar]
  14. Burbaitė, L.; Csányi, S. Roe deer population and harvest changes in Europe. Estonian J. Ecol. 2009, 58, 169–180. [Google Scholar] [CrossRef]
  15. Burbaitė, L.; Csányi, S. Red deer population and harvest changes in Europe. Acta Zool. Litu. 2010, 20, 179–188. [Google Scholar] [CrossRef] [Green Version]
  16. Gill, R. Monitoring the Status of European and North American Cervids; GEMS Information Series; Global Environment Monitoring System; United Nations Environment Programme: Nairobi, Kenya, 1990; No. 8; p. 277. [Google Scholar]
  17. CIC (International Council for Game and Wildlife Conservation). Le Daim, The Fallow Deer, Der Damwild (Dama dama L.). In Proceedings of the Symposium, Budapest, Hungary, 16–17 January 1984. [Google Scholar]
  18. National Statistical Institute. Statistical Reference Book 2021; National Statistical Institute: Sofia, Bulgaria, 2021.
  19. National Statistical Institute. Statistical Reference Book 2017; National Statistical Institute: Sofia, Bulgaria, 2017.
  20. Stoyanov, N.; Stoyanova, M. Geneva Timber and Forest Discussion Paper 38—Forest and Forest Products Country Profile: Republic of Bulgaria; United Nations: Geneva, Switzerland, 2005. [Google Scholar]
  21. Vildtbestande og Jagttider i Danmark: Det Biologiske Grundlag for Jagttidsrevisionen 2018; Videnskabelig Rapport fra DCE—Nationalt Center for Miljø og Energi. Nr. 195; Aarhus Universitet: Aarhus, Denmark, 2016.
  22. Danmarks Jaegerforbund. Hjortevildt Oversigten 2020. Natur/vildtforvaltning, Jaeger 9/2020. Available online: https://www.jaegerforbundet.dk/media/15834/hjortevildtoversigten_2020.pdf (accessed on 20 August 2022).
  23. ONCFS (Office National de la Chasse et de la Faune Sauvage). Grand Ongulés—Tableaux de Chasse Nationaux. Available online: http://www.oncfs.gouv.fr/Grands-ongules-Tableaux-de-chasse-ru248/-Grands-ongules-Tableaux-de-chasse-nationaux-news467 (accessed on 9 August 2017).
  24. Saint-Andrieux, C. Prélèvements Ongulés Sauvages Saison 2020–2021; Réseau Ongulés Sauvages: La Petite-Pierre, France, 2021. [Google Scholar]
  25. Bayerischer Jagdverband e.V. Damwild. Available online: https://www.jagd-bayern.de/damwild.html (accessed on 15 August 2017).
  26. Bestand des Damwildes in Deutschland; Drucksache 20/532; Deutscher Bundestag: Berlin, Germany, 2022.
  27. Mattila, M.; Hadjigeorgiou, I. Conservation and management of fallow deer (Dama dama dama L.) on Lemnos Island, Greece. Turk. J. Vet. Anim. Sci. 2015, 39, 560–567. [Google Scholar] [CrossRef]
  28. Vadgazdálkodási Adattár—2005/2006; Vadászati Év; Országos Vadgazdálkodási Adattár: Gödöllő, Hungary, 2006; 63p.
  29. Csányi, S.; Kovács, I.; Csókás, A.; Putz, K.; Schally, G. Vadgazdálkodási Adattár—2015/2016; Vadászati Év; Országos Vadgazdálkodási Adattár: Gödöllő, Hungary, 2016; 48p. [Google Scholar]
  30. Csányi, S.; Márton, M.; Major, F.C.; Schally, G. Vadgazdálkodási Adattár—2020/2021; Vadászati Év; Országos Vadgazdálkodási Adattár: Gödöllő, Hungary, 2021; 70p. [Google Scholar]
  31. Carnevali, L.; Pedrotti, L.; Riga, F.; Toso, S. Banca Dati Ungulati: Status, Distribuzione, Consistenza, Gestione e Prelievo Venatorio Delle Popolazioni di Ungulati in Italia; Rapporto INFS 2001–2005; ISPRA: Rome, Italy, 2009. [Google Scholar]
  32. Mazzella, D. (Ed.) Linee Guida per la Gestione Degli Ungulati. Manuali e Linee Guida 91/2013; ISPRA (L’istituto Superiore per la Protezione e la Ricerca Ambientale): Rome, Italy, 2013. [Google Scholar]
  33. Lithuanian State Forest Service. Lithuanian Statistical Yearbook of Forestry 2006; Ministry of Environment: Vilnius, Lithuania, 2007.
  34. Lithuanian State Forest Service. Lithuanian Statistical Yearbook of Forestry 2016; Ministry of Environment: Vilnius, Lithuania, 2017.
  35. Lithuanian State Forest Service. Lithuanian Statistical Yearbook of Forestry 2020; Ministry of Environment: Vilnius, Lithuania, 2021.
  36. Spek, G.J. Jaarrapportage Grofwild 2016–2017; Nieuwsbrief nr 43; Vereniging Wildbeheer Veluwe: Vaassen, The Netherlands, 2017. [Google Scholar]
  37. Faunabeheereenheid. Available online: https://www.faunabeheereenheid.nl (accessed on 10 March 2022).
  38. Central Statistical Office, Agriculture Department; Domaszewicz, B. Forestry 2016; Central Statistical Office: Warsaw, Poland, 2016. [Google Scholar]
  39. Rozkrut, D. (Ed.) Statistical Yearbook of Forestry 2021; Statistics Poland: Warsaw, Poland, 2021.
  40. Fondul Cinegetic 2008; Nr. 146 din 31 iulie 2009; Comunicat de Presă; National Institute of Statistics: Bucharest, Romania, 2009.
  41. Kovačić, M. (Ed.) Forestry in the Republic of Serbia 2020; Bulletin; Statistical Office of the Republic of Serbia: Belgrade, Serbia, 2021.
  42. Poročilo Zavoda za Gozdove Slovenije o Gozdovih za Leto 2015; Zavod za Gozdove Slovenije: Ljubljana, Slovenia, 2016.
  43. Poročilo Zavoda za Gozdove Slovenije o Gozdovih za Leto 2020; Zavod za Gozdove Slovenije: Ljubljana, Slovenia, 2021.
  44. Anuario de Estadística Forestal 2005; Ministerio para la Transición Ecológica y el Reto Demográfico: Madrid, Spain. Available online: https://www.miteco.gob.es/es/biodiversidad/estadisticas/forestal_anuario_2005.aspx (accessed on 10 August 2022).
  45. Anuario de Estadística Forestal 2014–2015; Ministerio para la Transición Ecológica y el Reto Demográfico: Madrid, Spain, 2018.
  46. Anuario de Estadística Forestal 2019; Ministerio para la Transición Ecológica y el Reto Demográfico: Madrid, Spain, 2021.
  47. Danell, K.; Bergström, R. Vilt, Människa, Samhälle; Liber: Stockholm, Sweden, 2010; 320p. [Google Scholar]
  48. Verner, I. (Ed.) Statistical Yearbook of Ukraine 2005; State Statistics Service of Ukraine: Kyic, Ukraine, 2006.
  49. Verner, I. (Ed.) Statistical Yearbook of Ukraine 2015; State Statistics Service of Ukraine: Kyic, Ukraine, 2016.
  50. Verner, I. (Ed.) Statistical Yearbook of Ukraine 2020; State Statistics Service of Ukraine: Kyic, Ukraine, 2021.
  51. NatureScot. Available online: https://www.nature.scot/snh-deer-census-results (accessed on 4 March 2022).
  52. Mathews, F.; Harrower, C. IUCN—Compliant Red List for Britain’s Terrestrial Mammals. Assessment by the Mammal Society under contract to Natural England, Natural Resources Wales and Scottish Natural Heritage; Natural England: Peterborough, UK, 2020.
  53. Prigioni, C. Distribution of mammals in Albania. Hystrix-Ital. J. Mammal. 1996, 8, 67–73. [Google Scholar] [CrossRef]
  54. Jędrzejewska, B.; Jędrzejewski, W.; Bunevich, A.N.; Miłkowski, L.; Krasiński, Z.A. Factors shaping population densities and increase rates of ungulates in Bialowieza Primeval Forest (Poland and Belarus) in the 19th and 20th centuries. Acta Theriol. 1997, 42, 399–451. [Google Scholar] [CrossRef]
  55. Polaz, S.; Anisimova, A.; Labanouskaya, P.; Viarbitskaya, A.; Kudzelic, V. The role of wild and domestic ungulates in forming the helminth fauna of European bison in Belarus. Eur. Bison Conserv. Newsl. 2017, 10, 79–86. [Google Scholar]
  56. Omeragić, J.; Zuko, A. Review of investigations of parasitofauna of wild animals in Bosnia and Herzegovina. Veterinaria 2011, 60, 251–257. [Google Scholar]
  57. Csányi, S.; Majzinger, I. Az őzállományok növekedése és hasznosítása. In Az Őz: Ökológia És Alkalmazkodó Gazdálkodás; Csányi, S., Majzinger, I., Eds.; Szent István Egyetem Kiadó: Gödöllő, Hungary, 2018; pp. 22–39. [Google Scholar]
  58. Silliman, R.P.; Gutsell. J.S. Experimental exploitation of fish populations. U. S. Fish Wildl. Serv. Fish Bull. 1958, 58, 215–252. [Google Scholar]
  59. Caughley, G. Wildlife management and the dynamics of ungulate populations. In Applied Biology; Coaker, T.H., Ed.; Academic Press: London, UK, 1976; pp. 183–246. [Google Scholar]
  60. McCullough, D.R. The George Reserve Deer Herd: Population Ecology of a K-Selected Species; University of Michigan Press: Ann Arbor, MI, USA, 1979; 271p. [Google Scholar]
  61. Kaji, K.; Saitoh, T.; Uno, H.; Matsuda, H.; Yamamura, K. Adaptive management of sika deer populations in Hokkaido, Japan: Theory and practice. Popul. Ecol. 2010, 52, 373–387. [Google Scholar] [CrossRef]
  62. Bragina, E.V.; Ives, A.R.; Pidgeon, A.M.; Balčiauskas, L.; Csányi, S.; Khoyetskyy, P.; Kysucká, K.; Lieskovsky, J.; Ozolins, J.; Randveer, T.; et al. Wildlife population changes across Eastern Europe after the collapse of socialism. Front. Ecol. Environ. 2018, 16, 77–81. [Google Scholar] [CrossRef]
  63. Häggmark, T.S.; Elofsson, K. Estimating the Marginal Impact of Large Carnivores on the Hunting Value of Roe Deer; Working Paper Series from Swedish University of Agricultural Sciences, Department Economics Department of Economics, Box 7013; Swedish University of Agricultural Sciences: Uppsala, Sweden, 2016. [Google Scholar]
  64. Masseti, M.; Mertzanidou, D. Dama dama. The IUCN Red List of Threatened Species 2008: E.T42188A10656554. Available online: https://www.iucnredlist.org/species/42188/10656554 (accessed on 15 August 2022).
  65. Appollonio, M. Dama dama. In The Atlas of European Mammals; Mitchell-Jones, A.J., Amori, G., Bogdanowicz, W., Kryštufek, B., Reijnders, P.J.H., Spitzenberger, F., Stübbe, M., Thissen, J.B.M., Vohralík, V., Zima, J., Eds.; Academic Press: London, UK, 1999. [Google Scholar]
  66. Fischer, M.L.; Sullivan, M.J.P.; Greiser, G.; Guerrero-Casado, J.; Heddergott, M.; Hohmann, U.; Klein, R. Assessing and predicting the spread of non-native raccoons in Germany using hunting bag data and dispersal weighted models. Biol. Invasions 2015, 18, 57–71. [Google Scholar] [CrossRef]
  67. Csányi, S.; Carranza, J.; Pokorny, B.; Putman, R.; Ryan, M. Valuing Ungulates in Europe. In Behaviour and Management of European Ungulates, 1st ed.; Putman, R., Apollonio, M., Eds.; Whittles Publishing: Dunbeath, Scotland, 2014; pp. 13–45. [Google Scholar]
  68. Sonkoly, K.; Bleier, N.; Heltai, M.; Katona, K.; Szemethy, L.; Szabó, L.; Beregi, A.; Csányi, S. Big game meat production in Hungary: A special product of a niche market. Hung. Agric. Res. 2013, 22, 12–16. [Google Scholar]
  69. Ramanzin, M.; Amici, A.; Casoli, C.; Esposito, L.; Lupi, P.; Marsico, G.; Mattiello, S.; Olivieri, O.; Ponzetta, M.P.; Russo, C.; et al. Meat from wild ungulates: Ensuring quality and hygiene of an increasing resource. Ital. J. Anim. Sci. 2010, 9, e61. [Google Scholar]
  70. Carpio, A.; Acevedo, P.; Apollonio, M. Wild ungulate overabundance in Europe: Contexts, causes, monitoring and management recommendations. Mamm. Rev. 2020, 51, 95–108. [Google Scholar] [CrossRef]
  71. Menichetti, L.; Touzot, L.; Elofsson, K.; Hyvönen, R.; Kätterer, T.; Kjellander, P. Interactions between a population of fallow deer (Dama dama), humans and crops in a managed composite temperate landscape in southern Sweden: Conflict or opportunity? PLoS ONE 2019, 14, e0215594. [Google Scholar] [CrossRef] [PubMed]
  72. Hofmann, R.R. Digestive physiology of the deer—Their morphophysiological specialisation and adaptation. J. R. Soc. N. Z. 1985, 22, 393–407. [Google Scholar]
  73. Kenward, R.; Putman, R. Ungulate management in Europe: Towards a sustainable future. In Ungulate Management in Europe: Problems and Practices; Putman, R., Apollonio, M., Andersen, R., Eds.; Cambridge University Press: Cambridge, UK, 2011; pp. 376–395. [Google Scholar]
  74. Côté, S.D.; Rooney, T.P.; Tremblay, J.P.; Dussault, C.; Waller, D.M. Ecological impacts of deer overabundance. Annu. Rev. Ecol. Evol. Syst. 2004, 35, 113–147. [Google Scholar] [CrossRef]
  75. Trouwborst, A. Managing the carnivore comeback: International and EU species protection law and the return of lynx, wolf and bear to Western Europe. J. Environ. Law 2010, 22, 347–372. Available online: https://ssrn.com/abstract=1752265 (accessed on 8 August 2022). [CrossRef] [Green Version]
  76. Okarma, H.; Jedrzejewski, W.; Schmidt, K.; Kowalczyk, R.; Jedrzejewska, B. Predation of Eurasian lynx on roe deer and red deer in Bialowieza Primeral Forest, Poland. Acta Theriol. 1997, 42, 203–224. [Google Scholar] [CrossRef]
  77. Gervasi, V.; Sand, H.; Zimmermann, B.; Mattisson, J.; Wabakken, P.; Linnell, J.D. Decomposing risk: Landscape structure and wolf behavior generate different predation patterns in two sympatric ungulates. Ecol. Appl. 2013, 23, 1722–1734. [Google Scholar] [CrossRef] [Green Version]
  78. ENETWILD Consortium; Acevedo, P.; Apollonio, M.; Bevilacqua, C.; Blanco-Aguiar, J.; Brivio, F.; Casaer, J.; Ferroglio, E.; Grignolio, S.; Jansen, P.; et al. A Practical Guidance on Estimation of European wild Ungulate Population Density; A Selection of Reliable Practical Methods for Harmonized Population Monitoring in Europe; ENETWILD Consortium, IREC: Barcelona, Spain, 2021. [Google Scholar]
  79. Organ, J.F.; Decker, D.J.; Riley, S.J.; McDonald, J.E., Jr.; Mahoney, S.P. Adaptive Management in Wildlife Conservation. In The Wildlife Techniques Manual; Silvy, N.J., Ed.; John Hopkins University Press: Baltimore, MD, USA, 2020. [Google Scholar]
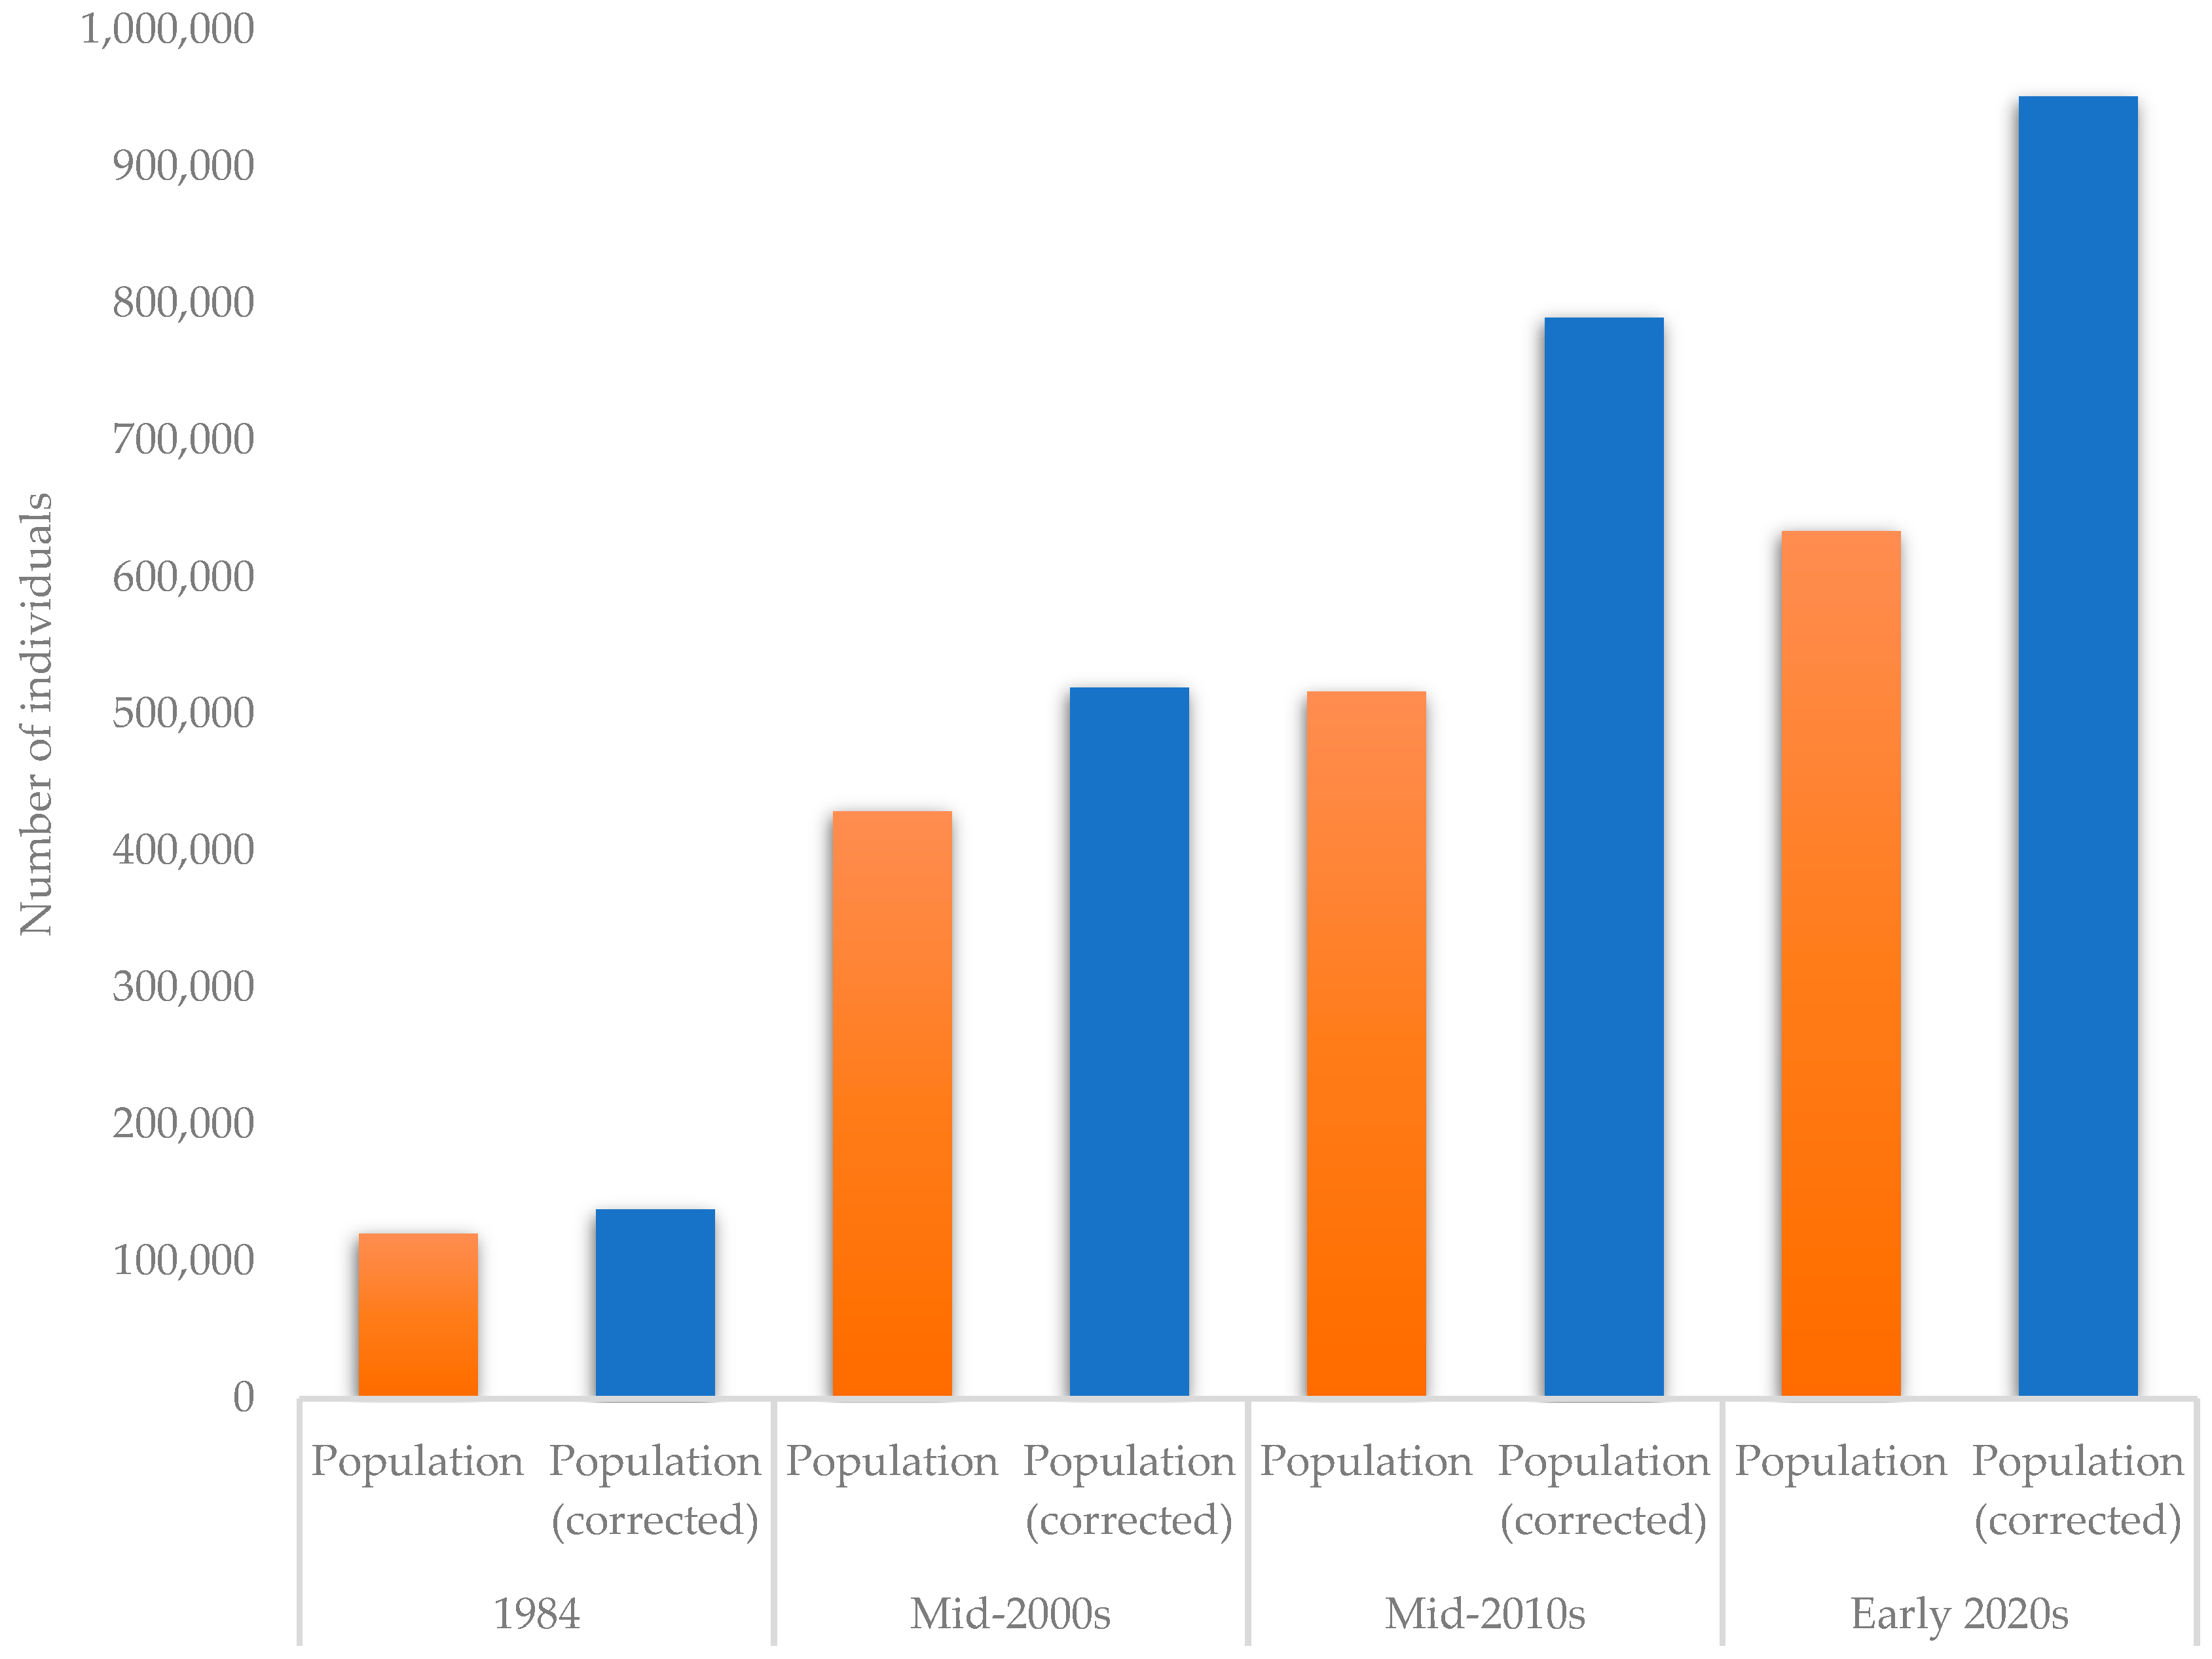
Figure 1. Total number of fallow deer in Europe, with corrections, for 1984, the mid-2000s, mid-2010s, and early 2020s. Legend: original data (orange), corrected numbers (blue).
Sustainability 14 12198 g001
Figure 2. Total harvest and harvest rates of fallow deer in Europe with corrections for 1984, the mid-2000s, mid-2010s, and early 2020s. Legend: original data (green), corrected numbers (red).
Sustainability 14 12198 g002
Figure 3. Relationship between the growth rate of harvest and the growth rate of population size of fallow deer between 1984 and the mid-2000s: (a) all countries; (b) outliers removed (i.e., the Netherlands and Spain).
Sustainability 14 12198 g003
Figure 4. Relationship between the growth rate of harvest and the growth rate of population size of fallow deer between 1984 and the mid-2010s” (a) all countries; (b) outliers removed (i.e., the Netherlands, Finland, and Serbia).
Sustainability 14 12198 g004
Figure 5. Relationship between the growth rate of harvest and the growth rate of population size of fallow deer between 1984 and the mid-2020s: (a) all countries; (b) outliers removed (i.e., Slovakia and Lithuania).
Sustainability 14 12198 g005
Figure 6. Relationship between the growth rate of harvest and the growth rate of population size of fallow deer between the mid-2000s and the mid-2010s: (a) all countries; (b) outliers removed (i.e., Romania, Finland, and Serbia).
Sustainability 14 12198 g006
Figure 7. Relationship between the growth rate of harvest and the growth rate of population size of fallow deer between the mid-2000s and the mid-2020s: (a) all countries; (b) outliers removed (i.e., Finland, Denmark and the UK).
Sustainability 14 12198 g007
Figure 8. Relationship between the growth rate of harvest and the growth rate of population size of fallow deer between the mid-2010s and the mid-2020s: (a) all countries; (b) outliers removed (i.e., the UK and Denmark).
Sustainability 14 12198 g008
Table 1. Data sources on population estimations and harvests from European countries with data for the mid-2000s, mid-2010s, and early 2020s.
CountryData SourceComments
AustriaStatistics Austria *Only hunting bag; no estimations on wild populations
BelgiumINBO *Only data from Wallonia from mid-2000s; only hunting bag data from Flanders for 2021
BulgariaNational Statistics Institute [18,19]; Stoyanov & Stoyanova [20]No hunting bag data from 2020s
CroatiaMinistry of AgricultureData obtained from Croatian Hunting Association (pers. comm.)
Czech RepublicCzech Statistical Office *N/A
DenmarkAarhus Universitet (hunting bag) *; Aarhus Universitet (for population size 2010s) [21]; Danmarks Jaegerforbund (population size 2020s) [22]N/A
FinlandNational Resources Institute Finland *Only hunting bag; pers. comm. for population estimations
FranceONCFS (for 2000s and 2010s) [23]; Réseau Ongulés sauvages (for 2020s) [24]N/A
GermanyBayerischer Jagdverband e.V. (for 2000s and 2010s) [25]; Deutscher Bundestag (for 2020s) [26]N/A
GreeceMattila & Hadjigeorgiou (2010s) [27]No data for 2020s; fallow deer only enclosures; hunting ban
HungaryOrszágos Vadgazdálkodási Adattár [28,29,30]N/A
IrelandNational Parks and Wildlife Service (for 2000s), pers. comm.N/A
ItalyCarnevali et al. 2009 (for 2000s) [31]; ISPRA 2013 (for 2010s) [32]N/A
LithuaniaLithuanian State Forest Service [33,34,35]N/A
LuxembourgLe Gouvernement de Grand-Duché de Luxembourg (pers. comm. for 2000s); The Statistics Portal (LUSTAT) (for 2010s and 2020s) *No population estimations
MacedoniaState Statistical Office of the Republic of Macedonia * No data for mid-2000s
The NetherlandsVereniging Wildbeheer Veluwe (for 2000s and 2010s) [36]; Faunabeheereenheid (for 2020s) [37]Data for 2020s was collected per province
PolandCentral Statistical Office [38,39]N/A
PortugalICNF Divisão Recursos Cinegéticos e Aquicolas (pers. comm.)N/A
RomaniaNational Institute of Statistics [40] No data for 2020s
SerbiaStatistical Office of the Republic of Serbia (for 2019) [41]; Pers. comm. (for 2000s and 2010s)N/A
SlovakiaNational Forestry Center Zvolen (for 2020s) *; Pers. comm. (for 2000s and 2010s)N/A
SloveniaSlovenia Forest Service (for 2010s and 2020s) [42,43]; Pers. comm. (for 2000s)No recent population estimations available, only for 1995
SpainMinistry of Agriculture, Fisheries and Food [44,45,46]No recent population estimations available, only for 2000s
SwedenDanell & Bergström, 2010 (for population estimation for 2000s) [47]; Viltdata (for hunting bags) * No population estimation for early 2020s
UkraineState Statistics Service of Ukraine [48,49,50]N/A
United KingdomNatureScot [51]; Mammal Society (for size for 2020s) [52]Hunting bag for 2010s and 2020s from Scotland only
* Publicly available dataset—see Data Availability Statement.
Table 2. Mean growth factor for population size and harvest of fallow deer in Europe, the coefficient of determination (R2), and p-values for the six periods along with the number of countries that had population and harvest data (N).
Time PeriodMean Growth FactorR2 *p-ValueN
Population (x)Harvest (y)Population (x)Harvest (y)
1984–2000s9.323.820.680.00062013
1984–2010s5.897.710.580.00251816
1984–2020s9.2710.850.360.01131314
2000s–2010s1.973.480.210.06552023
2000s–2020s3.975.520.850.00001519
2010s–2020s1.511.490.060.48931319
* Determination coefficient between growth factor of population and growth factor of harvest of all countries, which is presented with the trendline when plotted.
Publisher’s Note: MDPI stays neutral with regard to jurisdictional claims in published maps and institutional affiliations.