Article

Environmental Regulation and Green Technology Innovation: Evidence from China’s Heavily Polluting Companies

1
Department of Management Science, School of Politics and Public Administration, Soochow University, Suzhou 215123, China
2
Department of Business Administration, School of Economics and Management, Harbin Engineering University, Harbin 150001, China
3
Department of Accounting and Financial Management, School of Economics and Management, Nanjing Tech University, Nanjing 211816, China
*
Author to whom correspondence should be addressed.
Sustainability 2022, 14(19), 12180; https://doi.org/10.3390/su141912180
Submission received: 11 August 2022 / Revised: 8 September 2022 / Accepted: 20 September 2022 / Published: 26 September 2022
(This article belongs to the Section Economic and Business Aspects of Sustainability)

Abstract

:
The green transformation of heavily polluting companies is essential for sustainable development. This study investigated the direct effects of environmental regulation on two types of green technology innovations at the microlevel and explored the moderating effects of three levels of firm supervision—government, public, and internal. Analyzing a panel of China’s heavily polluting companies during 2011–2020, we find that environmental regulation inhibits both types of green technology innovation. However, the degree of such inhibition varies with different moderators. Specifically, lower environmental pressure and better internal corporate controls can weaken or even reverse the inhibition of green invention innovation, while higher media attention can weaken the inhibition of green utility-model innovation. Our findings thus extend the literature on the scenarios of environmental regulation by revealing the heterogeneous moderating effects of government-, public-, and firm-level factors on two types of green innovation. Moreover, our findings have practical implications for promoting the green transformation of heavily polluting companies.

1. Introduction

Environmental degradation has put human health and development at risk, and much effort has been made worldwide to protect the environment [1]. Economic decarbonization is seen as the way forward, but it has stimulated a debate on economic growth versus environmental protection [2,3]. Generally, decarbonizing economies requires reducing their fossil energy use, which has a high potential to harm many economies, especially in developing countries with development needs. Environmental regulation is widely used in various countries as a sensible way to balance environmental protection and economic growth. For example, the Paris Agreement was approved at COP21 to constrain greenhouse gas emissions and encourage green technology development and transfer; the implementation of the regulations in the Paris Agreement was then completed at COP26. The European and Chinese governments have thus enacted sound environmental legislation to reduce ecological damage from economic activities.
The Porter Hypothesis provides theoretical guidance on the economic consequences of environmental regulation. Jaffe and Palmer divide the Porter Hypothesis into the weak and strong Porter Hypothesis [4]. The weak Porter Hypothesis emphasizes that reasonable environmental regulation incentivizes green technology innovation. Given the widespread nature of environmental regulation and the benefits of technological innovation, the existence and conditions of the weak Porter Hypothesis have attracted much scholarly attention. The literature is divided into two streams that test the weak Porter Hypothesis based on environmental regulation or green innovation. In terms of environmental regulation, sufficient attention has been given to environmental regulation, defined at the macrolevel. Such studies have focused on the influence of different types of environmental regulation, such as command, market, and voluntary regulation, on green innovation. In addition, some scholars have defined the implementation of environmental regulation as a quasi-natural experiment. In terms of green innovation, academics have defined green innovation based on either an input or output perspective and have produced a series of research results. Applying the output perspective, patent-based research has particularly classified innovation into green or nongreen innovation and has further refined these according to the difficulty of innovation.
Despite the insightful extant research, the weak Porter Hypothesis remains ill-defined. While the academic definition of green innovation is well established, the definition of environmental regulation needs to be performed at the microlevel. As a widespread measure, it is scientifically valid to measure environmental regulation at the macrolevel. However, since innovation is essentially a strategic decision by firms and the previous measures of environmental regulation have “blurred” the differences between firms, such “blurring” has led to the limited understanding of whether and how environmental regulation, measured at the firm level, influences green innovation.
Accordingly, in this study, we investigated (i) how environmental regulation, defined and measured at the firm level, affects different types of green technology innovation and (ii) the moderating role of government–public–firm-level factors—complementing tests of the weak Porter Hypothesis. Specifically, we argue that the environmental regulation addressed by different firms varies. Since environmental regulation is a cost item for firms, firms facing higher environmental regulation first feel the pressure to profit and then intuitively perceive a disincentive regarding green innovation. However, firms are neither isolated decision-making units nor passive recipients. First, companies have social attributes and need to consider the scrutiny and demand of their stakeholders (government and public). Second, they must adapt to environmental regulation pressures according to their capabilities. Thus, we develop moderators at the government–public–firm level that can reinforce or weaken the disincentive effects of environmental regulation.
We tested our hypotheses by using panel data on heavily polluting Chinese firms from 2011 to 2020. China is the world’s second-largest economy and the largest developing country, maintaining a GDP growth rate of more than 6% per year (except for the COVID-19 shock in 2020). Moreover, heavily polluting firms are representative due to their contribution to the Chinese economy. Hence, our findings provide insights that are generalizable to other developing countries. First, we investigated the direct effect of environmental regulation on green invention innovation and green utility model innovation. Second, we explored the moderating effects of government environmental pressure, public media attention, and internal enterprise management. Our results indicate that environmental regulation inhibits both green invention and utility model innovation. Through further analysis, we found that this inhibitory effect on green invention innovation is strengthened by government pressure but weakened by internal corporate control and that such weakening is subversive. Furthermore, public media attention weakens the inhibitory effect on green utility-model innovation.
Our research thus contributes to the literature in various ways. First, we enrich the definition of environmental regulation by measuring it at the firm level, providing new ideas for future research. As most existing studies have measured environmental regulation at the macrolevel (e.g., by region), ignoring interfirm differences, our measurement of environmental regulation at the firm level fills this gap. Second, we provide new evidence on how environmental regulation affects different types of green technology innovation. Previous studies have focused on different types of green innovation, but their findings merit further discussion, given their limitations in measuring environmental regulation. Third, our study introduces government-, public-, and firm-level factors into the nuances of environmental regulation, providing new support for the conditions of the weak Porter Hypothesis. An effective way to verify the validity of the weak Porter Hypothesis is therefore to choose the right moderators; we selected moderators from the government–public–firm level based on stakeholder theory. Finally, our findings can guide governments and the public to understand how their attributes affect innovation in heavily polluting firms and how firms can respond to environmental regulation. First, governments should be aware of the adverse effects of pressure-shifting on firms’ green innovation, especially among firms facing environmental-regulation costs and profitability dilemmas. While such firms have an urgent need to relieve environmental pressures, their transfer of pressures should be combined with other incentives to mitigate the relevant side effects. Second, the public should continue to pay attention to corporate environmental information and provide timely feedback on green technology needs. While public media attention alleviates the disincentives of green utility innovation, in the future, the public should observe any differences in the quality of technology to promote high-quality green invention innovation. Third, companies must address the challenges of environmental regulation to their business operations, strengthen their internal control capabilities regarding their resources and risks, actively develop green technology innovation, and proactively adapt to the needs of environmental transformation.
The remainder of this paper is organized as follows: We present our theoretical analysis and research hypotheses in Section 2. In Section 3, we discuss our sample, data sources, and research model. Section 4 reports our empirical findings, and Section 5 presents our conclusions and offers a discussion of our results.

2. Theoretical Analysis and Research Hypotheses

2.1. Environmental Regulation and Corporate Green Innovation

Research has shown that dealing with pollutants generates significant economic costs and that the benefits of this do not necessarily outweigh the relevant risks to human health [5,6]. Environmental regulation reduces pollution emissions at their source, saving governance costs, and creating a healthy environment. Through a rich body of research, environmental regulation has been shown to have different effects—promoting [7,8], inhibiting [9,10], or nonlinear [11,12] effects. Studies supporting disincentive effects have shown that regulation increases corporate costs in terms of pollution control and system-compliance expenditure, squeezes corporate innovation input, and inhibits innovation output, resulting in negative impacts [13]. Most of these studies have also affirmed the facilitative role of environmental regulation. Furthermore, the impact of environmental regulation on pollution practices has been found to be indeterminate, while the relationship between the two has been shown to be U-shaped [14,15] or even an inverted U-shape [16,17].
In general, as academics have yet to agree on the role played by environmental regulation, further research is needed [18]. There are many studies on heterogeneous environmental regulations [19], but these studies have mainly used regional-level indicators to define environmental regulation. This “one-size-fits-all” approach has resulted in less attention being paid to microlevel environmental regulation. Accordingly, we argue that defining environmental regulation at the microlevel helps deepen firms’ knowledge of environmental regulation. First, firms are subject to significantly different levels of environmental regulation due to their various characteristics, industries, and operations, but a one-size-fits-all approach to environmental regulation “blurs” these differences. Second, environmental regulation is primarily a way to internalize environmental costs [20], ultimately changing firms’ environmental governance. The costs borne by enterprises for environmental management therefore represent the degree of environmental regulation to which they are subjected; the use of such costs to measure environmental regulation is, thus, a scientifically valid approach.
According to Porter and Linde’s Porter Hypothesis [21], “compliance costs” and “innovation compensation” are the two core elements of environmental regulation; the former reflects the short-term pressure on enterprises and the latter reflects their long-term value. On the one hand, neoclassical theory suggests that environmental regulation increases compliance costs, all else being equal, whereby greater environmental regulation entails firms have to invest more resources into environmental management, thus crowding out their resources available for innovation. On the other hand, green innovation helps enterprises improve pollution control and production processes or develop new products, which promotes their transformation and, thus, projects new growth momentum into them. Usually, heavily polluting enterprises are subject to greater environmental regulation due to their tendency to cause damage to the environment; that is, their cost of compliance is high. Additionally, green innovation produces many resource costs, while the profitability of heavily polluting enterprises is poor. Accordingly, as this gap tends to lead to underinvestment [22], the following hypothesis is proposed:
Hypothesis 1 (H1).
All else being equal, environmental regulation significantly inhibits firms’ green technology innovation.

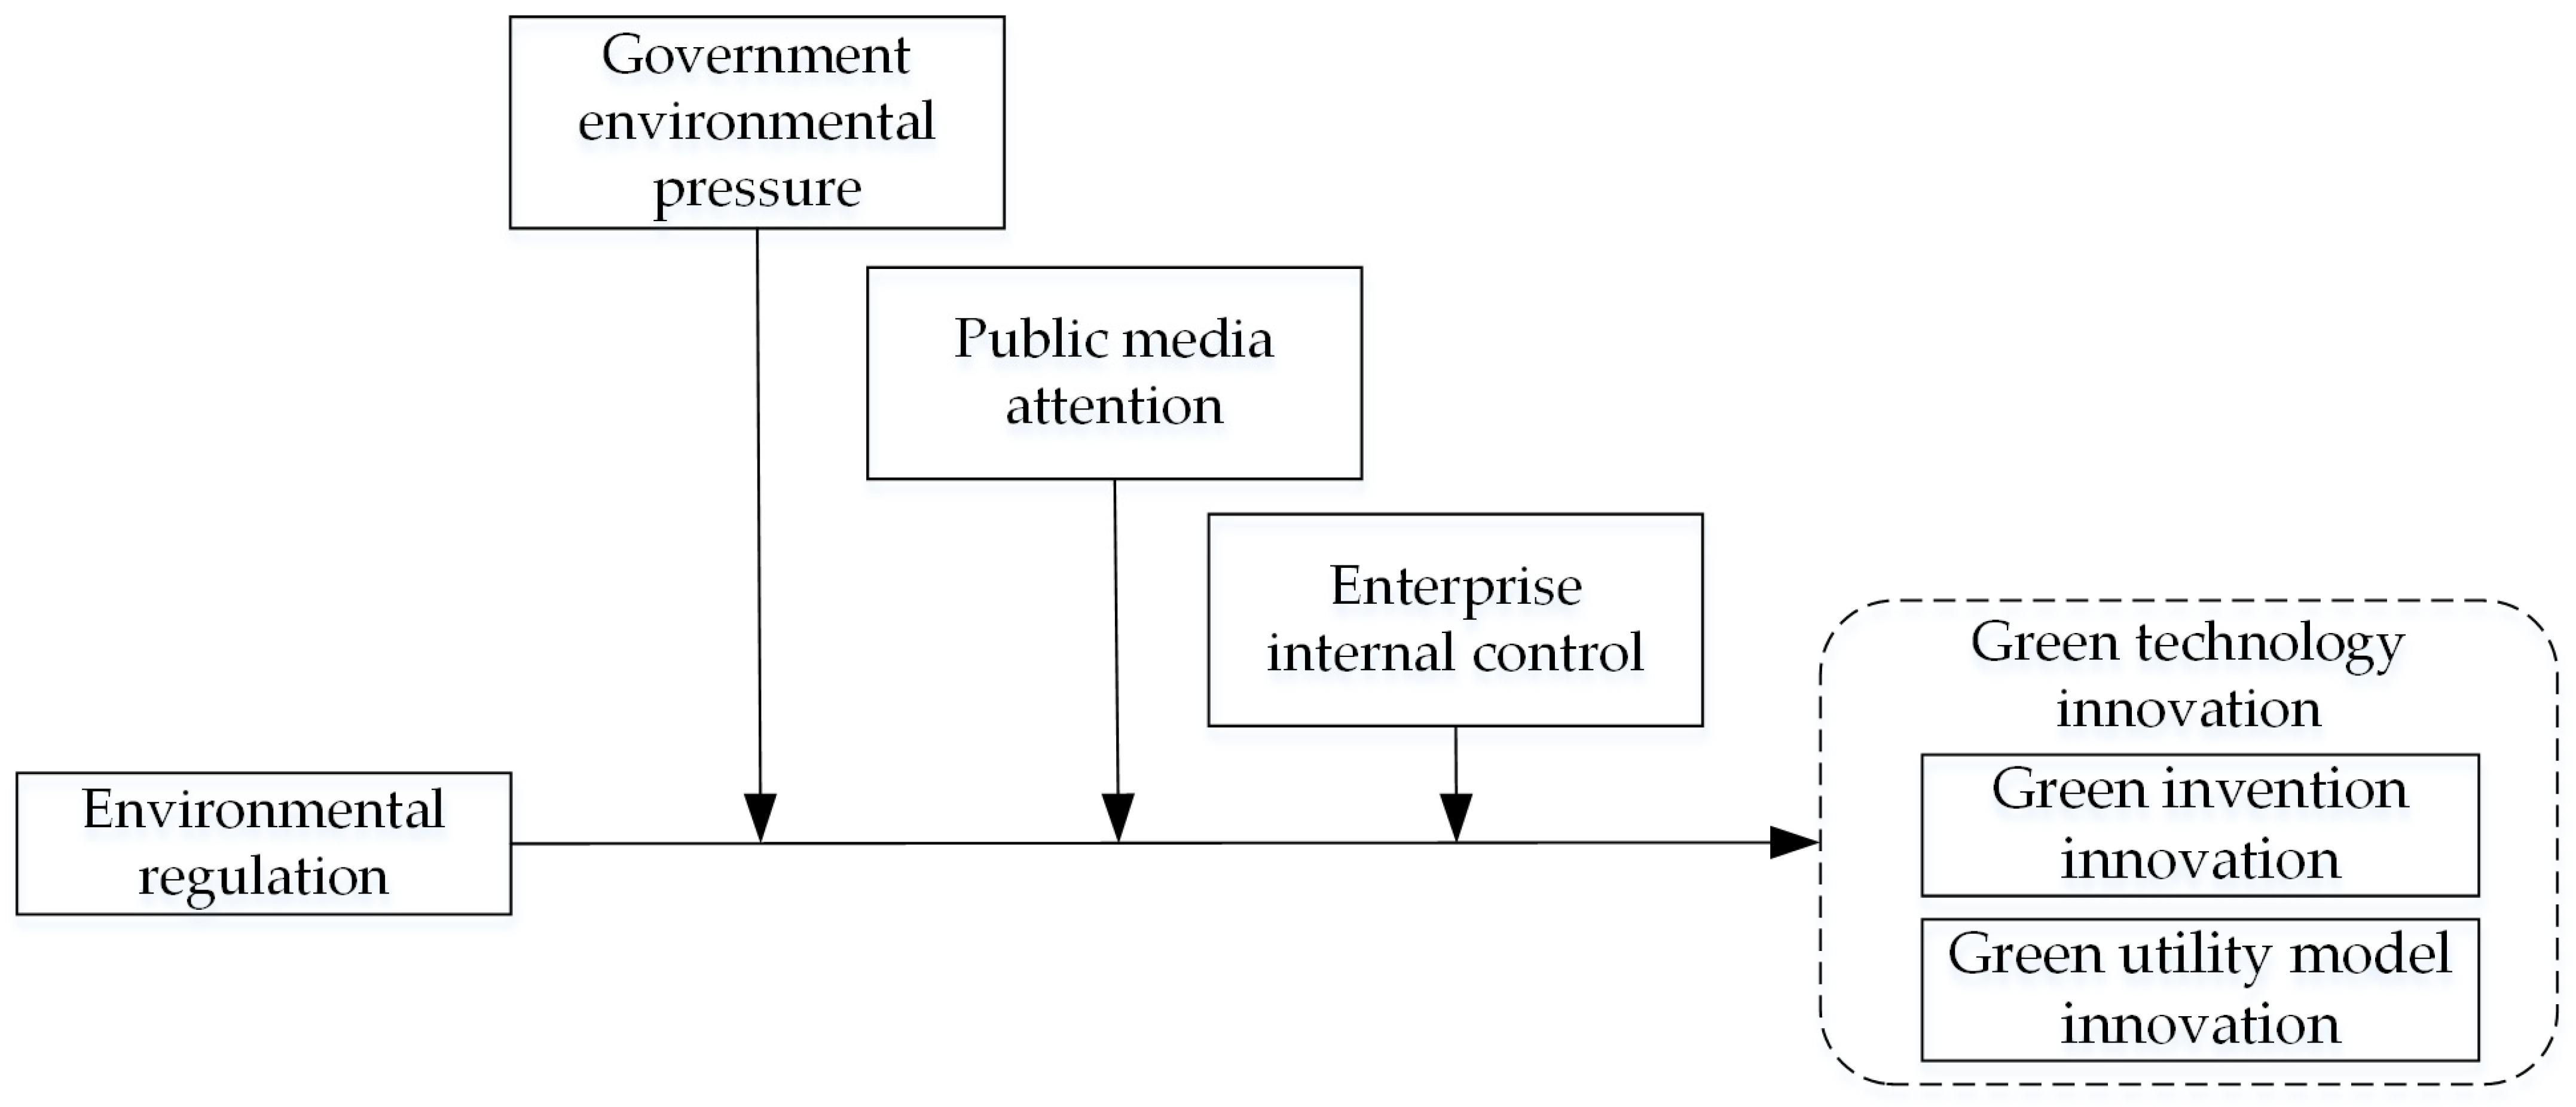
2.2. Moderating Role of Government–Public–Firm Supervision

Although “compliance costs” and “innovation compensation” coexist, the core goal of environmental regulation is to improve the environmental behavior of enterprises and foster a balance between the environment and development. In this process, the direction and degree of the impact of environmental regulation are not fixed. On the one hand, according to stakeholder theory, the characteristics among external stakeholders, such as the government and the public, addressed by heavily polluting enterprises have specific synergies or types of interference with environmental regulation [23], thereby regulating the impact of environmental regulation. On the other hand, planned-behavior theory suggests that heavily polluting firms take measures to cope with the impact of environmental regulations based on their own capabilities. In summary, we therefore propose the moderating role of government–public–firm supervision.

2.2.1. Moderating Effect of Government Environmental Pressure

To attract local governments to focus on environmental governance, China has incorporated environmental protection performance into its promotion assessment criteria for officials [24]. Local governments have naturally become important environmental protection stakeholders. According to attention theory, high pressure to focus on the environment affects its attention-allocation level, prompting the government to prioritize environmental governance as its primary goal. Due to the potential harm to the environment by heavily polluting enterprises, the government has the motivation to increase its demands for environmental governance and then transfer this pressure to protect the environment [25]. This shift moderates the relationship between the "compliance costs" and “innovation compensation” of environmental regulation. First, enterprises take environmental protection steps to meet government demands, but environmental-protection pressures often need to be resolved effectively and quickly. According to the attention theory of corporate behavior selection, the pressure to protect the environment increases the shortsighted behavior of heavily polluting companies, making them less willing to innovate and more inclined to adopt short-term solutions for environmental problems. Second, when the government’s attention on heavily polluting enterprises is reduced through established policies for environmental protection and stakeholders’ attention on heavily polluting enterprises becomes less sensational, heavily polluting enterprises are more motivated to allocate resources according to their long-term strategic perspective. Accordingly, the following hypotheses are proposed:
Hypothesis 2a.
Amid higher pressure to protect the environment, the positive (negative) impact of environmental regulation on enterprise green invention innovation is weakened (strengthened).
Hypothesis 2b.
Amid higher pressure to protect the environment, the positive (negative) impact of environmental regulation on enterprise green utility-model innovation is weakened (strengthened).

2.2.2. Moderating Effect of Public Media Attention

Technological innovation is a proactive or reactive strategic response among companies in complicated environments [26]. As the public’s environmental awareness has improved, media attention has become a unique environment where the public can exert influence on enterprises. Media attention has the dual responsibility of resolving information asymmetry and expressing public demands. Agenda-setting theory thus indicates that the media can influence the order of importance in the minds of the public through agenda-setting, given their capacity to both strengthen the role of public environmental supervision and reduce public-information asymmetry. In contrast, media reports can convey the demands of stakeholders for heavily polluting enterprises. This dual responsibility of the media makes it significant not only as a means for companies to obtain legitimacy but also as a potential source of crisis regarding corporate legitimacy [27]. According to the stakeholder and legitimacy theories, heavily polluting firms change their innovation strategies to maintain a positive appearance when stakeholders become more environmentally conscious. Amid a certain level of environmental regulation, media attention thus promotes heavily polluting firms to increase their green activities by exerting external stakeholder pressure. Therefore, the following hypotheses were developed:
Hypothesis 3a.
Amid higher media attention, the positive (negative) impact of environmental regulation on corporate green invention innovation is strengthened (weakened).
Hypothesis 3b.
Amid higher media attention, the positive (negative) impact of environmental regulation on corporate green utility-model innovation is strengthened (weakened).

2.2.3. Moderating Effect of Enterprise Internal Control

During the business decisions of heavily polluting enterprises, environmental regulation is unavoidable [28]. Internal control, an essential part of internal corporate governance, contributes to the effective implementation of strategic decision-making. Internal control refers to the organization, plans, procedures, and methods of internal-regulation implemented by an enterprise to achieve its established management objectives and include elements such as information, risk, and supervision [29]. Better internal control indicates that an enterprise has greater internal resource allocation, risk perception, and stakeholder communication advantages. Thus, first, internal controls can reduce the effect of environmental regulation on business activities through more reasonable resource allocation, e.g., by balancing long-term sustainable development with short-term cost pressures and orderly green research and development (R&D) efforts. Second, internal control can keep a firm apprised of external changes through sound risk management and information communication, allowing it to accurately identify market demand and translate this into green technology innovation, thereby reasonably controlling for uncertainties in its green innovation process and improving its success rate. Hence, the following hypotheses are proposed:
Hypothesis 4a.
Amid better internal control, the positive (negative) impact of environmental regulation on firm green invention innovation is strengthened (weakened).
Hypothesis 4b.
Amid better internal control, the positive (negative) impact of environmental regulation on firm green utility model innovation is strengthened (weakened).
Our research framework is summarized in Figure 1.

3. Research Design

3.1. Sample Selection and Data Sources

Listed corporations in China’s heavily polluting industry during 2011–2020 were used as the research sample. China’s environmental protection authorities first identified heavily polluting industries in 2003 and then classified them in 2008 and 2010. Our study is based on the “Industry Classification Guidelines for Listed Companies (2012)”, revised by the China Securities Regulatory Commission, and our unit of analysis adheres to the standards for heavily polluting industries developed in 2003, 2008, and 2010. Additionally, our screening applies the following criteria: (i) listed companies that were specially treated (special treatment (ST) firms, particular transfer (PT) firms, etc.) during the sample period were excluded; and (ii) listed companies with serious gaps in their core data were excluded. Thus, a total of 113 listed companies were obtained, generating 1130 company-year observations. Green technology innovation and environmental regulation were collated from the annual reports of enterprises and the China National Intellectual Property Administration (CNIPA). The specific process of this is described below in the section on variable definitions. Internal control data were derived from the Dibo Data (DIB), media-attention and environmental-pressure data were obtained from Chinese Research Data Services (CNRDS), and all other data were gathered from the China Stock Market & Accounting Research (CSMAR) database.

3.2. Variable Definitions

3.2.1. Dependent Variables

Innovation can be measured at various stages. As the output perspective is more suitable for examining the consequences of environmental regulation, green patents were selected to measure green technology innovation. There are major advantages of such an approach: (i) Due to the complexity of corporate innovation strategies, it is difficult to distinguish between green and nongreen innovations through resource allocation; thus, the output perspective can more accurately capture the efforts of companies engaged in green activities. (ii) The authorization of patents, especially invention patents, needs to move through a series of strict examinations that are generally long-term, and there is uncertainty regarding whether authorization is granted; therefore, patent applications enable timelier observations of firm innovation over a certain period. Our source of green patents refers to the practice of Tang and Xu et al. [30]. In addition, invention patents are considered to have higher technical and innovative value than utility patents. Accordingly, green patents are further subdivided into invention innovation (INV) and utility-model innovation (UTI).

3.2.2. Independent Variable

The independent variable is environmental regulation (ERF). Previous studies have measured environmental regulation at the macrolevel (e.g., provinces), using pollutants, administrative regulations, etc. This study, however, focused on environmental regulation at the microlevel, where enterprises are the recipients of macrolevel environmental regulation and environmental governance expenses mirror the microlevel consequences of environmental regulation. The ratio of environmental governance costs to main operating income was used to measure environmental regulation, with larger values indicating stronger environmental regulation. Environmental management costs were determined by manually collating the items disclosed in annual reports as “administrative expenses”. Following the studies of Ye and Zhang et al. [31,32], administrative expenses that are itemized as sewage treatment, environmental protection, etc., are defined as environmental management expenses. Hence, the total environmental management expenses of enterprises were obtained by summing these items.

3.2.3. Moderators

Environmental pressure, media attention, and internal control are selected as moderators at 3 levels: (i) Referring to Tan and Luo et al. [33,34], the average air quality index (AQI) of a firm’s location was used to measure environmental pressure (AIR). AQI is an indicator issued by Chinese environmental protection authorities to reflect the degree of air pollution in a comprehensive manner; the larger its value is, the more serious the air-pollution situation and the greater the government’s environmental-protection pressure. We used PM2.5 concentration values in our robustness test as a proxy to retest our results [35]. (ii) Referring to Song et al.’s [36] study, the amount of online media coverage was selected as a proxy for media attention (MEDIA). Compared to those of traditional media, online media reports are numerous and timely; therefore, they can more accurately reflect the degree of public attention on an enterprise. In the robustness test, only the number of media reports that reported environmental news from a neutral perspective was retested. (iii) Following Wang and Xu et al. [37], the internal-control index issued by Shenzhen Dibo Enterprise Risk Management Technology Co., Ltd., Shenzhen, China, was used to measure the degree of internal control among enterprises (IC). This index has been widely used in academia and government departments, with higher values indicating higher levels of internal control.

3.2.4. Control Variables

Based on previous studies on corporate innovation [38,39], we selected the control variables (Control) from the basic characteristics of enterprises, including enterprise size (SIZE); listing age (AGE); industry competition (HHI); financial status, including market performance (TOBIN), profitability (ROA) and solvency (PAY); equity concentration (FIRST); executive shareholding (MANG); institutional shareholding (INS); governance structures—including two executive positions held by one person (CEO); and board size (BOARD). Additionally, year fixed effects are considered. Details of these variables are provided in Appendix A, Table A1.
Table 1 presents the descriptive statistics for the important variables. Among them, the average values of green invention and green utility-model innovation are 0.561 and 0.589, respectively, signifying that the application of green utility-model innovation is more active than that of green invention innovation. Moreover, environmental regulation has a mean and standard deviation of 0.191 and 0.359, environmental pressure of 83.403 and 31.011, media attention of 5.421 and 0.957, and internal control of 0.503 and 0.076, respectively.

3.3. Research Model

Following Roper’s [40] research, we established the following model:
Y i t = α + β E R F i t + γ C o n t r o l i t + Y E A R t + u i + ε i t
where Y i t denotes firm i’s green technology innovation in year t, which is subdivided into green invention ( I N V i t ) and green utility model innovation ( U T I i t ); E R F i t denotes environmental regulation; C o n t r o l i t denotes control variables; and Y E A R t denotes the time fixed effects. Moreover, α represents the constant term, γ represents the control variable coefficient, u i represents the individual effect, and ε i t represents the random disturbance term. In addition, β denotes the coefficient of environmental regulation, the direction of which indicates its effects.
To further investigate how different government–public–firm levels moderate the effects of environmental regulation, we adopted a cross-product term, based on existing studies [41,42], and set up the following models:
Y i t = α + β 1 E R F i t + β 2 A I R i t + β 3 E R F i t × A I R i t + γ C o n t r o l i t + Y E A R t + u i + ε i t
Y i t = α + β 1 E R F i t + β 2 M E D I A i t + β 3 E R F i t × M E D I A i t + γ C o n t r o l i t + Y E A R t + u i + ε i t
Y i t = α + β 1 E R F i t + β 2 I C i t + β 3 E R F i t × I C i t + γ C o n t r o l i t + Y E A R t + u i + ε i t
Formulas (2)–(4) correspond to Hypotheses 2–4, where AIR, MEDIA, and IC denote environmental pressure, media attention, and internal control, respectively, and the rest of the symbols are consistent with the definitions given above. This section focuses on the direction of the β 3 coefficient, which indicates the effects of the direction of the moderating variables on the relationship between environmental regulation and firms’ green technology innovation.
Appropriate model-setting determines the quality of analysis results. This work draws on the data model-setting approach of Wooldridge [43]. A joint significance test of individual and random effects was thus first used to determine whether to use the unobserved effects model or mixed regression model. These results demonstrate that both the individual and random-effects p-values are below 0.05. Therefore, the unobserved effects model was used. Second, for this model, it was also necessary to determine whether to choose a fixed or random-effects model. Hausman’s test result of 0.244 indicates that the original hypothesis—i.e., the fixed- and random-effects models are estimated consistently—is accepted and that the random-effects model has higher validity. Thus, the random-effects model was selected. Finally, because the explanatory variables are logarithmically treated, 60.53% and 56.67% of the observations are equal to 0 and nonnegative, respectively, forming a left imputation of the data. Moreover, there is a problem of biased estimation when using traditional estimation methods. A panel Tobit model can help overcome this difficulty. Accordingly, a panel Tobit random effects model, controlling for time fixed effects, was used for the empirical analysis in this study.

4. Empirical Results and Analysis

4.1. Correlation Analysis

Table 2 reports the correlation coefficients of the major variables, revealing that environmental regulation is significantly and negatively correlated with the two types of green technology innovation, thus tentatively verifying Hypothesis 1. In addition, the variance inflation factor (VIF) results with a maximum value of 2.56 indicate that there is no serious problem of multicollinearity among our variables.

4.2. Regression Analysis

4.2.1. Role of Environmental Regulation

Table 3 reports our key results. According to Columns (1) and (2), both coefficients of environmental regulation on green invention innovation and green utility innovation are significantly negative at the 1% level when no variables are controlled for. In Columns (3) and (4), the coefficients are significantly negative at the 1% and 10% levels, respectively, when the year fixed effects are not controlled for. In Columns (5) and (6), the coefficients remain significantly negative when all variables are controlled for. To reveal any possible nonlinear effects, we also include the squared term of environmental regulation in Model (1). However, none of the coefficients of the squared term are significant, thus indicating that there is no U-shaped effect. Thus, these findings demonstrate that environmental regulation provides a significant disincentive for green technology innovation, echoing the findings of Guo and Liu et al. [14,44] and verifying Hypothesis 1.

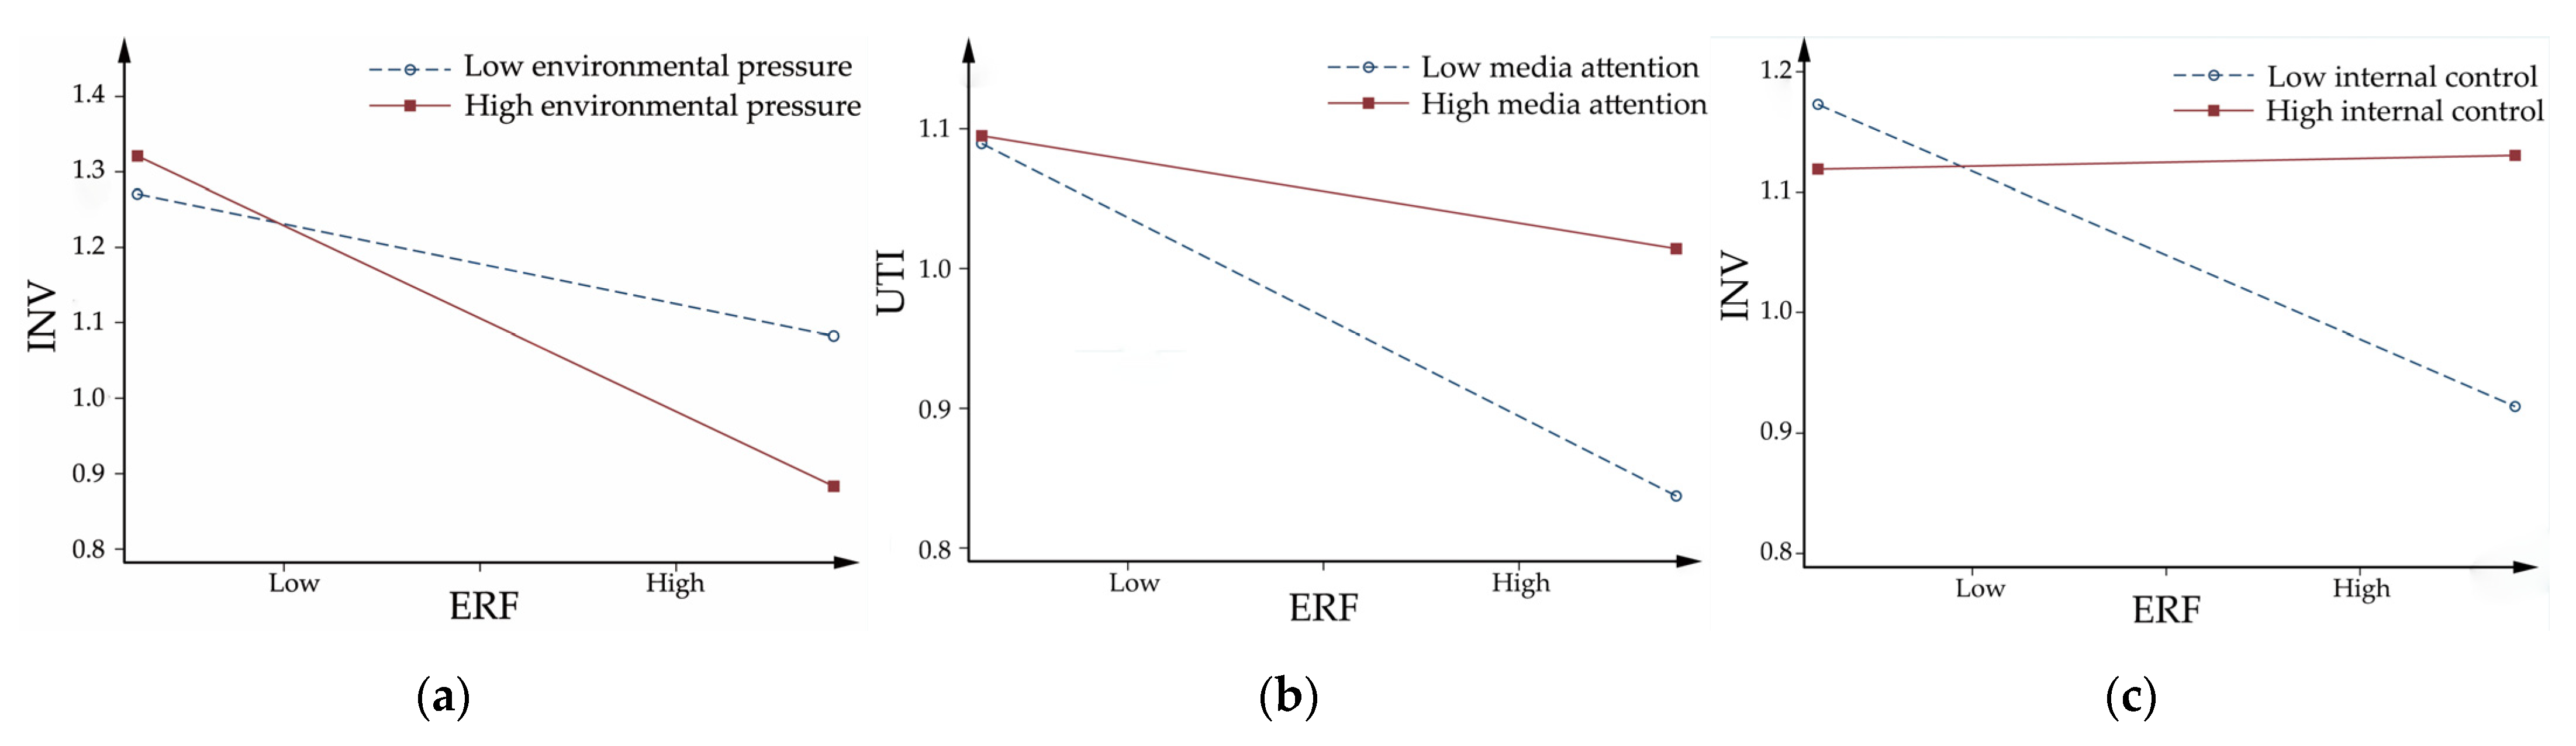
4.2.2. Moderating Effect of Government–Public–Firm Level

Table 4 reports the moderating effects of the government, public, and firms on environmental regulation. To prevent potential multicollinearity problems, variables involving cross-product terms are centralized. Table 5 demonstrates the various moderating effects as follows: environmental pressure and internal control have a moderating effect on green invention innovation, while media attention moderates green utility-model innovation. Specifically, as the coefficient of the cross-product of environmental regulation and environmental pressure in Column (1) is significantly negative, environmental pressure plays an enhanced moderating role, thus verifying Hypothesis 2a. Similarly, the coefficient of the cross-product of media attention and environmental regulation on green utility-model innovation in Column (4) is significantly positive, entailing that media attention has a weakening moderating effect and plays a supervisory and governance role [45], thus confirming Hypothesis 3b. The coefficient of the cross-product term of internal control and environmental regulation in Column (5) is significantly positive for green invention innovation among firms, thus implying that internal control mitigates the negative effect on green invention innovation. Surprisingly, as illustrated in Figure 2c, this mitigation is reversed; that is, it demonstrates that environmental regulation inhibits green innovation amid low internal control but promotes it amid high internal control, thus supporting Hypothesis 4a.
Figure 2. Moderation-effect diagram: (a) government environmental pressure as the moderator, (b) public media attention as the moderator, and (c) corporate internal control as the moderator.
Sustainability 14 12180 g002
Table 2. Correlation analysis of major variables.
INVUTIERFAIRMEDICSIZEAGEFV
INV1
UTI0.600 ***1
ERF−0.122 ***−0.152 ***1
AIR0.049 *0.0300−0.082 *** 1
MED0.190 ***0.261 ***−0.027 10.100 ***
IC−0.032−0.013−0.00910.137 ***0.0530
SIZE0.410 ***0.432 ***−0.184 ***−0.0150.524 ***0.132 ***1
AGE0.157 ***0.176 ***−0.093 ***−0.240 ***0.166 ***−0.03100.458 ***1
TOBIN−0.041−0.051*0.139 ***−0.069 *0.092 ***−0.088 ***−0.216 ***0.0191
CEO−0.150 ***−0.171 ***0.213 ***−0.032−0.056 *−0.004−0.120 ***−0.144 ***0.057 *
PAY−0.114 ***−0.111 ***0.193 ***0.001−0.192 ***0.015−0.331 ***−0.386 ***−0.028
INS0.212 ***0.194 ***−0.198 ***−0.0300.281 ***0.104 ***0.508 ***0.394 ***−0.087 ***
MANG−0.099 ***−0.140 ***0.283 ***0.058 *−0.080 ***−0.033−0.269 ***−0.395 ***0.030
BOARD0.271 ***0.270 ***−0.0270.0410.224 ***0.087 ***0.389 ***0.213 ***−0.046
ROA−0.064 **−0.0330.039−0.0230.094 ***0.205 ***−0.066 **−0.119 ***0.098 ***
HHI−0.071 **0.0200−0.137 ***−0.058 *0.061 **0.0190.118 ***0.210 ***−0.010
FIRST0.072 **0.052 *−0.073 **0.071 **0.173 ***0.086 ***0.230 ***0.122 ***−0.088 ***
CEOPAYINSMANGBOARDROAHHIFIRSTVIF
INV
UTI
ERF 1.130
AIR 1.140
MED 1.520
IC 1.080
SIZE 2.350
AGE 1.640
TOBIN 1.180
CEO1 1.150
PAY0.130 ***1 1.220
INS−0.155 ***−0.183 ***1 2.560
MANG0.300 ***0.282 ***−0.452 ***1 1.460
BOARD−0.149 ***−0.075 **0.270 ***−0.155 ***1 1.270
ROA0.0310.175 ***−0.079 ***0.109 ***−0.0401 1.140
HHI−0.079 ***−0.0390.218 ***−0.153 ***0.014−0.0261 1.090
FIRST−0.071 **−0.0090.572 ***−0.084 ***0.061 **−0.0210.146 ***11.640
Note: *** p < 0.01, ** p < 0.05, and * p < 0.1.
Table 3. Direct-effect regression results.
INVUTIINVUTIINVUTI
ERF−0.835 ***
(−3.23)
−0.667 ***
(−2.76)
−0.590 ***
(−2.65)
−0.355 *
(−1.68)
−0.649 ***
(−2.97)
−0.387 *
(−1.90)
Constant−0.139
(−1.03)
−0.0385
(−0.32)
−17.23 ***
(−8.90)
−15.47 ***
(−9.15)
−15.50 ***
(−8.06)
−14.27 ***
(−8.59)
ControlsNoNoYesYesYesYes
YearNoNoNoNoYesYes
rho0.5170.4440.4480.3320.4400.350
Log-likelihood−1119.0−1185.9−1049.0−1115.8−1028.8−1066.4
Prob > chi20.00120.00580.00000.00000.00000.0000
N113011301130113011301130
Note: *** p < 0.01 and * p < 0.1, and t statistics are in parentheses.
Table 4. Analysis of the results of moderating effects.
(1)(2)(3)(4)(5)(6)
INVUTIINVUTIINVUTI
ERF−1.233 ***
(−3.42)
−0.397
(−1.46)
−0.616 ***
(−2.76)
−0.672 **
(−2.51)
−0.507 **
(−2.19)
−0.390 *
(−1.79)
AIR−0.004580.000109
(−1.41)(0.04)
ERF*AIR−0.0175 **
(−2.09)
−0.00285
(−0.41)
MED −0.00598
(−0.08)
0.153 **
(2.19)
ERF*MED −0.136
(−0.67)
0.395 *
(1.87)
IC 1.649 **
(2.33)
0.213
(0.38)
ERF*IC 7.229 *
(1.79)
−0.354
(−0.33)
Constant−16.38 ***
(−7.25)
−14.89 ***
(−7.59)
−15.66 ***
(−7.43)
−12.73 ***
(−6.93)
−15.98 ***
(−8.26)
−14.32 ***
(−8.50)
ControlsYesYesYesYesYesYes
YearYesYesYesYesYesYes
rho0.4600.3880.4380.3440.4480.364
Log-likelihood−792.3−819.0−1028.6−1062.3−1017.6−1055.1
Prob > chi20.00000.00000.00000.00000.00000.0000
N8148141130113011211121
Note: *** p < 0.01, ** p < 0.05, and * p < 0.1, and t statistics are in parentheses.

4.2.3. Robustness Test

(1) Endogeneity Test
Given the coherence of enterprise strategies, enterprise green technology innovation may be highly autocorrelated with firm characteristics; that is, enterprise green technology innovation in a given period may be influenced by that in a previous period and exhibit inertial characteristics, while an endogenous relationship between green technology innovation and firm characteristics may also exist as a type of mutual causality. Following Tian and Li et al. [46], explanatory variables with a lag of one period are therefore introduced into Model (1), and a dynamic panel data econometric model is established for robustness testing as follows:
Y i t = β 0 + β 1 Y i t 1 + β 2 E R F i t + γ C o n t r o l i t + Y E A R t + u i + ε i t
In addition, given the measurement method of environmental regulation in this study, enterprises may affect environmental regulation due to innovation; thus, our results may involve the endogeneity problem of bidirectional causality. Based on Huang and Li et al. [47,48], explanatory variables that lag by one period were thus taken into account. Furthermore, control variables may suffer from endogeneity problems. To rule out this concern, a one-period lag is applied to all control variables. Table 5 depicts the results of this re-regression; the coefficient of environmental regulation remains significantly less than zero, effectively supporting the inhibitory role of environmental regulation.
Table 5. Endogeneity test results.
(1)(2)(3)(4)(5)(6)
INVUTIINVUTIINVUTI
L.INV0.634 ***
(6.97)
L.UTI 0.432 ***
(5.80)
ERF−0.322 *
(−1.85)
−0.399 **

(−2.25)
−0.394 *
(−1.80)
−0.597 **
(−2.52)
L.ERF −0.441 **
(−2.05)
−0.658 ***
(−2.84)
Constant−9.890 ***
(−6.20)
−11.18 ***
(−7.38)
−15.97 ***
(−7.97)
−14.81 ***
(−8.57)
−13.81 ***
(−6.96)
−13.61 ***
(−8.00)
ControlsYesYesYesYesYesYes
YearYesYesYesYesYesYes
N101710171017101710171017
Note: *** p < 0.01, ** p < 0.05, and * p < 0.1; and t statistics are in parentheses.
(2) Other Robustness Tests
We also performed robustness tests for direct and moderating effects. The direct effect robustness test was conducted with three aspects. (i) We used sample tail shrinkage. To alleviate the concern of extreme values regarding our results, the regressions were conducted again by shrinking the top and bottom 1% of the observations of the continuous variables. (ii) We added omitted variables. Since innovation capital investment is also an essential factor affecting green innovation, we added innovation capital investment to the control variables and measured it with the ratio of R&D investment to revenue. Since the impact of innovation capital investment on innovation output has a time lag, we added the indicators of innovation capital investment with one and two lag periods. (iii) We used a replacement model. Since the explanatory variable is green innovation and has a large number of zero values, we used the original values of the explanatory variables and panel negative binomial regression during testing. These results are presented in Table 6. The results of the shrinkage treatment are listed in the first two columns, the omitted variables appear in the middle two columns, and the replacement models are presented in the last two columns. The direction and significance of the coefficients of the major variables are almost in line with those in the main text, indicating the robustness of our results.
Table 6. Robustness test of direct effects.
(1)(2)(3)(4)(5)(6)
INVUTIINVUTIINV_rawUTIN_raw
ERF−0.709 **
(−2.47)
−0.772 ***
(−2.76)
−0.590 **
(−2.46)
−0.498 **
(−2.15)
−0.664 **
(−2.52)
−0.913 ***
(−2.86)
L.RDE 7.367
(1.08)
4.285
(0.65)
L2.RDE 3.199
(0.47)
−0.595
(−0.09)
Constant−15.26 ***
(−8.05)
−13.89 ***
(−8.45)
−17.28 ***
(−7.29)
−17.03 ***
(−7.89)
−16.19 ***
(−8.78)
−14.01 ***
(−8.57)
ControlsYesYesYesYesYesYes
YearYesYesYesYesYesYes
N1130113057157111301130
Note: *** p < 0.01 and ** p < 0.05, and t statistics are in parentheses.
Additionally, the measures of the moderator were replaced to examine moderating effects as follows: (i) Since PM2.5 pollution is one of the most harmful air pollutants, we used the average annual PM2.5 concentration in the city where a firm is located to measure environmental pressure. (ii) As listed companies are prone to extensive media coverage due to their potentially unrelated positive or negative events, there may be distorted media-attention data in the original model, undermining an accurate reflection of the typical situation for environmentally themed media attention for a company; consequently, the number of neutral reports about a company is used as a measure of its media attention. (iii) Because logarithmically processed internal control data are used in the original model to measure internal control, the original internal control data are reused as a proxy variable for internal control. These results, which are reported in Table 7, thus suggest that both the direction and significance of the coefficients of the cross-product terms are consistent with those in the original model, indicating that these results are reliable

5. Discussion and Conclusions

5.1. Research Conclusions

Based on panel data from heavily polluting firms in China, we first investigated the direct effects of environmental regulation. Then the moderating effects at the government–public–firm level were explored. Accordingly, we have drawn the following conclusions:
First, environmental regulation has a significant inhibitory effect on both types of green technology innovation. That is, strict environmental regulation imposes higher compliance costs on heavily polluting firms, while innovation compensation seems difficult to offset [49,50] and often manifests as lower green technology innovation in the real world. This is in line with the findings of He and Cai et al. [9,51] and echoes Palmer et al.’s questioning of the use of “innovation compensation to offset compliance costs” [52]. However, this finding contradicts the results of Cai et al. [7], who have shown that stricter direct environmental regulations provide incentives for green technology innovation among heavily polluting firms. However, we specifically focused our study on the impact of environmental regulations at the firm level. Heavily polluting firms are generally subject to pressure to generate profit (with an average return on assets of only 3.5%), but they face higher compliance costs than those in other industries. This dual pressure causes heavily polluting firms to be self-conscious amid environmental regulation and thus reduce green technology innovation.
Second, the role of moderators varies as follows: (i) Higher government environmental pressure strengthens the inhibitory effect of environmental regulation on green invention innovation. This finding reveals the crowding-out moderating effect of government environmental pressure. Government environmental pressure translates into compliance costs for firms [53], affecting the allocation of firms’ relevant attention and exacerbating their shortsighted behavior [54]. Nevertheless, as green innovation requires sufficient long-term resource (including attention) investment and carries the risk of failure [55], firms can become exhausted when coping with shifting government environmental pressure, thereby reducing their green innovation. (ii) Higher public media attention mitigates the inhibitory effect of environmental regulation on green utility innovation. This finding reveals the quasi-monitoring moderating role of public media attention. Media attention constructs a unique monitoring and governance environment for firms by allocating public attention and expressing public demands [56]. In addition, as the relevant short cycle times and low investments of utility innovations are more responsive to firms’ urgent need to gain legitimacy than inventive innovations [57], they are therefore more likely to be moderated by media attention. (iii) Better internal controls mitigate or even reverse the negative effects of environmental regulation on green inventive innovation. This finding reveals the adaptive moderating role of corporate internal controls. That is, better internal controls promote a firm’s ability to manage its operations, improve its resource allocation efficiency [26], and even successfully accommodate its internal and external stakeholder expectations, thereby substantially increasing its green innovation. This is reflected in a significant moderation of a firm’s green invention innovation.

5.2. Theoretical Contributions

Defining environmental regulation at the macrolevel has attracted sufficient research interest, mirrored by a lack of research at the microlevel. In addition, scholars continue to debate the feasibility of the weak Porter Hypothesis, probably due to insufficient scenario-based discussions. Therefore, the theoretical contribution of this study, based on the above two points, is twofold: (i) By expanding the connotation of environmental regulation to the firm level, we show that the objective of macrolevel environmental regulation is to internalize environmental costs. Using this objective as an entry point, environmental regulation is measured by the cost of environmental governance for firms. This view focuses more on interfirm differences, while providing ideas for future research and (ii) constructing a scenario-setting framework for the weak Porter Hypothesis. That is, based on stakeholder theory, we constructed a government–public–firm moderator framework to establish the relevant scenario and provide a theoretical basis for moderator selection, enriching the scenario-based discussion on the weak Porter Hypothesis.

5.3. Practical Insights

The widespread application of environmental regulation controls environmental pollution and reduces the human health costs arising from salient health problems, thereby alleviating ecological damage and social-welfare burdens. Although our study has shown that environmental regulation inhibits green technology innovation—just as Hickel’s “modern environmental protection aims to bet on speculative technological change” [3]—technological innovation is an essential solution for environmental pollution. This view reveals the reality of the need to manage the relationship between environmental regulation and green technology innovation.
Accordingly, our findings provide practical insights for managing green technological innovation. (i) Governments have a dual objective of balancing the need to alleviate environmental pressures with the need to promote green innovation by firms. With this objective in mind, governments should be aware of the negative moderating effect of shifting environmental pressures on firms, especially on heavily polluting firms amid the pressure to turn a profit, regarding green innovation. Given the importance of green innovation for environmental protection, complementary incentives should therefore be implemented. For example, the effectiveness of government R&D support and tax incentives has been proven by Bai and Yigitcanlar et al. [58,59]. (ii) The public should pay attention to the quality of technology and play a more significant role in monitoring and governance by paying attention more profoundly and voicing demands. Moreover, while this study has demonstrated the positive moderating effect of media attention on green practical innovation, it has not done so for patents concerning higher-quality green inventions. To fill this gap, the public should focus more on high-quality green invention innovation with potential than on broader innovation. (iii) Firms should take the initiative to improve their internal controls. As this study has verified the positive contribution of internal controls to the innovation of green inventions, enterprises should excel at risk control and cost management during technological innovation by using a sound internal-control mechanism to avoid the negative impact of changes in their internal and external environments.

5.4. Limitations

Despite our important findings in this study, there are still some limitations. First, we enriched the research context by selecting government–public–firm moderators, but executive traits and board governance still have opportunities for a similar application. Second, we used a static model to investigate the short-term effects of environmental regulation, but the relevant long-term effects still merit further investigation.

Author Contributions

Conceptualization, Z.L.; methodology, Z.L. and D.L.; software, Z.L. and D.L.; validation, Z.L. and D.L.; formal analysis, Z.L. and D.L.; investigation, Z.L. and D.L.; resources, D.L. and S.L.; data curation, Z.L. and D.L.; writing—original draft preparation, Z.L. and S.L.; writing—review and editing, Z.L., D.L. and S.L.; visualization, Z.L. and D.L.; supervision, Z.L. and S.L.; project administration, Z.L.; funding acquisition, Z.L., D.L. and S.L. All authors have read and agreed to the published version of the manuscript.

Funding

This work was supported by grants from the National Natural Science Foundation of China (Grant Nos. 72204181, 72102121, and 72074059), the Ministry of Education of China’s Project of Humanities and Social Sciences (Grant No. 21YJC630075), the Social Science Foundation (Application Countermeasure Type) of Suzhou City (Grant No. Y2022LX005), the Central University Basic Research Special Fund of China—Funding for Doctoral Research Innovation Fund Projects (Grant No. 3072021GIP0901), and the University Philosophy and Social Science Research Project of Jiangsu Province (Grant No. 2021SJA1349).

Institutional Review Board Statement

Not applicable.

Informed Consent Statement

Not applicable.

Data Availability Statement

The data are not publicly available due to privacy. Please contact the corresponding author for the requests for data and original results.

Conflicts of Interest

The authors declare that they have no known competing financial interests or personal relationships that could have appeared to influence the work reported in this study.

Appendix A

Table A1. Variable definitions.
TypeVariableAbbreviationDefinition or Measurement
Dependent variableGreen invention innovationINVNumber of green-invention patents applied for in year t plus one and taken as a logarithm
Green utility-model innovationUTINumber of green utility model patents applied for in year t plus one and taken as a logarithm
Independent variableEnvironmental regulation of the firmERFRatio of environmental management expenses to the main business revenue of the enterprise in year t
ModeratorEnvironmental pressureAIRAverage air-quality index of the firm’s location
Media attentionMEDLogarithm of the total number of online media reports plus one in year t
Internal controlICLogarithm of the internal control index of the company plus one in year t
Control
variable
Enterprise sizeSIZELogarithm of total assets
Listing ageAGEFirm’s listing age plus one and taken as a logarithm
Market performanceTOBINLogarithm of Tobin’s Q
Two jobs in oneCEOWhether the chairperson and CEO are the same person: 1 for yes and 0 for no
SolvencyPAYEnding balance of corporate cash and cash equivalents divided by current liabilities
Institutional shareholdingINSInstitutional shareholding ratio
Executive shareholdingMANGExecutive shareholding ratio
Board sizeBOARDTotal number of board members
ProfitabilityROAFirm’s return on total assets
Industry competitionHHIHerfindahl–Hirschman Index (HHI), calculated by using operating income
Equity concentrationFIRSTPercentage of largest shareholder
YearYEARYear dummy variable

References

  1. Raworth, K. A Doughnut for the Anthropocene: Humanity’s Compass in the 21st Century. Lancet Planet. Health 2017, 1, e48–e49. [Google Scholar] [CrossRef]
  2. Van Den Bergh, J.C. A Third Option for Climate Policy within Potential Limits to Growth. Nat. Clim. Chang. 2017, 7, 107–112. [Google Scholar] [CrossRef]
  3. Hickel, J.; Brockway, P.; Kallis, G.; Keyßer, L.; Lenzen, M.; Slameršak, A.; Steinberger, J.; Ürge-Vorsatz, D. Urgent Need for Post-Growth Climate Mitigation Scenarios. Nat. Energy 2021, 6, 766–768. [Google Scholar] [CrossRef]
  4. Jaffe, A.B.; Palmer, K. Environmental Regulation and Innovation: A Panel Data Study. Rev. Econ. Stat. 1997, 79, 610–619. [Google Scholar] [CrossRef]
  5. Suk, W.A.; Heacock, M.L.; Trottier, B.A.; Amolegbe, S.M.; Avakian, M.D.; Henry, H.F.; Carlin, D.J.; Reed, L.G. Assessing the Economic and Societal Benefits of SRP-Funded Research. Environ. Health Perspect. 2018, 126, 065002. [Google Scholar] [CrossRef] [PubMed]
  6. Nicole, W. Unbalanced Burden? Potential Population-Level Health Risks and Benefits of Superfund Cleanup. Environ. Health Perspect. 2020, 128, 084003. [Google Scholar] [CrossRef] [PubMed]
  7. Cai, X.; Zhu, B.; Zhang, H.; Li, L.; Xie, M. Can Direct Environmental Regulation Promote Green Technology Innovation in Heavily Polluting Industries? Evidence from Chinese Listed Companies. Sci. Total Environ. 2020, 746, 140810. [Google Scholar] [CrossRef]
  8. Hu, J.; Pan, X.; Huang, Q. Quantity or Quality? The Impacts of Environmental Regulation on Firms’ Innovation–Quasi-Natural Experiment Based on China’s Carbon Emissions Trading Pilot. Technol. Forecast. Soc. Change 2020, 158, 120122. [Google Scholar] [CrossRef]
  9. He, Y.; Ding, X.; Yang, C. Do Environmental Regulations and Financial Constraints Stimulate Corporate Technological Innovation? Evidence from China. J. Asian Econ. 2021, 72, 101265. [Google Scholar] [CrossRef]
  10. Wu, W.; Liu, Y.; Wu, C.-H.; Tsai, S.-B. An Empirical Study on Government Direct Environmental Regulation and Heterogeneous Innovation Investment. J. Clean. Prod. 2020, 254, 120079. [Google Scholar] [CrossRef]
  11. Zhang, Y.; Hu, H.; Zhu, G.; You, D. The Impact of Environmental Regulation on Enterprises’ Green Innovation under the Constraint of External Financing: Evidence from China’s Industrial Firms. Environ. Sci. Pollut. Res. 2022, 29, 1–22. [Google Scholar] [CrossRef]
  12. Zhu, Y.; Sun, Z.; Zhang, S.; Wang, X. Economic Policy Uncertainty, Environmental Regulation, and Green Innovation—An Empirical Study Based on Chinese High-Tech Enterprises. Int. J. Environ. Res. Public Health 2021, 18, 9503. [Google Scholar] [CrossRef]
  13. Ouyang, X.; Li, Q.; Du, K. How Does Environmental Regulation Promote Technological Innovations in the Industrial Sector? Evidence from Chinese Provincial Panel Data. Energy Policy 2020, 139, 111310. [Google Scholar] [CrossRef]
  14. Guo, Y.; Xia, X.; Zhang, S.; Zhang, D. Environmental Regulation, Government R&D Funding and Green Technology Innovation: Evidence from China Provincial Data. Sustainability 2018, 10, 940. [Google Scholar] [CrossRef]
  15. Song, M.; Wang, S.; Zhang, H. Could Environmental Regulation and R&D Tax Incentives Affect Green Product Innovation? J. Clean. Prod. 2020, 258, 120849. [Google Scholar] [CrossRef]
  16. Pan, X.; Cheng, W.; Gao, Y.; Balezentis, T.; Shen, Z. Is Environmental Regulation Effective in Promoting the Quantity and Quality of Green Innovation? Environ. Sci. Pollut. Res. 2021, 28, 6232–6241. [Google Scholar] [CrossRef]
  17. Zhou, Q.; Song, Y.; Wan, N.; Zhang, X. Non-Linear Effects of Environmental Regulation and Innovation – Spatial Interaction Evidence from the Yangtze River Delta in China. Environ. Sci. Policy 2020, 114, 263–274. [Google Scholar] [CrossRef]
  18. Shao, S.; Hu, Z.; Cao, J.; Yang, L.; Guan, D. Environmental Regulation and Enterprise Innovation: A Review. Bus. Strateg. Environ. 2020, 29, 1465–1478. [Google Scholar] [CrossRef]
  19. Zhu, X.; Zuo, X.; Li, H. The Dual Effects of Heterogeneous Environmental Regulation on the Technological Innovation of Chinese Steel Enterprises—Based on a High-Dimensional Fixed Effects Model. Ecol. Econ. 2021, 188, 107113. [Google Scholar] [CrossRef]
  20. Rugman, A.M.; Verbeke, A. Corporate Strategies and Environmental Regulations: An Organizing Framework. Strateg. Manag. J. 1998, 19, 363–375. [Google Scholar] [CrossRef]
  21. Porter, M.E.; Van der Linde, C. Toward a New Conception of the Environment-Competitiveness Relationship. J. Econ. Perspect. 1995, 9, 97–118. [Google Scholar] [CrossRef]
  22. Xie, D. Local Supervision, Vertical Supervision and Corporate Environmental Protection Investment—An Empirical Study Based on Listed A-share Heavily Polluting Enterprises. Account. Res. 2020, 41, 170–186. [Google Scholar]
  23. Dal Maso, L.; Mazzi, F.; Soscia, M.; Terzani, S. The Moderating Role of Stakeholder Management and Societal Characteristics in the Relationship between Corporate Environmental and Financial Performance. J. Environ. Manag. 2018, 218, 322–332. [Google Scholar] [CrossRef]
  24. Ullah, A.; Zhao, X.; Abdul Kamal, M.; Zheng, J. Environmental Regulations and Inward FDI in China: Fresh Evidence from the Asymmetric Autoregressive Distributed Lag Approach. Int. J. Financ. Econ. 2022, 27, 1340–1356. [Google Scholar] [CrossRef]
  25. Du, Y.; Li, Z.; Du, J.; Li, N.; Yan, B. Public Environmental Appeal and Innovation of Heavy-Polluting Enterprises. J. Clean. Prod. 2019, 222, 1009–1022. [Google Scholar] [CrossRef]
  26. Kamal, M.A.; Ullah, A.; Qureshi, F.; Zheng, J.; Ahamd, M. China’s Outward FDI and Environmental Sustainability in Belt and Road Countries: Does the Quality of Institutions Matter? J. Environ. Plan. Manag. 2021, 64, 1–35. [Google Scholar] [CrossRef]
  27. Bednar, M.K. Watchdog or Lapdog? A Behavioral View of the Media as a Corporate Governance Mechanism. Acad. Manag. J. 2012, 55, 131–150. [Google Scholar] [CrossRef]
  28. Su, Y.; Fan, Q. Renewable Energy Technology Innovation, Industrial Structure Upgrading and Green Development from the Perspective of China’s Provinces. Technol. Forecast. Soc. Chang. 2022, 180, 121727. [Google Scholar] [CrossRef]
  29. Chan, K.C.; Chen, Y.; Liu, B. The Linear and Non-Linear Effects of Internal Control and Its Five Components on Corporate Innovation: Evidence from Chinese Firms Using the COSO Framework. Eur. Account. Rev. 2021, 30, 733–765. [Google Scholar] [CrossRef]
  30. Tang, C.; Xu, Y.; Hao, Y.; Wu, H.; Xue, Y. What Is the Role of Telecommunications Infrastructure Construction in Green Technology Innovation? A Firm-Level Analysis for China. Energy Econ. 2021, 103, 105576. [Google Scholar] [CrossRef]
  31. Ye, C.; Wang, Z.; Wu, J.; Li, H. External Governance, Environmental Information Disclosure and the Cost of Equity Financing. Nankai Bus. Rev. 2015, 18, 85–96. [Google Scholar]
  32. Zhang, Q.; Yu, Z.; Kong, D. The Real Effect of Legal Institutions: Environmental Courts and Firm Environmental Protection Expenditure. J. Environ. Econ. Manag. 2019, 98, 102254. [Google Scholar] [CrossRef]
  33. Luo, Y.; Chen, Y.; Lin, J.-C. Does Air Quality Affect Inventor Productivity? Evidence from the NOx Budget Program. J. Corp. Financ. 2022, 73, 102170. [Google Scholar] [CrossRef]
  34. Tan, Z.; Yan, L. Does Air Pollution Impede Corporate Innovation? Int. Rev. Econ. Financ. 2021, 76, 937–951. [Google Scholar] [CrossRef]
  35. Zhu, C.; Lee, C.-C. The Internal and External Effects of Air Pollution on Innovation in China. Environ. Sci. Pollut. Res. 2021, 28, 9462–9474. [Google Scholar] [CrossRef] [PubMed]
  36. Song, X.; Jiang, X.; Han, J.; Zhao, C.; Guo, Y.; Yu, Z. Research on the Value Effect of Enterprise Carbon Information Disclosure—Based on the Adjustment of Public Pressure. Account. Res. 2019, 40, 78–84. [Google Scholar]
  37. Wang, F.; Xu, L.; Zhang, J.; Shu, W. Political Connections, Internal Control and Firm Value: Evidence from China’s Anti-Corruption Campaign. J. Bus. Res. 2018, 86, 53–67. [Google Scholar] [CrossRef]
  38. Wu, J.; Xia, Q.; Li, Z. Green Innovation and Enterprise Green Total Factor Productivity at a Micro Level: A Perspective of Technical Distance. J. Clean. Prod. 2022, 344, 131070. [Google Scholar] [CrossRef]
  39. Xiang, X.; Liu, C.; Yang, M. Who Is Financing Corporate Green Innovation? Int. Rev. Econ. Financ. 2022, 78, 321–337. [Google Scholar] [CrossRef]
  40. Roper, S.; Hewitt-Dundas, N. Knowledge Stocks, Knowledge Flows and Innovation: Evidence from Matched Patents and Innovation Panel Data. Res. Policy 2015, 44, 1327–1340. [Google Scholar] [CrossRef]
  41. Ardito, L.; Messeni Petruzzelli, A.; Pascucci, F.; Peruffo, E. Inter-Firm R&D Collaborations and Green Innovation Value: The Role of Family Firms’ Involvement and the Moderating Effects of Proximity Dimensions. Bus. Strateg. Environ. 2019, 28, 185–197. [Google Scholar] [CrossRef]
  42. Wang, C.; Hu, Q. Knowledge Sharing in Supply Chain Networks: Effects of Collaborative Innovation Activities and Capability on Innovation Performance. Technovation 2020, 94, 102010. [Google Scholar] [CrossRef]
  43. Wooldridge, J.M. Econometric Analysis of Cross Section and Panel Data, 2nd ed.; MIT Press: London, UK, 2010; pp. 777–851. [Google Scholar]
  44. Liu, J.; Zhao, M.; Wang, Y. Impacts of Government Subsidies and Environmental Regulations on Green Process Innovation: A Nonlinear Approach. Technol. Soc. 2020, 63, 101417. [Google Scholar] [CrossRef]
  45. Zhang, Y.; Xing, C.; Zhang, Y. The Impact of Media Coverage on Green Technology Innovation of High-Polluting Enterprises. Chin. J. Manag. 2021, 18, 557–568. [Google Scholar]
  46. Tian, G.; Li, S. Economic Policy Uncertainty and the Creation of Bank Liquidity: Empirical Evidence from China. Econ. Res. J. 2020, 55, 19–35. [Google Scholar]
  47. Huang, J.; Xu, Z.; Xu, S. Land Price Distortion, Enterprises’ Property and Over-investment—An Empirical Research Based on the Data of Chinese Industrial Enterprises and Land Price of Cities in China. China Ind. Econ. 2015, 33, 57–69. [Google Scholar] [CrossRef]
  48. Li, Y.; Liu, Y.; Xie, F. Technology Directors and Firm Innovation. J. Multinatl. Financ. Manag. 2019, 50, 76–88. [Google Scholar] [CrossRef]
  49. Kamal, M.A.; Hasanat Shah, S.; Jing, W.; Hasnat, H. Does the Quality of Institutions in Host Countries Affect the Location Choice of Chinese OFDI: Evidence from Asia and Africa. Emerg. Mark. Financ. Trade 2020, 56, 208–227. [Google Scholar] [CrossRef]
  50. Tang, H.; Liu, J.; Wu, J. The Impact of Command-and-Control Environmental Regulation on Enterprise Total Factor Productivity: A Quasi-Natural Experiment Based on China’s “Two Control Zone” Policy. J. Clean. Prod. 2020, 254, 120011. [Google Scholar] [CrossRef]
  51. Cai, W.; Xu, F. The Impact of the New Environmental Protection Law on Eco-Innovation: Evidence from Green Patent Data of Chinese Listed Companies. Environ. Sci. Pollut. Res. 2022, 29, 10047–10062. [Google Scholar] [CrossRef]
  52. Palmer, K.; Oates, W.; Portney, P. Tightening Environmental Standards—The Benefit-Cost or the No-Cost Paradigm. J. Econ. Perspect. 1995, 9, 119–132. [Google Scholar] [CrossRef]
  53. Moon, S.-G.; deLeon, P. Contexts and Corporate Voluntary Environmental Behaviors: Examining the EPA’s Green Lights Voluntary Program. Organ. Environ. 2007, 20, 480–496. [Google Scholar] [CrossRef]
  54. Yang, J.; Shi, D.; Yang, W. Stringent Environmental Regulation and Capital Structure: The Effect of NEPL on Deleveraging the High Polluting Firms. Int. Rev. Econ. Financ. 2022, 79, 643–656. [Google Scholar] [CrossRef]
  55. Bendig, D.; Foege, J.N.; Endriß, S.; Brettel, M. The Effect of Family Involvement on Innovation Outcomes: The Moderating Role of Board Social Capital. J. Prod. Innov. Manag. 2020, 37, 249–272. [Google Scholar] [CrossRef]
  56. Zyglidopoulos, S.C.; Georgiadis, A.P.; Carroll, C.E.; Siegel, D.S. Does Media Attention Drive Corporate Social Responsibility? J. Bus. Res. 2012, 65, 1622–1627. [Google Scholar] [CrossRef]
  57. Liao, Z.; Weng, C.; Shen, C. Can Public Surveillance Promote Corporate Environmental Innovation? The Mediating Role of Environmental Law Enforcement. Sustain. Dev. 2020, 28, 1519–1527. [Google Scholar] [CrossRef]
  58. Yigitcanlar, T.; Sabatini-Marques, J.; da-Costa, E.M.; Kamruzzaman, M.; Ioppolo, G. Stimulating Technological Innovation through Incentives: Perceptions of Australian and Brazilian Firms. Technol. Forecast. Soc. Chang. 2019, 146, 403–412. [Google Scholar] [CrossRef]
  59. Bai, Y.; Song, S.; Jiao, J.; Yang, R. The Impacts of Government R&D Subsidies on Green Innovation: Evidence from Chinese Energy-Intensive Firms. J. Clean. Prod. 2019, 233, 819–829. [Google Scholar] [CrossRef]
Figure 1. Research framework.
Sustainability 14 12180 g001
Table 1. Descriptive statistics of variables.
VariableObs.MeanSDMinMax
INV11300.5610.88705.257
UTI11300.5890.8304.357
ERF11300.1910.35904.494
AIR81483.40331.01134.038242.692
MED11305.4210.9572.3988.657
IC11210.5030.07600.676
SIZE113022.8741.24319.97326.037
AGE11302.3640.75103.332
TOBIN11303.1021.56−10.710.222
CEO11300.1610.36801
PAY11300.5831.2430.00517.231
INS11300.4420.22700.971
MANG11300.0250.08100.662
BOARD11309.2512.071518
ROA11300.0350.055−0.4410.381
HHI11300.1170.1010.0150.718
FIRST11300.3610.1490.0840.9
Table 7. Robustness test of moderating effects.
(1)(2)(3)
INVUTIINV
ERF−1.101 ***
(−3.16)
−0.797 ***
(−2.82)
−0.490 **
(−2.10)
AIR−0.005
(−1.42)
ERF*AIR−0.017 *
(−1.68)
MEDIA 0.083
(1.48)
ERF*MEDIA 0.503 **
(2.49)
IC 0.001 **
(2.03)
ERF*IC 0.004 *
(1.73)
Constant−16.34 ***
(−7.22)
−13.57 ***
(−7.55)
−15.98 ***
(−8.26)
ControlsYesYesYes
YearYesYesYes
N81411301121
Note: *** p < 0.01, ** p < 0.05, and * p < 0.1; and t statistics are in parentheses.
Publisher’s Note: MDPI stays neutral with regard to jurisdictional claims in published maps and institutional affiliations.

