Abstract
Kaffir lime peels extract was used as an agent for the reduction of graphene oxide (GO) into reduced graphene oxide (rGO) via a simple room temperature-dispersion process. The GO obtained from the Hummers process is dispersed in polyphenols rich extract at a varied GO-to-extract ratio of 1:1, 1:2, 1:3, and 1:4. The formation of rGO was confirmed through SEM, FTIR, XPS, XRD, and N2 sorption characterization. The restoration of C=C group and the reduction of several oxygen-containing groups confirmed the successful formation of rGO from GO. The resultant rGOs were used in the adsorption system for methylene blue uptake. The results indicated that the rGOs prepared at a GO-to-extract ratio of 1:2 had the highest adsorption capacity than rGO at other ratios. The XPS spectrum analysis of rGO 1:2 showed a higher C-C/C-O ratio than the other rGOs, indicating a higher number of adsorption sites which aid in improving the adsorption performance. The adsorption isotherm and kinetic studies were conducted to gain insight into the mechanism and rate of methylene blue uptake by the rGOs. The adsorption isotherm systems were consistent with Langmuir isotherm model with the highest adsorption capacity of 118 mg g–1 by rGO 1:2. The kinetic adsorption data are well represented by the pseudo-second order model, the adsorption equilibrium was achieved within 400 min with the overall uptake rate of 0.3 mg g–1 min–1.
1. Introduction
The use of graphene-derived adsorbents to remove toxic substances in water and wastewater has received considerable attention, owing to their high surface area and excellent adsorption performance [1,2,3,4,5,6], with graphene oxide (GO) and reduced graphene oxide (rGO) being the two most popularly used graphene-derivatives. GO is well-known for its rich oxygen-containing groups, i.e., epoxy and hydroxyl (located at the basal plane), carbonyl and carboxyl (at the edge); these groups contribute in creating electrostatic attraction with the solute molecules [7]. The rGO is the reduced form of GO prepared via oxygen-containing group elimination from GO. Several recent studies have reported better adsorption performance of rGO than GO; the scarcity or absence of oxygen-containing groups of rGO allows direct exposure of the aromatic structure to the solute molecules, thereby establishing the π–π interaction that can increase adsorption capacity [2,8,9]. Furthermore, rGO is usually decorated with defects, including residual oxygen-containing groups and vacancies, that are formed due to imperfect reduction of GO [10]. The defects in rGO are responsible for its poor electrical conductivity which is undesirable in its application in electronic devices. However, for its application in adsorption, the defects synergistically act as additional adsorption sites which contribute to enhance the adsorption capacity [8,11].
There are various reduction methods available for the conversion of GO into rGO, including chemical reduction [12,13,14], biological reduction [15], solvothermal reduction [16], photo-mediated reduction [17,18], microwave radiation-induced reduction [19,20], etc. The chemical reduction method is widely performed in preparing rGO, since it can produce rGO with a high C/O ratio [12,21] and high surface area [14]. The major drawback of the chemical method is the use of toxic chemicals, which can potentially cause negative environmental issues; the use of natural-derived (green) reducing agents has been proposed as a breakthrough to overcome this drawback. The green reducing agents without toxic effects on the environment can be obtained from plants, in the form of polyphenol-containing extracts obtained from various parts such as flowers, fruits, leaves, bark, seeds, bud, roots, etc. [22,23,24]. In recent advances, the use of agricultural waste as a source of polyphenol-containing extract can provide not only environmentally friendly but also cost-effective material. For example, Gan et al. demonstrated the ability of sugarcane bagasse to reduce GO in aqueous system [25]. Sugarcane bagasse mainly contains polymer complex such as lignin, hemicelluloses, and cellulose that yield reducing sugars after acid treatment. These sugars act as both reducing and stabilizer agent [26]. Tamilselvi et al. reported the rGO preparation using coconut waste via simple catalytic oxidation [27].
In this study, the extract of kaffir lime peels is utilized to prepare the reducing agent to convert GO into rGO. Kaffir lime (Citrus hystrix) is a tropical fruit native to Southeast Asia, the leaves and fruit of which are widely used in Asian cuisine. In addition, the intense citrus fragrance and high essential oil content of kaffir lime make it widely used in perfumery. However, the use of kaffir lime peels is still rare. The kaffir lime peels possess high levels of polyphenols [28,29] which can be a potential reducing agent for GO to produce rGO, i.e., the total phenolic content of peel extract is 0.12 mg gallic acid equivalent per mg extract [30].
The aim of this work is to develop a simple, cost-effective, and environmentally friendly method of rGO preparation using kaffir lime peel extract that opens new consideration to utilize biomass waste. To understand the green route of GO reduction, different amounts of extract were added to GO followed by an adsorption experiment to test the ability of rGO to remove methylene blue. Several characterization techniques were performed to support the study.
2. Materials and Methods
2.1. Materials
Graphite (Alrich, 99%), hydrochloric acid (FlukaTM, 37%), sulfuric acid (FlukaTM, 97%), hydrogen peroxide (Sigma-Aldrich, 30%), potassium permanganate (SAP, ≥99.0%), and methylene blue (Merck) were used as received. All chemicals were procured form Sigma Aldrich, Singapore and Merck, Germany, and were used without additional purification. Kaffir lime fruits were obtained from Ponorogo, East Java, Indonesia.
2.2. Preparation of rGO
GO was prepared by a modified Hummers method [31]. The preparation of GO was accomplished by mixing the graphite (3 g) and sulfuric acid (70 mL) in an ice bath to set the temperature below 20 °C. After that, KMnO4 (9 g) was added and subsequently, the mixture was transferred to an oil bath, and the temperature was maintained at 40 °C. During the reaction, the mixture was continuously stirred at 600 rpm for 30 min prior to adding 150 mL of RO water before the mixture was further stirred for another 15 min at 95 °C. Then, 500 mL of water was added, followed by slow addition of 15 mL of H2O2 (30%) to remove the residue. The yellow suspension obtained was filtered and washed with dilute HCl solution of 1:10 (250 mL). The GO solution was repeatedly washed with water to remove the content of all residual salts and acids. The neutralized GO solution was then stirred overnight, followed by the sonication process to exfoliate the graphite oxide into graphene oxide. The GO dispersion was then stored for the reduction process; rGO was prepared by mixing GO and kaffir lime peel extract with a ratio of 1:1, 1:2, 1:3, and 1:4 (denoted as rGO 1:1, rGO 1:2, rGO 1:3, and rGO 1:4, respectively) for 8 h at room temperature. The solid precipitates were separated, washed, and dried for future use.
2.3. Adsorption Experiment
To investigate the adsorption kinetic study, methylene blue stock solution with an initial concentration of 50 mg L–1 was prepared and poured into a series of Erlenmeyer flasks without any pH adjustment. The specific amount of rGO (5 mg) was added to each flask. The flasks were placed in a shaking water bath (Memmert). The samples were taken at a different time interval, and the concentration of the remaining methylene blue dye was determined by using a spectrophotometer (Shimadzu-1240) at 665 nm. The percentage removal and the equilibrium adsorption capacity (q) were calculated by Equations (1) and (2), respectively:
where Co, Cf, and Ce are the initial, final, and equilibrium concentrations of methylene blue (mg L–1), respectively, m is the mass of rGO (g), and V is the solution volume. A calibration curve with a series of methylene blue concentrations was prepared before to determine the initial and final concentration.
The adsorption isotherm study was carried out by preparing a series of capped Erlenmeyer flasks containing 20 mL of methylene blue solution. Subsequently, 5 mg of rGO was added into each flask. The flasks were shaken for 400 min before to determine the remaining methylene blue dye solution using a spectrophotometer at 665 nm.
2.4. Characterization
The morphology of samples was observed using a scanning electron microscope (SEM) (EVO MA-10, ZEISS). X-ray photoelectron spectroscopy (XPS) analysis was performed using an Mg Kα source from Thermo Fisher Scientific Multilab 2000 Spectrometer. The charging of the sample was corrected by applying the C 1s peak at 284.8 eV as a reference. IR spectra were recorded on a Shimadzu FT-IR spectrometer using KBr as a reference. A disk of KBr/sample mixture with a ratio of 500:1 was prepared, and the absorbance spectra of the disk were collected at a resolution of 4 cm–1. The specific surface area was analyzed by N2 sorption at −196 °C using Autosorb (Quantachrome Corp.). Prior to the adsorption, samples were degassed at 300 °C for 3 h. Surface area was obtained by applying the Brunauer–Emett–Teller (BET) equation. XRD samples were prepared by packing the sample on a glass sample plate. The sample was scanned over the range (2θ) of 10° to 60° with a scanning speed at 2° per minute.
3. Results and Discussion
3.1. Structural Characteristics
The surface morphology of GO and rGO was revealed by SEM analysis. The GO appeared as a crumpled sheet with a flaky structure (Figure 1a) and some of the layers were randomly aggregated. Figure 1b to 1e shows the morphology of GO after reduction using kaffir lime peel extract at a GO-to-extract ratio of 1:1, 1:2, 1:3, and 1:4. The resultant rGOs appeared as more crumpled (compare to GO) sheets with random orientation. The crumpled features of rGO materials can be attributed to the oxygen reduction in the basal plane of the sp2 carbon; during the reduction, the lamellas are being self-assembled via van der Waal forces. The rGO prepared at lower extract ratios, namely 1:1 and 1:2, had sheets that were highly wrinkled to form a cavity-like structure. Meanwhile, the rGO prepared at a ratio of 1:3 and 1:4 had less wrinkled sheets.
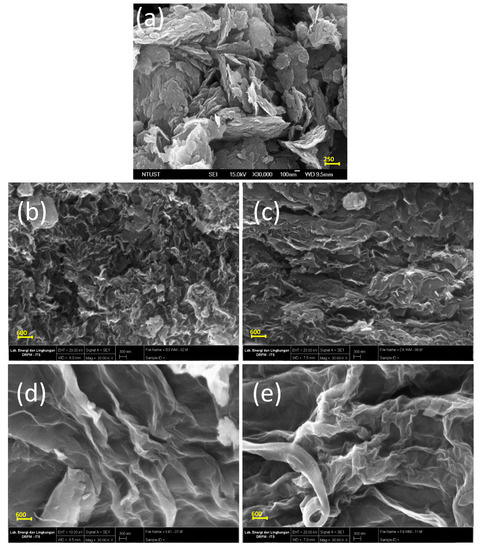
Figure 1.
Morphology of: (a) GO and rGO obtained from different GO-extract ratio; (b) 1:1; (c) 1:2; (d) 1:3; (e) 1: 4.
FTIR analysis was performed to investigate the functional groups alteration as the GO were being reduced to rGO. The FTIR spectrum is presented in Figure 2. The FTIR spectrum of GO shows a band at 1633 cm–1; the band arises due to the skeletal vibration of unoxidized moiety of GO [32]. The band at 1500 cm−1 can be attributed to the C–O stretching vibration, and the band at 1706 cm–1 can be assigned to aromatic C–C bonds of carbonyl moieties (i.e., ketone, aldehyde-like, diketone, keto-esters) [13]. A broad band at around 3400 cm–1 arises due to the O–H stretching vibration of oxygen-containing moieties, such as carbonyl, carboxylic, epoxy and hydroxyl in GO [25]; the rGOs show a reduced intensity of this band (highlighted with the box in Figure 2), indicating the elimination of oxygen moieties. Furthermore, the bands at the wavenumber range of 1400–1700 cm−1 (highlighted with the box in Figure 2) appear in lower intensities for rGO prepared at the GO-to-extract ratio of 1:2, implying the higher reduction of oxygen-containing groups. Meanwhile, the bands are still prominent for rGOs prepared at ratio of 1:1, 1:3, and 1:4, implying the partially or imperfect reduction of GO as discussed below.
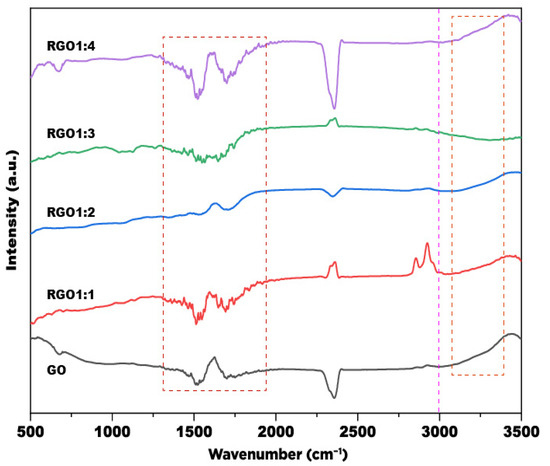
Figure 2.
FTIR spectra of GO and rGO samples.
Kaffir lime peels contain polyphenols which are composed of various bioactive compounds such as naringin, hesperidin, naringenin, hesperetin, nobiletin, gallic acid, ferulic acid, catechin, p-coumaric acid, ferulic acid, rutin, quercetin, terpinolene, vitamin C, carotenoids, etc. [30,33]. Those polyphenols act as the reducing agent that can repel some of the oxygen-containing groups of GO. Figure 3 shows the mechanism of GO reduction into rGO. After the dispersion of GO in extract, the polyphenols (represented by hesperidin) attack the sp2 carbon atom at the epoxide ring of GO, which lead to the formation of the C–O–C bond between GO and the polyphenol compound (intermediate 1). As the reduction proceeds, other C–O–C bonds (intermediate 2) yield the reduced form of GO. is Ester formation from the condensation reaction of the carboxylic acid group followed by its ring-opening also contributes to the reducing form of GO [9].
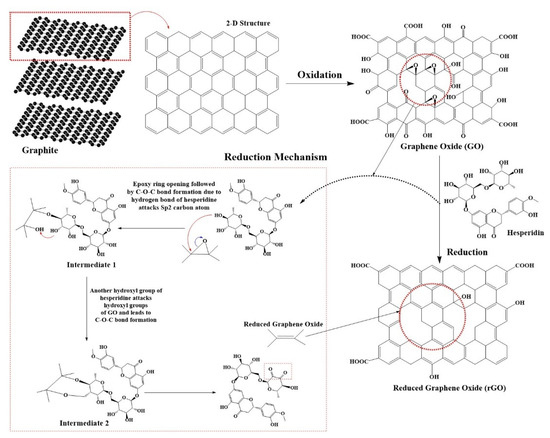
Figure 3.
A plausible mechanism for GO reduction by polyphenols of kaffir lime peel extract. Hesperidin is one of the flavonoids in kaffir lime peels observed in our previous study [30], and it was selected as the model to illustrate the reduction mechanism.
Figure 4 shows the set of XPS spectra of GO and kaffir lime peel-reduced GO (or rGO). The survey spectra of GO show six characteristic C 1s peaks. Specifically, the peak at 284.8 eV is attributed to C–C/C=O in aromatic rings. The peak at 286.1 eV corresponds to the C–OH bond which occurs due to the surface oxidation. The peak at 287.1 eV contributes to the C–O–C bond; the peak at 288.0 eV is associated with the C=O bond, and the peak at 290.0 eV is related to the O–C=O bonds of the carboxylate group. The rGOs exhibit a C 1s XPS spectrum with similar peaks to that of GO; however, some of the peaks appear at reduced intensities, specifically for the peaks corresponding to C=O (288.0 eV) and O–C = O bond (290.0 eV). The peak at 284.8 eV in the XPS spectrum of rGO appeared at similar intensities to that of GO, implying that the oxygen-containing groups of GO are not completely reduced by the kaffir lime peel extract.
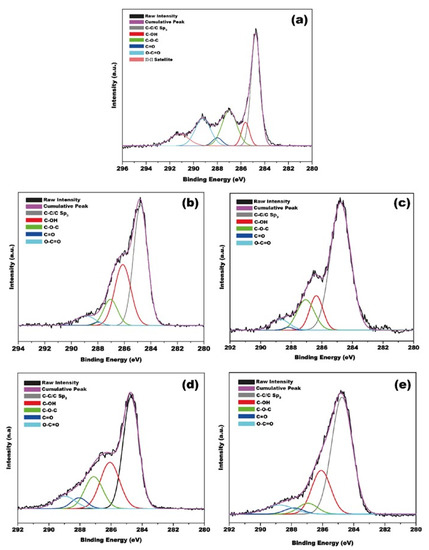
Figure 4.
Core level C 1s XPS spectra of (a) GO and rGO samples: (b) rGO 1:1; (c) rGO 1:2; (d) rGO 1:3; (e) rGO 1:4.
The ratio of the C–C/C–O bond as measured using the XPS analysis can be used to estimate the amount of oxygen reduced in rGO. The ratio can be calculated by comparing the area obtained from the deconvolution peak of the C 1s XPS peak; the results are summarized in Table 1.

Table 1.
Peak area and C–C/C–O area ratio of GO and rGO.
The ratio of C–C/C–O for GO is 0.85. The reduction of GO using kaffir lime peel extract into rGO caused a ~1.25 times increase of the ratio of C–C/C–O. The rGO prepared at the GO-to-extract ratio of 1:2 has the highest C–C/C–O ratio, specifically 2.13. The rGOs prepared at other GO-to-extract ratios show lower C–C/C–O, specifically 1.07, 1.14, and 1.38 for rGO 1:1, 1:3, and 1:4, respectively. The high C–C/C–O ratio for rGO 1:2 can be correlated to the presence of more defects, which later can synergistically serve as adsorption sites. Table 1 also suggests that surface oxygen cannot be removed totally by kaffir lime peel extract. The ability of plant extract to remove oxygen from GO has been well documented [24,34]. Plant extracts contain large molecules such as polyphenols (phenolics and flavonoids), polysaccharides, proteins, etc., that are able to donate hydrogen during GO reduction (Figure 3). However, those large molecules can stay on the surface of rGO after the reduction process [24,35]. Therefore, their presence could be detected in the rGOs.
Table 2 shows the surface area of rGOs as calculated using BET models from the N2 sorption isotherm analysis. The rGO prepared at a GO-to-extract ratio of 1:2 exhibits the highest surface area of 765 m2/g, followed by rGO 1:4 (604 m2/g), rGO 1:3 (582 m2/g), and rGO 1:1 (402 m2/g). The surface area of the kaffir lime peel extract rGO is comparable to that of reported rGO; for example, the use of rosehip extract as the reducing agent yielded rGO with a surface area of 230 m2 g–1 [36], and the roselle extract reduced GO resulted in rGO with a surface area of 507 m2 g–1 [37]. The addition of more kaffir lime peel extract resulted in rGO with lower surface area. This can be possibly governed by the deoxygenation of GO. The surface area of rGOs has a significant effect on the adsorption performance, wherein the higher surface area can lead to the higher adsorption capacity.

Table 2.
The surface area of rGO prepared from different amounts of extract.
X-ray diffraction analysis (XRD) was performed to evaluate basal d-spacing of the rGO. As shown in Figure 5, the GO exhibits a prominent peak at 2θ of 10.15°; the peak corresponds to the (001) crystal plane reflection, with calculated d-spacing of 0.87 nm. The reduction of GO to rGO causes the breakdown of the crystal structure as indicated by the disappearance of sharp peaks, wherein the rGO shows broad peaks with weakened intensities. The peak at 2θ of 10.15° for rGO was lower in intensities compared to GO, and the calculated d-spacing of rGO was 0.34 nm. The reduced d-spacing can be associated with the elimination of oxygen-containing groups between the layered graphene and the construction of highly ordered few-layered graphene [38].
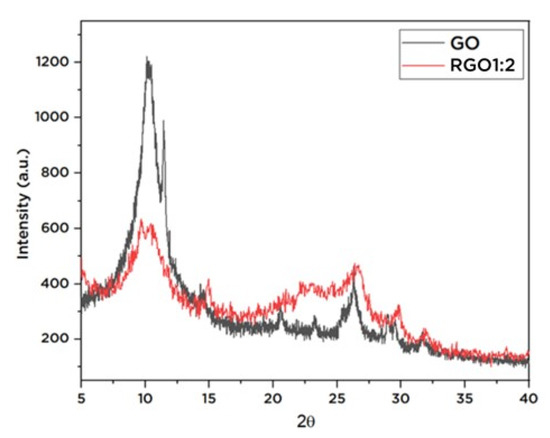
Figure 5.
XRD spectrum of GO and rGO.
3.2. Adsorption Studies
As shown in the abovementioned physicochemical characterizations, the ratio of GO-to-extract was significantly affected the characteristics of the resultant rGOs. The different characteristics of rGOs resulted in different adsorption performance toward methylene blue. As shown in Figure 6, rGO prepared with a GO:extract ratio of 1:2 exhibits the highest percent removal of methylene blue (56.5 ± 6.2%), followed by rGO 1:3, 1:4, and 1:1 with removal efficiency of 45.9 ± 2.63, 42.2 ± 2.9, and 37.1 ± 5.1%, respectively. The better adsorption performance of rGO 1:2 can be correlated with its higher surface area. It can create better contact of the adsorption sites with the adsorbate molecules. Furthermore, the C–C/C–O ratio of rGO 1:2 (as obtained from XPS spectrum analysis) was higher than the rGO prepared at other ratios. The high C–C/C–O ratio of rGO 1:2 is attributed to the higher number of defects (i.e., oxygen-containing impurities); the defects can serve as additional adsorption sites which contribute to the higher adsorption capacity. Furthermore, the polyphenols of kaffir lime peel extract may also serve as additional adsorption sites which further enhance the adsorption capacity [35].
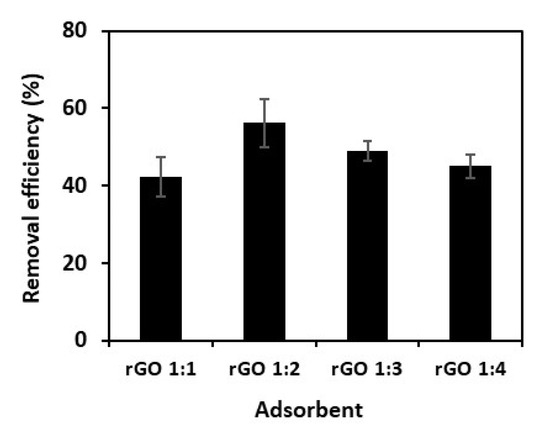
Figure 6.
Removal efficiency of methylene blue onto rGO samples. Co = 50 mg L–1, adsorbent dosage = 5 mg, adsorption time = 400 min.
3.2.1. Adsorption Kinetics
Kinetic adsorption study was performed to study the rate and controlling mechanism during adsorption. The adsorption kinetic profiles of methylene blue towards rGO are shown in Figure 7.

Figure 7.
Adsorption kinetic data of methylene blue onto rGO and kinetic plots of: (a) pseudo-first-order; (b) pseudo-second-order; (c) Elovich models.
It can be seen that the adsorption of methylene blue on rGO increases up to 150–210 min, after which it begins to slow until the equilibrium is achieved. Adsorption kinetic models investigated in this study are pseudo-first-order, pseudo-second-order, and Elovich models. The pseudo-first-order model has the following equation:
where qt and q1e are the amount of methylene blue adsorbed per unit mass of adsorbent at time t and at equilibrium (mg g–1), respectively, and k1 is the rate constant of pseudo-first-order adsorption (min–1). The pseudo-second-order model can be expressed as:
where q2e is the amount of methylene blue adsorbed per unit mass of adsorbent at equilibrium (mg/g), and k2 is the pseudo-second-order rate constant (g mg–1 min–1). The Elovich model has a mathematical expression as:
where α and β are empirical constant related to adsorption (mg g–1 min–1) and desorption (g mg–1) rate constant, respectively, and qref is the highest amount of methylene blue adsorbed onto rGO based on the experimental data (mg g–1). RE is the equilibrium parameter of the Elovich equation. The corresponding kinetic parameters obtained by a nonlinear least-squares method are presented in Table 3.

Table 3.
Kinetic parameters for the adsorption of methylene blue onto rGO.
It can be seen from Figure 7 that the pseudo-second-order equation provides a better agreement with the experimental results compared to the pseudo-first-order model as indicated by greater values of the adjusted correlation coefficient (R2 (Adj.)) and lower sum-of-squared-error (SSE) (Table 3). Therefore, the adsorption of methylene blue onto rGO obeyed the pseudo-second-order kinetic model. The adsorbent of rGO 1:1 and 1:2 exhibited a comparable removal rate constant at around 0.0002 g mg–1 min–1. The Elovich model offered slightly lower R2 values than the pseudo-second-order model. However, from the RE values (in the range of 0.17 to 0.2), it can be suggested that the adsorption of methylene blue towards rGO exhibited a mildly rising behavior [39]. This is consistent with the experimental data that moderate adsorption rate was observed until equilibrium after 400 min.
3.2.2. Adsorption Isotherms
The adsorption isotherm indicates the distribution of molecules between the liquid phase and the solid phase after the system reaches equilibrium. To date, many adsorption isotherm equations are available to represent the experimental data. The most common equations for liquid phase adsorption are the Langmuir and Freundlich isotherms [34,39]. The Langmuir adsorption model is presented as:
where qmax is the maximum adsorption capacity (mg g–1), and KL is the Langmuir adsorption constant (L mg–1). The essential feature of the Langmuir isotherm can be expressed as a dimensionless constant called a separation factor (RL), given by the following expression:
where C0 is the initial concentration of methylene blue (mg L–1). The adsorption process will be unfavorable (RL > 1), linear (RL = 1), favorable (0 < RL < 1), or irreversible unfavorable (RL = 0).
The Freundlich isotherm model is given by Equation (9):
where KF is the Freundlich adsorption constant (mg g–1) (mg L–1)–n, and n is the factor describing the favorability of the adsorption process.
The adsorption isotherms of methylene blue onto rGO are shown in Figure 8. The parameters of the Langmuir and Freundlich equations obtained from the analysis of nonlinear least-square are summarized in Table 4.
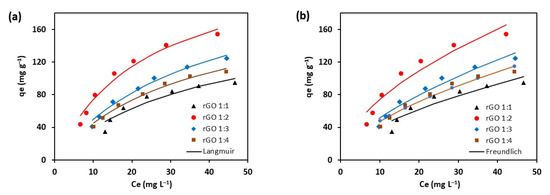
Figure 8.
Adsorption isotherms of methylene blue onto rGO. The data were fitted using Langmuir and Freundlich model.

Table 4.
Langmuir and Freundlich parameters for the adsorption of methylene blue onto rGO.
As shown in Figure 8, the Langmuir model can represent experimental data better than the Freundlich model, as indicated by a higher R2 value (Table 4). The calculated RL values of rGO samples are in the range between 0 and 1 (Table 4). The results indicate that the adsorption of methylene blue onto rGO is favorable [39]. The lowest RL value exhibited by rGO 1:2 suggests that the adsorbent offers the most favorable sites for methylene blue molecules. Moreover, the n value of the Freundlich model also indicates it is in the range of 1.6 to 1.8 which shows the adsorption is favorable, in agreement with the RL value.
The study demonstrated that the ability of rGO to remove methylene blue is influenced by kaffir lime peel extract added to GO. For rGO 1:1, it was found that the adsorption capacity is 83.8 mg g–1. Increasing the amount of extract to obtain rGO 1:2 increased the capacity by a factor of 1.4. In contrast, the addition of more extract decreased the adsorption capacity from 117.8 to 104.7 mg g–1. The adsorption capacity continued to decrease after adding more extract (rGO 1:4). The best adsorption performance was exhibited by rGO 1:2 with the overall uptake rate of methylene blue being 0.3 mg g–1 min–1. (Figure 7). Compared with other work, the performance of rGO 1:2 exhibits a slightly lower adsorption capacity than rGO prepared from lemon juice (130 mg g–1) [34]. Regarding the kinetic fitting model, it can be implied that the removal of methylene blue primarily occurs via chemisorption. Meanwhile, a previous study [8] showed complex adsorption mechanism of methylene blue in the presence of oxygen on the rGO.
4. Conclusions
The kaffir lime peel extract was used for the reduction of oxygen-containing groups in GO to produce rGO. The reduction of GO into rGO resulted in material with higher surface area. The reduced oxygen content of rGO was confirmed by FTIR, XRD, and XPS analysis. The rGO preparation conditions evidently influenced their adsorption properties. The best methylene blue adsorption was exhibited by rGO 1:2. The maximum methylene blue adsorption capacity was 118 mg g–1 (56% removal). Batch adsorption results showed that the maximum removal of methylene blue onto rGO was exhibited by rGO 1:2, and the equilibrium state was reached after 400 min. Adsorption kinetic curves of methylene blue towards rGO exhibited a mild rising kinetic behavior. A good fitting of kinetic data to a pseudo-second-order model suggests the chemisorption nature of the adsorption. The equilibrium adsorption data was best described by the Langmuir model, indicating the monolayer adsorption of methylene blue on the rGO surface with theoretical maximum capacity of 251.9 mg g–1. The results suggest that rGO prepared from kaffir lime peel extract as the reducing agent can be utilized for wastewater treatment.
Author Contributions
Conceptualization, W.I.; methodology, V.P., C.S., and R.W.; software, V.B.L.; validation, M.Y.; formal analysis, C.G.; investigation, W.I. and S.P.S.; resources, A.E.A.; data curation, M.Y.; writing—original draft preparation, V.P., C.S., and R.W.; writing—review and editing, W.I.; visualization, V.B.L.; supervision, S.P.S.; project administration, S.P.S.; funding acquisition, W.I. All authors have read and agreed to the published version of the manuscript.
Funding
This research was funded by the Ministry of Research and Technology/National Research and Innovation Agency, Deputi for Strengthening Research and Development, Directorate of Research and Community Research, Republic Indonesia, grant number 150K/WM01.5/N/2021.
Institutional Review Board Statement
Not applicable.
Informed Consent Statement
Not applicable.
Data Availability Statement
Not applicable.
Acknowledgments
The authors thank Chun-Hui Zhou (Zhejiang University of Technology) for his assistance in XPS analysis.
Conflicts of Interest
The authors declare no conflict of interest.
References
- Wang, H.; Mi, X.; Li, Y.; Zhan, S. 3D Graphene-Based Macrostructures for Water Treatment. Adv. Mater. 2020, 32, e1806843. [Google Scholar] [CrossRef]
- Zhang, Y.; Yan, X.; Yan, Y.; Chen, D.; Huang, L.; Zhang, J.; Ke, Y.; Tan, S. The utilization of a three-dimensional reduced graphene oxide and montmorillonite composite aerogel as a multifunctional agent for wastewater treatment. RSC Adv. 2018, 8, 4239–4248. [Google Scholar] [CrossRef]
- Ye, F.; Wang, Z.; Mi, Y.; Kuang, J.; Jiang, X.; Huang, Z.; Luo, Y.; Shen, L.; Yuan, H.; Zhang, Z. Preparation of reduced graphene oxide/titanium dioxide composite materials and its application in the treatment of oily wastewater. Colloids Surf. A Physicochem. Eng. Asp. 2020, 586, 124251. [Google Scholar] [CrossRef]
- Gao, C.; Dong, Z.; Hao, X.; Yao, Y.; Guo, S. Preparation of Reduced Graphene Oxide Aerogel and Its Adsorption for Pb(II). ACS Omega 2020, 5, 9903–9911. [Google Scholar] [CrossRef]
- Lingamdinne, L.P.; Koduru, J.R.; Karri, R.R. A comprehensive review of applications of magnetic graphene oxide based nanocomposites for sustainable water purification. J. Environ. Manag. 2019, 231, 622–634. [Google Scholar] [CrossRef]
- Lingamdinne, L.P.; Choi, J.-S.; Choi, Y.-L.; Chang, Y.-Y.; Yang, J.-K.; Karri, R.R.; Koduru, J.R. Process modeling and optimization of an iron oxide immobilized graphene oxide gadolinium nanocomposite for arsenic adsorption. J. Mol. Liq. 2020, 299, 112261. [Google Scholar] [CrossRef]
- Minitha, C.R.; Lalitha, M.; Jeyachandran, Y.L.; Senthilkumar, L.; Kumar, R.T.R. Adsorption behaviour of reduced graphene oxide towards cationic and anionic dyes: Co-action of electrostatic and p-p interactions. Mater. Chem. Phys. 2017, 194, 243–252. [Google Scholar]
- Morimoto, N.; Kubo, T.; Nishina, Y. Tailoring the Oxygen Content of Graphite and Reduced Graphene Oxide for Specific Applications. Sci. Rep. 2016, 6, 21715. [Google Scholar] [CrossRef]
- Ramanathan, S.; Moorthy, S.; Ramasundaram, S.; Rajan, H.K.; Vishwanath, S.; Selvinsimpson, S.; Durairaj, A.; Kim, B.; Vasanthkumar, S. Grape Seed Extract Assisted Synthesis of Dual-Functional Anatase TiO2 Decorated Reduced Graphene Oxide Composite for Supercapacitor Electrode Material and Visible Light Photocatalytic Degradation of Bromophenol Blue Dye. ACS Omega 2021, 6, 14734–14747. [Google Scholar] [CrossRef]
- Eigler, S.; Dotzer, C.; Hirsch, A. Visualization of defect densities in reduced graphene oxide. Carbon 2012, 50, 3666–3673. [Google Scholar] [CrossRef]
- Chowdhury, S.; Balasubramanian, R. Recent advances in the use of graphene-family nanoadsorbents for removal of toxic pollutants from wastewater. Adv. Colloid Interface Sci. 2014, 204, 35–56. [Google Scholar] [CrossRef] [PubMed]
- Al-Gaashani, R.; Najjar, A.; Zakaria, Y.; Mansour, S.; Atieh, M.A. XPS and structural studies of high quality graphene oxide and reduced graphene oxide prepared by different chemical oxidation methods. Ceram. Int. 2019, 45, 14439–14448. [Google Scholar] [CrossRef]
- Lesiak, B.; Trykowski, G.; Tóth, J.; Biniak, S.; Kövér, L.; Rangam, N.; Stobinski, L.; Malolepszy, A. Chemical and structural properties of reduced graphene oxide—dependence on the reducing agent. J. Mater. Sci. 2021, 56, 3738–3754. [Google Scholar] [CrossRef]
- Mohan, V.B.; Jayaraman, K.; Bhattacharyya, D. Brunauer–Emmett–Teller (BET) specific surface area analysis of different graphene materials: A comparison to their structural regularity and electrical properties. Solid State Commun. 2020, 320, 114004. [Google Scholar] [CrossRef]
- Lehner, B.A.E.; Janssen, V.A.E.C.; Spiesz, E.M.; Benz, D.; Brouns, S.J.J.; Meyer, A.S.; Zant, H.S.J.v.d. Creation of conductive graphene materials by bacterial reduction using Shewanella oneidensis. Chem. Open 2019, 8, 888–895. [Google Scholar] [CrossRef]
- Siong, V.L.E.; Lee, K.M.; Juan, J.C.; Lai, C.W.; Tai, X.H.; Khe, C.S. Removal of methylene blue dye by solvothermally reduced graphene oxide: A metal-free adsorption and photodegradation method. RSC Adv. 2019, 9, 37686–37695. [Google Scholar] [CrossRef]
- Cao, X.; Zhao, J.; Wang, Z.; Xing, B. New insight into the photo-transformation mechanisms of graphene oxide under UV-A, UV-B and UV-C lights. J. Hazard. Mater. 2021, 403, 123683. [Google Scholar] [CrossRef]
- Tajiki, A.; Abdouss, M.; Sadjadi, S.; Mazinani, S.; Ramakrishna, S. Photo-induced green synthesis of bimetallic Ag/Pd nanoparticles decorated reduced graphene oxide/nitrogen-doped graphene quantum dots nanocomposite as an amperometric sensor for nitrite detection. Anal. Bioanal. Chem. 2021, 413, 6289–6301. [Google Scholar] [CrossRef]
- Park, O.-K.; Kim, N.H.; Lee, J.H. Rapid effective reduction by microwave-irradiated thermal reaction for large-scale production of high-quality reduced graphene oxide. Carbon 2021, 187, 330–337. [Google Scholar] [CrossRef]
- Lee, W.-J.; Jang, H.-R.; Kim, M.-J.; Kim, H.-M.; Oh, J.-M.; Paek, S.-M. Microwave-irradiated reduced graphene oxide nanosheets for highly reversible and ultrafast sodium storage. J. Alloy. Compd. 2018, 778, 382–390. [Google Scholar] [CrossRef]
- Liu, W.; Speranza, G. Tuning the Oxygen Content of Reduced Graphene Oxide and Effects on Its Properties. ACS Omega 2021, 6, 6195–6205. [Google Scholar] [CrossRef] [PubMed]
- Mahendran, G.B.; Ramalingam, S.J.; Rayappan, J.B.B.; Kesavan, S.; Periathambi, T.; Nesakumar, N. Green preparation of reduced graphene oxide by Bougainvillea glabra flower extract and sensing application. J. Mater. Sci. Mater. Electron. 2020, 31, 14345–14356. [Google Scholar] [CrossRef]
- Tayade, U.S.; Borse, A.U.; Meshram, J.S. Green reduction of graphene oxide and its applications in band gap calculation and antioxidant activity. Green Mater. 2019, 7, 143–155. [Google Scholar] [CrossRef]
- Agarwal, V.; Zetterlund, P.B. Strategies for reduction of graphene oxide—A comprehensive review. Chem. Eng. J. 2021, 405, 127018. [Google Scholar] [CrossRef]
- Gan, L.; Li, B.; Chen, Y.; Yu, B.; Chen, Z. Green synthesis of reduced graphene oxide using bagasse and its application in dye removal: A waste-to-resource supply chain. Chemosphere 2019, 219, 148–154. [Google Scholar] [CrossRef]
- Li, B.; Jin, X.; Lin, J.; Chen, Z. Green reduction of graphene oxide by sugarcane bagasse extract and its application for the removal of cadmium in aqueous solution. J. Clean. Prod. 2018, 189, 128–134. [Google Scholar] [CrossRef]
- Tamilselvi, R.; Ramesh, M.; Lekshmi, G.; Bazaka, O.; Levchenko, I.; Bazaka, K.; Mandhakini, M. Graphene oxide—Based supercapacitors from agricultural wastes: A step to mass production of highly efficient electrodes for electrical transportation systems. Renew. Energy 2020, 151, 731–739. [Google Scholar] [CrossRef]
- Orak, H.H.; Yagar, H.; Isbilir, S.S. Comparison of antioxidant activities of juice, peel, and seed of pomegranate (Punica granatum L.) and inter-relationships with total phenolic, Tannin, anthocyanin, and flavonoid contents. Food Sci. Biotechnol. 2012, 21, 373–387. [Google Scholar] [CrossRef]
- Fischer, U.A.; Carle, R.; Kammerer, D.R. Identification and quantification of phenolic compounds from pomegranate (Punica granatum L.) peel, mesocarp, aril and differently produced juices by HPLC-DAD–ESI/MSn. Food Chem. 2011, 127, 807–821. [Google Scholar] [CrossRef]
- Wijaya, Y.A.; Widyadinata, D.; Irawaty, W.; Ayucitra, A. Fractionation of phenolic and flavonoid compounds from kaffir lime (Citrus hystrix) peel extract and evaluation of antioxidant activity. Reaktor 2017, 17, 111–117. [Google Scholar] [CrossRef]
- Chen, J.; Yao, B.; Li, C.; Shi, G. An improved Hummers method for eco-friendly synthesis of graphene oxide. Carbon 2013, 64, 225–229. [Google Scholar] [CrossRef]
- Singh, K.; Ohlan, A.; Pham, V.H.; Balasubramaniyan, R.; Varshney, S.; Jang, J.; Hur, S.H.; Choi, W.M.; Kumar, M.; Dhawan, S.K.; et al. Nanostructured graphene/Fe3O4 incorporated polyaniline as a high performance shield against lectromagnetic pollution. Nanoscale 2013, 5, 2411–2420. [Google Scholar] [CrossRef] [PubMed]
- Srifuengfung, S.; Bunyapraphatsara, N.; Satitpatipan, V.; Tribuddharat, C.; Junyaprasert, V.B.; Tungrugsasut, W.; Srisukh, V. Antibacterial oral sprays from kaffir lime (Citrus hystrix DC.) fruit peel oil and leaf oil and their activities against respiratory tract pathogens. J. Tradit. Complement. Med. 2020, 10, 594–598. [Google Scholar] [CrossRef]
- Mahiuddin, M.; Ochiai, B. Lemon Juice Assisted Green Synthesis of Reduced Graphene Oxide and Its Application for Adsorption of Methylene Blue. Technologies 2021, 9, 96. [Google Scholar] [CrossRef]
- Weng, X.; Wu, J.; Ma, L.; Owens, G.; Chen, Z. Impact of synthesis conditions on Pb(II) removal efficiency from aqueous solution by green tea extract reduced graphene oxide. Chem. Eng. J. 2019, 359, 976–981. [Google Scholar] [CrossRef]
- Mindivan, F.; Göktaş, M. Rosehip-Extract-Assisted Green Synthesis and Characterization of Reduced Graphene Oxide. ChemistrySelect 2020, 5, 8980–8985. [Google Scholar] [CrossRef]
- Alshamsi, H.A.; Ali, S.K.; Altaa, S.H.A. Green Synthesis and Characterization of Reduced Graphene Oxide (RGO) using Sabdarriffa L extract and its Solubility Property. J. Phys. Conf. Ser. 2020, 1664, 012058. [Google Scholar] [CrossRef]
- Sontakke, A.D.; Purkait, M.K. A brief review on graphene oxide Nanoscrolls: Structure, Synthesis, characterization and scope of applications. Chem. Eng. J. 2021, 420, 129914. [Google Scholar] [CrossRef]
- Santoso, S.P.; Angkawijaya, A.E.; Bundjaja, V.; Kurniawan, A.; Yuliana, M.; Hsieh, C.-W.; Go, A.W.; Cheng, K.-C.; Soetaredjo, F.E.; Ismadji, S. Investigation of the influence of crosslinking activation methods on the physicochemical and Cu(II) adsorption characteristics of cellulose hydrogels. J. Environ. Chem. Eng. 2022, 10, 106971. [Google Scholar] [CrossRef]
Publisher’s Note: MDPI stays neutral with regard to jurisdictional claims in published maps and institutional affiliations. |
© 2022 by the authors. Licensee MDPI, Basel, Switzerland. This article is an open access article distributed under the terms and conditions of the Creative Commons Attribution (CC BY) license (https://creativecommons.org/licenses/by/4.0/).