Article

COVID Crisis and Tourism Sustainability: An Insightful Bibliometric Analysis

1
Institute of Tourism and Hotel Management (ITHM), Bundelkhand University, Jhansi 284128, India
2
Faculty of Arts & Humanities, CEGOT—Geography and Spatial Planning Research Centre, University of Coimbra, 3004-530 Coimbra, Portugal
3
College of Vocational Studies, University of Delhi, New Delhi 110017, India
4
Department of Tourism and Travel Management, Central University of Jammu, Jammu 181143, India
*
Author to whom correspondence should be addressed.
Sustainability 2022, 14(19), 12151; https://doi.org/10.3390/su141912151
Submission received: 19 August 2022 / Revised: 2 September 2022 / Accepted: 23 September 2022 / Published: 26 September 2022
(This article belongs to the Special Issue Tourism in Times of Crisis—Is There a Sustainable Future?)

Abstract

:
The pernicious impact of COVID-19 on all the aspects of travel and tourism has posed a question of tourism sustainability before policymakers and researchers. This research aims to cast light on the bibliometric construct and knowledge structure of the contemporaneous research that evolved around tourism sustainability amid COVID-19. Bibliometric methods of performance analysis and science mapping were used to analyze a total of 440 bibliographic records retrieved from the Scopus database. The major findings showed sustainability as a trending area of tourism research amid COVID-19 and revealed the concentration of research in three prime domains: Management and sustainable development of tourism, environmental health, and mobility trends in the context of COVID-19 pandemic. These areas may be perceived as the recent domains, and they are imperative for future research.

1. Introduction

The tragic explosion of COVID-19 has brought travel and tourism to an abrupt standstill and thereby challenged the sustainability of tourist destinations worldwide. A sudden halt in the mobility and, consequently, the disappearance of tourists’ activities worldwide has brutally affected the social, psychological, and economic well-being of tourists, local communities, organizations, and governments. Undoubtedly, tourism is among the most devastated sectors of the world economy during the pandemic [1,2,3,4]. COVID-19 has such a pernicious impact on the travel and tourism that the development of tourism in the twenty-first century will be studied in two phases: before COVID-19 and after COVID-19 [5].
The coronavirus epidemic has triggered many restrictions on international travel, confining tourism to proximity or local destinations [6,7,8,9]. This global pandemic is extensively recognized as a game-changer or a major challenge for the tourism sector [10] that has affected the sustainability of travel and tourism [2,4,11,12]. The term “tourism sustainability” refers to the situation wherein the tourism sector can sustain its positive impacts even in turbulent times and has the potential to smoothly recover from the negative impacts posed by major event crises [12]. The crises engendered by COVID-19 have crucial implications in terms of rethinking a sustainable future for tourism [13,14]. Moreover, the possibility of the more frequent occurrence of similar health crises in the near future challenges the sustainability of the tourism sector in the medium and long run [15]. Therefore, this is the time for taking lessons from the pandemic in order to rethink and reset the inept practices to build a more sustainable and resilient industry [16].
The intense effect of the coronavirus pandemic on all the levels of tourist activities and tourism businesses has presented researchers with novel challenges in terms of sustainable development [3,17,18,19], as the epidemic has worsened the already existing sustainability challenges in the route of tourism development [20,21,22]. For that reason, COVID-19 can be perceived as a sustainability challenge for the tourism industry [19]. In essence, “true sustainability will only occur when it is valued as a part of the taken-for-granted daily life of individuals and cultures across the globe” [23] (p. 567).
Along these lines, the coronavirus pandemic can be envisaged as a major event crisis for the tourism industry that has posed a question of tourism sustainability before policymakers and contemporary researchers. That said, the present paper aims to decipher and map the scientific literature and evolutionary nuances in the area of COVID-19 and tourism sustainability by applying bibliometric techniques. The key objectives of the present study are [1] to examine the research trends of the underlying field; [2] to determine the scientific productions by authors, institutions, and counties; [3] to analyze the dissemination of scientific production by sources; [4] to classify and examine the content of publications based on keywords; [5] to analyze publications based on citations; and [6] to discover the conceptual, social, and intellectual structure of knowledge evolved in the area of tourism sustainability amid COVID-19.

2. Research Methodology

With the main goal of expanding knowledge, reviewing, appraising, and analyzing the recent scientific literature published on tourism sustainability amid COVID-19, the present study was carried out with the help of bibliographic data collected from the Scopus database. The methodology is based on four steps: research planning, data collection, data analysis with the help of bibliometrics, and dissemination of results. Bibliometrics, which includes a set of statistical and mathematical techniques, has been applied to the identified records [24] to summarize the bibliographic data and decipher the intellectual construct by analyzing the structural and social relationship between various research constituents, such as keywords, authors, nations, and institutions [25]. The two categories of analysis manifested across this study are performance analysis and science mapping.
(1) Performance analysis was conducted with the view to determine the contribution of different authors, sources, documents, and institutions to the research field [26]. These research constituents were examined through different metrics, such as the h-index, the g-index, the m-index, Bradford’s law, and Lotka’s law, to measure and comprehend the trajectories of the research field.
(2) Science mapping was carried out to discover the relationships between research constituents including keywords, authors, institutions, and countries [27]. Bibliometric methods, such as co-citation analysis, co-authorship analysis, co-word analysis, and Multiple Correspondence Analysis (MCA), were utilized for the purpose of science mapping. A blend of these methods with network analysis helps to derive the bibliometric structure of the research field [28]. To discover the knowledge structure of the research field, the conceptual, social, and intellectual structures were analyzed across the identified bibliographic records.
Consequently, the key research questions that the present study intends to answer are as follows: (1) Which are the main authors, publications, sources, and keywords in the research field? (2) What is the performance and influence of different sources and scientific productions in the research field? (3) What is the pattern of collaboration between different authors, institutions, and countries in the scientific community? (4) What are the emerging trends and themes in the field of research? (5) What is the knowledge structure of the given research field?

2.1. Data Collection and Search Strategy

The data for the present study were obtained from the Scopus database since it covers a larger number of tourism journals [29]. The suggestion of Donthu et al. [25] that bibliometric data should be collected from one appropriate database to alleviate human error in consolidation was followed. The process of data collection began with the identification of a search strategy, including the combination of keywords, sources, time span, and subject area of the bibliographic records. The search strategy was designed and agreed upon by all the authors unanimously to effectively retrieve the bibliographic records [30].
The search query on the database was performed on 23 November 2021. The query initiated with the term “COVID and Tourism” searched in all fields of the records in the database. It resulted in a total of 10,767 records. Moreover, the query for the term “COVID and tourism and sustainability” resulted in 5150 documents. To refine the results, the authors decided to enter the search query by using the advanced search option available in the Scopus database. The search query was entered with the help of Boolean operators. while documents’ “title, Abstract, keywords” was selected as a field option to retrieve the most relevant records from the database. The proliferation of abstracts in the Scopus database allowed us to search for all relevant results across the title, abstract, and keywords [31]. The exact query entered in the advance search was as follows: TITLE-ABS-KEY ((COVID OR corona OR pandemic) AND (tourism OR destination OR travel OR tourist) AND (sustainab*)). This query resulted in a total of 614 documents. Before performing the keyword search in the database, researchers cooperatively decided on a combination of keywords that occur most frequently in the existing studies and are also likely to be general and common in all the documents [32].
To further refine the results for greater precision, the source type was limited to journal articles. This choice was dictated by the fact that the scientific literature available in journal articles is immensely representative of tourism knowledge [29]. In addition, the subject area of the records was limited to Social Sciences; Environmental Science; Business, Management and Accounting; Energy; Economics, Econometrics, and Finance; Arts and Humanities; and Multidisciplinary because these subject areas are most likely to contain scholarly work on tourism sustainability. The years of publication were defined from 2019 to 2021, and English was selected as the language of the records. This search strategy eventually led to the identification of 440 documents that were used for analysis in the present study.

2.2. Data Analysis and Network Visualization

This research has used the Biblioshiny version of the statistical R package to analyze the bibliographic records retrieved from the Scopus database. Bibliometric indicators such as analysis of authors, sources, citations, keywords, collaboration index, annual productivity, and publication growth were utilized, along with descriptive statistics to summarize the bibliographic data. Furthermore, the bibliometric techniques of factor analysis and visualizations were used to analyze the conceptual, intellectual, and social structure of the knowledge [33], wherein Multiple Correspondence Analysis (MCA), co-word analysis, co-citation networks, and collaboration networks of authors, institutions, and countries were employed. The application and interpretation of some of these techniques of performance appraisal and science mapping were followed [25].
Another software selected for producing a visualization of the networks in the present study is VOSviewer (version 1.6.17). VOSviewer is efficacious in exhibiting large bibliometric maps which can be easily interpreted [34]. Bibliographic mapping allows us to procure a comprehensive picture of the bibliographic networks [35]. The networks were used to probe different research constituents, such as authors, articles, keywords, journals, organizations, and countries. In network visualization, each node indicates an item or unit of analysis (e.g., author, keyword, journal, etc.), whereas the size of the node represents the occurrence or weight of the item in the network, and each color denotes a cluster, wherein nodes and links are representative of the relationship between the items manifested under a given cluster [25]. The link between the nodes specifies the co-occurrence of the item, while the thickness of the link reflects the strength of the connection between the items, and the distance between the nodes represents the related degree [33].

3. Results

3.1. Data Summary

Indexed in the Scopus database, a total of 440 records retrieved after applying the search criteria were published between 2019 to 2021. Accordingly, the rate of average annual scientific production was 146.67. Corresponding to the underlying search strategy, only one article (0.23%) was published in 2019. It is because of the obvious reason that the coronavirus pandemic broke out in December 2019 (see Reference [36]), when scholars began to look for COVID-19-related research possibilities in their domains, and it always takes a significant time to write and publish an article. The number of scientific productions became regular and grew substantially in the subsequent years. It was possible to observe a total of 107 publications (24.32%) in 2020 and 332 publications (75.45%) in 2021, representing a growth rate of 210.28%. It provides an insight that the area of COVID-19 and tourism sustainability research is a growing subject, with more scientific productions projected in the forthcoming years.
Figure 1 represents the classification of 440 publications according to the chosen categories of the subject area in the Scopus database. The category Social Sciences, with 351 documents (79.77%), has the highest number of publications, followed by Environmental Science, with 208 documents (47.27%); Business, Management, and Accounting, with 160 documents (36.36%); Energy, with 138 documents (31.36%); Economics, Econometrics, and Finance, with 31 documents (7.05%); “Arts and Humanities” with 16 documents (3.64% of 440), and “Multidisciplinary” with 6 documents (1.36%). It implies that Social Sciences; Environmental Science; and Business, Management and Accounting are the prime subject area categories for the given area of research.

3.2. Authors’ Productivity and Lotka’s

The 440 documents retrieved from the Scopus database were authored by a total of 1351 authors while a total number of author appearances were recorded at 1437. It indicates that on average, there are 0.33 documents per author, 3.07 authors per document, and 3.27 co-authors per document. Like the data in a number of studies in in other disciplines, our data also depict that the number of multi-authored articles exceeded the single-authored ones (see Reference [37], p. 157). Out of 440 documents, 71 (16.14%) were single-authored, and the remaining 369 (83.86%) were multi-authored documents. It helps in the identification of 1280 authors in 369 publications, resulting in a collaboration index of 3.47 [38,39].
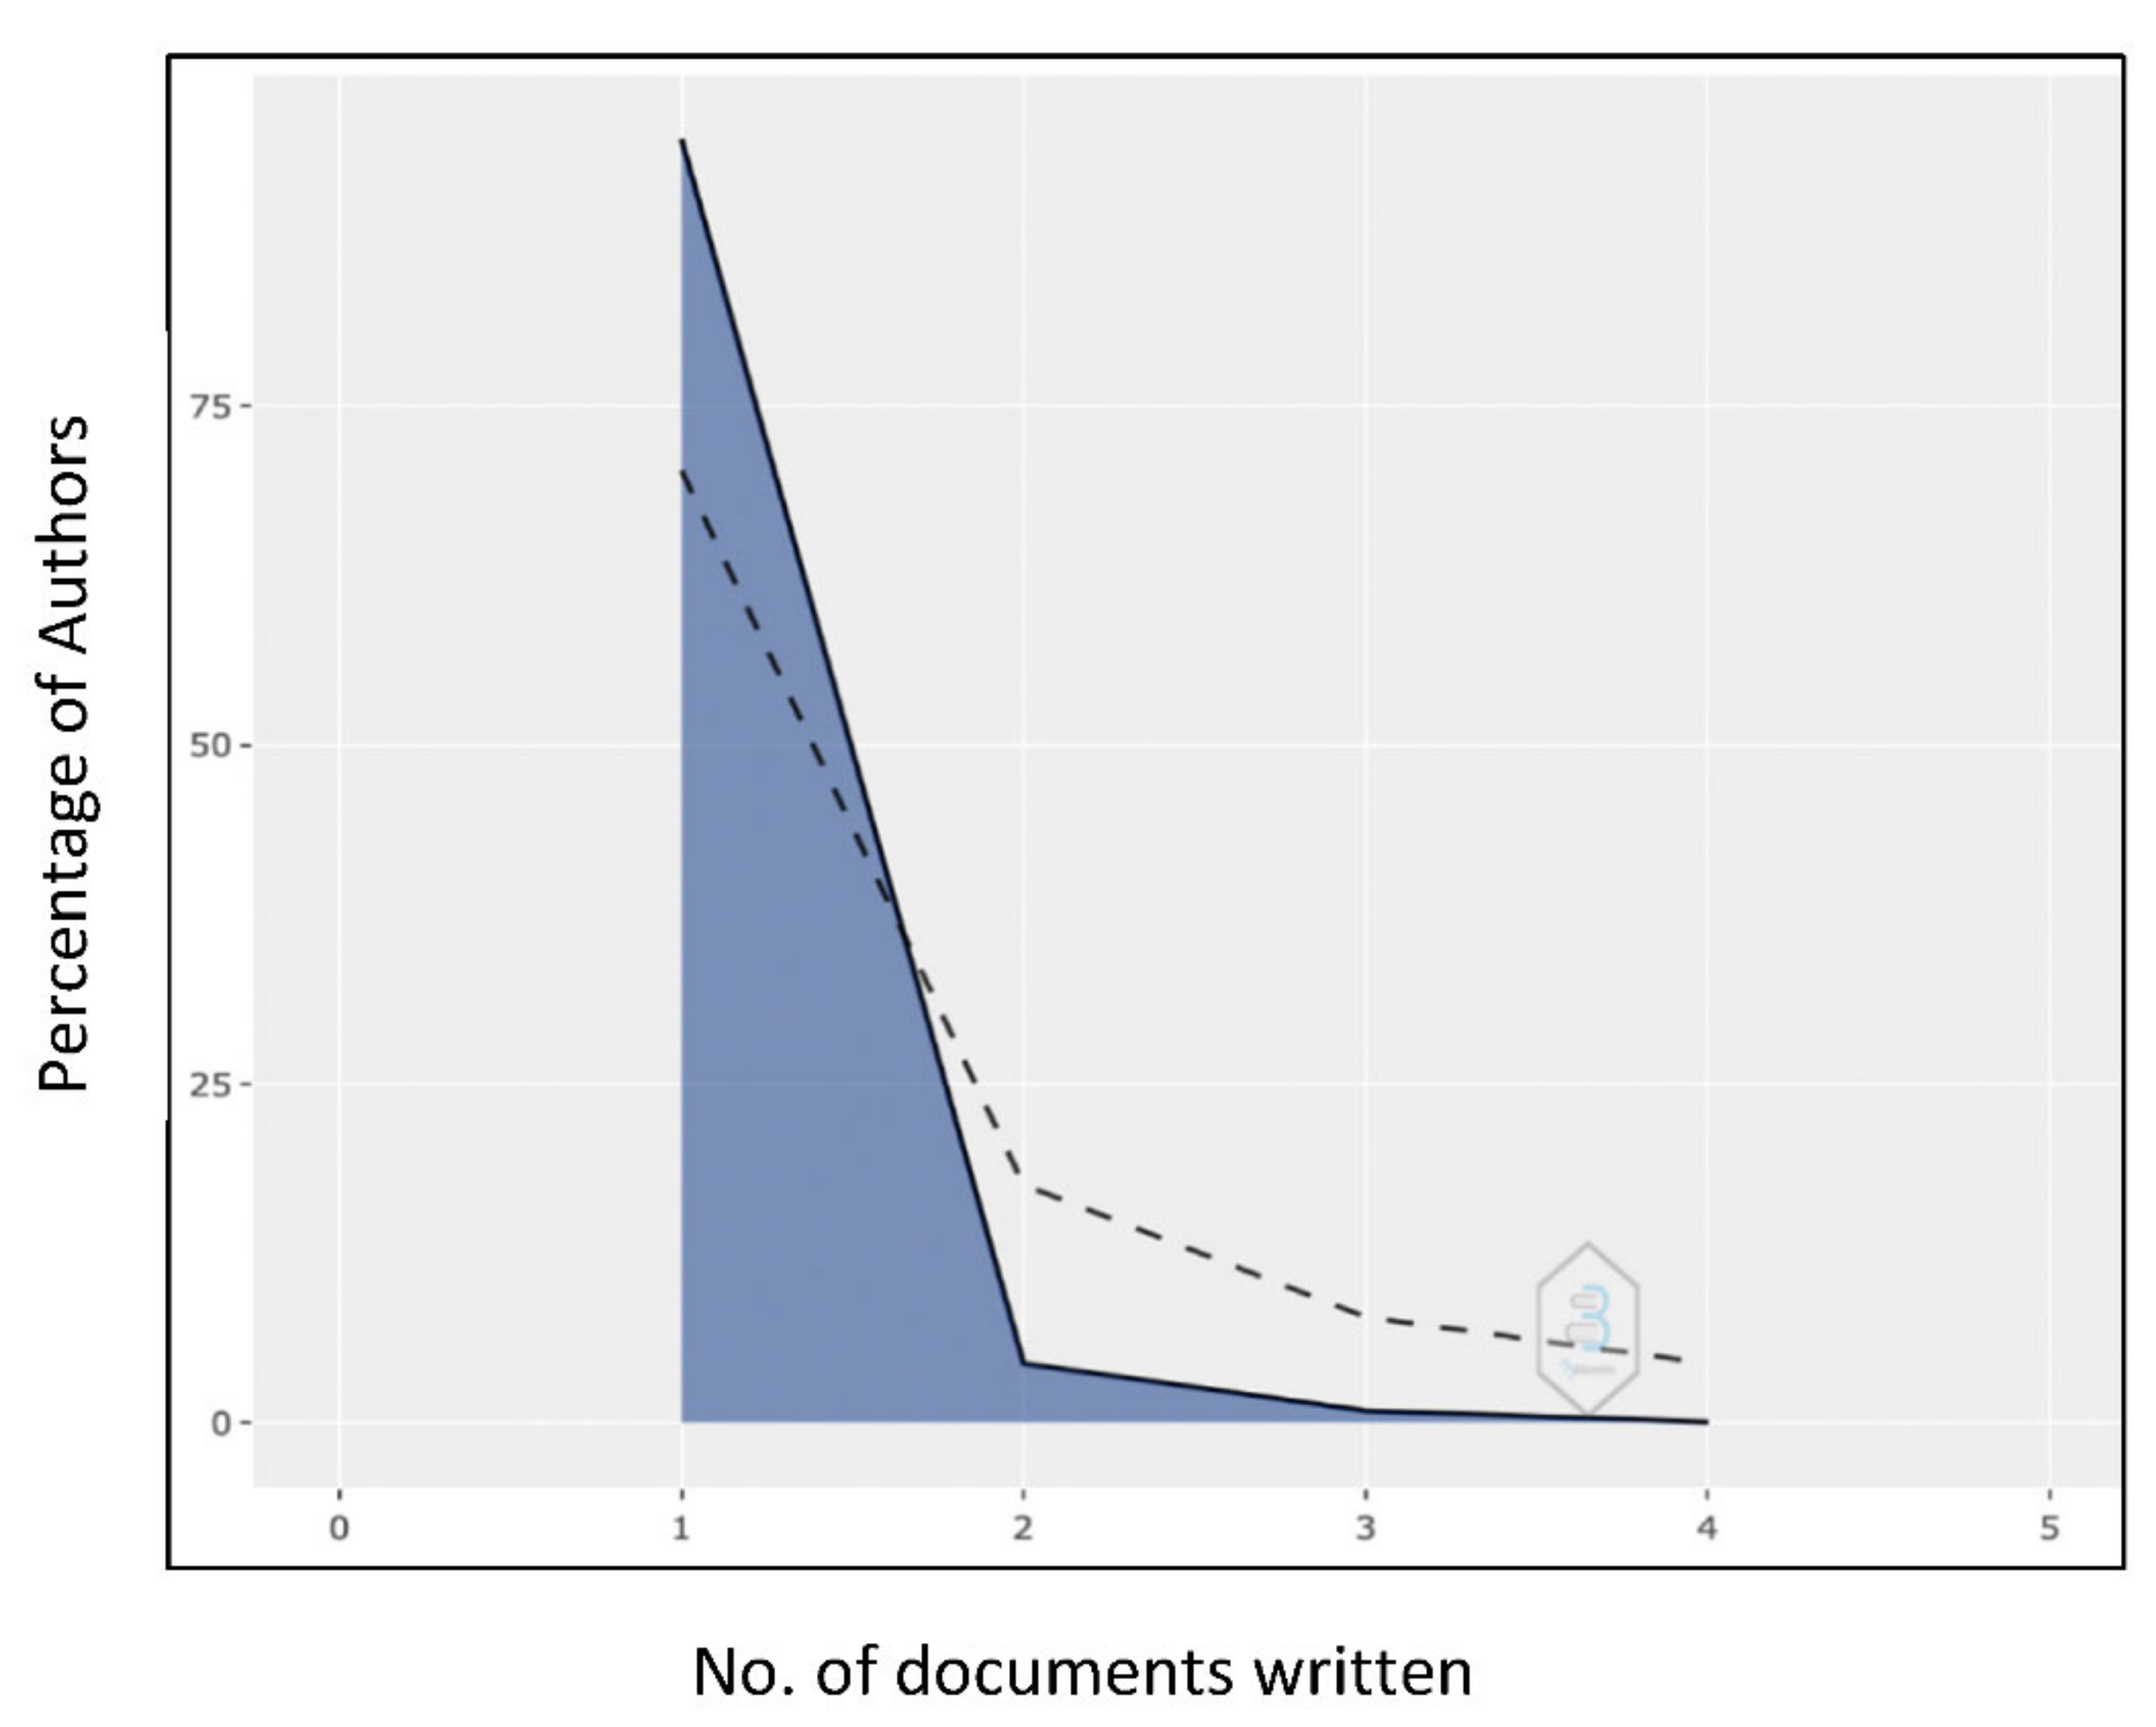
Lotka’s Law [40], reflected in Figure 2, was used to analyze authors’ productivity. The Inverse Square Law (x/n2) of scientific productivity proposed by Alfred J. Lotka in 1926 correlates the contributors of scientific productions to their number of contributions [41,42]. We found that 1279 authors (94.7%) contributed merely with one document, 59 authors (4.4%) contributed with two documents, 12 authors (0.9%) contributed with three documents, and only 1 author (0.1%) contributed four documents. It reveals that Lotka’s law in its primary form does not apply to the bibliographic data retrieved for the present study. The only author who has published four documents [43,44,45,46] is Prof. Joseph M. Cheer of Wakayama University, Japan. Whereas, Prof. Colin Michael Hall of the University of Canterbury, New Zealand, is the top-notch author in terms of total citations count. In Table 1, we can observe the impact of the top-10 authors. These authors are sequenced in descending order of their total citations, as the citation analysis evaluates the performance of an author and his/her contribution to the field of research [47].

3.3. Sources’ Productivity and Bradford’s Law

The aforesaid 440 documents were published in 180 distinct journals. Of these journals, 135 (75%) published only one document, 20 journals (11.11%) published only two documents, 9 journals (5%) published only three documents, and 16 journals (8.89%) published four or more documents. These 16 journals can be regarded as journals of tourism sustainability.
Bradford’s Law [48] was employed to explore the publication of documents across different journals [42]. Bradford’s law is a law of diminishing returns and scattering [49] which assumes that the number of journals in the intermediate and smaller zone will be n and n2 times larger than the core zone, respectively [50]. As illustrated in Figure 3, it was possible to substantiate the existence of these three zones. The nucleus or core zone comprises three journals, namely Sustainability, Journal of Sustainable Tourism, and Tourism Geographies, which published a total of 154 documents (35%). The three journals in the nucleus account for 1481 citations, representing 49.61% of total citations. Meanwhile, there are 37 journals in the intermediate zone and 140 journals in the smaller zone that were found to publish 141 documents (32.04%) and 145 documents (32.96%), respectively. Table 2 presents the impact of the sources by h-index. These sources are sequenced in the descending order of their h-index because “…h-index is a better citation-based metric for evaluating the quality and contribution of scholarly journals than other metrics such as the impact factor (IF) or the cites per paper (CPP)” [51] (p. 240).

3.4. Keywords’ Analysis and Zipf’s Law

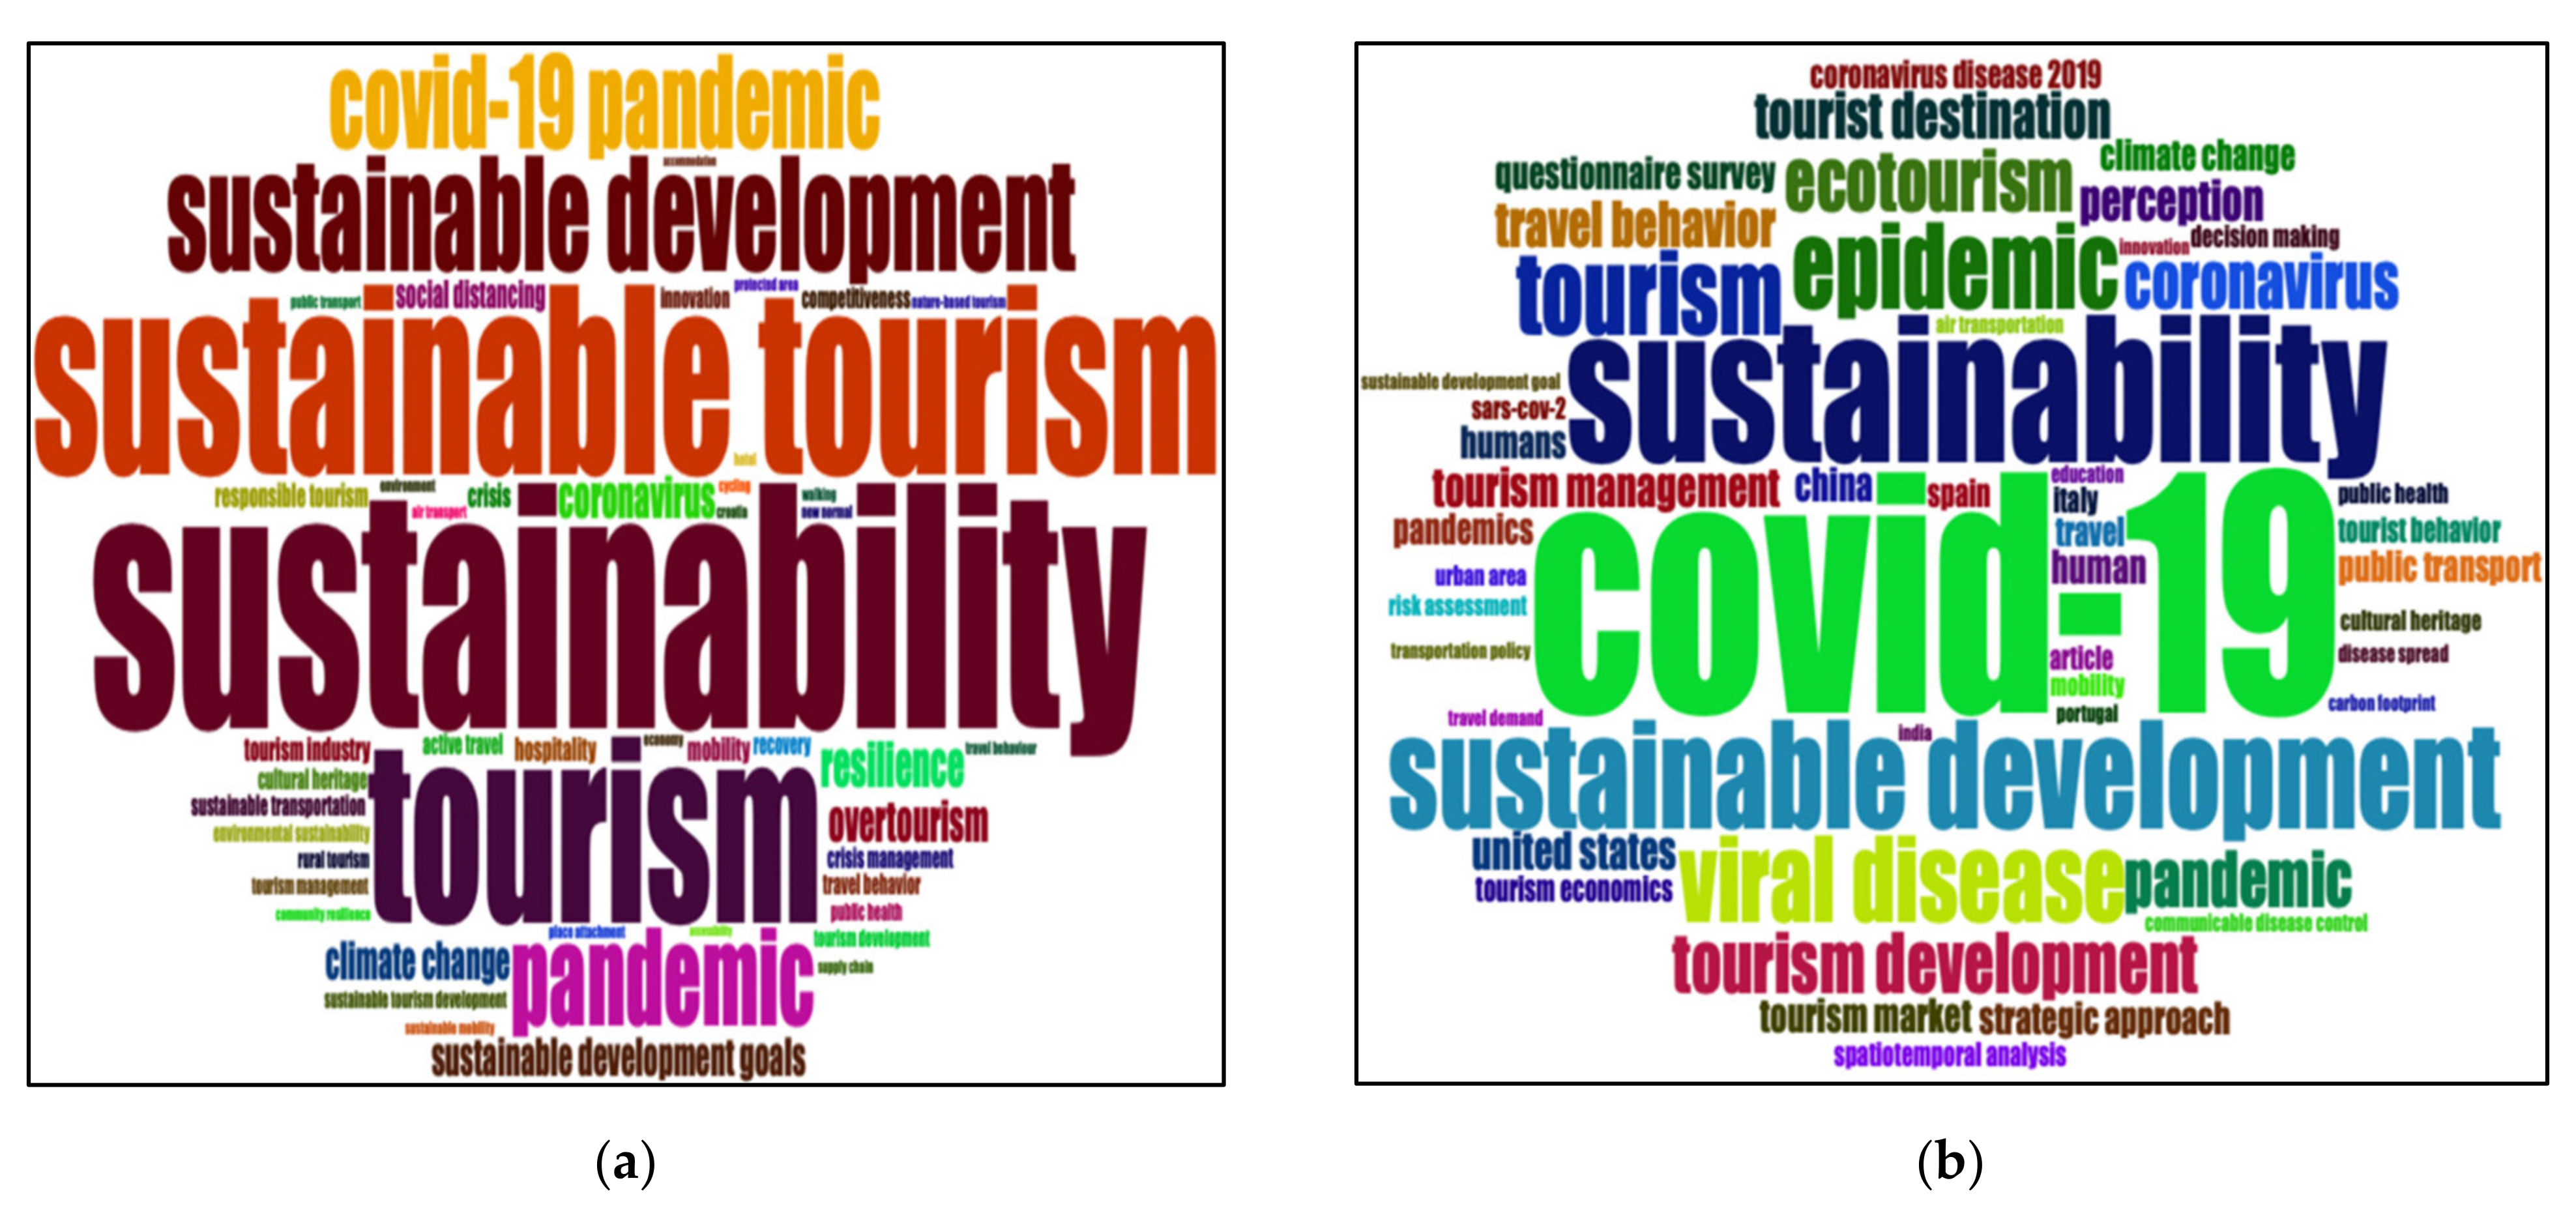
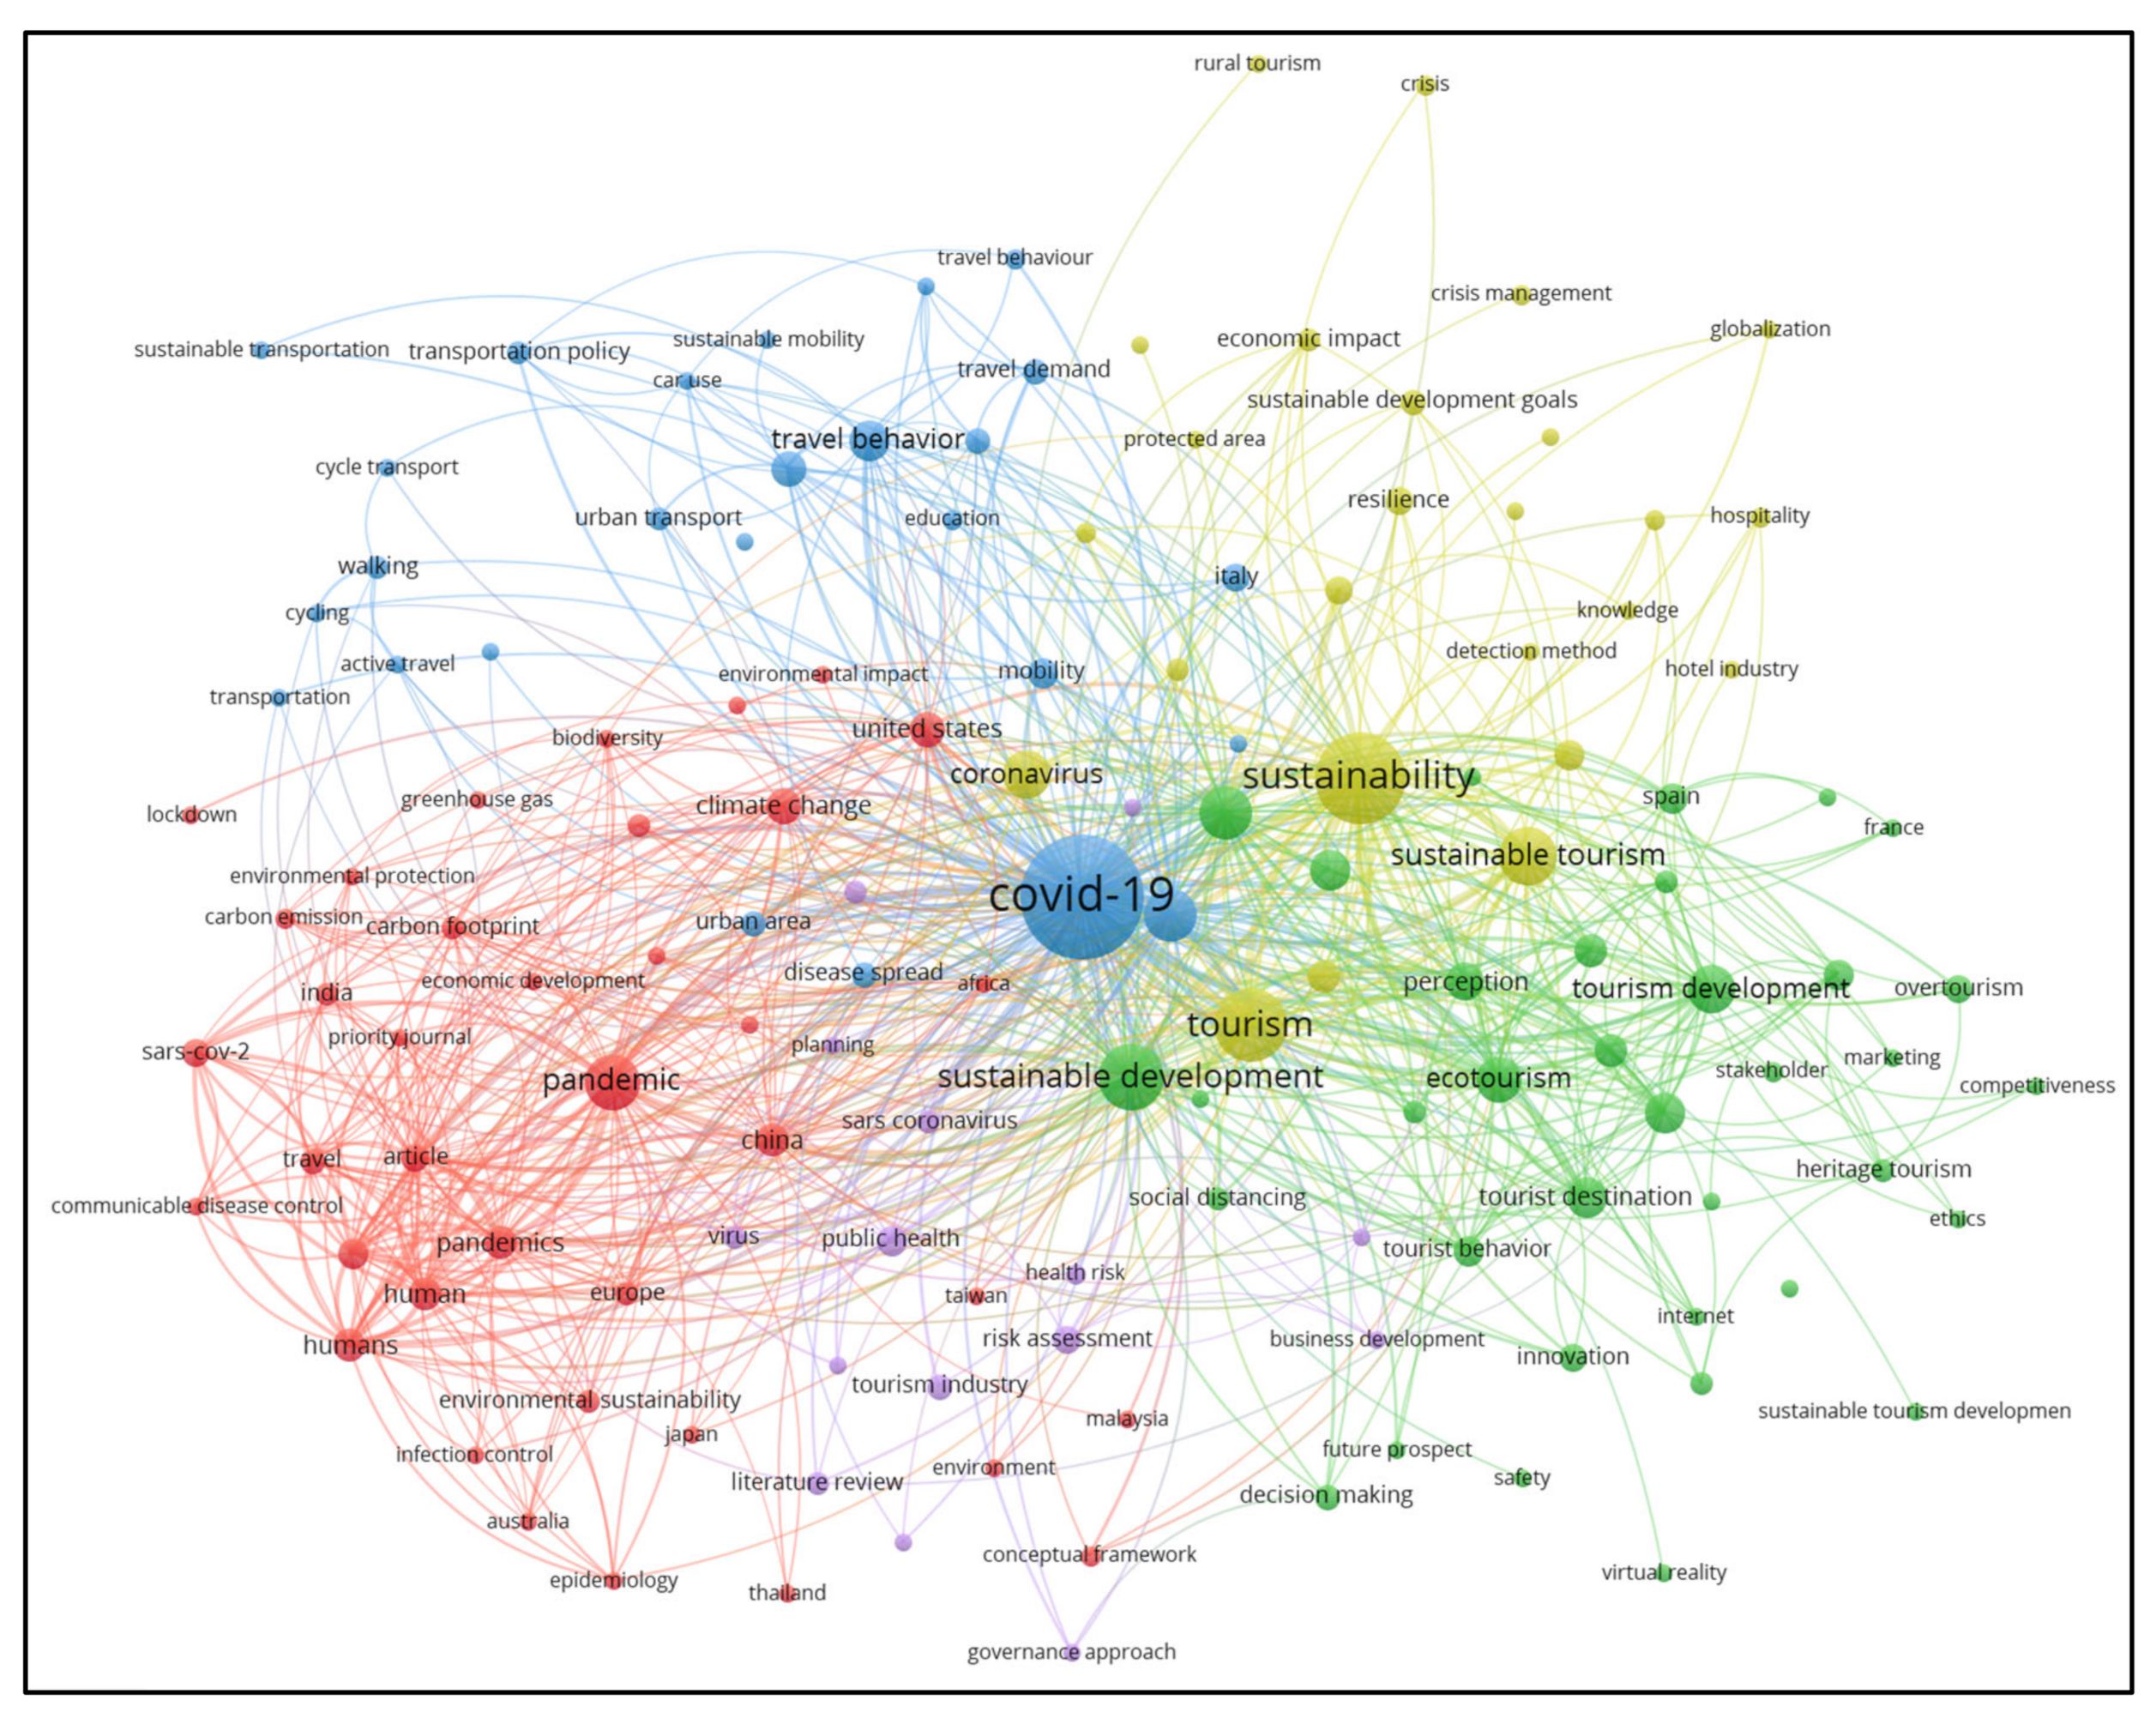
The 440 documents were assigned by 1640 authors’ keywords (DE) and 1321 keywords plus (ID). Authors’ keywords are provided by authors themselves, while keywords plus are the words that pop up frequently in titles of article’s references and are generated through an automatic computer algorithm [52]. Keywords are commonly used in bibliometric studies to effectively analyze the documents’ content, trend topics, and research hotspots of a given field [53]. The keyword “COVID-19” was the pinnacle, with 179 authors’ keywords (DE) occurrences and 131 keywords plus (ID) occurrences, followed by the keywords “sustainability” (70 DE and 80 ID), “sustainable tourism” (54 DE), and “sustainable development” (59 ID). Other frequently occurring keywords include “ecotourism”, “travel behavior”, “perception”, “strategic approach”, “climate change”, “carbon footprint”, “public transport”, “resilience”, “overtourism”, “sustainable development goals (SDGs)”, “new normal”, “competitiveness”, “responsible tourism”, and “active travel”. Figure 4 displays the word clouds of the top 50 authors’ keywords and keywords plus to swiftly scrutinize and compare the prominent terms in the field of tourism sustainability research amid COVID-19. A network of keywords shown in Figure 5 classifies the keywords into five different clusters. Cluster-wise dominant keywords are “COVID-19” (blue cluster), “sustainability” (yellow cluster), “sustainable development” (green cluster), “pandemic” (red cluster), and “public health” (purple cluster). The network also signifies that competitiveness, safety, innovations, sustainable mobility, crises management, governance approach, sustainable development goals (SDGs), carbon footprints, environmental protection, overtourism, virtual reality, and sustainable tourism development are some of the prominent areas where research opportunities are arising.
Zipf’s Law [54] of word occurrence was applied to check the frequency distribution of the most prominent keywords [55]. According to Zipf’s Law, if keywords are ranked in the decreasing order of their frequency, where “r” is the rank of keyword and “f” is its frequency, then the product of “r” and “f” equals a constant [56]. The frequency distribution of the top 15 authors’ keywords and keywords plus (see Table 3) reveals that Zipf’s law in its original form (r*f = c) is not applicable in current bibliographic records.

3.5. Citation Analysis

Citation analysis is one of the most frequently used methods of bibliometric analysis which helps in assaying the impact and quality of authors, sources, and documents based on their citation count [57,58]. A total of 2985 citations were received by the journals (n = 180) of identified documents (n = 440). Accordingly, the average number of citations per document is 6.784, and the average number of citations per journal is 16.583. Considering the timespan of COVID-19 and tourism sustainability research, these citation counts are expected to increase in the upcoming years. Table 1 shows the top 10 authors according to total citations, Table 2 represents the total citations received by top sources according to the h-index, and Table 4 represents the top 10 articles based on total citations. The article in the current data set which recorded the highest number of citations was “Pandemics, transformations and tourism: be careful what you wish for” [59], with a total of 235 citations and an average of 78.33 citations per year. Four out of the top ten cited articles were published in the journal Tourism Geographies. The most cited articles are identified in the areas of transformative opportunities for sustainable tourism [59,60,61], mobility and resilience [62], innovation [63], circular economy [64], sustainable development goals [65], travel behavior [66], impact assessment [67], and environmental effects [68].

3.6. Countries and Institutions

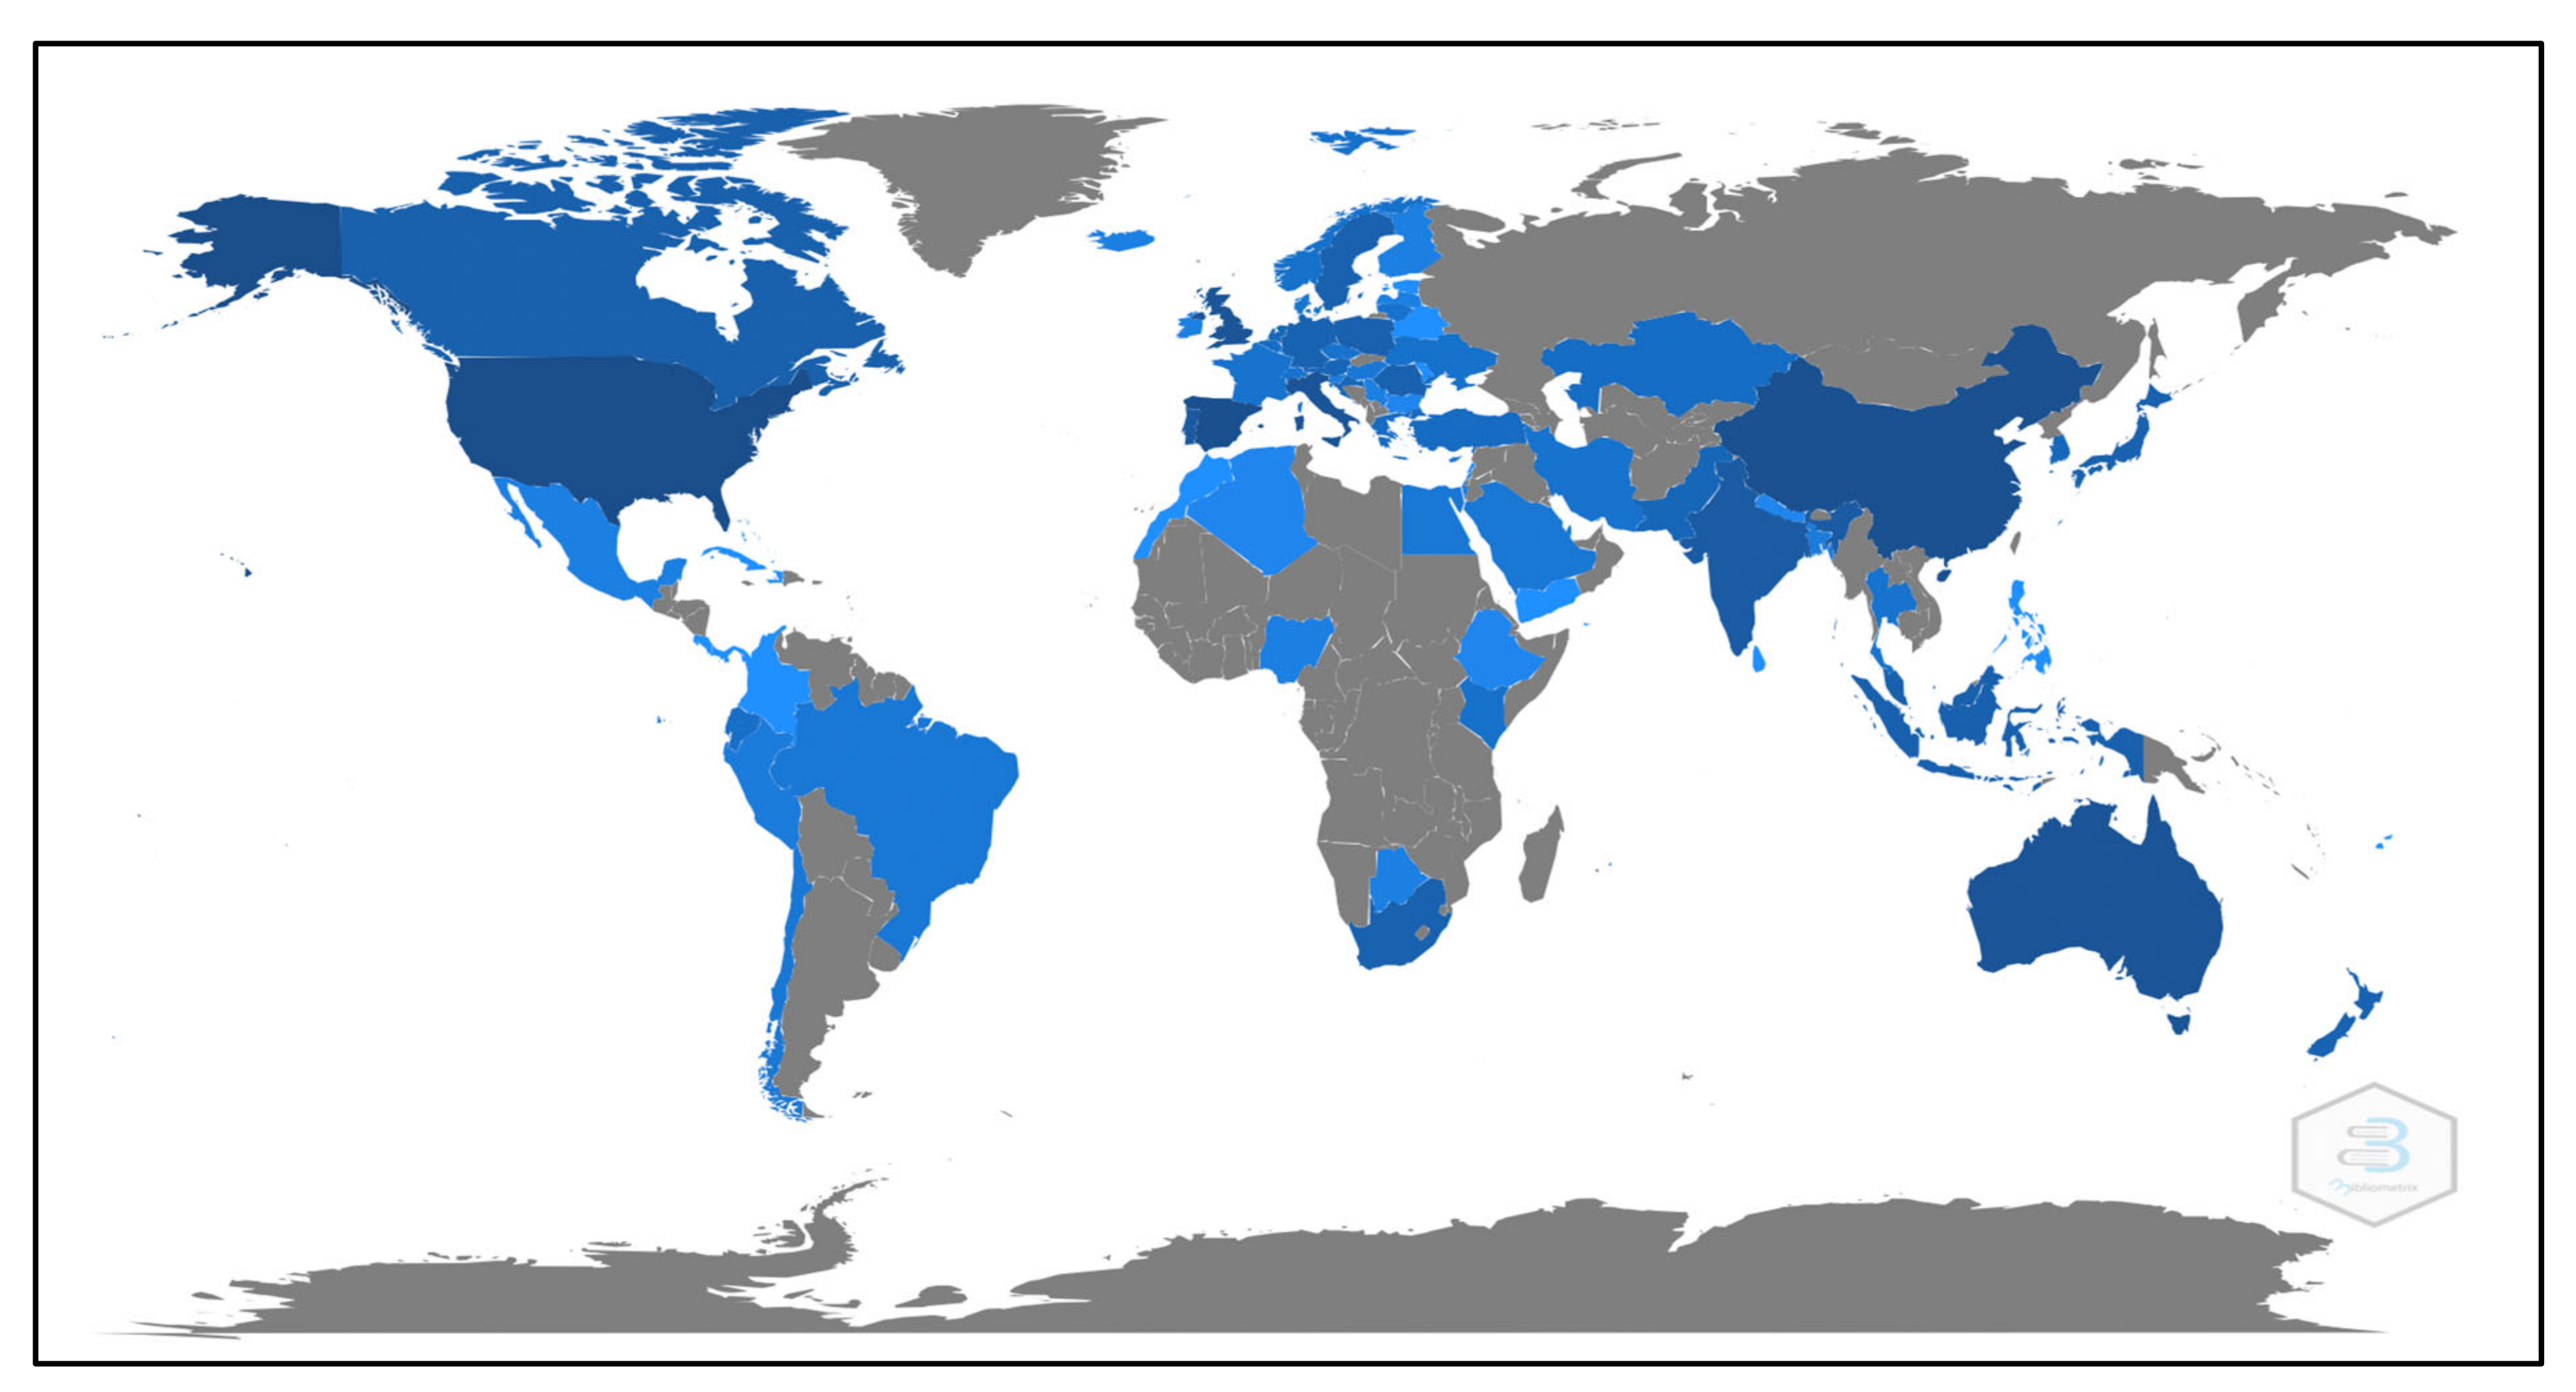
Based on the country of the corresponding author, the highest number of documents (n = 35) were published by the USA, followed by Spain (n = 31), Australia (n = 22), Italy (n = 22), UK (n = 21), China (n = 21), Poland (n = 11), Korea (n = 10), and Portugal (n = 10). Meanwhile, country-wise scientific production reflects that the USA occurred 105 times, Spain 92 times, China 82 times, Italy 63 times, Australia 62 times, UK 60 times, Portugal 44 times, India 37 times, Canada 26 times, and Malaysia 26 times in the identified records. A total of 81 nations were detected in 440 documents, with 61 countries having corresponding authors. Concerning citations, the USA received total citations (TCs) of 246 and average article citations (AAC) of 7.03, followed by the UK (TC = 244 and AAC = 11.62), Australia (TC = 227 and AAC = 10.32), Sweden (TC = 156 and AAC = 17.33), and Spain (TC = 152 and AAC = 4.903). Figure 6 represents the scientific productions by different countries on the world map. The deeper the color, the higher the country’s productivity.
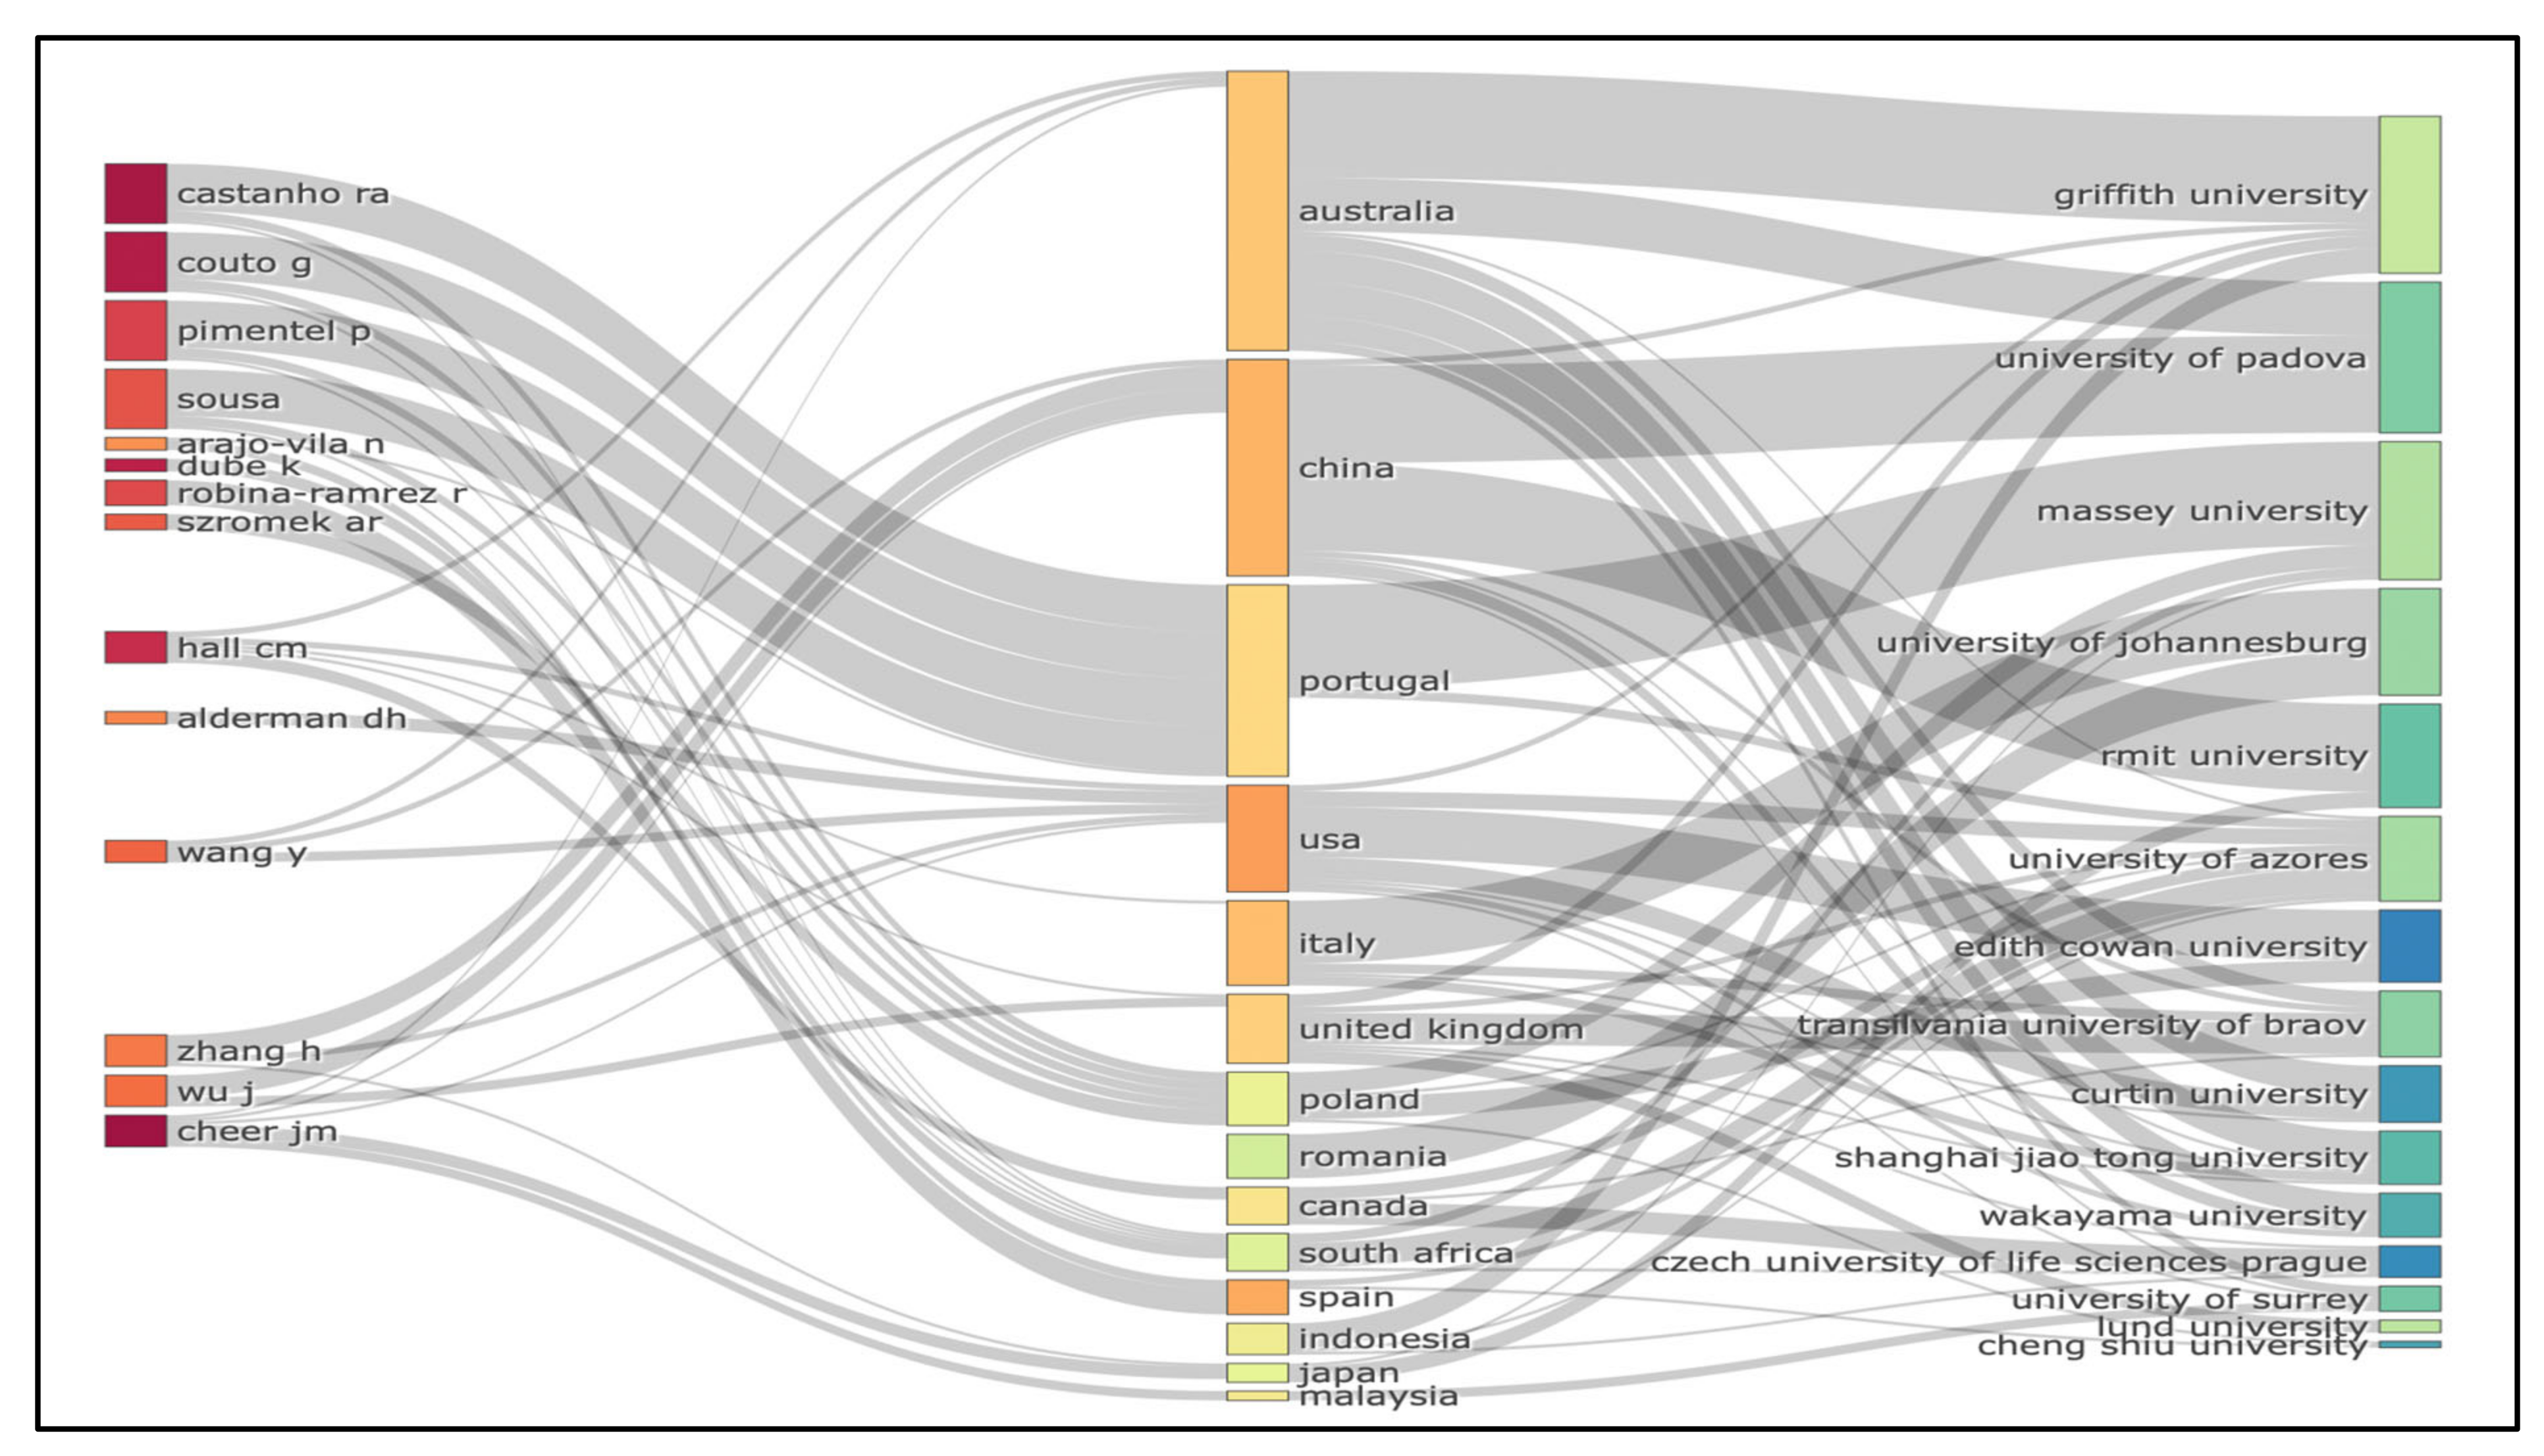
It was possible to observe a total of 793 institutions that produced the eligible 440 documents. Of these institutions, a maximum number of 11 documents were contributed by Griffith University. This was followed by Lund University, Massey University, University of Azores, and University of Johannesburg, which produced seven documents each. Meanwhile, the University of Brasov, University of Padova, and University of Surrey contributed six documents each. All other institutions produced five or fewer documents. Figure 7 presents a three-field plot of authors, countries, and institutions or affiliations.

3.7. Conceptual Structure of Knowledge

The conceptual structure of knowledge is analyzed to explore the key themes and trends that have been inquired and delineated in a given research field [69,70]. This analysis permits the scholars to highlight the relationships that exist between the terms that co-occur in the identified records [71]. To educate the research community about the conceptual structure of COVID-19 and tourism sustainability research, we applied two techniques: co-word analysis and Multiple Correspondence Analysis (MCA).
The VOSviewer technique of co-word analysis is used to uncover the most relevant concepts that co-occur in each document and are therefore conceptually related to each other [33]. The keyword trends depicted in Figure 5 were created by using co-occurrence of keywords through VOSviewer. It represents the five different clusters (red, green, blue, purple, and yellow) of keywords that generally co-occur and are subsequently related.
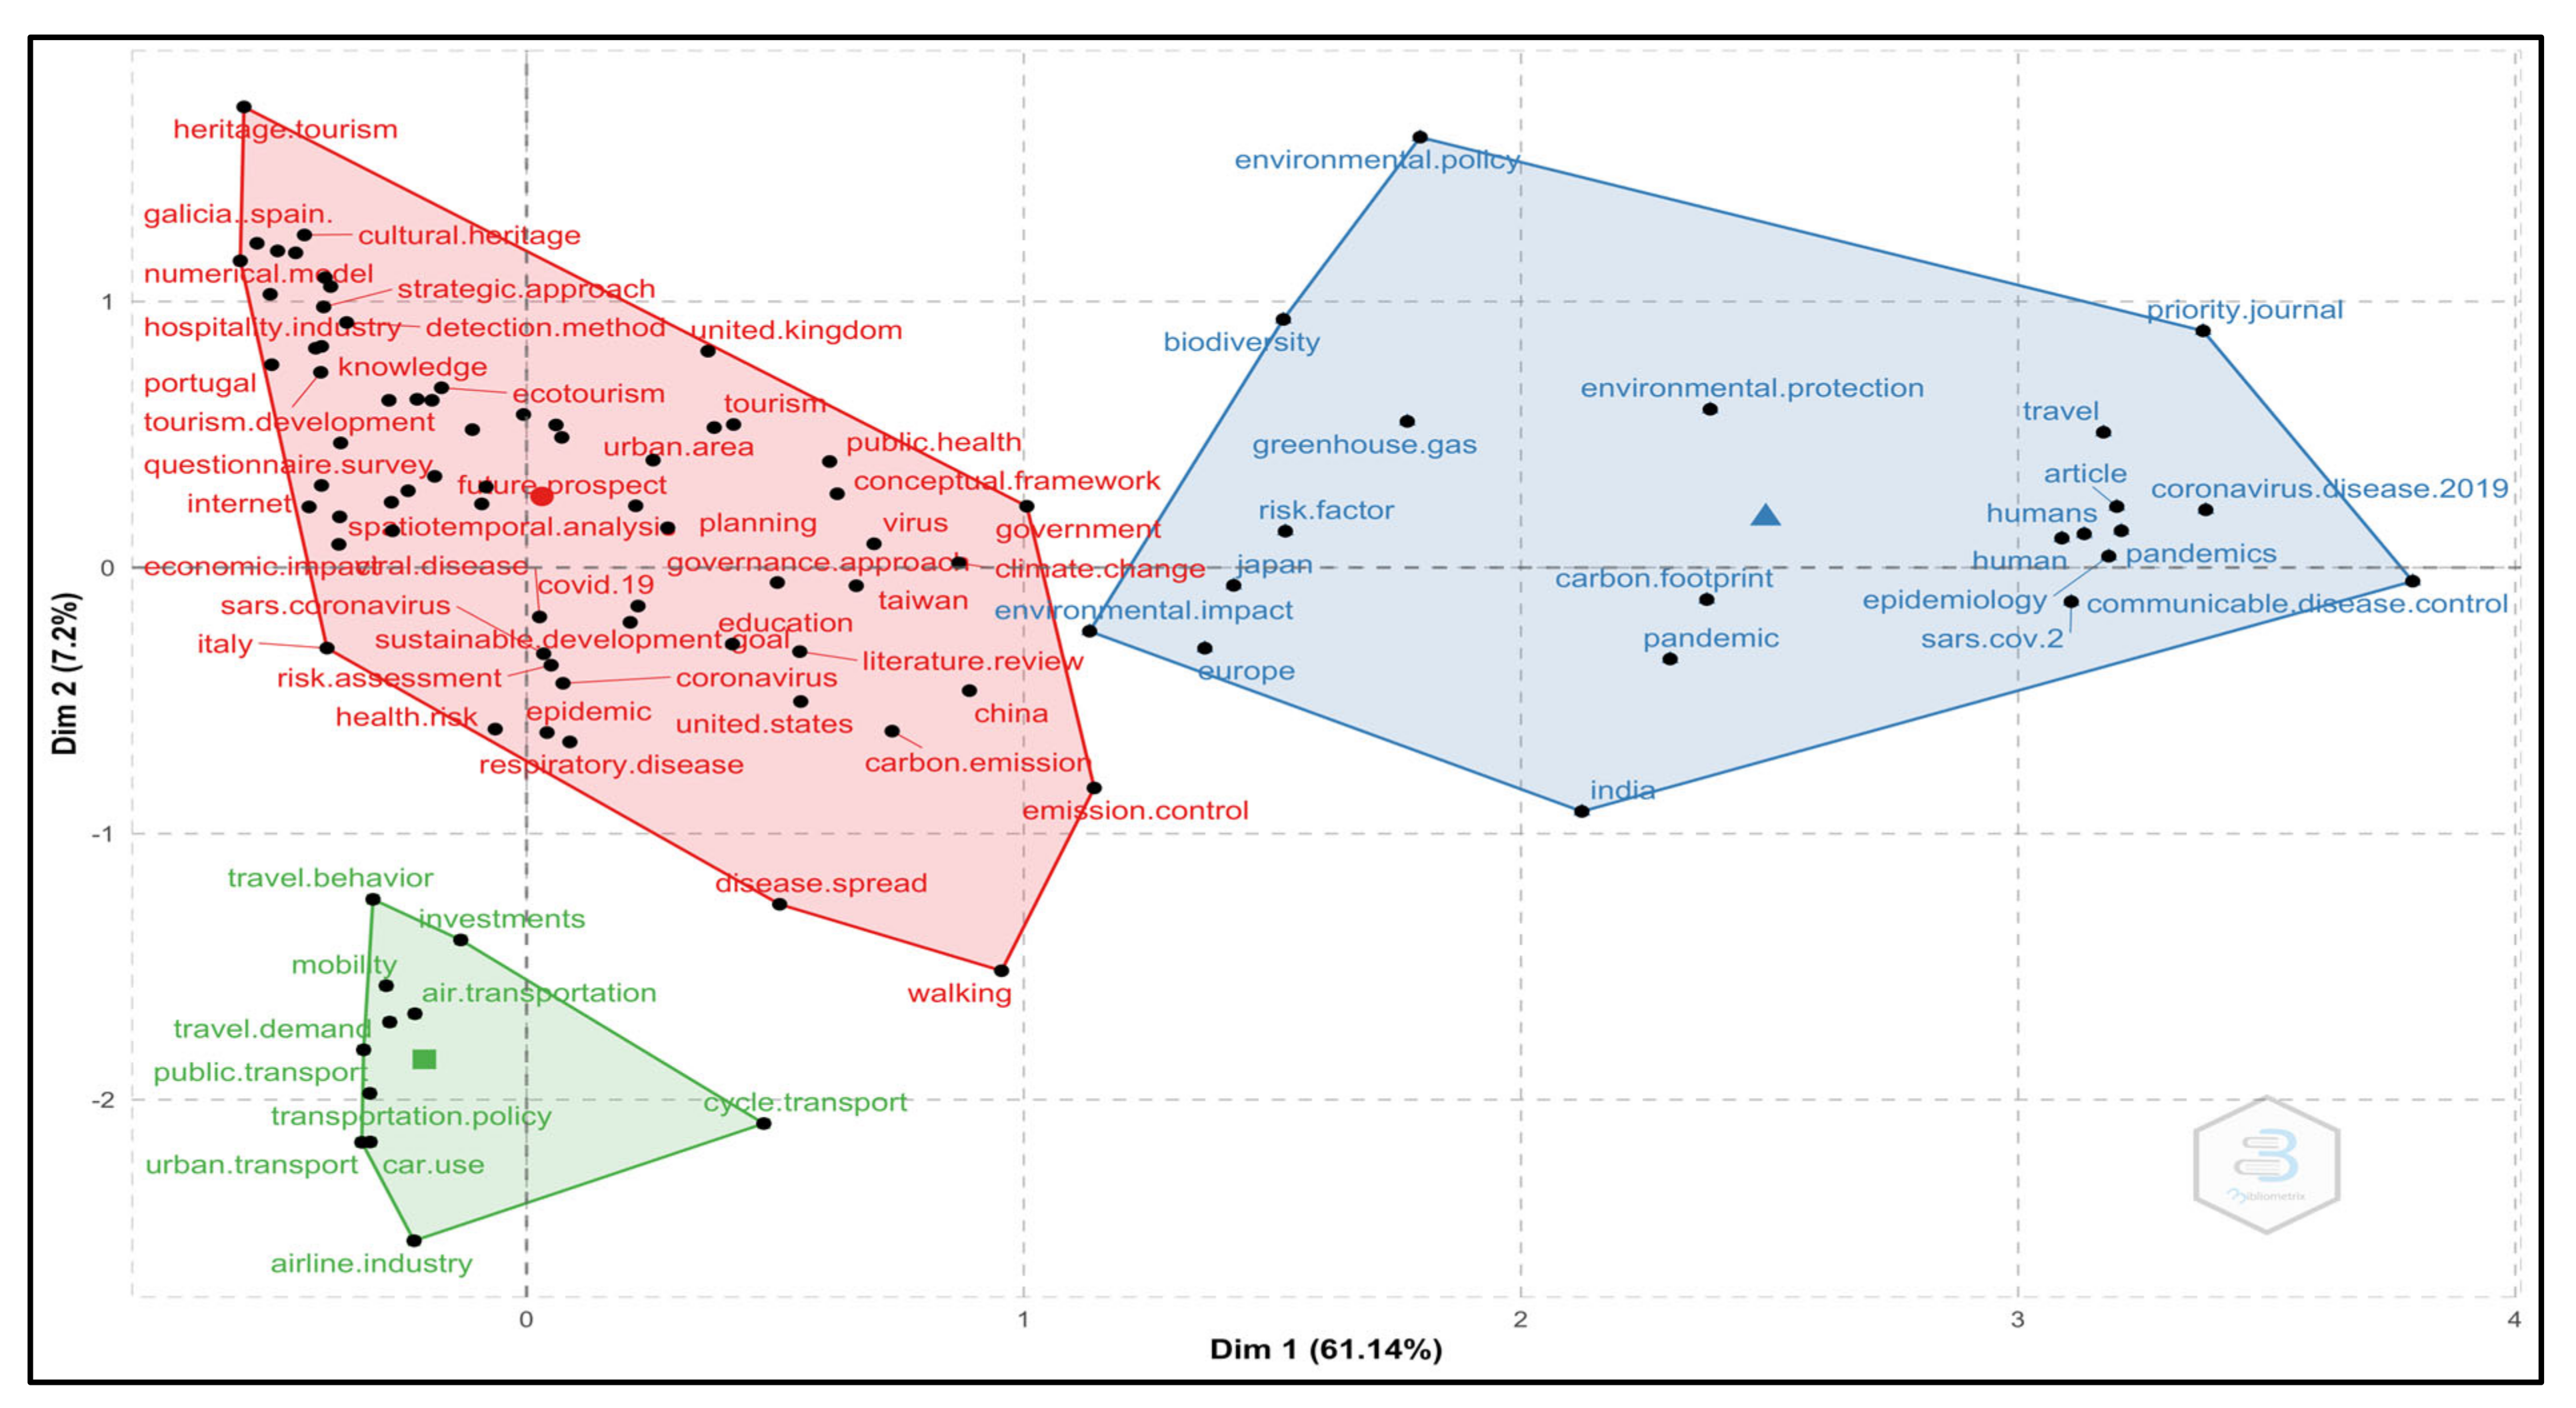
Multiple Correspondence Analysis, which is an extension of Correspondence Analysis (two-variable case), is used to represent the relationship between a set of categorical variables [72]. MCA is used to conduct the factor analysis of keywords to reduce the dimensionality of data [33]. The conceptual structure map derived through MCA is depicted in Figure 8. The map is divided into three clusters of keywords that are segregated by different colors. Each cluster represents a set of keywords that represents a particular theme. These clusters signify that the underlying keywords co-occur in the publications.
Cluster 1 (red cluster) covers a wide range of keywords, such as “COVID-19”, “risk assessment”, “public health”, “disease spread”, “governance approach”, “strategic approach”, “planning”, “sustainable development”, “emission control”, “sustainable development goals”, “spatiotemporal analysis”, etc. These terms are related to the management and sustainable development of tourism (for example, see References [60,62,63,65]). Cluster 2 (blue cluster) includes terms such as “environmental protection”, “biodiversity”, “greenhouse gas”, “carbon footprints”, “pandemic”, etc. These keywords are related to environmental health (for example, see References [68,73,74,75]). Cluster 3 (green cluster) presents terms such as “cycle transport”, “car use”, “transportation policy”, “public transport”, “travel behavior”, etc. These keywords are related to mobility trends (for example, see References [76,77,78,79]).

3.8. Intellectual Structure of Knowledge

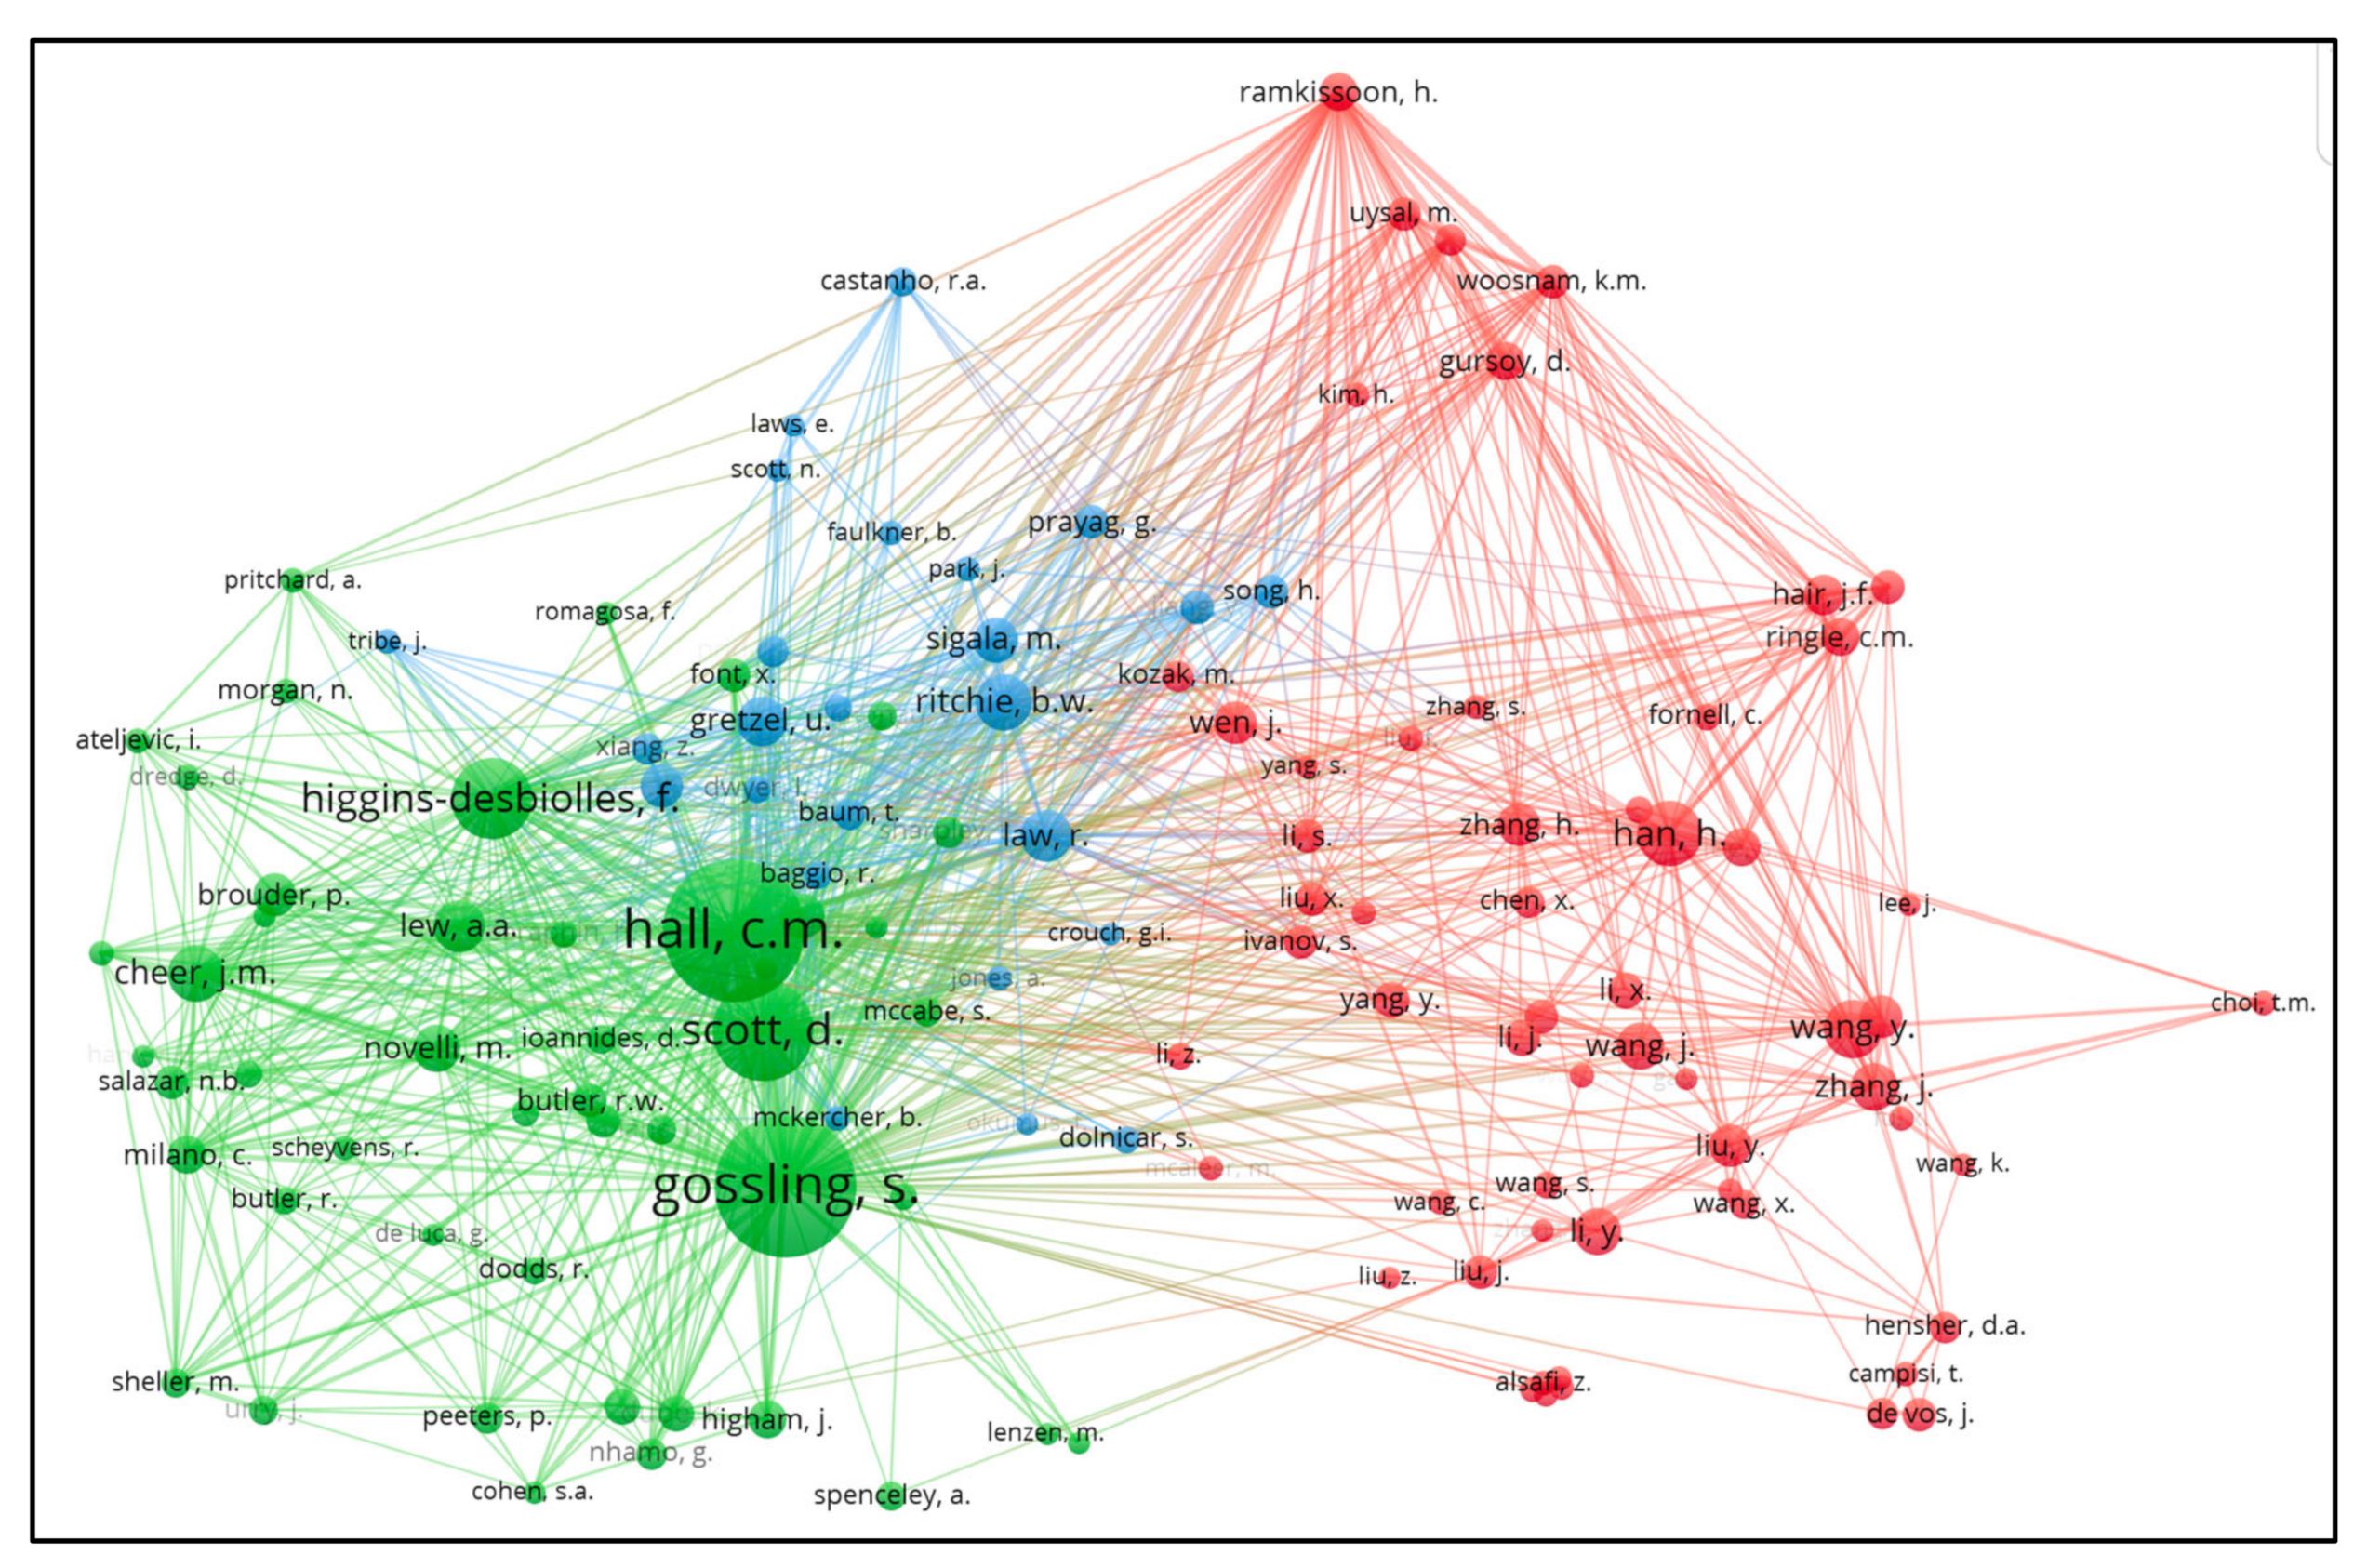
The intellectual structure of knowledge is assessed to determine the influence of authors’ work in the scientific community [70]. Co-citation analysis is the most widely used technique in bibliometrics to reveal intellectual linkages [79]. Co-citation analysis helps to identify the pairs of documents that are cited together in the third document [25]. It assumes that the publications which are often cited together are thematically similar [80] and thus concentrated in a cluster of visualization map [81]. The 440 documents analyzed in the present study have a total of 27,116 references. Figure 9 shows the three clusters of the relationship between the authors in bibliographic references. Based on total citations and academic linkages, the most prominent authors in Cluster 1 (red) include Han, H.; Wang, Y.; and Li, Y. Their documents were related to “travel trends amid COVID-19” (see References [82,83,84]). In Cluster 2 (green), Gossling, S.; Hall, C.M.; Scott, D.; Higgins-Desbiolles, F.; Cheer, J.M.; and Higham, J., are among the most prolific authors. Their documents are related to “transformative opportunities for sustainability” (see References [13,43,59,85]). In Cluster 3 (Blue), Sigala, M.; Dolnicar, S.; and Xiang, Z., are among the key authors. These documents are related to “COVID-19 impacts and tourism response” (see References [16,86,87]).
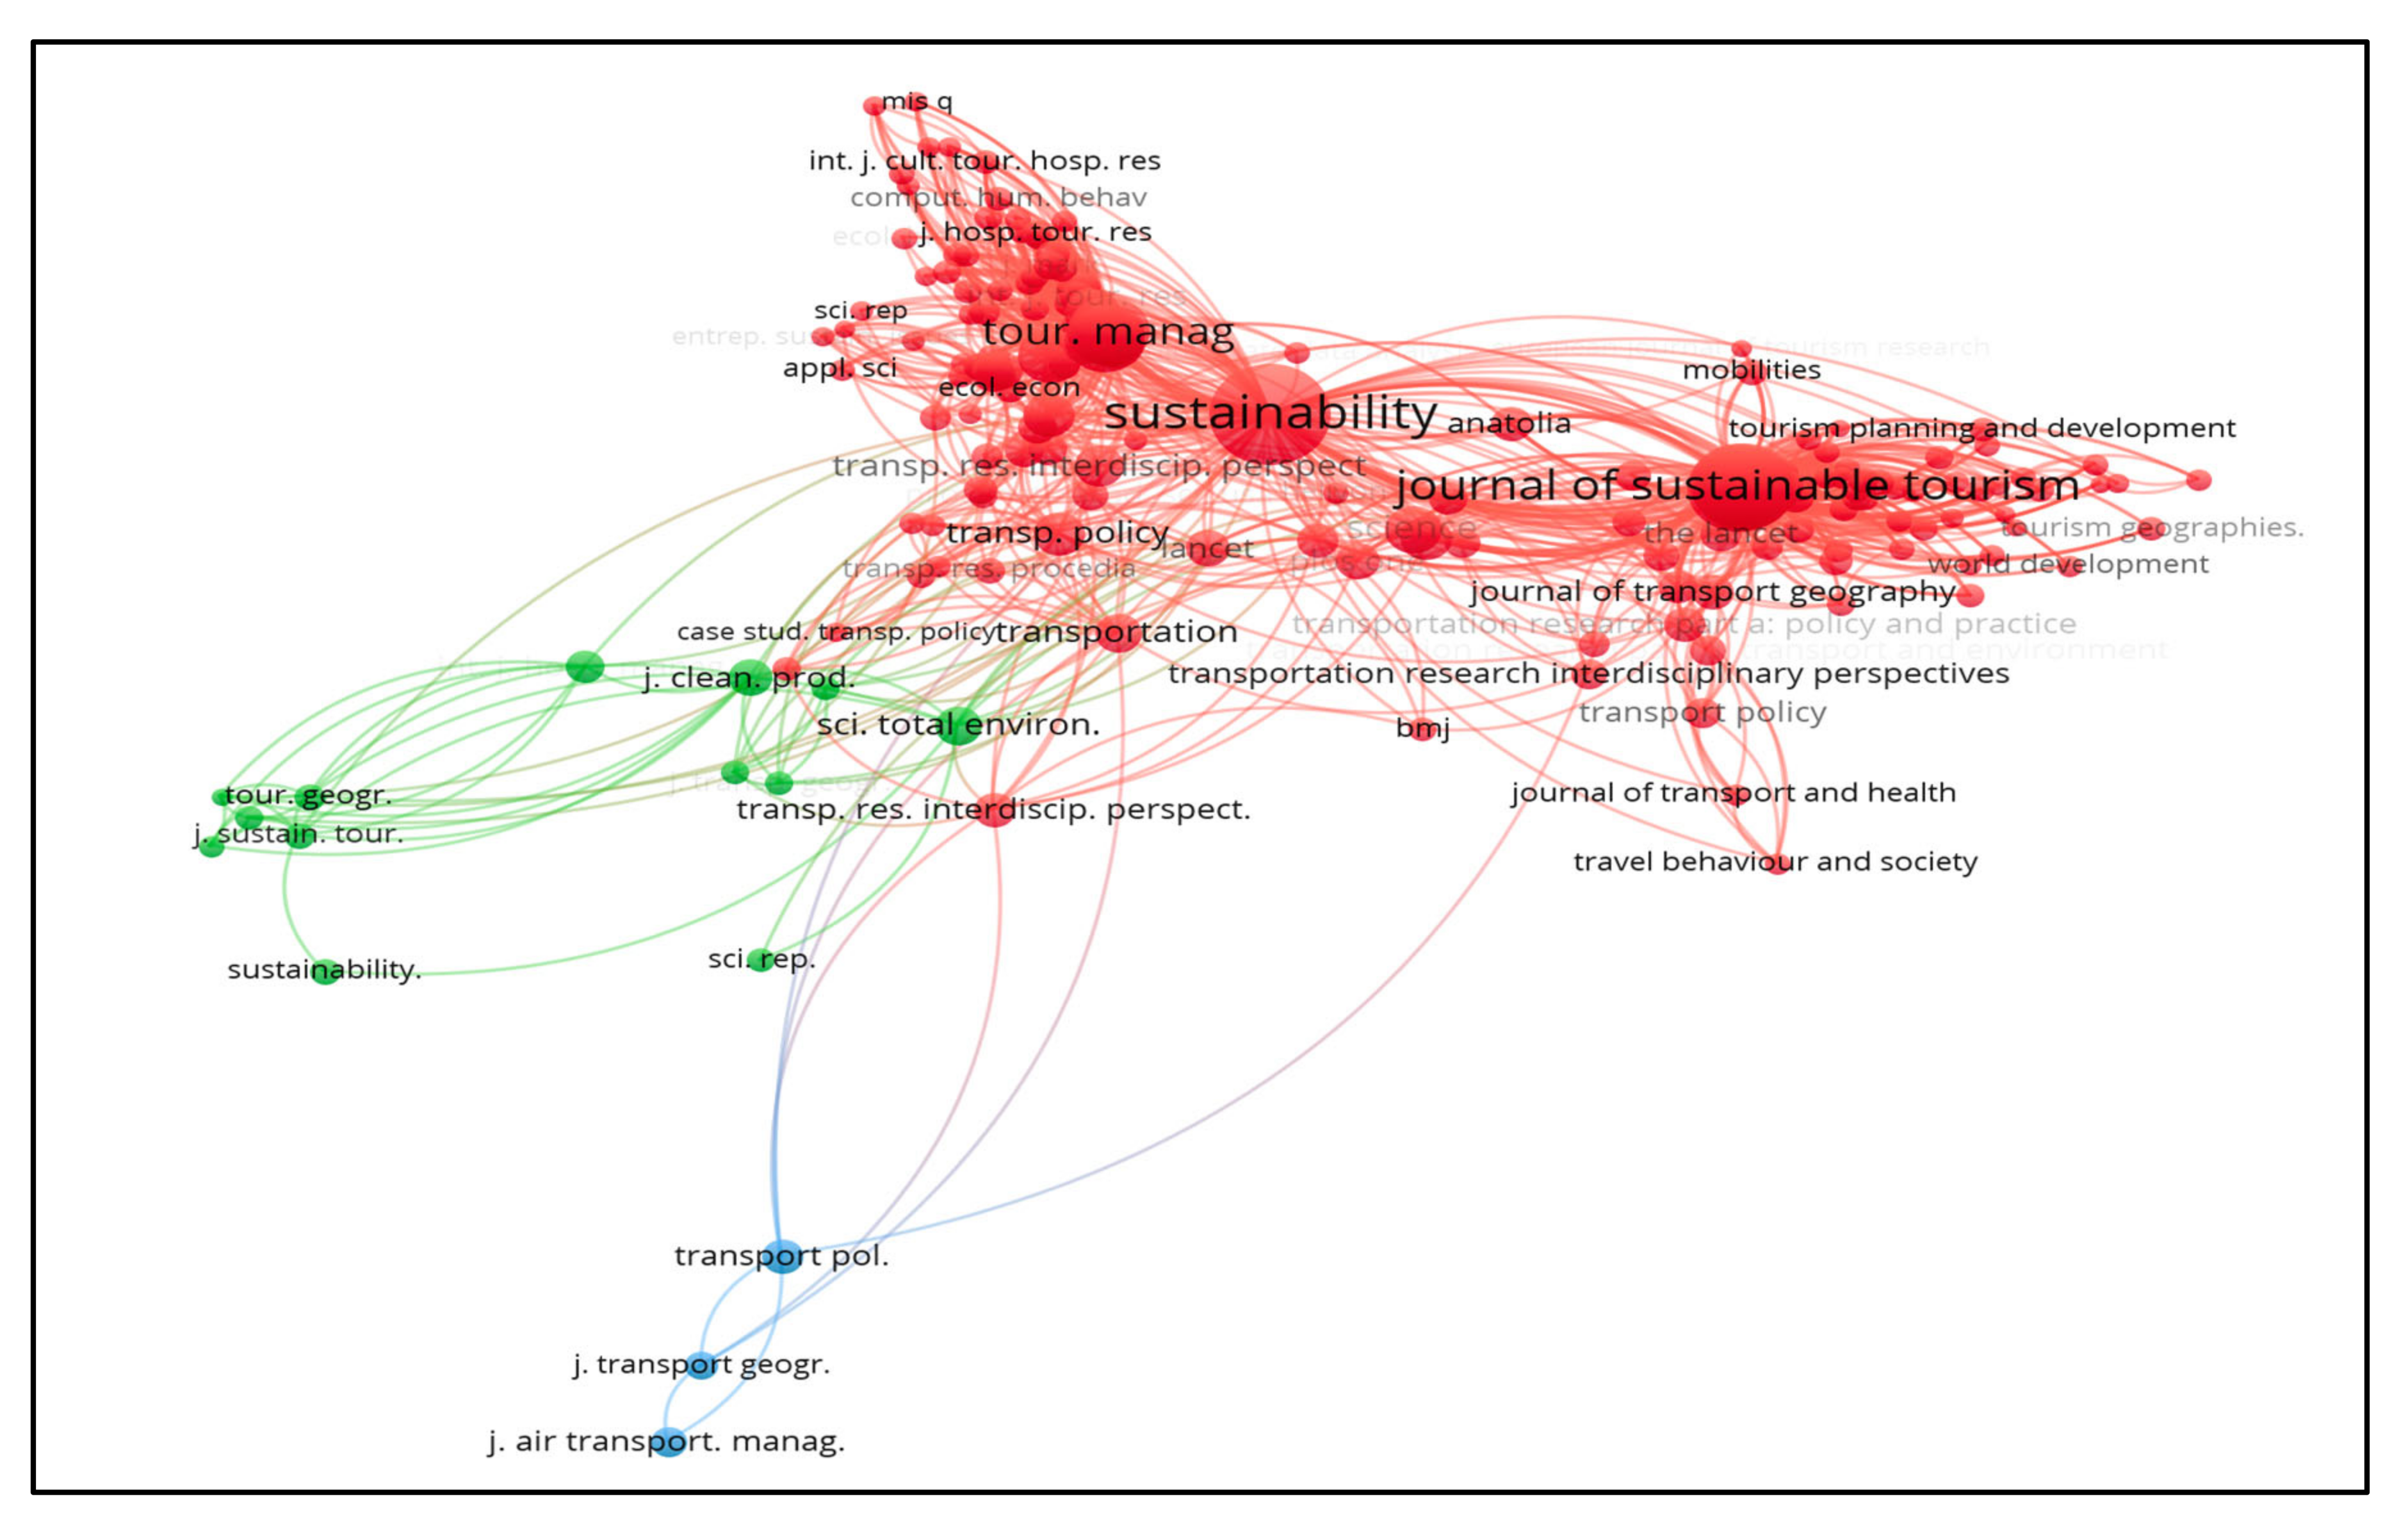
In Figure 10, we present a co-citation network of different journals that published documents on COVID-19 and tourism sustainability. There are three clusters identified by red, green, and blue colors. Journals in each cluster are generally co-cited. The journals with the most significant impact are Sustainability and Journal of Sustainable Tourism (red cluster); Tourism Geographies (green cluster); and Transport Policy (blue cluster).

3.9. Social Structure of Knowledge

The social structure of knowledge indicates how different authors, institutes, and countries collaborate in the research community [69]. Particularly, the collaboration networks allow us to identify the most relevant authors, institutions, and countries in the field of research and their relationships [70]. The co-authorship network is an increasingly used bibliometric technique to reveal the social-structure knowledge by analyzing the collaboration trends and identifying the leading authors, institutions, and countries [88].
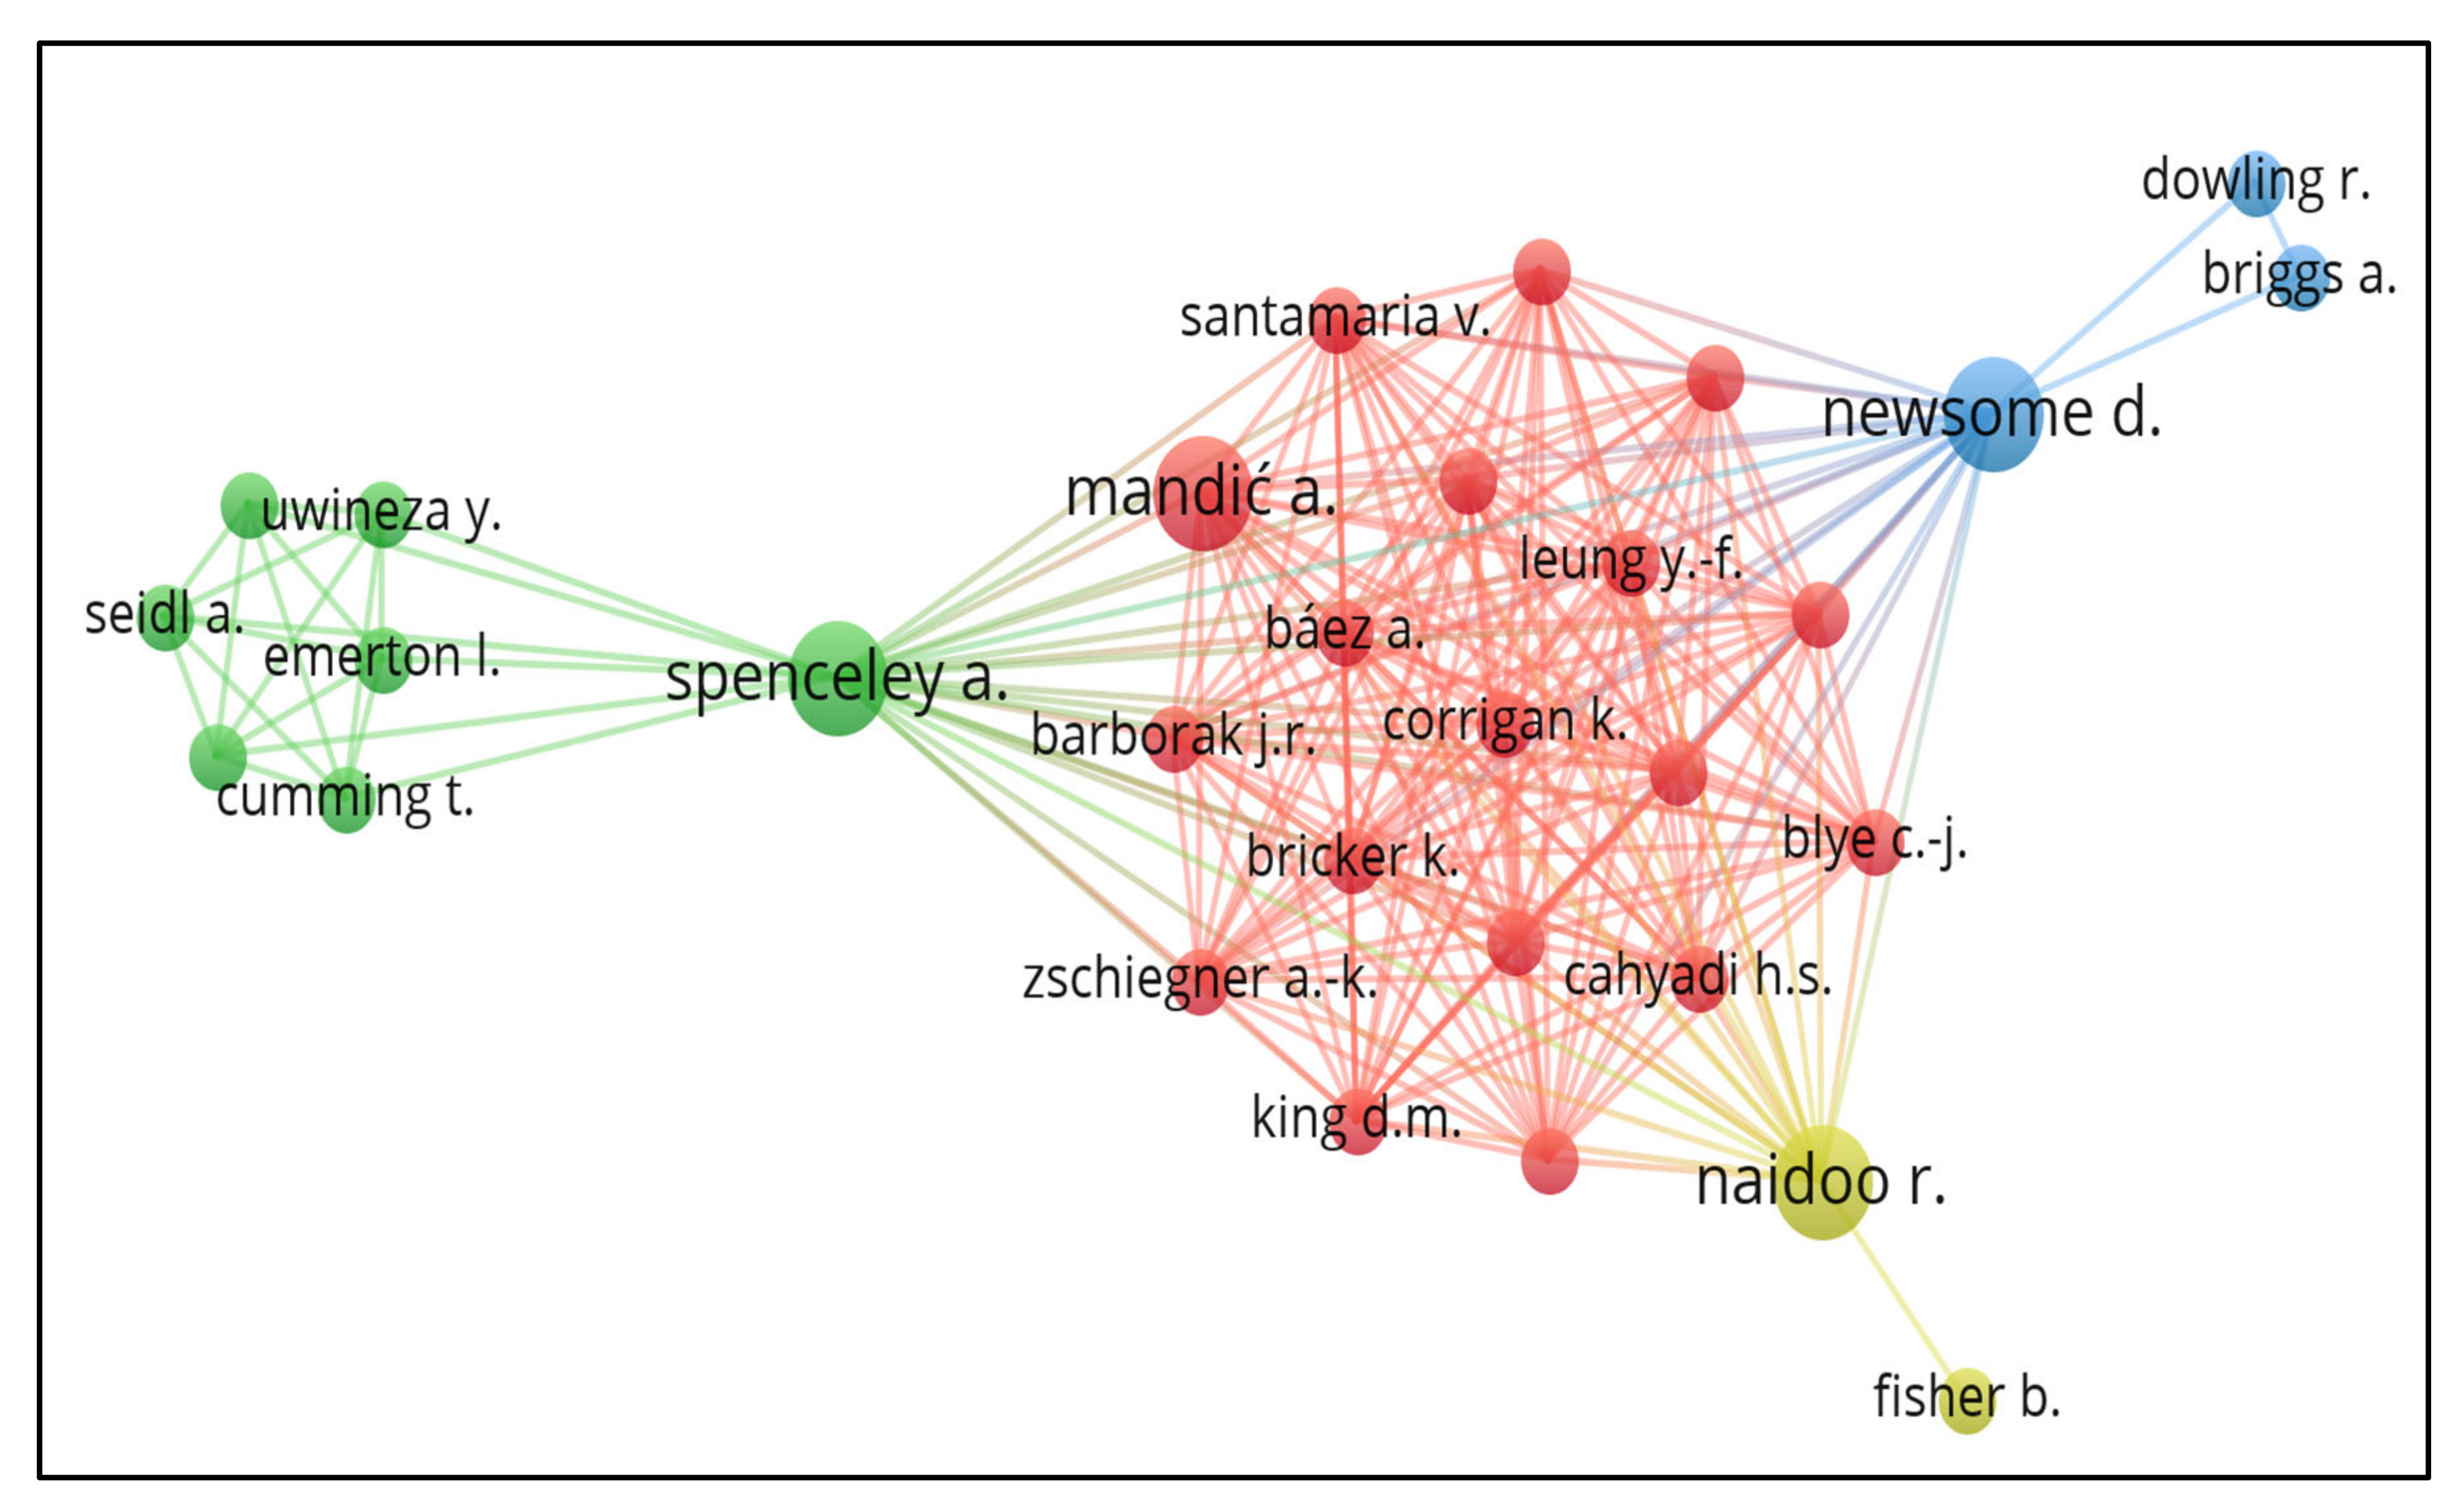
In Figure 11, we show authors’ collaborations in the researched topic through a co-authorship network. This network is developed based on the joint publication of authors in the selected documents. Each of the 30 circles in the network represents an author. These authors were found to collaborate with each other in their research works. The collaboration index for articles with multiple authors has an average value of 3.49. There are four clusters of authors’ collaboration in the research field, and the most prolific authors per cluster are Mandić, A. (red cluster); Newsome, D. (blue cluster); Naidoo, R. (yellow Cluster); and Spenceley, A. (green cluster).
Figure 12 represents a collaboration network of 20 organizations, determined on the basis of their co-authored publications. In all, 5 out of 20 organizations in the network are in the USA; 4 are in Canada; and 1 each is in Brazil, Indonesia, Australia, Germany, Ecuador, New Zealand, South Africa, Kenya, the UK, Costa Rica, and Croatia.
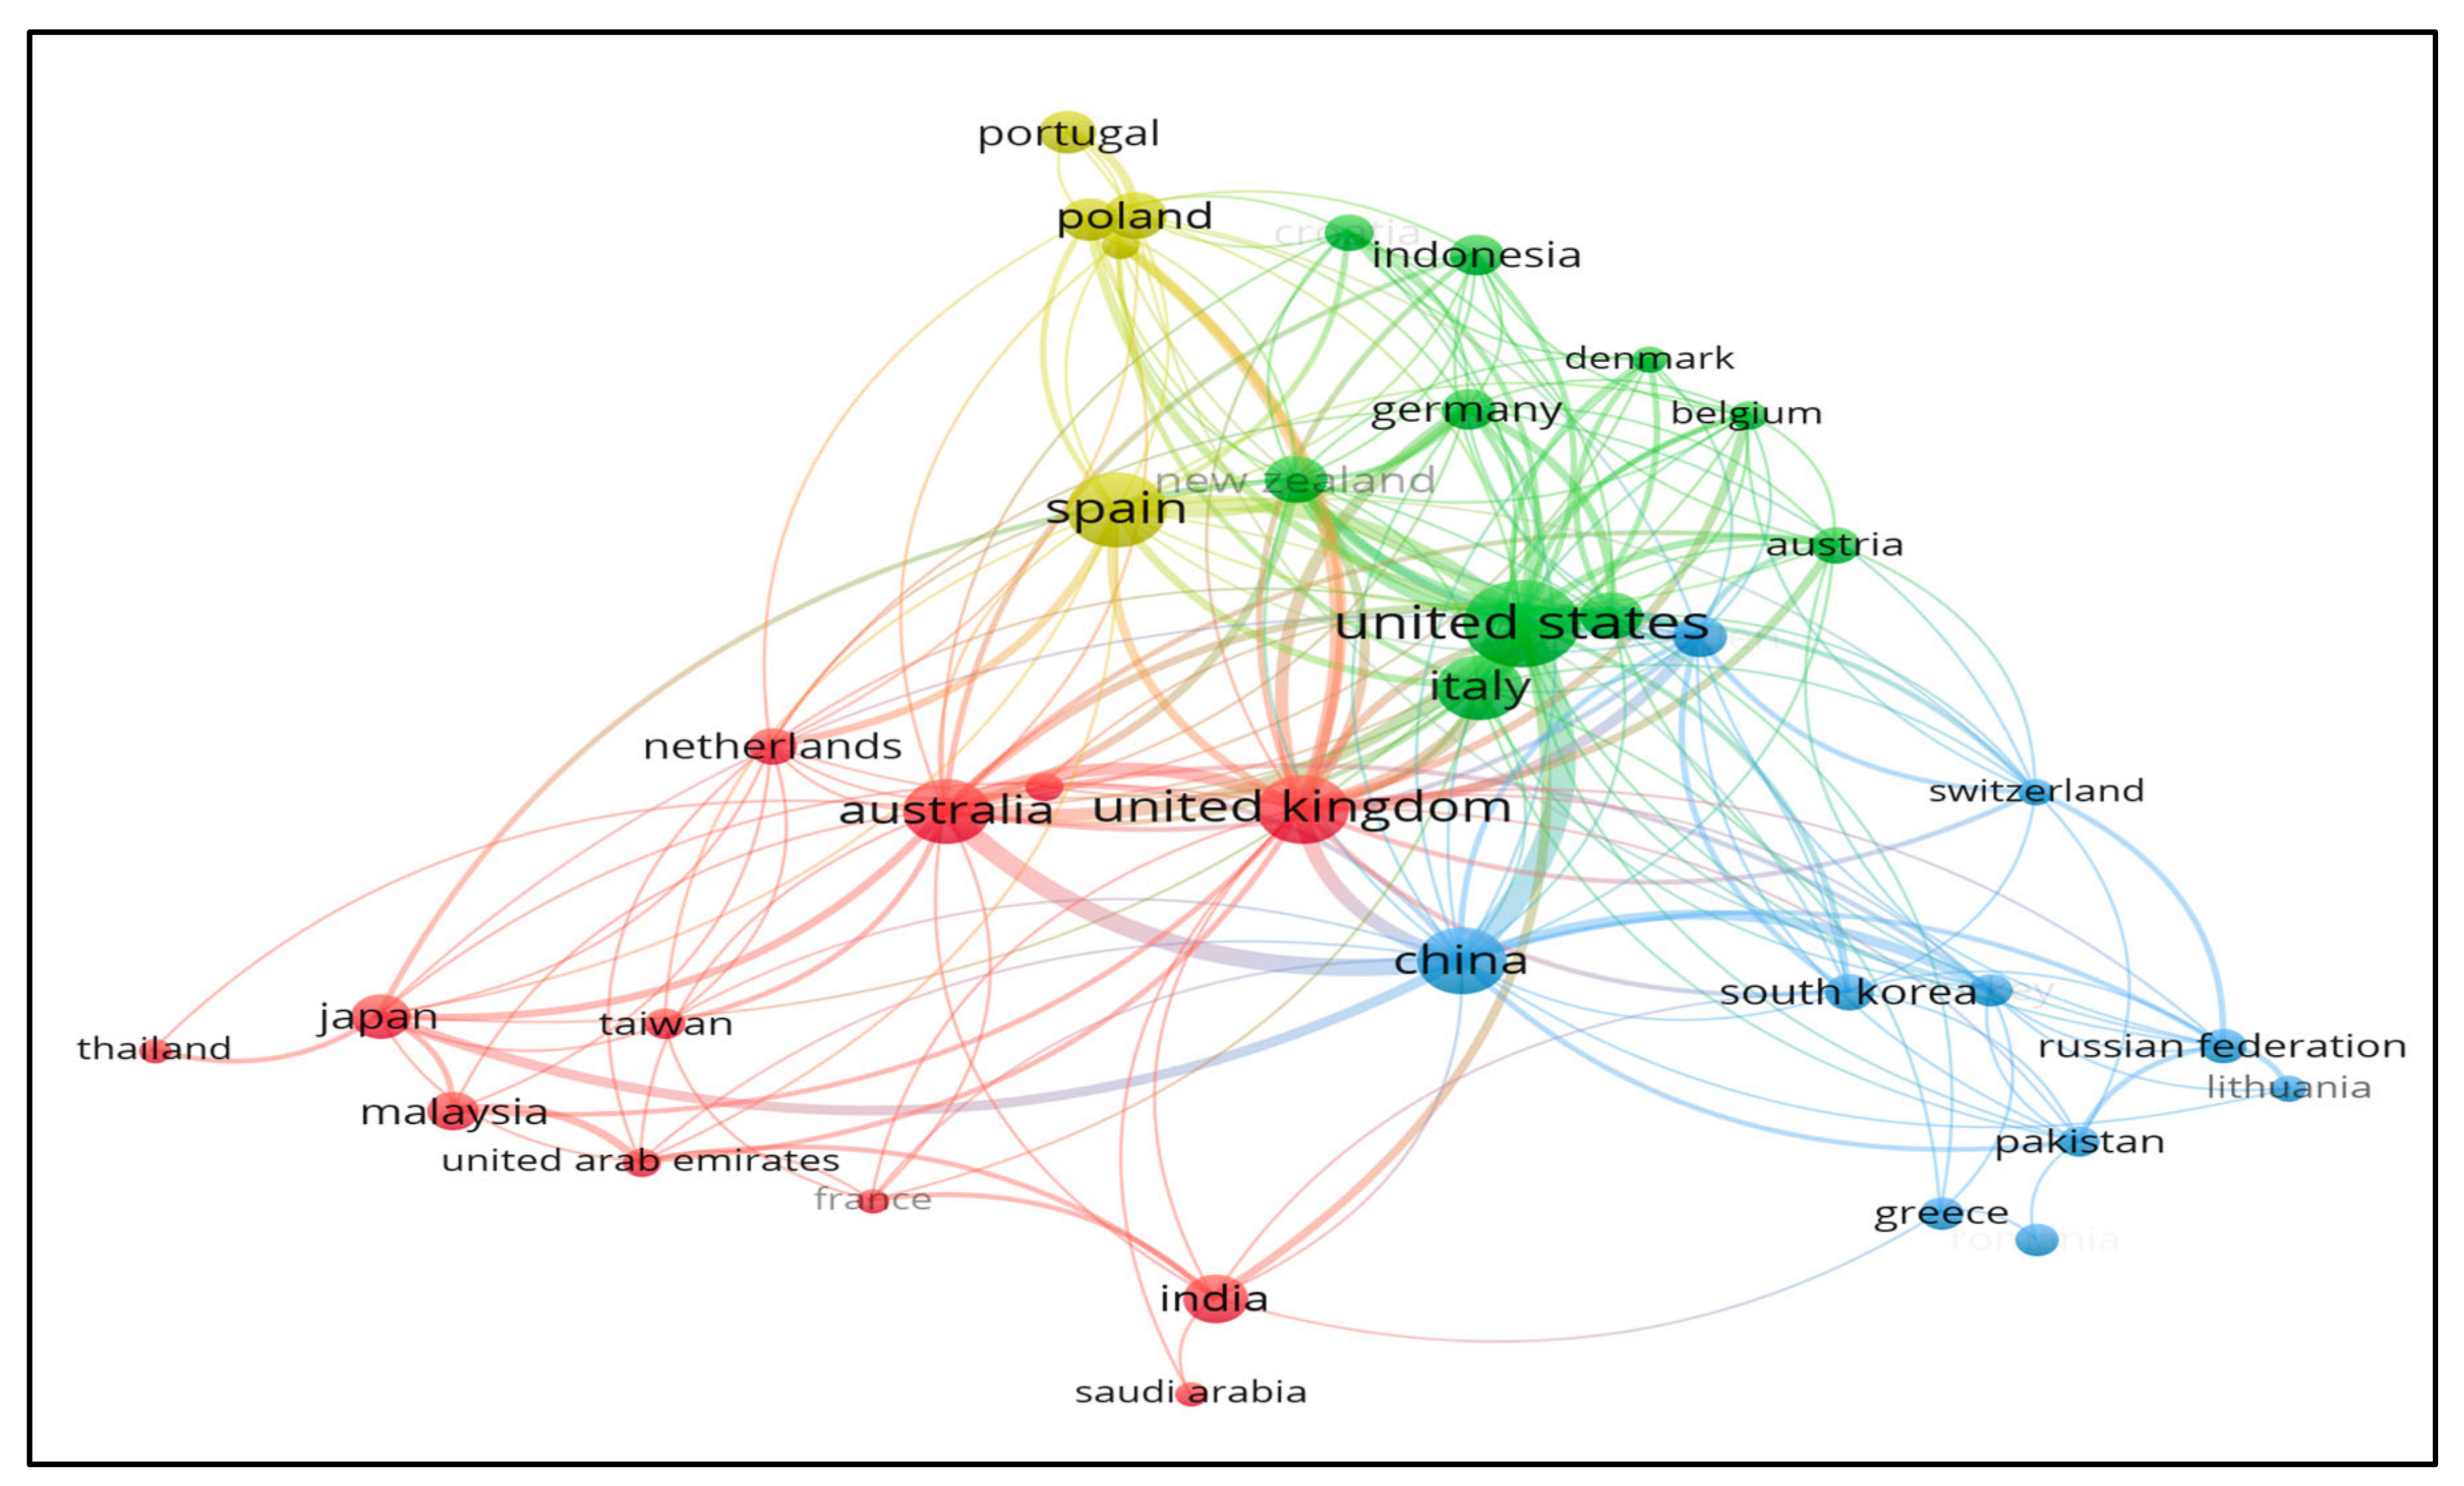
A co-authorship network of 37 countries is presented in Figure 13. There are four clusters of countries’ collaboration: red cluster (12 countries), green cluster (10 countries), blue cluster (10 countries), and yellow cluster (5 countries). Based on co-authorship, the most important countries in the green cluster are the US, Italy, New Zealand, Germany, and Indonesia. Meanwhile, Spain, Poland, and Portugal are the key countries in the yellow cluster; the UK, Australia, India, and the Netherlands are in the red cluster; and China, South Korea, and the Russian Federation are in blue cluster. The strongest collaboration in the network was observed among China, Australia, UK, US, and Japan.

4. Discussion

The present study aimed to decipher and map the scientific literature and evolutionary nuances of the research in “COVID-19 and tourism sustainability”. The researchers applied bibliometric techniques to analyze the 440 bibliographic records retrieved from the Scopus database. The findings reveal an apparent upsurge in the number of publications during 2021, with a growth rate of 210.28% over the previous year. The concentration of journals in the field of tourism sustainability to publish COVID-19-related articles between 2020 and 2021 could be one of the possible causes for this extensive increase in the number of publications. In terms of the authors’ productivity, we observed 0.33 documents per author and 3.07 authors per document. Out of 440 documents, 71 were single authored, and remaining 369 were multi-authored documents. A total number of 1280 authors were identified in the multi-authored documents, indicating a collaboration index (CI) of 3.47. This collaboration index is higher than the observations of Köseoglu and King [89], who found that collaboration networks in tourism journals generally consist of dual authors. However, the collaboration index of 3.47 roughly substantiates the findings of Marti-Parreño and Gómez-Calvet [90], who recorded the CI of 3.41 among the authors in the field of Social Media and Sustainable Tourism research. This high CI is probably an outcome of the increased interest of interdisciplinary and transdisciplinary researchers to publish in the area of sustainability during the pandemic. The growing interest of tourism researchers in sustainability [91,92], along with the guidelines of leading organizations such as UNWTO [93] and WTTC [94] on tourism sustainability can be another reason for the growth in the number of publications, as well as a higher CI.
As for the authors’ productivity, we found that 1279 authors published only one document, 59 authors published two documents, 12 authors published three documents, and only 1 author (Prof. Joseph M. Cheer) published four documents. It unveils that the Inverse Square Law of Scientific productivity [40] in its original form does not fit the present data set. One of the reasons is the presence of large number of authors who contributed only one document. Consequently, the more productive authors are found to have more collaborative studies [41]. In terms of sources’ productivity, the application of Bradford’s law [48] showed that, out of 180 journals that published 440 documents, only 3 are in core zones, i.e., Sustainability, Journal of Sustainable Tourism, and Tourism Geographies, which published a total of 154 documents. It signifies that these three journals are of the highest interest to the researchers and are among the most cited journals in the literature of the subject under study [49]. The analysis of most-frequently appearing keywords (Table 3) through Zipf’s Law [54] revealed that the law in its original form does not apply to the current data set. It could be because Zipf’s law is more appropriate for middle ranks [56] instead of top ranks.
The findings on citations show that the 440 documents which were published in 180 journals received a total of 2985 citation, with an average of 6.784 citations per document and 2.651 citations per document per year. The average number of citations per document is higher than that of most of the journals publishing research in the area of tourism (see Reference [95]). The publication that received the highest number of citations was “Pandemics, transformations and tourism: be careful what you wish for” [59], with a total of 235 citations and an average of 78.33 citations per year. Of the top 10 articles in terms of number of citations, 4 were published in Tourism Geographies (Table 4). The co-citation analysis used to determine the intellectual structure of knowledge resulted into three clusters each of relationship between authors (Figure 9) and sources (Figure 10).
When analyzing the country of the corresponding author, the USA and Spain resulted in being the most productive nations, with a total of 35 (7.95%) and 31 (7.04%) documents, respectively. In terms of total citations, the USA received the highest amount of citations, at 246 citations, followed by the UK, with 244 citations. The results on country-wise productivity partly substantiate the findings of Güzeller and Celiker [96] on tourism research. Concerning the scientific productivity by institutions, Griffith University (Australia) and Lund University (Sweden) were deemed to be the most relevant institutions, roughly corroborating the results of most relevant countries (Figure 6). Moreover, the co-authorship analysis that was used to derive the social structure of knowledge uncovered a cluster of relationships between institutions (Figure 12) and four clusters each of relationships between authors (Figure 11) and countries (Figure 13) in the scientific community.
The technique of Multiple Correspondence Analysis applied to detect the conceptual structure of knowledge yielded three clusters of co-occurring keywords (see Figure 8). These clusters were related to management and sustainable development of tourism, environmental health, and mobility trends. The concepts of sustainable mobility and environmental health are closely linked with tourism sustainability [97,98] and are crucial for pandemic recovery [99]. Such concepts should be perceived as the recent domains that are imperative for future research on tourism sustainability in the face of major-event crises, such as COVID-19. The summary of findings is presented in Table 5.

5. Conclusions

In light of the COVID-19 crisis, the UNWTO Secretary-General, on 5 June 2020, announced that sustainability should not only be accepted as a niche of tourism but the new norm for the entire sector. This was among the central elements of UNWTO’s Global Guideline to Restart Tourism to secure better, more sustainable, and resilient growth, which would also contribute to the United Nation’s Sustainable Development Goals [93]. The World Travel and Tourism Council also reported on 19 August 2021 that “sustainability is our collective responsibility”, and it should be at the forefront of all the future policies to ensure a revival that benefits both people and the planet, especially now that COVID-19 has heightened the focus on sustainability [94]. Such proclamations of leading organizations in travel and tourism may be perceived as one of the major reasons to attract the interest of contemporary researchers toward tourism sustainability amid COVID-19.
The present study adopted bibliometric techniques to decipher and map the scientific literature and evolutionary nuances in the research field of COVID-19 and tourism sustainability. A total number of 440 documents published between 2019 and 2021 were retrieved from Scopus database for the purpose of analysis. While the performance of different research constituents was analyzed by using statistical techniques, the structure of knowledge was revealed through data exploration and network visualizations.
The growing number of publications, authors, sources, countries, institutions, citations, and collaborations between research constituents leads to the identification of COVID-19 and tourism sustainability as a significant and influential field of contemporary research. Based on the analysis of keywords, our findings reveal the concentration of research in three prime domains, namely management and sustainable development of tourism, environmental health, and mobility trends, in the context of COVID-19. These areas indicate the three clusters of trend research and evolutionary domains of research in the underlying field. The evolutionary research in the field reveals a rethinking of tourism sustainability, prompted by the COVID-19, which calls for transformative decisions of tourism practitioners and policymakers to reactivate tourism sustainably in the post-pandemic era [2,10,11].
This research contributes to our understanding of the bibliometric construct and knowledge structure of research that evolved around tourism sustainability amid COVID-19. The compilation of a growing number of documents led to the identification of trends and evolutions in the research field. Thus, aspiring researchers can recognize the most influential research areas, articles, authors, and sources. It would assist them in selecting a suitable and influential journal in which to publish their work, as well as deciding on possible international collaboration and collaborators in visualized countries and institutions.
To overcome the limitations of this study, future researchers may gather data from other prolific databases, such as the Web of Science. While the present bibliometric analysis is based on the three years of scientific literature in the given field, potential scholars may choose to expand the period of publications and combination of keywords. This will help to validate and extend the results of present analysis. As most of the findings rely on use of bibliographic software, a blend of manual and software processing can help refine the results.

Author Contributions

Conceptualization, K.B., C.S., K.A. and A.G.; Formal analysis, K.B.; Methodology, K.B.; Software, K.B.; Supervision, C.S. and S.K.K.; Validation, K.A. and A.G.; Visualization, K.B.; Writing—original draft, K.B.; Writing—review & editing, C.S., S.K.K. and K.A. All authors have read and agreed to the published version of the manuscript.

Funding

This research received no external funding.

Data Availability Statement

All relevant data generated and analyzed during this research were collected from the Scopus database and are accessible with the help of the search query mentioned in the Methodology section.

Conflicts of Interest

The authors declare no conflict of interest.

References

  1. Chaudhary, A. Impact and Survival Strategy for Hospitality Industry after COVID-19. Int. J. Innov. Sci. Res. Technol. 2020, 5, 489–492. Available online: https://ijisrt.com/assets/upload/files/IJISRT20NOV427.pdf (accessed on 18 August 2022).
  2. Mestanza, J.G.; Bakhat, R. A fuzzy ahp-mairca model for overtourism assessment: The case of Malaga province. Sustainability 2021, 13, 6394. [Google Scholar] [CrossRef]
  3. Palacios-Florencio, B.; Santos-Roldán, L.; Berbel-Pineda, J.M.; Castillo-Canalejo, A.M. Sustainable Tourism as a Driving force of the Tourism Industry in a Post-COVID-19 Scenario. Soc. Indic. Res. 2021, 158, 991–1011. [Google Scholar] [CrossRef] [PubMed]
  4. Tsai, M.-C. Developing a sustainability strategy for Taiwan’s tourism industry after the COVID-19 pandemic. PLoS ONE 2021, 16, e0248319. [Google Scholar] [CrossRef]
  5. Goel, P.; Garg, A.; Walia, N.; Kaur, R.; Jain, M.; Singh, S. Contagious diseases and tourism: A systematic review based on bibliometric and content analysis methods. Qual. Quant. 2021, 56, 3085–3110. [Google Scholar] [CrossRef]
  6. Castanho, R.A.; Couto, G.; Sousa, Á.; Pimentel, P.; Batista, M.D.G. Assessing the impacts of the COVID-19 pandemic over the azores region’s touristic companies. Sustainability 2021, 13, 9647. [Google Scholar] [CrossRef]
  7. Lapointe, D. Reconnecting tourism after COVID-19: The paradox of alterity in tourism areas. Tour. Geogr. 2020, 22, 633–638. [Google Scholar] [CrossRef]
  8. Lebrun, A.-M.; Su, C.-J.; Bouchet, P. A more sustainable management of domestic tourists in protected natural parks: A new trend in sport tourism after the COVID-19 pandemic? Sustainability 2021, 13, 7750. [Google Scholar] [CrossRef]
  9. Moreno-Luna, L.; Robina-Ramírez, R.; Sánchez, M.S.-O.; Castro-Serrano, J. Tourism and sustainability in times of COVID-19: The case of Spain. Int. J. Environ. Res. Public Health 2021, 18, 1859. [Google Scholar] [CrossRef]
  10. Higgins-Desbiolles, F. The “war over tourism”: Challenges to sustainable tourism in the tourism academy after COVID-19. J. Sustain. Tour. 2020, 29, 551–569. [Google Scholar] [CrossRef]
  11. Eichelberger, S.; Heigl, M.; Peters, M.; Pikkemaat, B. Exploring the role of tourists: Responsible behavior triggered by the COVID-19 pandemic. Sustainability 2021, 13, 5774. [Google Scholar] [CrossRef]
  12. Liu, H.; Wu, P.; Li, G. Do crises affect the sustainability of the economic effects of tourism? A case study of Hong Kong. J. Sustain. Tour. 2021. [Google Scholar] [CrossRef]
  13. Higgins-Desbiolles, F. Socialising tourism for social and ecological justice after COVID-19. Tour. Geogr. 2020, 22, 610–623. [Google Scholar] [CrossRef]
  14. Vărzaru, A.A.; Bocean, C.G.; Cazacu, M. Rethinking tourism industry in pandemic COVID-19 period. Sustainability 2021, 13, 6956. [Google Scholar] [CrossRef]
  15. Hoarau, J.-F. Is international tourism responsible for the outbreak of the COVID-19 pandemic? A cross-country analysis with a special focus on small islands. Rev. World Econ. 2021, 158, 493–528. [Google Scholar] [CrossRef]
  16. Sigala, M. Tourism and COVID-19: Impacts and implications for advancing and resetting industry and research. J. Bus. Res. 2020, 117, 312–321. [Google Scholar] [CrossRef]
  17. Chang, C.L.; McAleer, M.; Ramos, V. A charter for sustainable tourism after COVID-19. Sustainability 2020, 12, 3671. [Google Scholar] [CrossRef]
  18. Marujo, N.; Borges, M.D.R.; Serra, J.; Coelho, R. Strategies for creative tourism activities in pandemic contexts: The case of the ‘saídas de mestre’ project. Sustainability 2021, 13, 10654. [Google Scholar] [CrossRef]
  19. Persson-Fischer, U.; Liu, S. The impact of a global crisis on areas and topics of tourism research. Sustainability 2021, 13, 906. [Google Scholar] [CrossRef]
  20. Fletcher, R.; Blanco-Romero, A.; Blázquez-Salom, M.; Cañada, E.; Murray Mas, I.; Sekulova, F. Pathways to post-capitalist tourism. Tour. Geogr. 2021. [Google Scholar] [CrossRef]
  21. Mach, L.J. Surf tourism in uncertain times: Resident perspectives on the sustainability implications of COVID-19. Societies 2021, 11, 75. [Google Scholar] [CrossRef]
  22. Suhail, K.S.J.; Naamo, G.S.; AlJashaam, A.A.G. The effect of strategic foresight on tourism marketing after COVID-19. Afr. J. Hosp. Tour. Leis. 2019, 8, 1–11. Available online: https://www.ajhtl.com/uploads/7/1/6/3/7163688/article_41_8_1__2019_iraq.pdf (accessed on 18 August 2022).
  23. Galvani, A.; Lew, A.A.; Perez, M.S. COVID-19 is expanding global consciousness and the sustainability of travel and tourism. Tour. Geogr. 2020, 22, 567–576. [Google Scholar] [CrossRef]
  24. Pritchard, A. Statistical Bibliography or Bibliometrics? J. Doc. 1969, 25, 348–349. Available online: https://www.researchgate.net/publication/236031787_Statistical_Bibliography_or_Bibliometrics (accessed on 18 August 2022).
  25. Donthu, N.; Kumar, S.; Mukherjee, D.; Pandey, N.; Lim, W.M. How to conduct a bibliometric analysis: An overview and guidelines. J. Bus. Res. 2021, 133, 285–296. [Google Scholar] [CrossRef]
  26. Ramos-Rodríguez, A.-R.; Ruíz-Navarro, J. Changes in the Intellectual Structure of Strategic Management Research: A Bibliometric Study of the “Strategic Management Journal”, 1980–2000. Strateg. Manag. J. 2004, 25, 981–1004. [Google Scholar] [CrossRef]
  27. Kent Baker, H.; Pandey, N.; Kumar, S.; Haldar, A. A bibliometric analysis of board diversity: Current status, development, and future research directions. J. Bus. Res. 2020, 108, 232–246. [Google Scholar] [CrossRef]
  28. Tunger, D.; Eulerich, M. Bibliometric analysis of corporate governance research in German-speaking countries: Applying bibliometrics to business research using a custom-made database. Scientometrics 2018, 117, 2041–2059. [Google Scholar] [CrossRef]
  29. Wijesinghe, S.N.R.; Mura, P.; Bouchon, F. Tourism knowledge and neocolonialism—A systematic critical review of the literature. Curr. Issues Tour. 2019, 22, 1263–1279. [Google Scholar] [CrossRef]
  30. Araya-Castillo, L.; Hernández-Perlines, F.; Millán-Toledo, C.; Ibarra Cisneros, M.A. Bibliometric analysis of studies on family firms. Econ. Res.-Ekon. Istraživanja 2021, 35, 4778–4800. [Google Scholar] [CrossRef]
  31. Joshi, A. Comparison between Scopus & ISI Web of Science. J. Glob. Values 2017, 7, e2454-8391. Available online: https://www.researchgate.net/publication/318258303_COMPARISON_BETWEEN_SCOPUS_ISI_WEB_OF_SCIENCE (accessed on 18 August 2022).
  32. Barki, H.; Rivard, S.; Talbot, J. A Keyword Classification Scheme for IS Research Literature: An Update. MIS Q. 1993, 17, 209–226. [Google Scholar] [CrossRef]
  33. Palácios, H.; de Almeida, M.H.; Sousa, M.J. A bibliometric analysis of trust in the field of hospitality and tourism. Int. J. Hosp. Manag. 2021, 95, 102944. [Google Scholar] [CrossRef]
  34. Van Eck, N.J.; Waltman, L. Software survey: VOSviewer, a computer program for bibliometric mapping. Scientometrics 2010, 84, 523–538. [Google Scholar] [CrossRef] [Green Version]
  35. Waltman, L.; van Eck, N.J.; Noyons, E.C.M. A unified approach to mapping and clustering of bibliometric networks. J. Informetr. 2010, 4, 629–635. [Google Scholar] [CrossRef]
  36. Ghosh, P.; Ghosh, R.; Chakraborty, B. COVID-19 in India: Statewise Analysis and Prediction. JMIR Public Health Surveill. 2020, 6, e20341. [Google Scholar] [CrossRef]
  37. Koseoglu, M.A. Growth and structure of authorship and co-authorship network in the strategic management realm: Evidence from the Strategic Management Journal. BRQ Bus. Res. Q. 2016, 19, 153–170. [Google Scholar] [CrossRef]
  38. Ahmi, A.; Elbardan, H.; Ali, R.H.R.M. Bibliometric Analysis of Published Literature on Industry 4.0. In Proceedings of the 2019 International Conference on Electronics, Information, and Communication (ICEIC), Auckland, New Zealand, 22–25 January 2019; pp. 1–6. [Google Scholar] [CrossRef]
  39. Elango, B.; Rajendran, P. Authorship trends and collaboration pattern in the marine sciences literature: A scientometric study. Int. J. Inf. Dissem. Technol. 2012, 2, 166–169. Available online: http://www.cindoc.csic.es/cybermetrics/articles/v4i1p4.html (accessed on 18 August 2022).
  40. Lotka, A.J. The frequency distribution of scientific distribution. J. Wash. Acad. Sci. 1926, 16, 317–323. Available online: https://www.jstor.org/stable/24529203 (accessed on 18 August 2022).
  41. Devi, B.M. Lokta’s Law Revisited in Toxicology Literature. Library Philosophy and Practice, 0_1. 2013. Available online: https://www.proquest.com/openview/a68559a835d0bffea7ff102ac7bfef37/1?pq-origsite=gscholar&cbl=54903 (accessed on 18 August 2022).
  42. Gupta, D.K. Lotka’s law and productivity patterns of entomological research in Nigeria for the period, 1900–1973. Scientometrics 1987, 12, 33–46. [Google Scholar] [CrossRef]
  43. Cheer, J.M. Human flourishing, tourism transformation and COVID-19: A conceptual touchstone. Tour. Geogr. 2020, 22, 514–524. [Google Scholar] [CrossRef]
  44. Scheyvens, R.; Cheer, J.M. Tourism, the SDGs and partnerships. J. Sustain. Tour. 2021, 30, 2271–2281. [Google Scholar] [CrossRef]
  45. Sin, H.L.; Mostafanezhad, M.; Cheer, J.M. Tourism geographies in the ‘Asian Century’. Tour. Geogr. 2021, 23, 649–658. [Google Scholar] [CrossRef]
  46. Ting, H.; Jean, L.X.; Meng, L.C.; Cheah, J.-H.; Cheer, J.M. Editorial—Responsible tourism: A call to action for turbulent times. Asian J. Bus. Res. 2020, 10, ix–xxi. [Google Scholar] [CrossRef]
  47. McKercher, B. A citation analysis of tourism scholars. Tour. Manag. 2008, 29, 1226–1232. [Google Scholar] [CrossRef]
  48. Bradford, S.C. Sources of information on specific subjects. Engineering 1934, 137, 85–86. Available online: http://ci.nii.ac.jp/naid/10016754267/en/ (accessed on 18 August 2022).
  49. Nash-Stewart, C.E.; Kruesi, L.M.; del Mar, C.B. Does Bradford’s Law of Scattering predict the size of the literature in Cochrane Reviews? J. Med. Libr. Assoc. JMLA 2012, 100, 135–138. [Google Scholar] [CrossRef]
  50. Fairthorne, R.A. Empirical hyperbolic distributions (Bradford-Zipf-Mandelbrot) for bibliometric description and prediction. J. Doc. 2005, 61, 171–193. [Google Scholar] [CrossRef]
  51. Mingers, J.; Macri, F.; Petrovici, D. Using the h-index to measure the quality of journals in the field of business and management. Inf. Processing Manag. 2012, 48, 234–241. [Google Scholar] [CrossRef]
  52. Zhang, J.; Yu, Q.; Zheng, F.; Long, C.; Lu, Z.; Duan, Z. Comparing keywords plus of WOS and author keywords: A case study of patient adherence research. J. Assoc. Inf. Sci. Technol. 2015, 67, 967–972. [Google Scholar] [CrossRef]
  53. Gil-Gonzalez, E.; Pérez-Maqueda, L.; Sánchez-Jiménez, P.; Perejon, A. Flash Sintering Research Perspective: A Bibliometric Analysis. Materials 2022, 15, 416. [Google Scholar] [CrossRef]
  54. Zipf, G.K. Human Behavior and The Principle of Least Effort: An Introduction to Human Ecology; Addison-Wesley Press: Boston, MA, USA, 1949. [Google Scholar] [CrossRef]
  55. Piantadosi, S.T. Zipf’s word frequency law in natural language: A critical review and future directions. Psychon. Bull. Rev. 2014, 21, 1112–1130. [Google Scholar] [CrossRef]
  56. Wyllys, R.E. Empirical and Theoretical Bases of Zipf’s Law. 1981. Available online: https://citeseerx.ist.psu.edu/viewdoc/download?doi=10.1.1.562.5217&rep=rep1&type=pdf (accessed on 18 August 2022).
  57. Halling, D. Guide to Citation Analysis. Available online: https://tamu.libguides.com/c.php?g=565010 (accessed on 12 October 2021).
  58. Mulet-Forteza, C.; Martorell-Cunill, O.; Merigó, J.M.; Genovart-Balaguer, J.; Mauleon-Mendez, E. Twenty five years of the Journal of Travel & Tourism Marketing: A bibliometric ranking. J. Travel Tour. Mark. 2018, 35, 1201–1221. [Google Scholar] [CrossRef]
  59. Hall, C.M.; Scott, D.; Gössling, S. Pandemics, transformations and tourism: Be careful what you wish for. Tour. Geogr. 2020, 22, 577–598. [Google Scholar] [CrossRef]
  60. Niewiadomski, P. COVID-19: From temporary de-globalisation to a re-discovery of tourism? Tour. Geogr. 2020, 22, 651–656. [Google Scholar] [CrossRef]
  61. Romagosa, F. The COVID-19 crisis: Opportunities for sustainable and proximity tourism. Tour. Geogr. 2020, 22, 690–694. [Google Scholar] [CrossRef]
  62. Ioannides, D.; Gyimóthy, S. The COVID-19 crisis as an opportunity for escaping the unsustainable global tourism path. Tour. Geogr. 2020, 22, 624–632. [Google Scholar] [CrossRef]
  63. Choi, T.-M. Innovative “Bring-Service-Near-Your-Home” operations under Corona-Virus (COVID-19/SARS-CoV-2) outbreak: Can logistics become the Messiah? Transp. Res. Part E Logist. Transp. Rev. 2020, 140, 101961. [Google Scholar] [CrossRef]
  64. Ibn-Mohammed, T.; Mustapha, K.B.; Godsell, J.; Adamu, Z.; Babatunde, K.A.; Akintade, D.D.; Acquaye, A.; Fujii, H.; Ndiaye, M.M.; Yamoah, F.A.; et al. A critical review of the impacts of COVID-19 on the global economy and ecosystems and opportunities for circular economy strategies. Resour. Conserv. Recycl. 2021, 164, 105169. [Google Scholar] [CrossRef]
  65. Naidoo, R.; Fisher, B. Reset Sustainable Development Goals for a pandemic world. Nature 2020, 583, 198–201. [Google Scholar] [CrossRef]
  66. Shamshiripour, A.; Rahimi, E.; Shabanpour, R.; Mohammadian, A.K. How is COVID-19 reshaping activity-travel behavior? Evidence from a comprehensive survey in Chicago. Transp. Res. Interdiscip. Perspect. 2020, 7, 100216. [Google Scholar] [CrossRef]
  67. Škare, M.; Soriano, D.R.; Porada-Rochoń, M. Impact of COVID-19 on the travel and tourism industry. Technol. Forecast. Soc. Chang. 2021, 163, 120469. [Google Scholar] [CrossRef]
  68. Rume, T.; Islam, S.M.D.-U. Environmental effects of COVID-19 pandemic and potential strategies of sustainability. Heliyon 2020, 6, e04965. [Google Scholar] [CrossRef]
  69. Aria, M.; Cuccurullo, C. bibliometrix: An R-tool for comprehensive science mapping analysis. J. Informetr. 2017, 11, 959–975. [Google Scholar] [CrossRef]
  70. Sharma, P.; Singh, R.; Tamang, M.; Singh, A.K.; Singh, A.K. Journal of teaching in travel &tourism: A bibliometric analysis. J. Teach. Travel Tour. 2021, 21, 155–176. [Google Scholar] [CrossRef]
  71. Boyack, K.W.; Klavans, R. Co-citation analysis, bibliographic coupling, and direct citation: Which citation approach represents the research front most accurately? J. Am. Soc. Inf. Sci. Technol. 2010, 61, 2389–2404. [Google Scholar] [CrossRef]
  72. Di Franco, G. Multiple correspondence analysis: One only or several techniques? Qual. Quant. 2016, 50, 1299–1315. [Google Scholar] [CrossRef]
  73. Filimonau, V.; Archer, D.; Bellamy, L.; Smith, N.; Wintrip, R. The carbon footprint of a UK University during the COVID-19 lockdown. Sci. Total Environ. 2021, 756, 143964. [Google Scholar] [CrossRef] [PubMed]
  74. O’Connor, P.; Assaker, G. COVID-19′s effects on future pro-environmental traveler behavior: An empirical examination using norm activation, economic sacrifices, and risk perception theories. J. Sustain. Tour. 2021, 30, 89–107. [Google Scholar] [CrossRef]
  75. Patterson Edward, J.K.; Jayanthi, M.; Malleshappa, H.; Immaculate Jeyasanta, K.; Laju, R.L.; Patterson, J.; Diraviya Raj, K.; Mathews, G.; Marimuthu, A.S.; Grimsditch, G. COVID-19 lockdown improved the health of coastal environment and enhanced the population of reef-fish. Mar. Pollut. Bull. 2021, 165, 112124. [Google Scholar] [CrossRef] [PubMed]
  76. Bishnoi, M.M.; Suraj, S. Sustainability of public transportation during the pandemic: A descriptive study. J. Green Eng. 2020, 10, 9472–9491. Available online: https://www.scopus.com/inward/record.uri?eid=2-s2.0-85096592832&partnerID=40&md5=6ccc6182c51a23b0d113189881c7c2b6 (accessed on 18 August 2022).
  77. Ceder, A.A. Urban mobility and public transport: Future perspectives and review. Int. J. Urban Sci. 2021, 25, 455–479. [Google Scholar] [CrossRef]
  78. Maltese, I.; Gatta, V.; Marcucci, E. Active Travel in Sustainable Urban Mobility Plans. An Italian overview. Res. Transp. Bus. Manag. 2021, 40, 100621. [Google Scholar] [CrossRef]
  79. Small, H. Visualizing Science by Citation Mapping. J. Am. Soc. Inf. Sci. 1999, 50, 799–813. [Google Scholar] [CrossRef]
  80. Surwase, G.; Sagar, A.; Kademani, B.S.; Bhanumurthy, K. Co-citation Analysis: An Overview. In Proceedings of the Beyond Librarianship: Creativity, Innovation and Discovery, Mumbai, India, 16–17 September 2011; Available online: http://eprints.rclis.org/17524/ (accessed on 18 August 2022).
  81. Mas-Tur, A.; Roig-Tierno, N.; Sarin, S.; Haon, C.; Sego, T.; Belkhouja, M.; Porter, A.; Merigó, J.M. Co-citation, bibliographic coupling and leading authors, institutions and countries in the 50 years of Technological Forecasting and Social Change. Technol. Forecast. Soc. Change 2021, 165, 120487. [Google Scholar] [CrossRef]
  82. Chi, X.; Cai, G.; Han, H. Festival travellers’ pro-social and protective behaviours against COVID-19 in the time of pandemic. Curr. Issues Tour. 2021, 24, 3256–3270. [Google Scholar] [CrossRef]
  83. Huang, H.; Wu, J.; Liu, F.; Wang, Y. Measuring accessibility based on improved impedance and attractive functions using taxi trajectory data. Sustainability 2021, 13, 112. [Google Scholar] [CrossRef]
  84. Zhang, H.; Leung, X.Y.; Bai, B.; Li, Y. Uncovering crowdsourcing in tourism apps: A grounded theory study. Tour. Manag. 2021, 87, 104389. [Google Scholar] [CrossRef]
  85. Higham, J.; Hanna, P.; Hopkins, D.; Cohen, S.; Gössling, S.; Cocolas, N. Reconfiguring Aviation for a Climate-Safe Future: Are Airlines Sending the Wrong Message? J. Travel Res. 2022, 61, 1458–1473. [Google Scholar] [CrossRef]
  86. Xiang, Z.; Fesenmaier, D.R.; Werthner, H. Knowledge Creation in Information Technology and Tourism: A Critical Reflection and an Outlook for the Future. J. Travel Res. 2021, 60, 1371–1376. [Google Scholar] [CrossRef]
  87. Zhu, O.Y.; Dolnicar, S. Can disasters improve the tourism industry? The role of normative, cognitive and relational expectations in shaping industry response to disaster-induced disruption. Ann. Tour. Res. 2021, 93, 103288. [Google Scholar] [CrossRef]
  88. Fonseca, B.d.P.F.e.; Sampaio, R.B.; Fonseca, M.V.d.A.; Zicker, F. Co-authorship network analysis in health research: Method and potential use. Health Res. Policy Syst. 2016, 14, 34. [Google Scholar] [CrossRef] [PubMed]
  89. Köseoglu, M.A.; King, B. Authorship Structures and Collaboration Networks in Tourism Journals. J. Hosp. Tour. Educ. 2021, 33, 57–65. [Google Scholar] [CrossRef]
  90. Marti-Parreño, J.; Gómez-Calvet, R. Social Media and Sustainable Tourism: A Literature Review. In Proceedings of the 3rd International Conference on Tourism Research-ICTR2020, Valencia, Spain, 27–28 March 2020; pp. 148–153. [Google Scholar] [CrossRef]
  91. Bramwell, B.; Lane, B.; McCabe, S.; Mosedale, J.; Scarles, C. Research Perspectives on Responsible Tourism. J. Sustain. Tour. 2008, 16, 253–257. [Google Scholar] [CrossRef]
  92. Jiménez-García, M.; Ruiz-Chico, J.; Peña-Sánchez, A.R.; López-Sánchez, J.A. A bibliometric analysis of sports tourism and sustainability (2002–2019). Sustainability 2020, 12, 2840. [Google Scholar] [CrossRef] [Green Version]
  93. UNWTO. “Sustainability as the New Normal” a Vision for the Future Of Tourism; UNWTO: Madrid, Spain, 2020; Available online: https://www.unwto.org/covid-19-oneplanet-responsible-recovery (accessed on 18 August 2022).
  94. WTTC. Lessons Learnt during COVID-19; WTTC: London, UK, 2021; Available online: https://wttc.org/Portals/0/Documents/Reports/2021/Lessons-Learnt-%20COVID-19.pdf?ver=2021-08-19-095731-037 (accessed on 18 August 2022).
  95. Law, R. An Analysis of the Impact of Tourism Journals on Google Scholar. In Information and Communication Technologies in Tourism 2010; Gretzel, U., Law, R., Fuchs, M., Eds.; Springer: Vienna, Austria, 2010; pp. 333–343. [Google Scholar] [CrossRef]
  96. Güzeller, C.O.; Celiker, N. Bibliometric Analysis of Tourism Research for the Period 2007-2016. Adv. Hosp. Tour. Res. (AHTR) 2018, 6, 1–22. [Google Scholar] [CrossRef]
  97. Høyer, K.G. Sustainable Tourism or Sustainable Mobility? The Norwegian Case. J. Sustain. Tour. 2000, 8, 147–160. [Google Scholar] [CrossRef]
  98. Verbeek, D.H.P.; Bargeman, A.; Mommaas, J.T. A sustainable tourism mobility passage. Tour. Rev. 2011, 66, 45–53. [Google Scholar] [CrossRef]
  99. Sheller, M. Reconstructing tourism in the Caribbean: Connecting pandemic recovery, climate resilience and sustainable tourism through mobility justice. J. Sustain. Tour. 2021, 29, 1436–1449. [Google Scholar] [CrossRef]
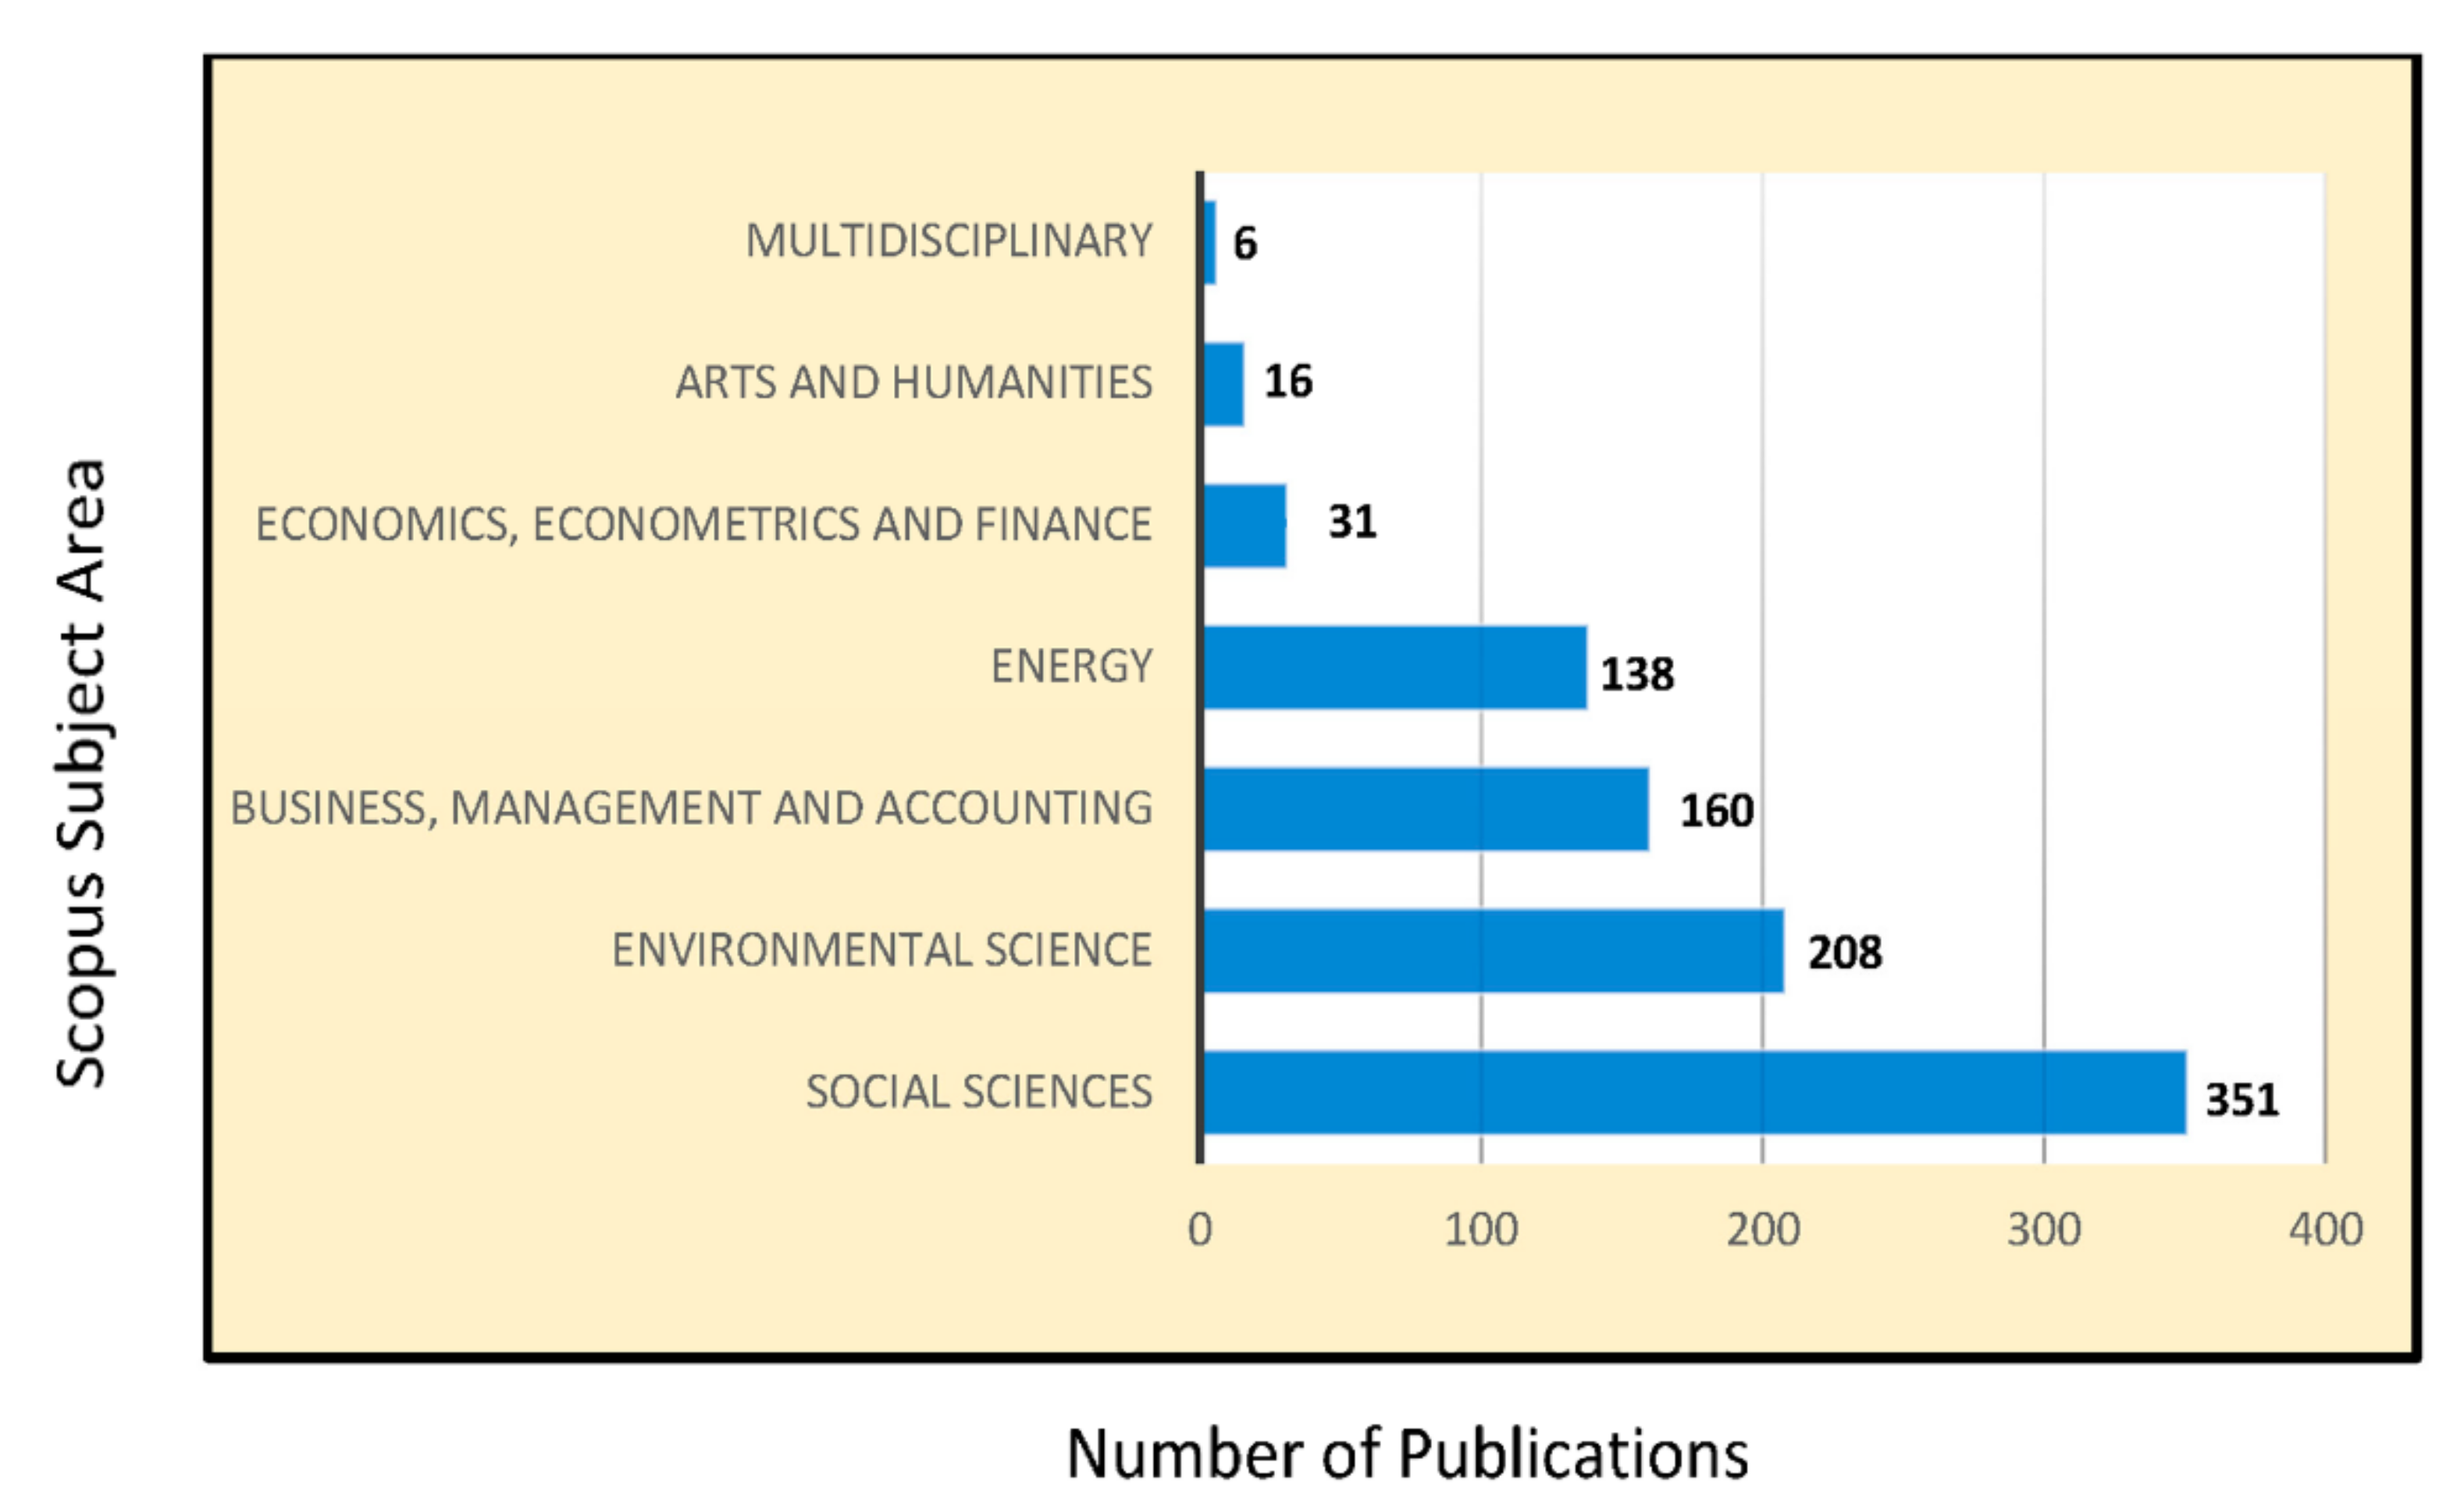
Figure 1. Number of Publications by Scopus Subject Areas. Source: own elaboration.
Sustainability 14 12151 g001
Figure 2. Frequency distribution of scientific productivity of authors. Source: own elaboration.
Sustainability 14 12151 g002
Figure 3. Bradford’s law. Source: own elaboration.
Sustainability 14 12151 g003
Figure 4. Word Clouds. Source: own elaboration. (a) Author’s Keyword; (b) Keywords Plus.
Sustainability 14 12151 g004
Figure 5. Keyword trends from using co-word analysis. Source: own elaboration.
Sustainability 14 12151 g005
Figure 6. Scientific productions by different countries. Source: own elaboration.
Sustainability 14 12151 g006
Figure 7. Three-field plot of author, countries, and affiliations. Source: own elaboration. Note: left field—authors; middle field—countries; and right field—affiliations.
Sustainability 14 12151 g007
Figure 8. Conceptual structure map using Multiple Correspondence Analysis. Source: own elaboration.
Sustainability 14 12151 g008
Figure 9. Co-citation network of authors. Source: own elaboration.
Sustainability 14 12151 g009
Figure 10. Co-citation network of sources. Source: own elaboration.
Sustainability 14 12151 g010
Figure 11. Co-authorship network of authors. Source: own elaboration.
Sustainability 14 12151 g011
Figure 12. Co-authorship network of organizations. Source: own elaboration.
Sustainability 14 12151 g012
Figure 13. Co-authorship network of countries. Source: own elaboration.
Sustainability 14 12151 g013
Table 1. Top 10 authors according to total citations.
Author h-Indexg-Indexm-IndexTCNPPY Start
Hall, C.M. 230.6726832020
Gossling, S. 110.3323512020
Scott, D. 110.3323512020
Gyimthy, S. 110.3310812020
Ioannides, D. 110.3310812020
Choi, Tm. 110.3310212020
Naidoo, R 220.679522020
Acquaye, A. 110.59112021
Adamu, Z. 110.59112021
Akintade, D.D. 110.59112021
Source: own elaboration. Notes: PY Start—year of 1st publication; NP—no. of publications; TC—total citations.
Table 2. Impact of sources by h-index.
Source h-Indexg-Indexm-IndexTCNPPY Start
Sustainability (Switzerland)12203583772019
Tourism Geographies12154769152020
Journal of Sustainable Tourism 7102.33129102020
Transport Policy 481.3311282020
Transportation Research Interdisciplinary Perspectives 441.339242020
Current Issues in Tourism 381.56992021
European Transport Research Review 331.52032021
International Journal of Environmental Research and Public Health 3412742020
International Journal of Hospitality Management 331.54532021
Journal of Air Transport Management 3317632020
Science of the Total Environment 341.55842021
Sustainable Cities and Society 341.52342021
Worldwide Hospitality and Tourism Themes 3411962020
African Journal of Hospitality, Tourism and Leisure 221422021
Energies 220.671422020
Source: own elaboration. Note: PY Start—year of 1st publication; NP—no. of publications; TC—total citations.
Table 3. Frequency distribution of authors’ keywords and keywords plus.
Authors’ KeywordsKeywords Plus
KeywordRank (r)Frequency (f)Product (r*f)KeywordRank (r)Frequency (f)Product (r*f)
COVID-191179179COVID-191131131
Sustainability270140Sustainability280160
Sustainable Tourism354162Sustainable Development359177
Tourism453212Epidemic447188
Sustainable Development533165Viral Disease547235
Pandemic628168Tourism646276
COVID-19 Pandemic727189Ecotourism734238
Resilience813104Tourism Development833264
Coronavirus912108Coronavirus931279
Overtourism1012120Pandemic1031310
Climate Change1111121Tourist Destination1126286
Sustainable Development Goals1211132Travel Behavior1225300
Social Distancing138104Perception1323299
Crisis14798Tourism Management1422308
Hospitality157105United States1521315
Source: own elaboration.
Table 4. Top 10 articles according to total citations.
TitleAuthorsSourcePYTC
“Pandemics, transformations and tourism: be careful what you wish for” C. Michael Hall, Daniel Scott, and Stefan Gössling Tourism Geographies 2020235
“The COVID-19 crisis as an opportunity for escaping the unsustainable global tourism path” Dimitri Ioannides and Szilvia Gyimóthy Tourism Geographies 2020108
“Innovative ‘Bring-Service-Near-Your-Home’ operations under Corona-Virus (COVID-19/SARS-CoV-2) outbreak: Can logistics become the Messiah?” Tsan-Ming Choi Transportation Research Part E: Logistics and Transportation Review 2020102
“A critical analysis of the impacts of COVID-19 on the global economy and ecosystems and opportunities for circular economy strategies” T. Ibn-Mohammed, K.B. Mustapha, J. Godsell, Z. Adamu, K.A. Babatunde, D.D. Akintade, A. Acquaye, H. Fujii, M.M. Ndiaye, F.A. Yamoah, and S.C.L. Koh Resources, Conservation and Recycling 202191
“Reset Sustainable Development Goals for a pandemic world” Robin Naidoo and Brendan Fisher Nature 202082
“How is COVID-19 reshaping activity-travel behavior? Evidence from a comprehensive survey in Chicago” Ali Shamshiripour, Ehsan Rahimi, Ramin Shabanpour, and Abolfazl (Kouros) Mohammadian Transportation Research Interdisciplinary Perspectives 202075
“COVID-19: from temporary de-globalisation to a re-discovery of tourism?” Piotr Niewiadomski Tourism Geographies 202071
“The COVID-19 crisis: Opportunities for sustainable and proximity tourism” Francesc Romagosa Tourism Geographies 202069
“Impact of COVID-19 on the travel and tourism industry” Marinko Škare, Domingo Riberio Soriano, and Małgorzata Porada-Rochoń Technological Forecasting and Social Change 202168
“Environmental effects of COVID-19 pandemic and potential strategies of sustainability” Tanjena Rume and S.M. Didar-Ul Islam Heliyon 202065
Source: own elaboration. Note: PY—publication year; TC—total citations.
Table 5. Summary of major findings.
S. No. Objective Findings
1 Research trend Excluding one article that was published in 2019, all were published in 2020 (n = 107) and 2021 (332), showing a growth rate of 210.28%. A total of 440 documents were produced by authors of 793 institutions in 81 countries. The 1351 authors of 440 documents reveal there are 0.33 documents per author and 3.07 authors per document. Of 440 documents, 71 were single authored, representing a collaboration index of 3.47.
2 Authors’ productivity Cheer JM (4), Castanho RA (3), Couto G (3), Dube K (3), Hall CM (3), Peters M (3), Pimentel P (3), Ronina-Ramrez R (3), Sousa (3), Szromek AR (3), Wang Y (3), Wu J (3), and Zhang H (3). All other authors produced two or one document.
Institutions’ productivity Griffith Univ. (11), Lund Univ. (7), Massey Univ. (7), Univ. of Azores (7), Univ. of Johannesburg (7), Univ. of Brasov (6), Univ. of Padova (6), and Univ. of Surrey (6). All other institutions produced five or less documents.
Countries’ productivity USA (105), Spain (92), China (82), Italy (63), Australia (62), UK (60), Portugal (44), India (37), Canada (26), Malaysia (26), and Indonesia (25). All other countries produced less than 25 documents.
3 Dissemination of scientific production by sources Sustainability (121), Journal of Sustainable Tourism (17), Tourism Geographies (16), Current Issues in Tourism (13), Transport Policy (12), and Worldwide Hospitality and Tourism Themes (10). All other journals produced less than 10 documents.
Sources dynamics The only article in 2019 was published in the journal Sustainability. The most prolific journals in 2020 were Sustainability (33), Tourism Geographies (14), Journal of Sustainable Tourism (6), and Worldwide Hospitality and Tourism Themes (6). The sequence in 2021 was Sustainability (87), Current Issues in Tourism (13), Journal of Sustainable Tourism (11), and Transport Policy (11).
4 Content of publications according to authors’ keywords “COVID-19” (179), “Sustainability” (70), “Sustainable Tourism” (54), “Tourism” (53), and “Sustainable development” (33). Other important keywords include “Resilience” (13), “Overtourism” (12), “Climate Change” (12), and “SDGs” (11).
Content of publications according to keywords plus “COVID-19” (131), “Sustainability” (80), “Sustainable Development” (59), “Epidemic” (47), and “Viral Disease” (47). Other important keywords plus include “Ecotourism” (34), “Tourism Development” (33), “Travel Behavior” (25), “Perception” (23), and “Tourism Management” (22).
5 Top publications according to total citations Hall et al., 2020 (DOI: 10.1080/14616688.2020.1759131); Ioannides and Gyimóthy, 2020 (DOI: 10.1080/14616688.2020.1763445); Ibn-Mohammed et al., 2021 (DOI: 10.1016/j.resconrec.2020.105169); Naidoo and Fisher, 2020 (DOI: 10.1038/d41586-020-01999-x); Shamshiripour et al., 2020 (DOI: 10.1016/j.trip.2020.100216)
6 Conceptual structure of knowledge Cluster 1 includes keywords related to the management and sustainable development of tourism, such as “COVID-19”, “risk assessment”, “governance approach”, “strategic approach”, “emission control”, “SDGs”, etc.
Cluster 2 includes keywords related to environmental health, such as “envi. Protection”, “biodiversity”, “greenhouse gas”, “carbon footprints”, etc.
Cluster 3 includes keywords related to mobility trends, such as “cycle transport”, “car use”, “transportation policy”, “public transport”, “travel behavior”, etc.
Intellectual structure of knowledge Cluster 1: Han, H.; Wang, Y.; and Li, Y., are the leading authors based on co-citations. Their documents were related to “travel trends amid COVID-19”.
Cluster 2: Gossling, S., Hall, C.M., Scott, D., Higgins-Desbiolles, F, Cheer, J.M., and Higham, J. are among the most prolific authors. Their documents are related to “transformative opportunities for sustainability”.
Cluster 3: Sigala, M.; Dolnicar, S.; and Xiang, Z., are among the key authors. These documents are related to “COVID-19 impacts and tourism response”
Social structure of knowledge Authors’ collaboration: 4 clusters of authors’ collaboration were resulted, and the most prolific authors per cluster are Mandić, A.; Newsome, D.; Naidoo, R.; and Spenceley, A.
Institutions’ collaboration: A collaboration network of 20 organizations resulted based on the co-authorship of documents. Most of these organizations are located in the USA (5) and Canada (4).
Countries’ collaboration: Based on the co-authorship network, the strongest collaboration was observed among China, Australia, the UK, the US, and Japan.
Source: own elaboration.
Publisher’s Note: MDPI stays neutral with regard to jurisdictional claims in published maps and institutional affiliations.