
Despite Being Distinguished as the 2020 European Green Capital, Lisbon Has Lost Public Green Areas over the Previous Decade

 ,
, 
Abstract
:1. Introduction
2. Materials and Methods
2.1. Study Area
2.2. Data Collection (Urban Vegetation Cover and Population)
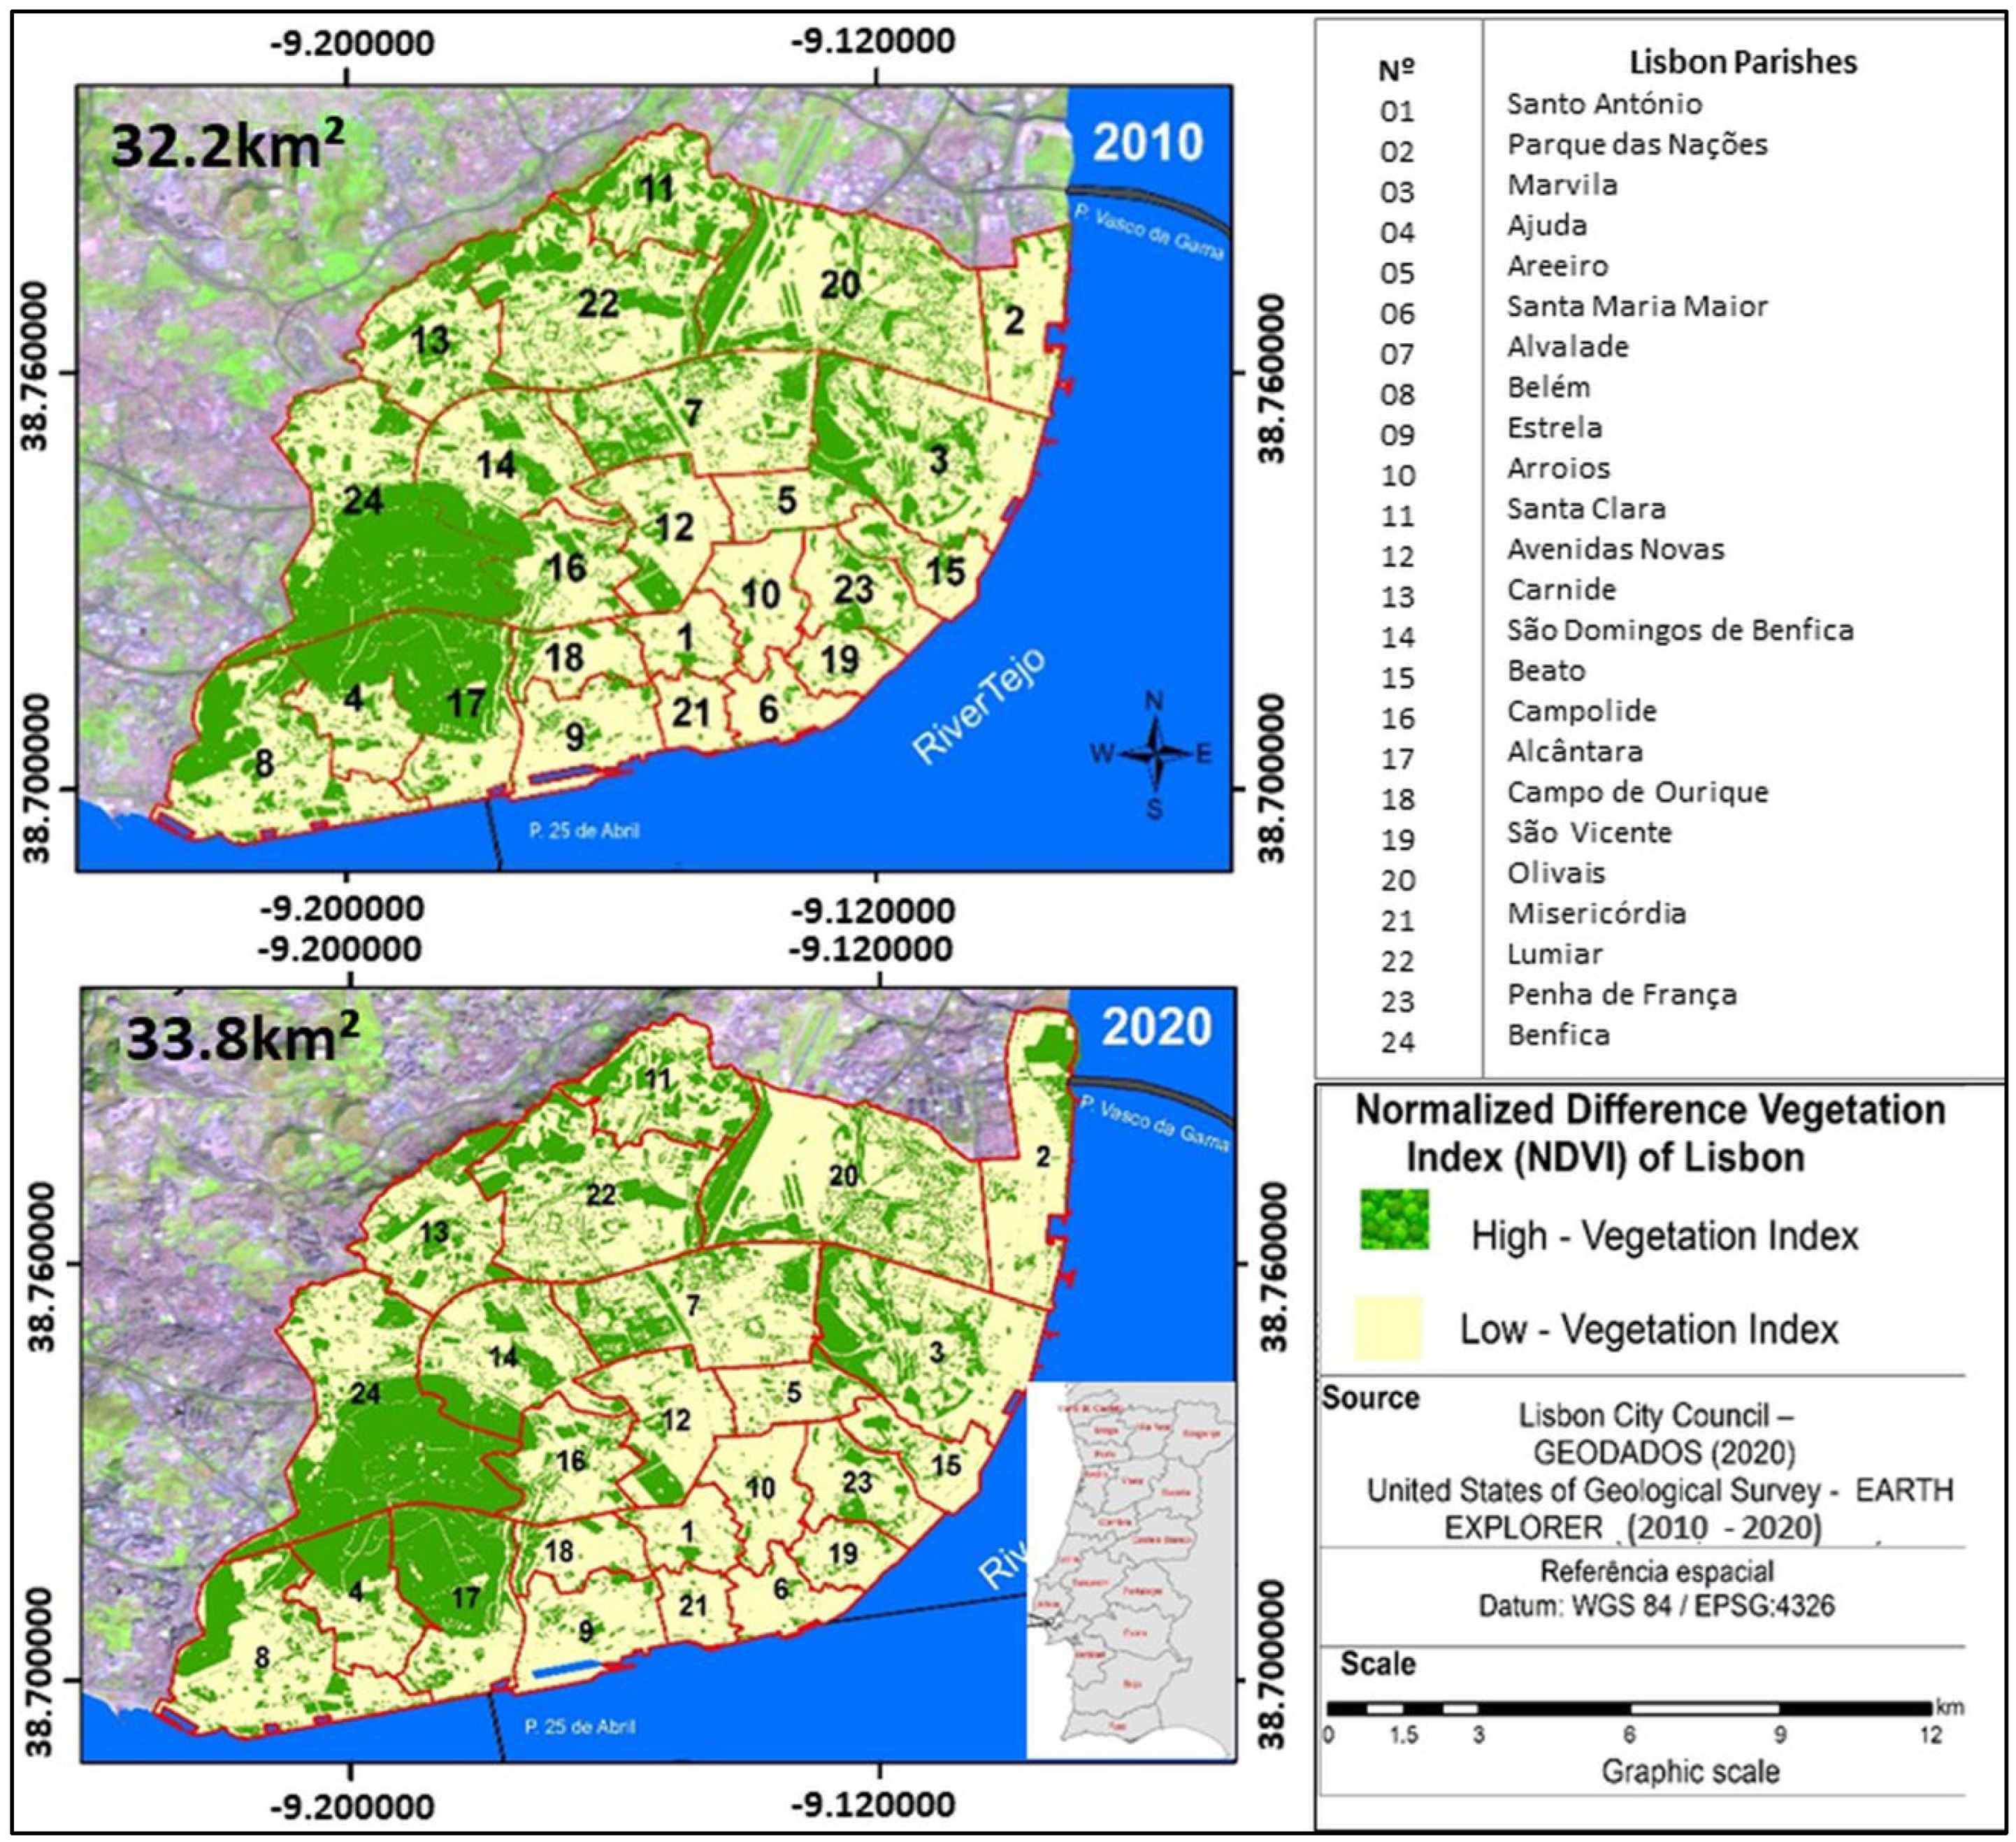
Satellite Image Analysis and Mapping
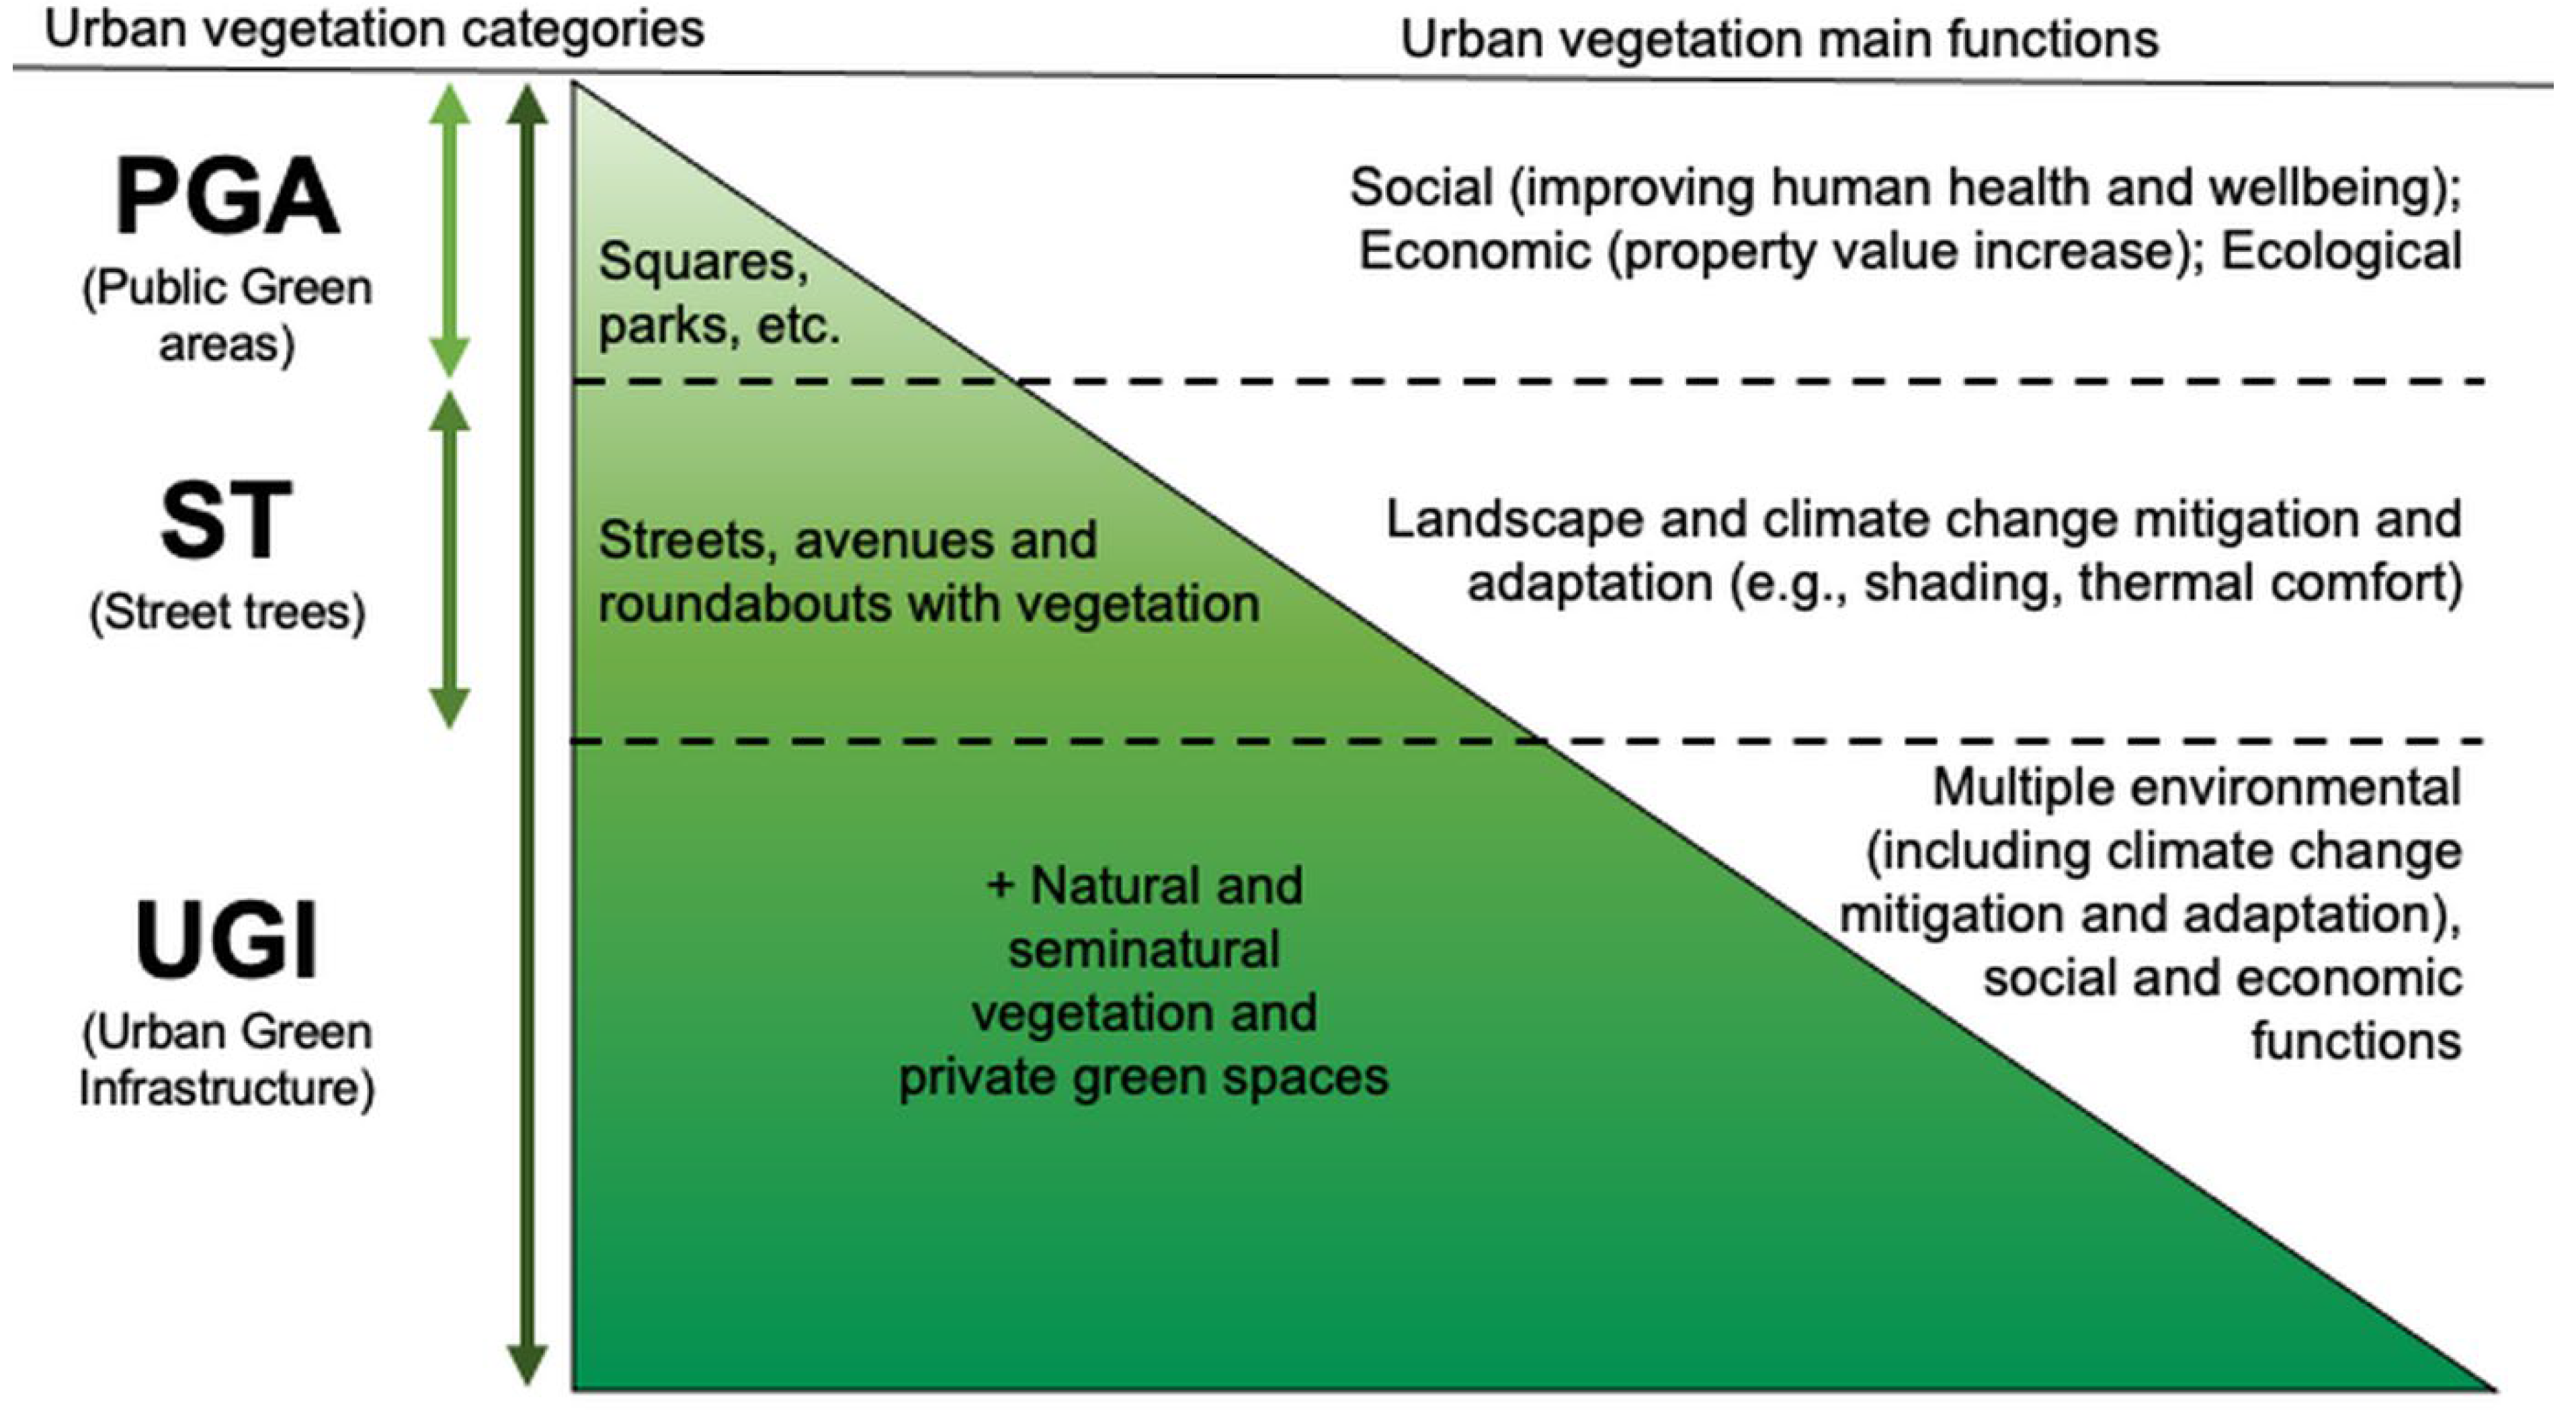
2.3. Urban Vegetation Indicators and Calculations
- (i)
- (ii)
- (i)
- (ii)
- (iii)
3. Results
3.1. Changes in Lisbon’s Vegetation Cover: City Scale
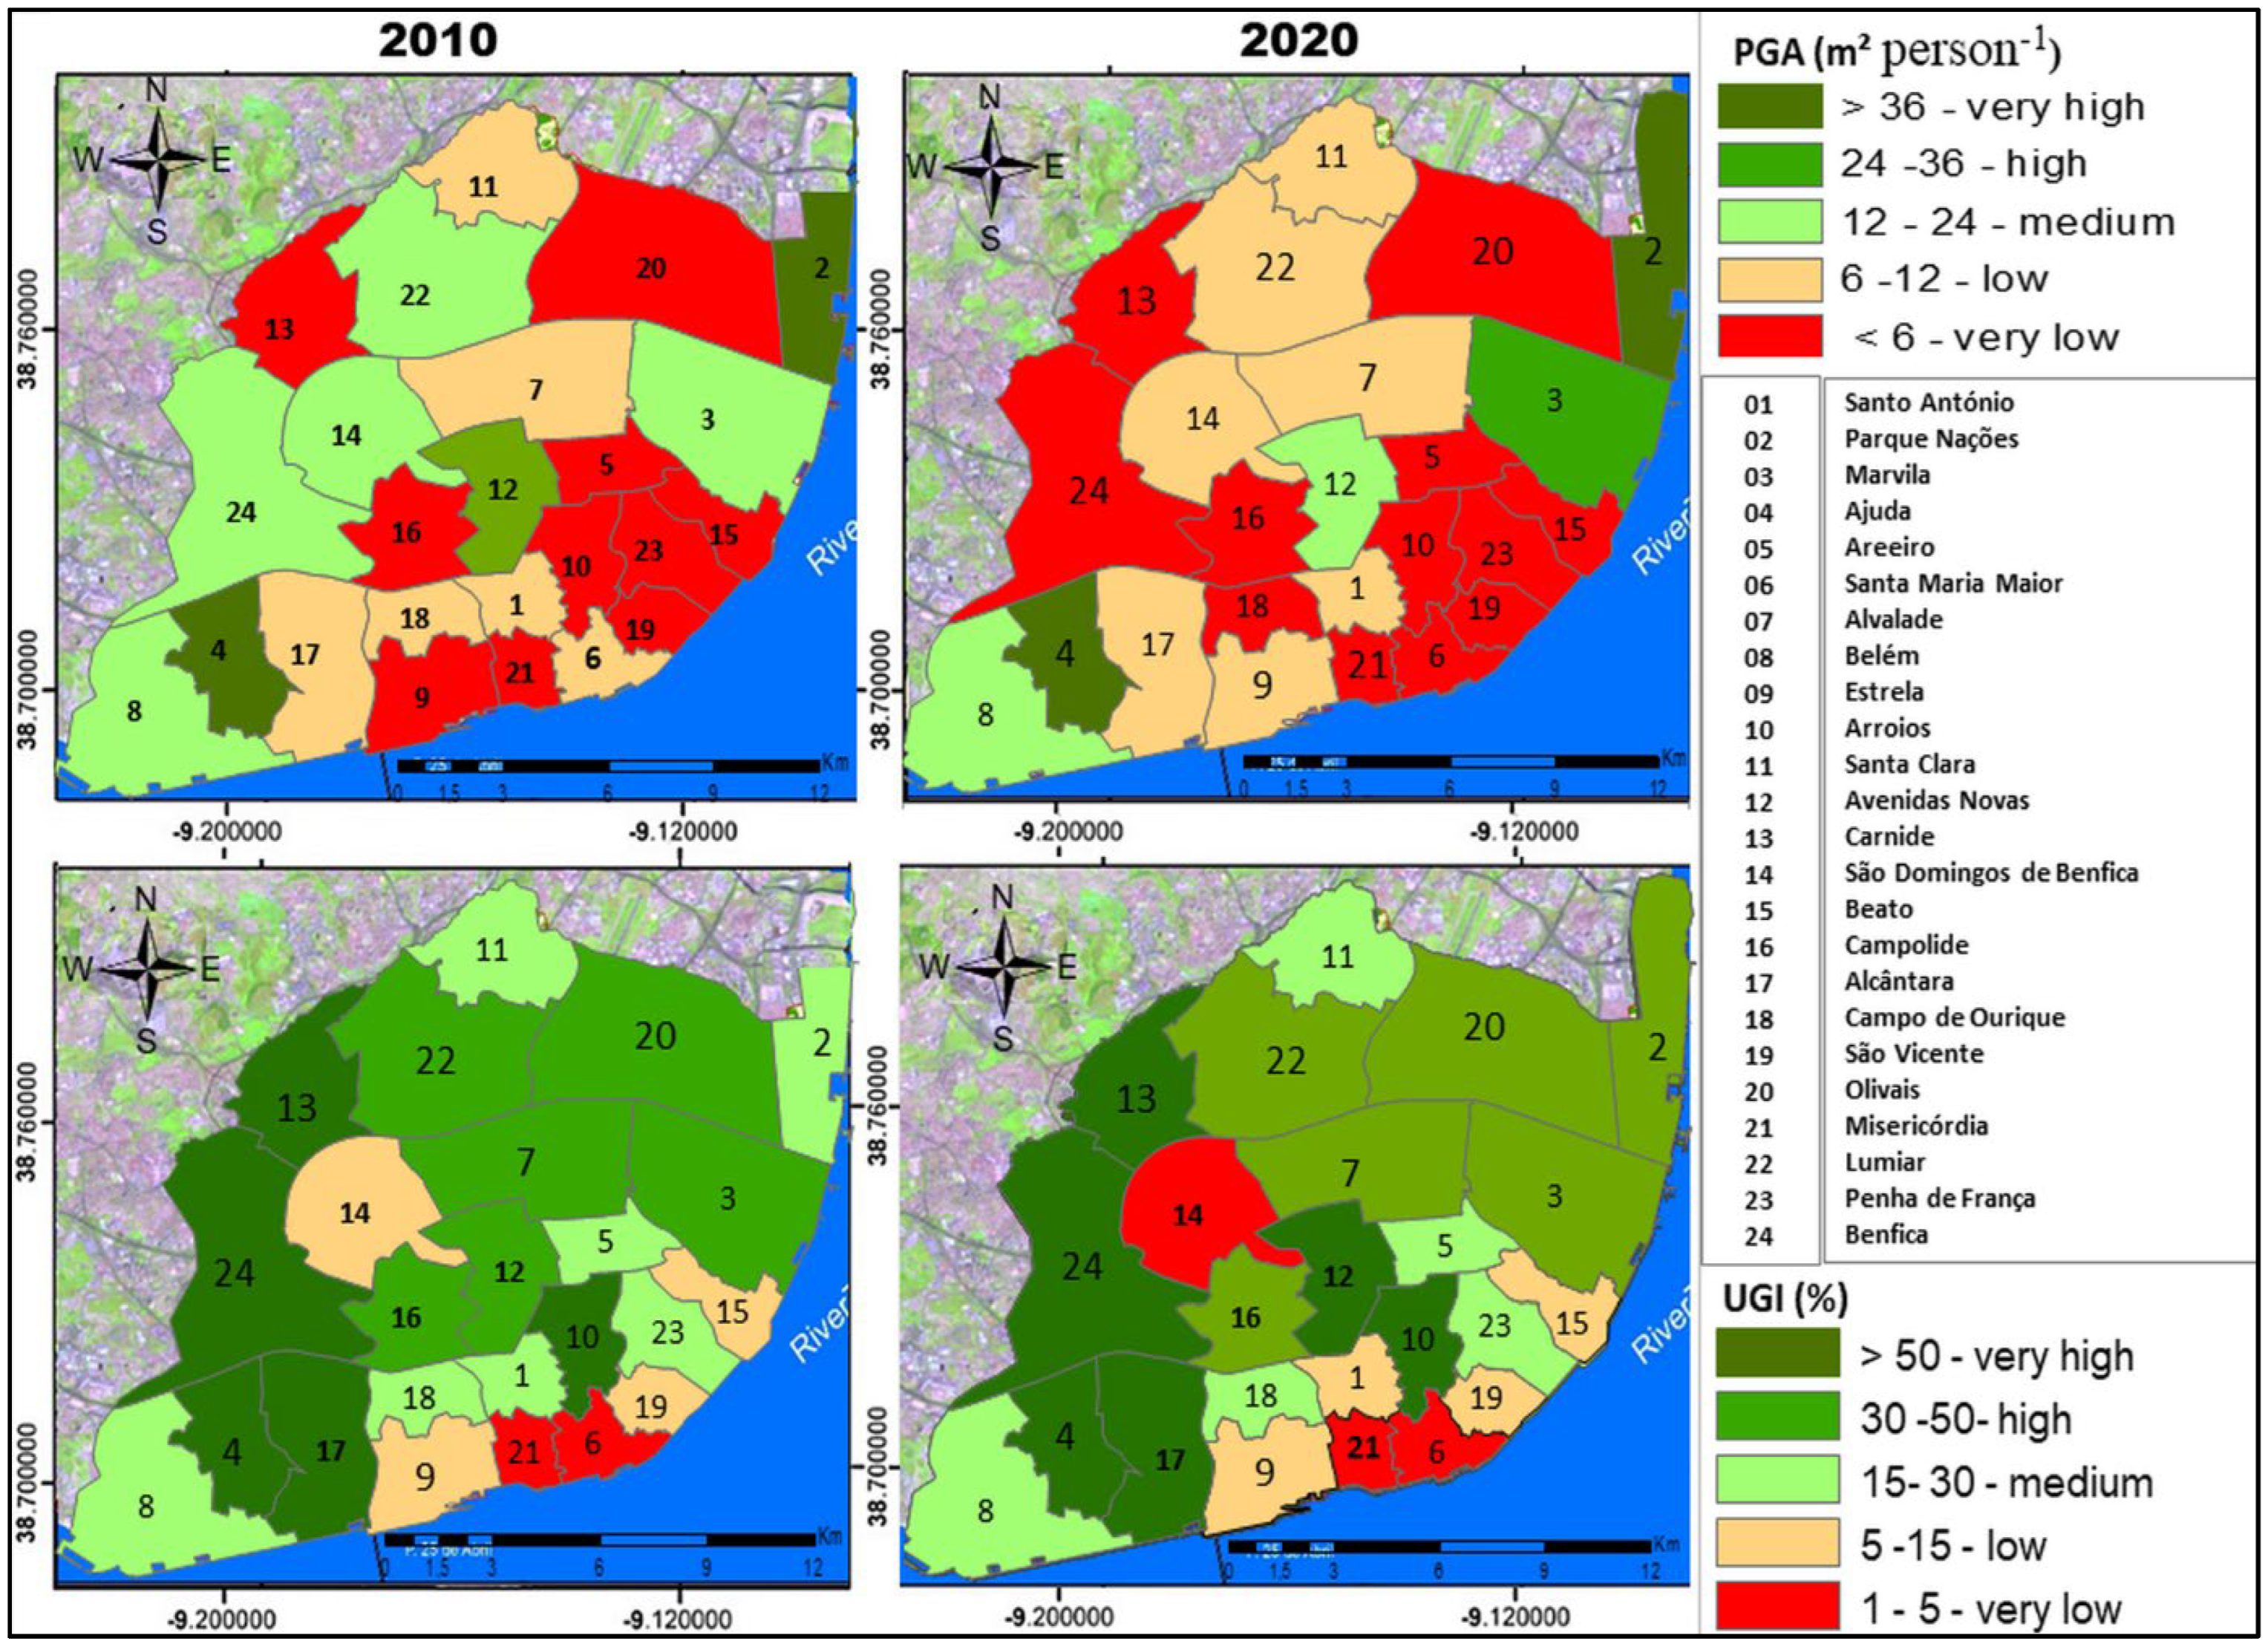
3.2. Changes in Lisbon’s Vegetation Cover: Parish Scale
4. Discussion
4.1. Changes in Lisbon’s Vegetation between 2010 and 2020
- (i)
- The reduction of urban vegetation due to land use changes: 13% less naturalized areas due to abandonment, 14% less natural vegetation due to the recovery of the Portuguese Navy in Parque das Nações, 1% less due to the reduction of vegetable gardens and undifferentiated agriculture and some illegal gardens, and the deforestation of eucalyptus trees in the airport region [40]. Furthermore, there was an increase in the built-up area. Although in 2010 Portugal was experiencing a serious economic crisis, in the 2010–2020 decade there was an economic recovery and consequent stimulus of the real estate market in Lisbon. Proof of this is the fact that in 2020 there was a 154% growth in the number of completed buildings in the Lisbon Metropolitan Area compared to 2015 [41]. This increase in completed buildings will have forced, in many cases, the conversion of green spaces (e.g., natural and semi-natural areas) into urbanized areas.
- (ii)
- The precipitation reduction which, in a Mediterranean climate city such as Lisbon, greatly affects plant growth and survival. While 2010 was the wettest year in Lisbon since records began [42], the decade 2011–2020 was the second-driest in mainland Portugal since 1931. Although the rainfall in 2020 reached 85% of the normal value [43], it is likely that the low precipitation between 2010 and 2020 affected plant growth and survival, which may have contributed to a reduction in urban vegetation, and to lower estimates of the UGI area.
4.2. How Can We Measure Changes in Urban Vegetation Cover?
- (i)
- Only public areas to which all citizens have access: This would exclude private zones that could provide numerous environmental and human wellbeing benefits [51,52]. However, only the status of public green space (i.e., PGA and ST) guarantees access for the entire population, and in accordance, the PGA category was used to define the green areas per resident indicator [26].
- (ii)
- Only vegetation with maintenance: This would exclude the natural and semi-natural vegetation which strongly contributes to the UGI, and plays important ecosystem benefits and services, namely, in climate change adaptation and mitigation [53,54,55], and in accordance, this category was used to define the % of urban vegetation [28]. However, people prefer green spaces that are not too “wild” and with spaced trees [56] so that the areas with natural and semi-natural vegetation may not meet the necessary conditions of perceived safety and comfort necessary for recreational use and for some social groups (e.g., children, elderly, or people with reduced mobility).
5. Conclusions
Supplementary Materials
Author Contributions
Funding
Data Availability Statement
Acknowledgments
Conflicts of Interest
References
- UN. World Urbanization Prospects 2018-Highlights; United Nations: New York, NY, USA, 2019; Contract No.: ST/ESA/SER.A/421. [Google Scholar]
- Peng, J.; Tian, L.; Liu, Y.X.; Zhao, M.Y.; Hu, Y.N.; Wu, J.S. Ecosystem services response to urbanization in metropolitan areas: Thresholds identification. Sci. Total Environ. 2017, 607, 706–714. [Google Scholar] [CrossRef]
- Luo, W.; Bai, H.T.; Jing, Q.N.; Liu, T.; Xu, H. Urbanization-induced ecological degradation in Midwestern China: An analysis based on an improved ecological footprint model. Resour. Conserv. Recy. 2018, 137, 113–125. [Google Scholar] [CrossRef]
- Zhang, X.; Han, L.; Wei, H.; Tan, X.; Zhou, W.; Li, W.; Qian, Y. Linking urbanization and air quality together: A review and a perspective on the future sustainable urban development. J. Clean. Prod. 2022, 346, 130988. [Google Scholar] [CrossRef]
- Basner, M.; Babisch, W.; Davis, A.; Brink, M.; Clark, C.; Janssen, S.; Stansfeld, S. Auditory and non-auditory effects of noise on health. Lancet 2014, 383, 1325–1332. [Google Scholar] [CrossRef]
- van Kempen, E.; Babisch, W. The quantitative relationship between road traffic noise and hypertension: A meta-analysis. J. Hypertens. 2012, 30, 1075–1086. [Google Scholar] [CrossRef]
- Lin, L.; Di, L.P.; Zhang, C.; Guo, L.Y.; Di, Y.H. Remote Sensing of Urban Poverty and Gentrification. Remote Sens. 2021, 13, 4022. [Google Scholar] [CrossRef]
- Diez, E.; Morrison, J.; Pons-Vigues, M.; Borrell, C.; Corman, D.; Burstrom, B.; Dominguez-Berjón, F.; Gandarillas, A.; Hoffmann, R.; Santana, P.; et al. Municipal interventions against inequalities in health: The view of their managers. Scand. J. Public Health 2014, 42, 476–487. [Google Scholar] [CrossRef]
- Frenkel, A.; Israel, E. Spatial inequality in the context of city-suburb cleavages-Enlarging the framework of well-being and social inequality. Landsc. Urban Plan. 2018, 177, 328–339. [Google Scholar] [CrossRef]
- Satur, P.; Lindsay, J. Social inequality and water use in Australian cities: The social gradient in domestic water use. Local Environ. 2020, 25, 351–364. [Google Scholar] [CrossRef]
- Sarkar, C.; Webster, C. Urban environments and human health: Current trends and future directions. Curr. Opin. Environ. Sust. 2017, 25, 33–44. [Google Scholar] [CrossRef]
- Ventriglio, A.; Torales, J.; Castaldelli-Maia, J.M.; De Berardis, D.; Bhugra, D. Urbanization and emerging mental health issues. CNS Spectr. 2021, 26, 43–50. [Google Scholar] [CrossRef] [PubMed]
- Pacione, M. Urban environmental quality and human wellbeing-a social geographical perspective. Landsc. Urban Plan. 2003, 65, 21–32. [Google Scholar] [CrossRef]
- Siqueiros-García, J.M.; Manuel-Navarrete, D.; Eakin, H.; Mojica, L.; Charli-Joseph, L.; Pérez-Belmont, P.; Ruizpalacios, B. Sense of agency, affectivity and social-ecological degradation: An enactive and phenomenological approach. Front. Psychol. 2022, 13, 911092. [Google Scholar] [CrossRef]
- Tan, Y.T.; Xu, H.; Zhang, X.L. Sustainable urbanization in China: A comprehensive literature review. Cities 2016, 55, 82–93. [Google Scholar] [CrossRef]
- Khatri, A. Message to mayors: Cities need nature. Nature 2022, 601, 299. [Google Scholar] [CrossRef]
- CML. Plano Diretor Municipal de Lisboa. 2012. Available online: https://dre.pt/dre/analise-juridica/aviso/11622-2012-1787349 (accessed on 7 June 2021).
- Isaifan, R.J.; Baldauf, R.W. Estimating economic and environmental benefits of urban trees in desert regions. Front. Ecol. Evol. 2020, 8, 16. [Google Scholar] [CrossRef]
- Carrus, G.; Scopelliti, M.; Lafortezza, R.; Colangelo, G.; Ferrini, F.; Salbitano, F.; Agrimi, M.; Portoghesi, L.; Semenzato, P.; Sanesi, G. Go greener, feel better? The positive effects of biodiversity on the well-being of individuals visiting, urban and peri-urban green areas. Landsc. Urban Plan. 2015, 134, 221–228. [Google Scholar] [CrossRef]
- de Almeida, J.R.; Nunes, R.D.; Dias, T. People prefer greener corridors: Evidence from linking the patterns of tree and shrub diversity and users’ preferences in Lisbon’s green corridors. Sustainability 2021, 13, 13228. [Google Scholar] [CrossRef]
- Espeland, E.K.; Kettenring, K.M. Strategic plant choices can alleviate climate change impacts: A review. J. Environ. Manag. 2018, 222, 316–324. [Google Scholar] [CrossRef]
- Demuzere, M.; Orru, K.; Heidrich, O.; Olazabal, E.; Geneletti, D.; Orru, H.; Bhave, A.G.; Mittal, N.; Feliú, E.; Faehnle, M. Mitigating and adapting to climate change: Multi-functional and multi-scale assessment of green urban infrastructure. J. Environ. Manag. 2014, 146, 107–115. [Google Scholar] [CrossRef]
- Carvalho, A.; Schmidt, L.; Santos, F.D.; Delicado, A. Climate change research and policy in Portugal. WIRes. Clim. Chang. 2014, 5, 199–217. [Google Scholar] [CrossRef]
- Arbaci, S.; Tapada-Berteli, T. Social inequality and urban regeneration in Barcelona city centre: Reconsidering success. Eur. Urban Reg. Stud. 2012, 19, 287–311. [Google Scholar] [CrossRef]
- Jack, M. Queen of the seas: A history of Lisbon. Tls-Times Lit. Suppl. 2019, 26. [Google Scholar]
- Matias, L.F.; Caporusso, D. Áreas verdes urbanas: Avaliação conceitual e metodológica a partir do estudo de caso na cidade de Paulínia-São Paulo, Brasil. Soc. E Nat. 2009, 143–156. [Google Scholar]
- Lucon, T.N.; Prado Filho, J.F.d.; Sobreira, F.G. Índice e percentual de áreas verdes para o perímetro urbano de Ouro Preto–MG. Rev. Soc. Bras. Arborização Urbana 2013, 8, 63–78. [Google Scholar] [CrossRef]
- Nucci, J.C. Qualidade Ambiental e Adensamento Urbano: Um Estudo de Ecologia e Planejamento da Paisagem Aplicado ao Distrito de Santa Cecília (MSP), 2nd ed.; The Author: Curitiba, Spain, 2008; 150p. [Google Scholar]
- de Almeida, J.R. Gestão de áreas verdes e sustentabilidade: Estudo de caso a partir dos indicadores de qualidade ambiental urbana. Paisag. E Ambiente 2021, 32, e183164. [Google Scholar] [CrossRef]
- Moreno, R.; Ojeda, N.; Azocar, J.; Venegas, C.; Inostroza, L. Application of NDVI for identify potentiality of the urban forest for the design of a green corridors system in intermediary cities of Latin America: Case study, Temuco, Chile. Urban For. Urban Gree. 2020, 55, 126821. [Google Scholar] [CrossRef]
- Pedras, C.M.G.; Fernandez, H.M.; Lanca, R.; Granja-Martins, F. Applying remote sensing technologies in urban landscapes of the Mediterranean. Agriengineering 2020, 2, 27–36. [Google Scholar] [CrossRef]
- CML. Biodiversidade na cidade de Lisboa. In Uma Estratégia para 2020; Câmara Municipal de Lisboa: Lisboa, Portugal, 2015. [Google Scholar]
- da Silva, A.G.A.; Stattegger, K.; Vital, H.; Schwarzer, K. Coastline change and offshore suspended sediment dynamics in a naturally developing delta (Parnaiba Delta, NE Brazil). Mar. Geol. 2019, 410, 1–15. [Google Scholar] [CrossRef]
- Chavez, P.S. Image-based atmospheric corrections revisited and improved. Photogramm. Eng. Remote Sens. 1996, 62, 1025–1036. [Google Scholar]
- Chavez, P.S. An improved dark-object subtraction technique for atmospheric scattering correction of multispectral data. Remote Sens. Environ. 1988, 24, 459–479. [Google Scholar] [CrossRef]
- Deering, D.W.; Rouse, J.W.; Haas, J.R.H.; Schell, J.A. (Eds.) Measuring forage production of grazing units from Landsat MSS data. In Proceedings of the 10th International Symposium on Remote Sensing of Environment, Ann Arbor, MI, USA, 6 October 1975; University of Michigan: Ann Arbor, MI, USA. [Google Scholar]
- Rouse Wilson, J.; Haas, R.H.; Deering, D.W.; Schell, J.A.; Harlan, J.C. Monitoring the Vernal Advancement and Retrogradation (Green Wave Effect) of Natural Vegetation; Remote Sensing Center: Bergen, Norway, 1973; Contract No.: (NTIS No. E73-106393). [Google Scholar]
- Tucker, C.J. Red and photographic Infrared linear combinations for monitoring vegetation. Remote Sens. Environ. 1979, 8, 127–150. [Google Scholar] [CrossRef]
- Gameiro, S.; Teixeira, C.P.B.; Silva Neto, T.A.; Lopes, M.F.L.; Duarte, C.R.; Souto, M.V.S.; Zimback, C.R.L. Avaliação da cobertura vegetal por meio de índices de vegetação (NDVI, SAVI e IAF) na Sub-Bacia Hidrográfica do Baixo Jaguaribe, CE. Terrae 2016, 13, 15–22. [Google Scholar]
- CML. Plano de Ação Local para a Biodiversidade de Lisboa (BioDiversidade Lisboa 2020)–Relatório de Progresso; Câmara Municipal de Lisboa: Lisboa, Portugal, 2018. [Google Scholar]
- INE. Estatísticas da Construção e Habitação 2020; Instituto Nacional de Estatística: Lisboa, Portugal, 2021. [Google Scholar]
- IM. Boletim Climatológico Anual ano 2010. 2011. Available online: https://www.ipma.pt/resources.www/docs/im.publicacoes/edicoes.online/20110204/PdTzSQuJAvrrwvtcdtee/cli_20100101_20101231_pcl_aa_co_pt.pdf (accessed on 30 August 2022).
- IPMA. Resumo Climatológico ano 2020. 2021. Available online: https://www.ipma.pt/resources.www/docs/im.publicacoes/edicoes.online/20210121/YHyABDoAHxtxDLEPUkVt/cli_20201201_20201231_pcl_aa_co_pt.pdf (accessed on 30 August 2022).
- Santos, T.; Silva, C.; Tenedorio, J.A. Modelling urban thermal comfort: Evaluating the impact of the urban requalification project of Praça Duque de Saldanha and Avenida da República in Lisbon. In Proceedings of the 3rd International Conference on Geographical Information Systems Theory, Applications and Management, Porto, Portugal, 27–28 April 2017; pp. 70–80. [Google Scholar] [CrossRef]
- CML. Corredores verdes. In Programa para a Estrutura Verde da Cidade; Câmara Municipal de Lisboa: Lisboa, Portugal, 2019. [Google Scholar]
- Ferreira, J.C.; Machado, J.R. Infra-estruturas verdes para um futuro urbano sustentável. O contributo da estrutura ecológica e dos corredores verdes. Rev. Labverde 2010, 1, 69–90. [Google Scholar] [CrossRef]
- Versini, P.A.; Gires, A.; Tchiguirinskaia, I.; Schertzer, D. Fractal analysis of green roof spatial implementation in European cities. Urban For. Urban Green. 2020, 49, 126629. [Google Scholar] [CrossRef]
- Lotfi, Y.A.; Refaat, M.; El Attar, M.; Salam, A.A. Vertical gardens as a restorative tool in urban spaces of New Cairo. Ain Shams Eng. J. 2020, 11, 839–848. [Google Scholar] [CrossRef]
- Hamidon, M.H.; Abd Aziz, S.; Ahamed, T.; Mahadi, M.R. Design and development of smart vertical garden system for urban agriculture initiative in Malaysia. J. Teknol. 2020, 82, 19–27. [Google Scholar] [CrossRef]
- Girardi, A. Milan: The grey city is going green. Forbes 2019. Available online: https://www.forbes.com/sites/annalisagirardi/2019/01/10/milan-the-gray-city-is-going-green/?sh=5ed97d81d9f4 (accessed on 28 December 2021).
- Cilliers, S.; Cilliers, J.; Lubbe, R.; Siebert, S. Ecosystem services of urban green spaces in African countries-perspectives and challenges. Urban Ecosyst. 2013, 16, 681–702. [Google Scholar] [CrossRef]
- Khalilnezhad, M.R.; Ugolini, F.; Massetti, L. Attitudes and behaviors toward the use of public and private green space during the COVID-19 pandemic in Iran. Land 2021, 10, 1085. [Google Scholar] [CrossRef]
- du Toit, M.J.; Cilliers, S.S.; Dallimer, M.; Goddard, M.; Guenat, S.; Cornelius, S.F. Urban green infrastructure and ecosystem services in sub-Saharan Africa. Landsc. Urban Plan. 2018, 180, 249–261. [Google Scholar] [CrossRef]
- Elliott, R.M.; Motzny, A.E.; Majd, S.; Chavez, F.J.V.; Laimer, D.; Orlove, B.S.; Culligan, P.J. Identifying linkages between urban green infrastructure and ecosystem services using an expert opinion methodology. Ambio 2020, 49, 569–583. [Google Scholar] [CrossRef]
- Palliwoda, J.; Banzhaf, E.; Priess, J.A. How do the green components of urban green infrastructure influence the use of ecosystem services? Examples from Leipzig, Germany. Landsc. Ecol. 2020, 35, 1127–1142. [Google Scholar] [CrossRef]
- Campagnaro, T.; Vecchiato, D.; Arnberger, A.; Celegato, R.; Da Re, R.; Rizzetto, R.; Semenzatoa, P.; Sitziaa, T.; Tempestaa, Y.; Cattaneoa, D. General, stress relief and perceived safety preferences for green spaces in the historic city of Padua (Italy). Urban For. Urban Gree. 2020, 52, 126695. [Google Scholar] [CrossRef]
- SBAU. Sociedade Brasileira De Arborização Urbana-Carta a Londrina e Ibiporã. Bol. Inf. 1996, 3, 3. [Google Scholar]


| Indicator | 2010 | 2020 | ∆ (2020–2010) | |
|---|---|---|---|---|
| Urban vegetation | Based on PGA | 5,802,308 m2 | 5,712,700 m2 | ↓ 2% |
| Based on ST | 414,247 m2 | 570,658 m2 | ↑ 38% | |
| Based on UGI | 32,235,682 m2 | 33,818,324 m2 | ↑ 5% | |
| Urban vegetation per resident | Based on PGA * | 10.6 m2 pers−1 | 10.3 m2 pers−1 | ↓ 3% |
| Based on ST | 0.8 m2 pers−1 | 1.0 m2 pers−1 | ↑ 37% | |
| Based on UGI | 58.9 m2 pers−1 | 61.5 m2 pers−1 | ↑ 4% | |
| % of Urban vegetation | Based on PGA | 6.9% | 5.7% | ↓ 17% |
| Based on ST | 0.5% | 0.6% | ↑ 16% | |
| Based on UGI * | 38.2% | 33.8% | ↓ 12% |
| Parish | Changes in PGA Person−1 (∆ (2020–2010)/2010) | Changes in the % of UGI (∆ (2020–2010)/2010) |
|---|---|---|
| Ajuda | ↓ 26% | 0% |
| Alcântara | ↓ 39% | ↑ 7% |
| Alvalade | ↓ 22% | ↓ 4% |
| Areeiro | ↑ 68% | 0% |
| Arroios | ↑ 140% | 0% |
| Avenidas Novas | ↓ 32% | ↑ 9% |
| Beato | ↑ 11% | 0% |
| Belém | ↑ 18% | ↓ 10% |
| Benfica | ↓ 65% | ↑ 2% |
| Campo de Ourique | ↓ 94% | 0% |
| Campolide | ↓ 4% | ↑ 10% |
| Carnide | ↑ 30% | ↓ 2% |
| Estrela | ↑ 170% | ↑ 20% |
| Lumiar | ↓ 58% | ↓ 2% |
| Marvila | ↑ 59% | ↓ 3% |
| Misericórdia | ↓ 51% | 0% |
| Olivais | ↑ 46% | ↓ 7% |
| Parque das Nações | ↑ 1607% | ↑ 170% |
| Penha de França | ↓ 36% | ↑ 14% |
| Santa Clara | ↑ 7% | ↓ 4% |
| Santa Maria Maior | ↓ 80% | 0% |
| Santo António | ↓ 22% | ↓ 25% |
| S. Domingos de Benfica | ↓ 40% | ↓ 15% |
| São Vicente | ↓ 6% | 0% |
Publisher’s Note: MDPI stays neutral with regard to jurisdictional claims in published maps and institutional affiliations. |
© 2022 by the authors. Licensee MDPI, Basel, Switzerland. This article is an open access article distributed under the terms and conditions of the Creative Commons Attribution (CC BY) license (https://creativecommons.org/licenses/by/4.0/).
Share and Cite
de Almeida, J.R.; Alves, G.B.M.; Nunes, R.d.O.; Dias, T. Despite Being Distinguished as the 2020 European Green Capital, Lisbon Has Lost Public Green Areas over the Previous Decade. Sustainability 2022, 14, 12112. https://doi.org/10.3390/su141912112
de Almeida JR, Alves GBM, Nunes RdO, Dias T. Despite Being Distinguished as the 2020 European Green Capital, Lisbon Has Lost Public Green Areas over the Previous Decade. Sustainability. 2022; 14(19):12112. https://doi.org/10.3390/su141912112
Chicago/Turabian Stylede Almeida, Juscidalva Rodrigues, Gustavo Benedito Medeiros Alves, Reginaldo de Oliveira Nunes, and Teresa Dias. 2022. "Despite Being Distinguished as the 2020 European Green Capital, Lisbon Has Lost Public Green Areas over the Previous Decade" Sustainability 14, no. 19: 12112. https://doi.org/10.3390/su141912112
APA Stylede Almeida, J. R., Alves, G. B. M., Nunes, R. d. O., & Dias, T. (2022). Despite Being Distinguished as the 2020 European Green Capital, Lisbon Has Lost Public Green Areas over the Previous Decade. Sustainability, 14(19), 12112. https://doi.org/10.3390/su141912112