Selection of Potential Sites for Promoting Small-Scale Irrigation across Mali Using Remote Sensing and GIS
Abstract
1. Introduction
2. Materials and Methods
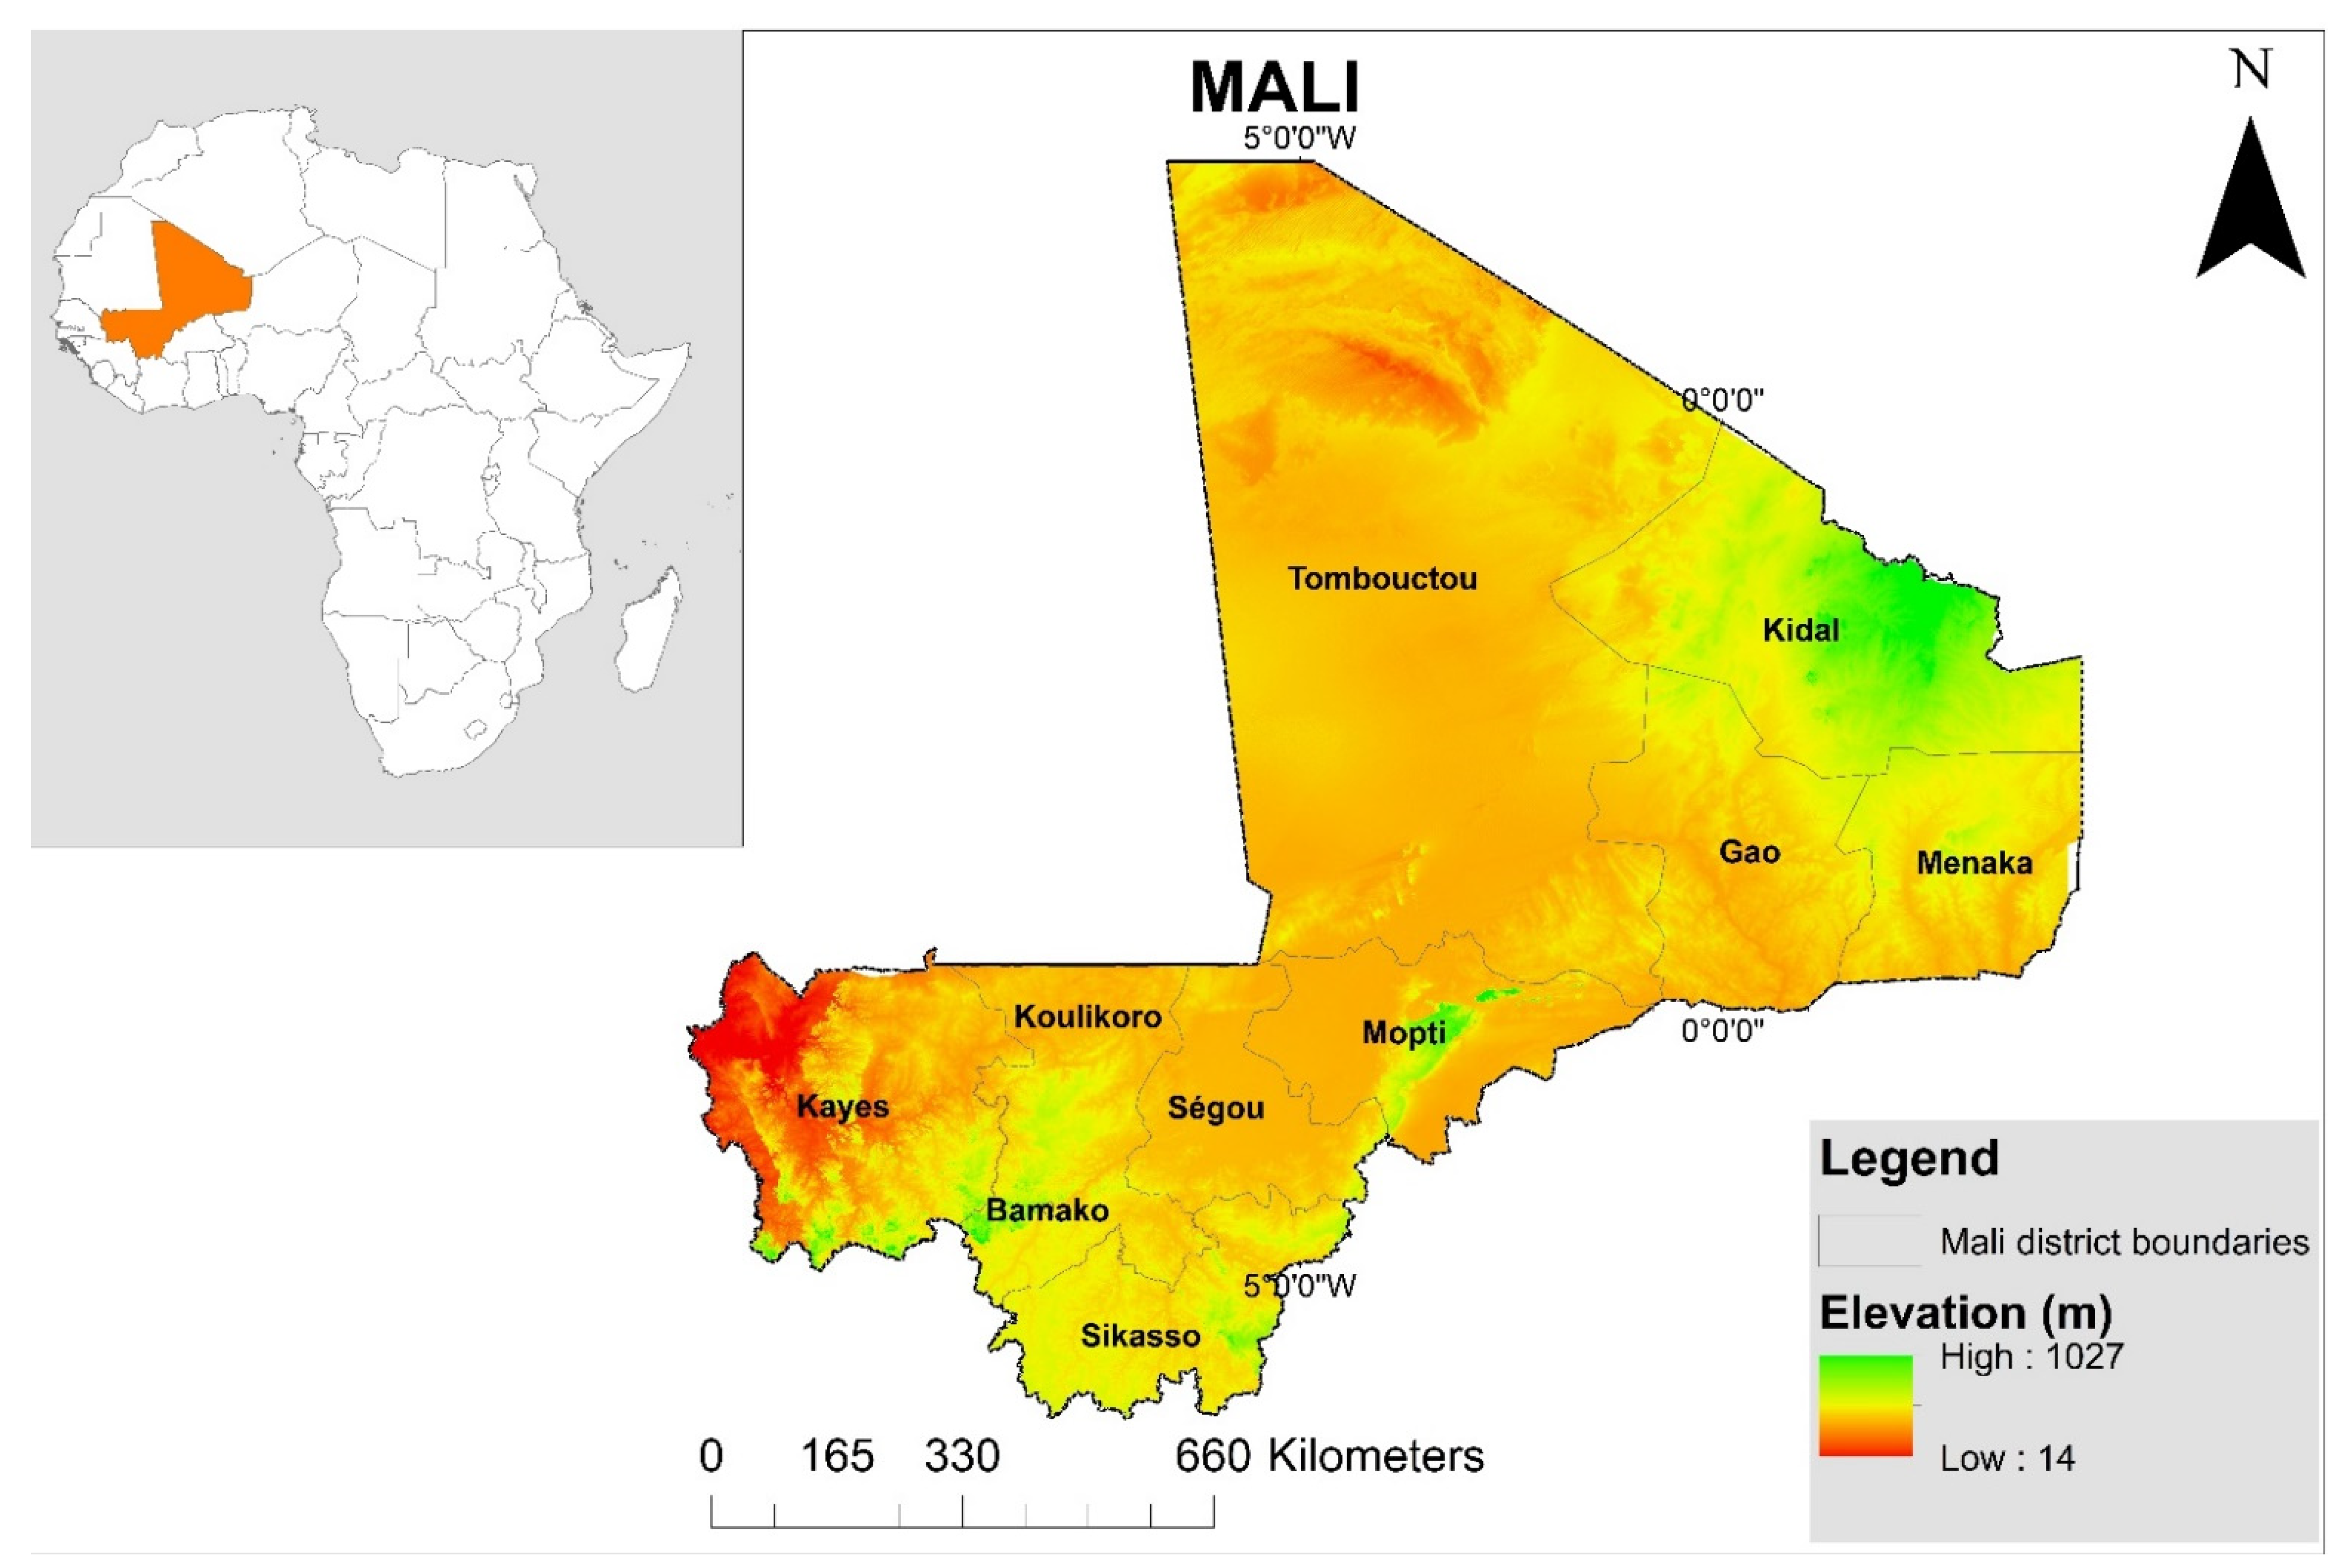
2.1. Study Area
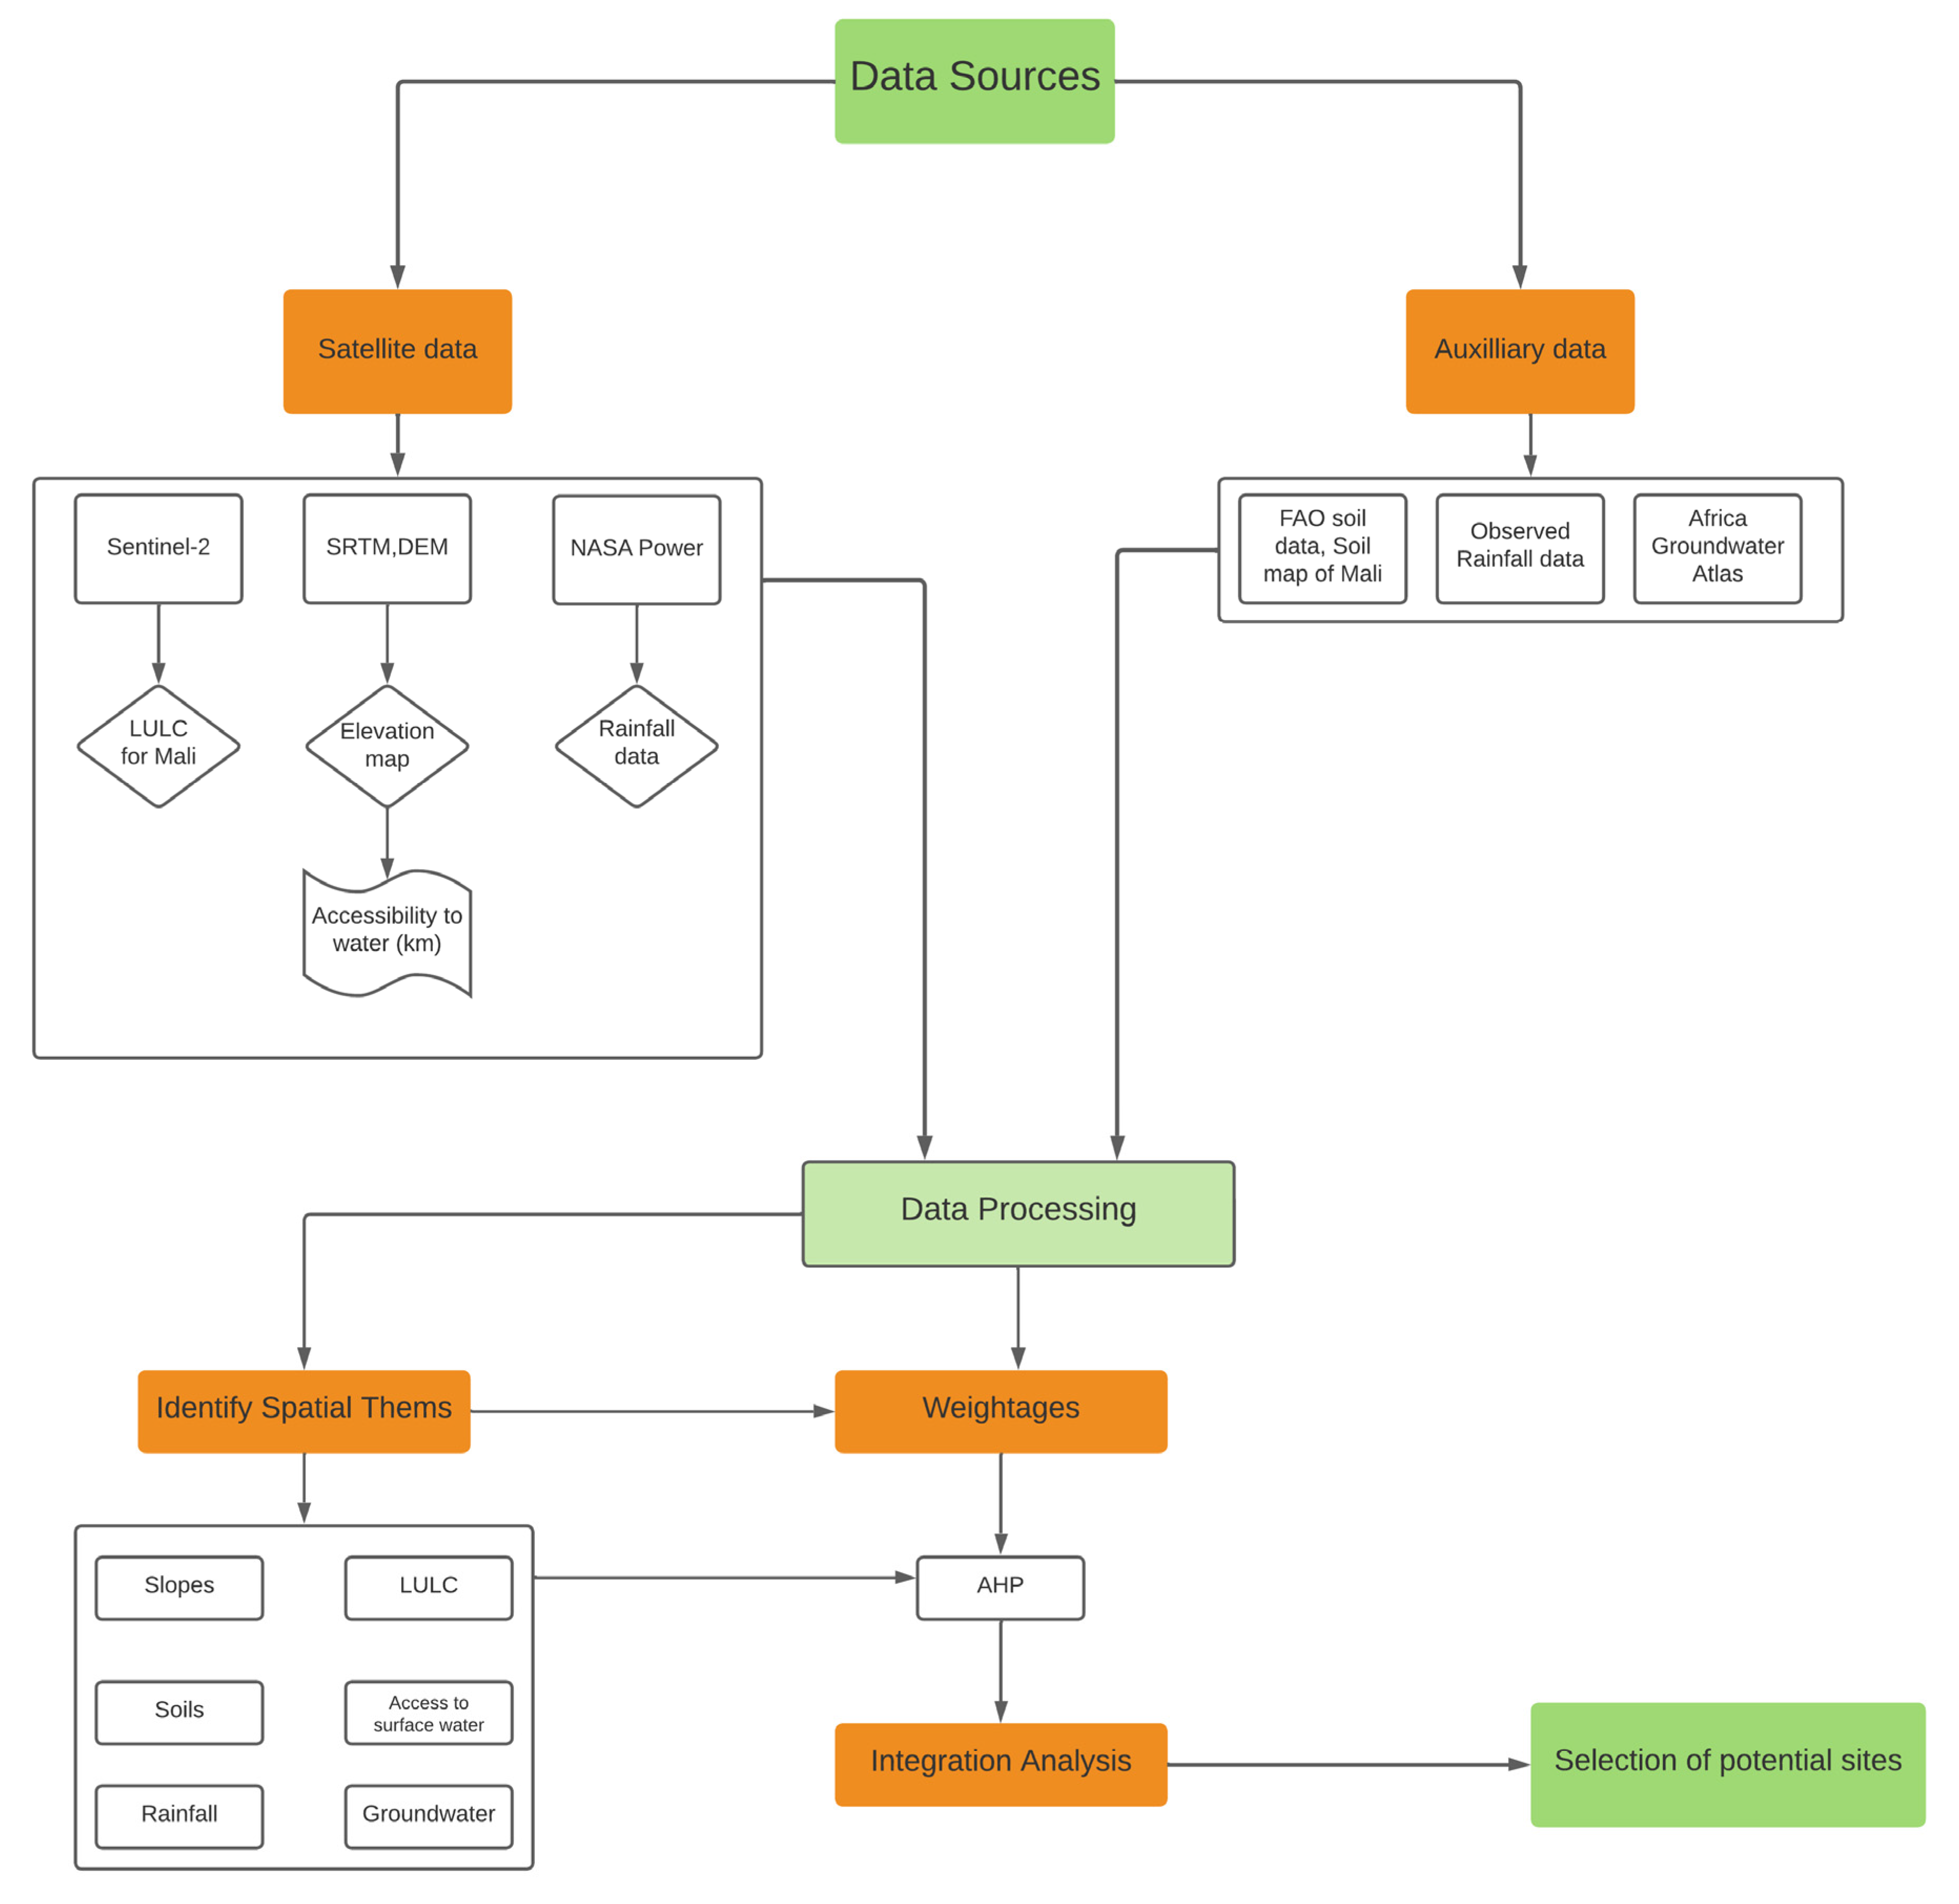
2.2. Methods of Analysis
2.2.1. Accessibility to Surface Water
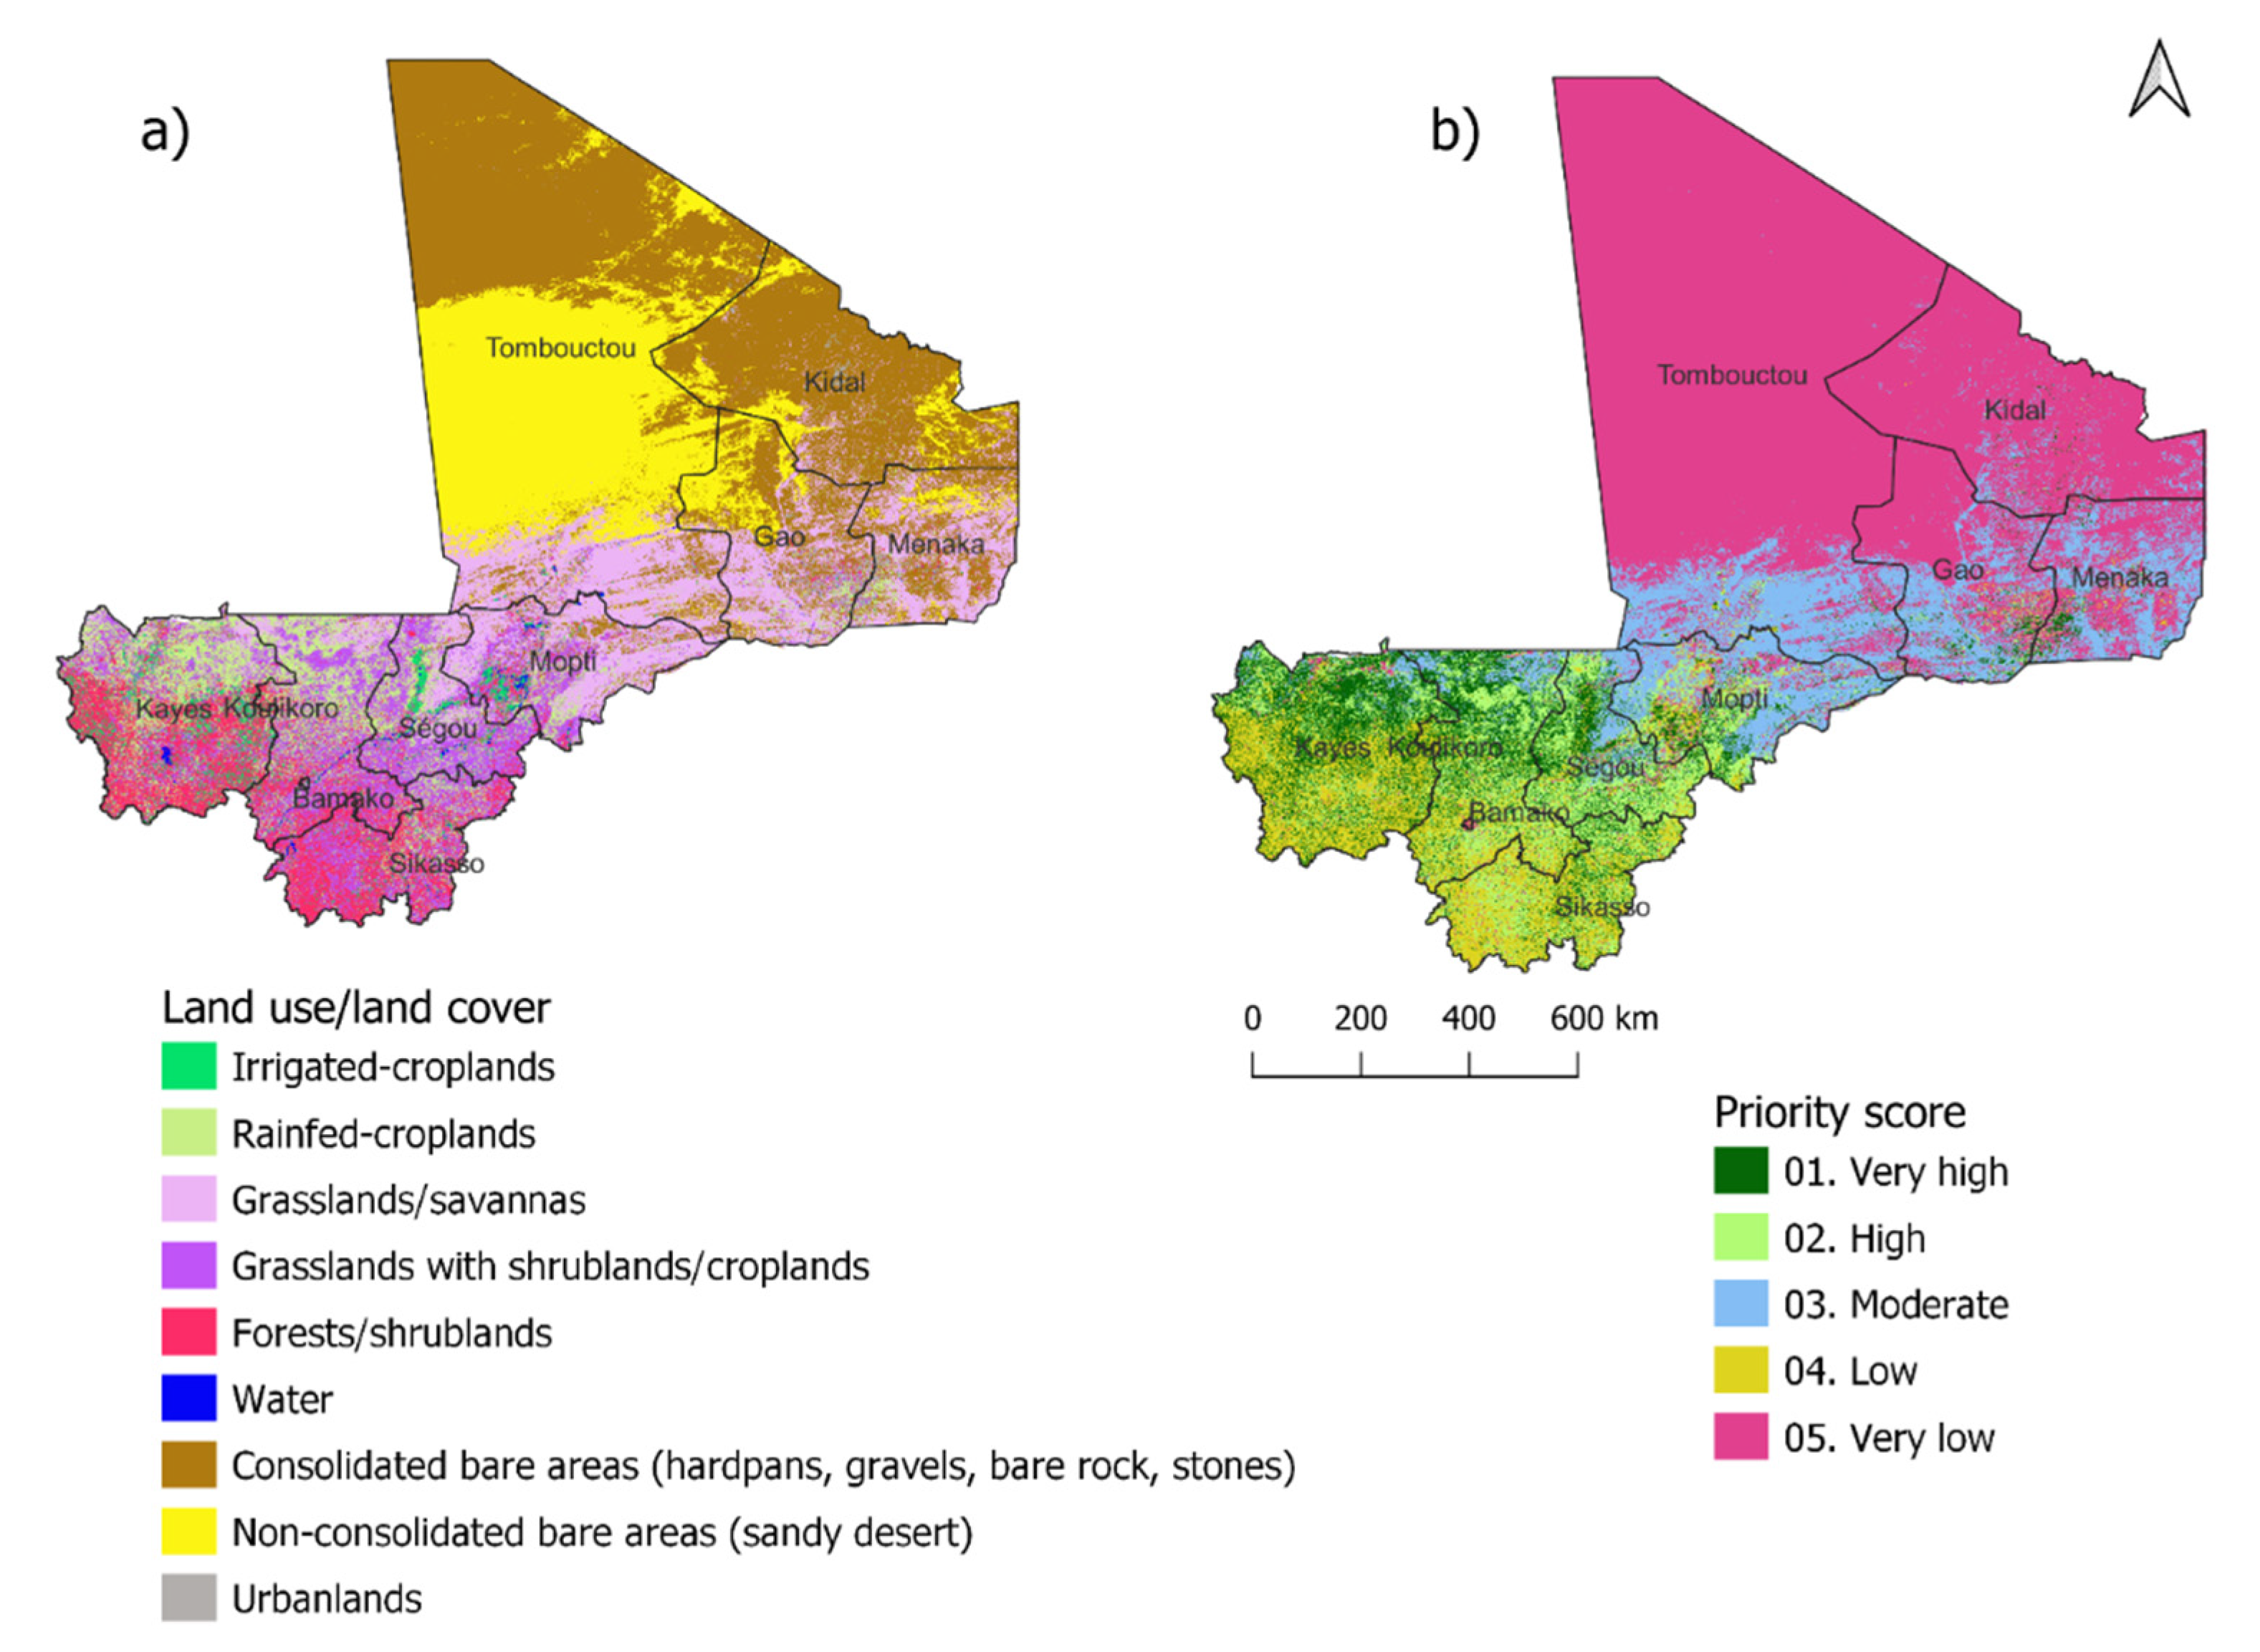
2.2.2. Land Use/Land Cover
| Theme | Resolution | Quantile/Class | Area (ha) | % of Total Area (%) | Priority Class | Score Assigned | Source |
|---|---|---|---|---|---|---|---|
| Accessibility to surface water | Distance from surface water (km) | Equal intervals | |||||
| 0.5 km | ≤14 | 13,917,188 | 11.08 | Very high | 1 | ||
| 14–29 | 14,080,954 | 11.21 | High | 2 | |||
| 29–60 | 27,731,454 | 22.09 | Moderate | 3 | |||
| 60–100 | 28,277,453 | 22.52 | Low | 4 | |||
| >100 | 41,493,350 | 33.06 | Very low | 5 | |||
| Land use/land cover | Land use/land cover classes | [25] | |||||
| 30 m | Irrigated croplands | 1,371,519 | 1.10 | Very high | 1 | ||
| Rainfed croplands/rangelands | 10,007,626 | 8.01 | Very high | 1 | |||
| Grasslands/savannas | 20,157,146 | 16.13 | Moderate | 3 | |||
| Grasslands with shrublands/croplands | 13,234,702 | 10.59 | High | 2 | |||
| Forests/shrublands | 10,855,254 | 8.69 | Low | 4 | |||
| Water | 342,684 | 0.27 | Low | 4 | |||
| Consolidated bare areas (hardpans, gravels, bare rock, stones) | 41,137,082 | 32.92 | Very low | 5 | |||
| Non-consolidated bare areas (sandy desert) | 26,393,019 | 21.12 | Very low | 5 | |||
| Urban lands | 1,470,857 | 1.18 | Very low | 5 | |||
| Groundwater | Groundwater type and quantity | [25,32] | |||||
| 30 m | B-L: Basement-Low | 887,891 | 0.727545 | Low | 4 | ||
| B-M: Basement-Moderate | 6,291,362 | 5.155194 | Moderate | 3 | |||
| B-VL: Basement-Very low | 3,050,316 | 2.499454 | Very low | 5 | |||
| CSF-H: Consolidated Sedimentary Fracture-High | 7,002,489 | 5.737897 | High | 2 | |||
| CSF-M: Consolidated Sedimentary Fracture-Moderate | 19,036,092 | 15.59833 | Moderate | 3 | |||
| CSIF-H: Consolidated Sedimentary Intergranular/Fracture-High | 15,797,166 | 12.94433 | High | 2 | |||
| I-L: Igneous Intrusive-Low | 674,418 | 0.552624 | Very low | 5 | |||
| I-M: Igneous Intrusive-Moderate | 2,669,599 | 2.187491 | Low | 4 | |||
| U-H: Unconsolidated Sedimentary-High | 19,716,021 | 16.15547 | Very high | 1 | |||
| U-L: Unconsolidated Sedimentary-Low | 2,845,219 | 2.331396 | Low | 4 | |||
| U-LM: Unconsolidated Sedimentary-Low to Moderate | 16,138,821 | 13.22428 | Moderate | 3 | |||
| U-M: Unconsolidated Sedimentary-Moderate | 24,654,245 | 20.20189 | Moderate | 3 | |||
| U-VL: Unconsolidated Sedimentary-Very low | 3,275,649 | 2.684094 | Very low | 5 | |||
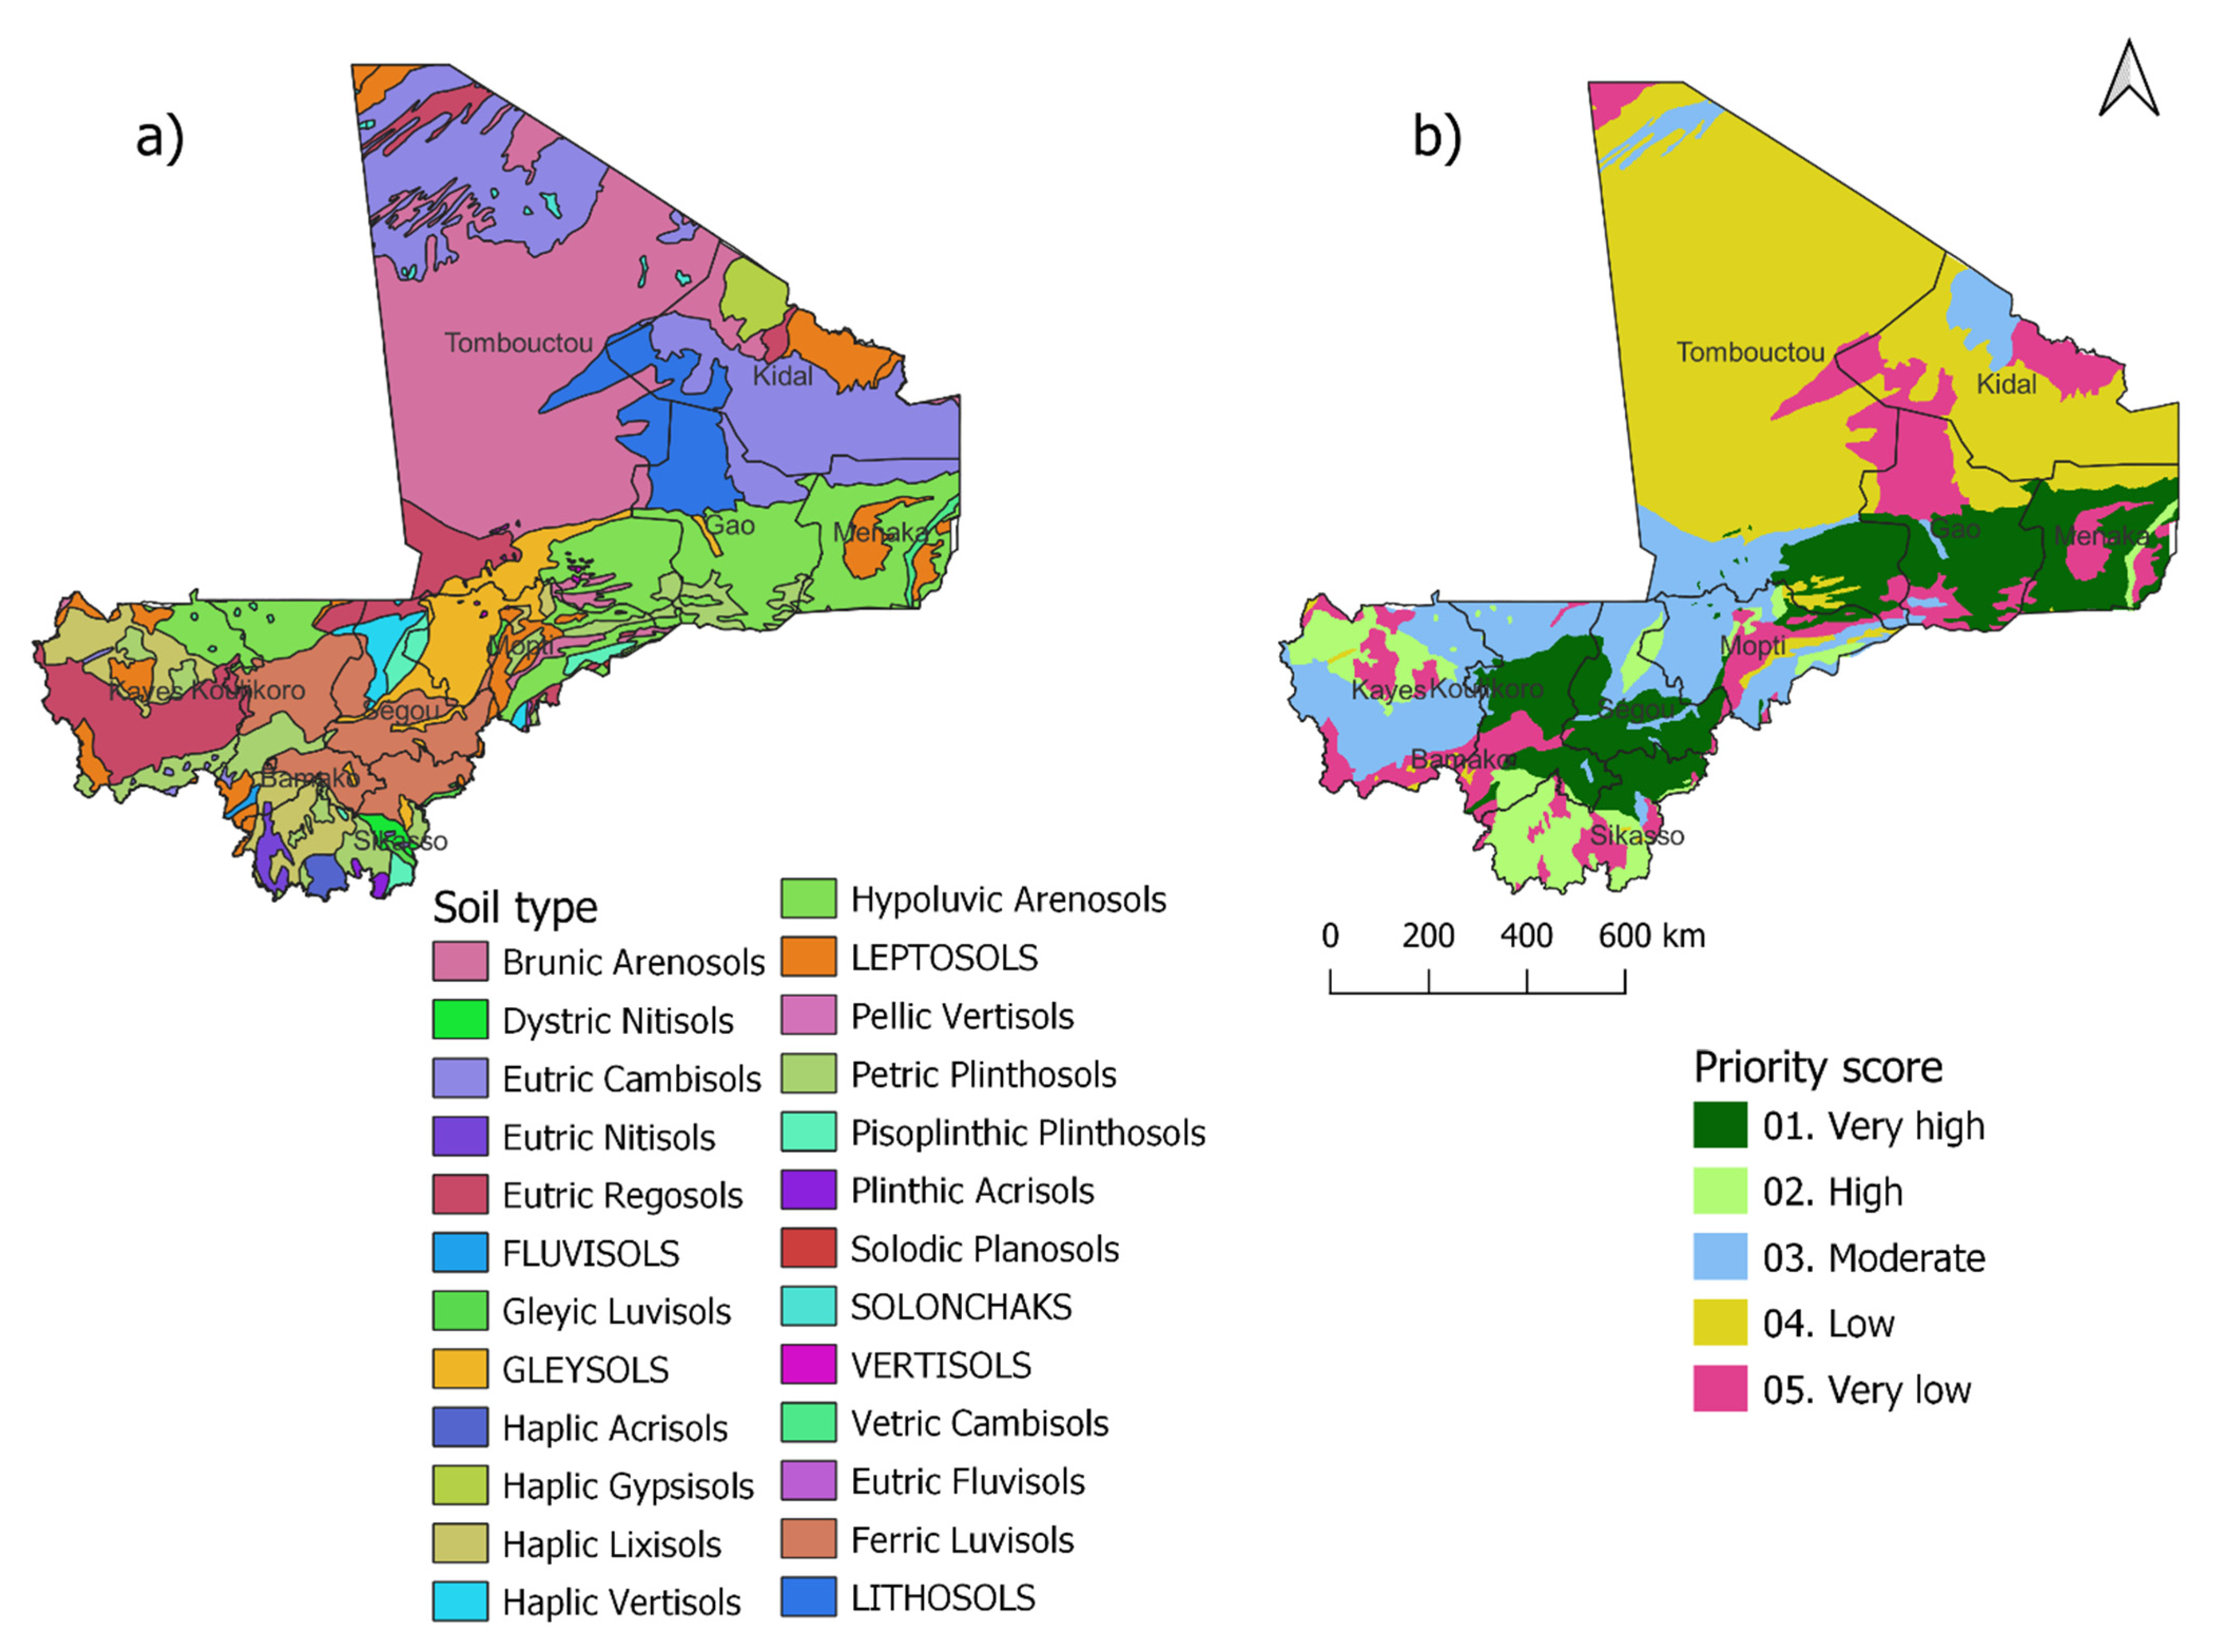
| Soil | Soil type | [25,33] | |||||
| 1 km | Haplic Acrisols | 522,206 | 0.68 | High | 2 | ||
| Plinthic Acrisols | 173,842 | 0.23 | High | 2 | |||
| Brunic Arenosols | 4,616,834 | 6.03 | Low | 4 | |||
| Hypoluvic Arenosols | 5,974,861 | 7.80 | Moderate | 3 | |||
| Eutric Cambisols | 11,019,569 | 14.39 | Low | 4 | |||
| Vetric Cambisols | 410,884 | 0.54 | High | 2 | |||
| FLUVISOLS | 124,572 | 0.16 | Very high | 1 | |||
| Eutric Fluvisols | 40,139 | 0.05 | Very high | 1 | |||
| GLEYSOLS | 5,366,349 | 7.01 | Moderate | 3 | |||
| Haplic Gypsisols | 1,392,952 | 1.82 | Moderate | 3 | |||
| LEPTOSOLS | 6,897,030 | 9.01 | Very low | 5 | |||
| Gleyic Luvisols | 310,444 | 0.41 | High | 2 | |||
| Haplic Lixisols | 5,024,235 | 6.56 | High | 2 | |||
| Dystric Nitisols | 393,609 | 0.51 | High | 2 | |||
| Eutric Nitisols | 585,270 | 0.76 | High | 2 | |||
| Solodic Planosols | 17,878 | 0.02 | Moderate | 3 | |||
| Petric Plinthosols | 6,107,698 | 7.98 | Very low | 5 | |||
| Pisoplinthic Plinthosols | 1,226,930 | 1.60 | High | 2 | |||
| Eutric Regosols | 9,420,639 | 12.30 | Moderate | 3 | |||
| SOLONCHAKS | 291,929 | 0.38 | Low | 4 | |||
| Haplic Vertisols | 1,093,455 | 1.43 | Moderate | 3 | |||
| Pellic Vertisols | 7,977 | 0.01 | Moderate | 3 | |||
| VERTISOLS | 137,516 | 0.18 | Very high | 1 | |||
| Ferric Luvisols | 9,547,278 | 12.47 | Very high | 1 | |||
| LITHOSOLS | 5,868,606 | 7.66 | Very low | 5 | |||
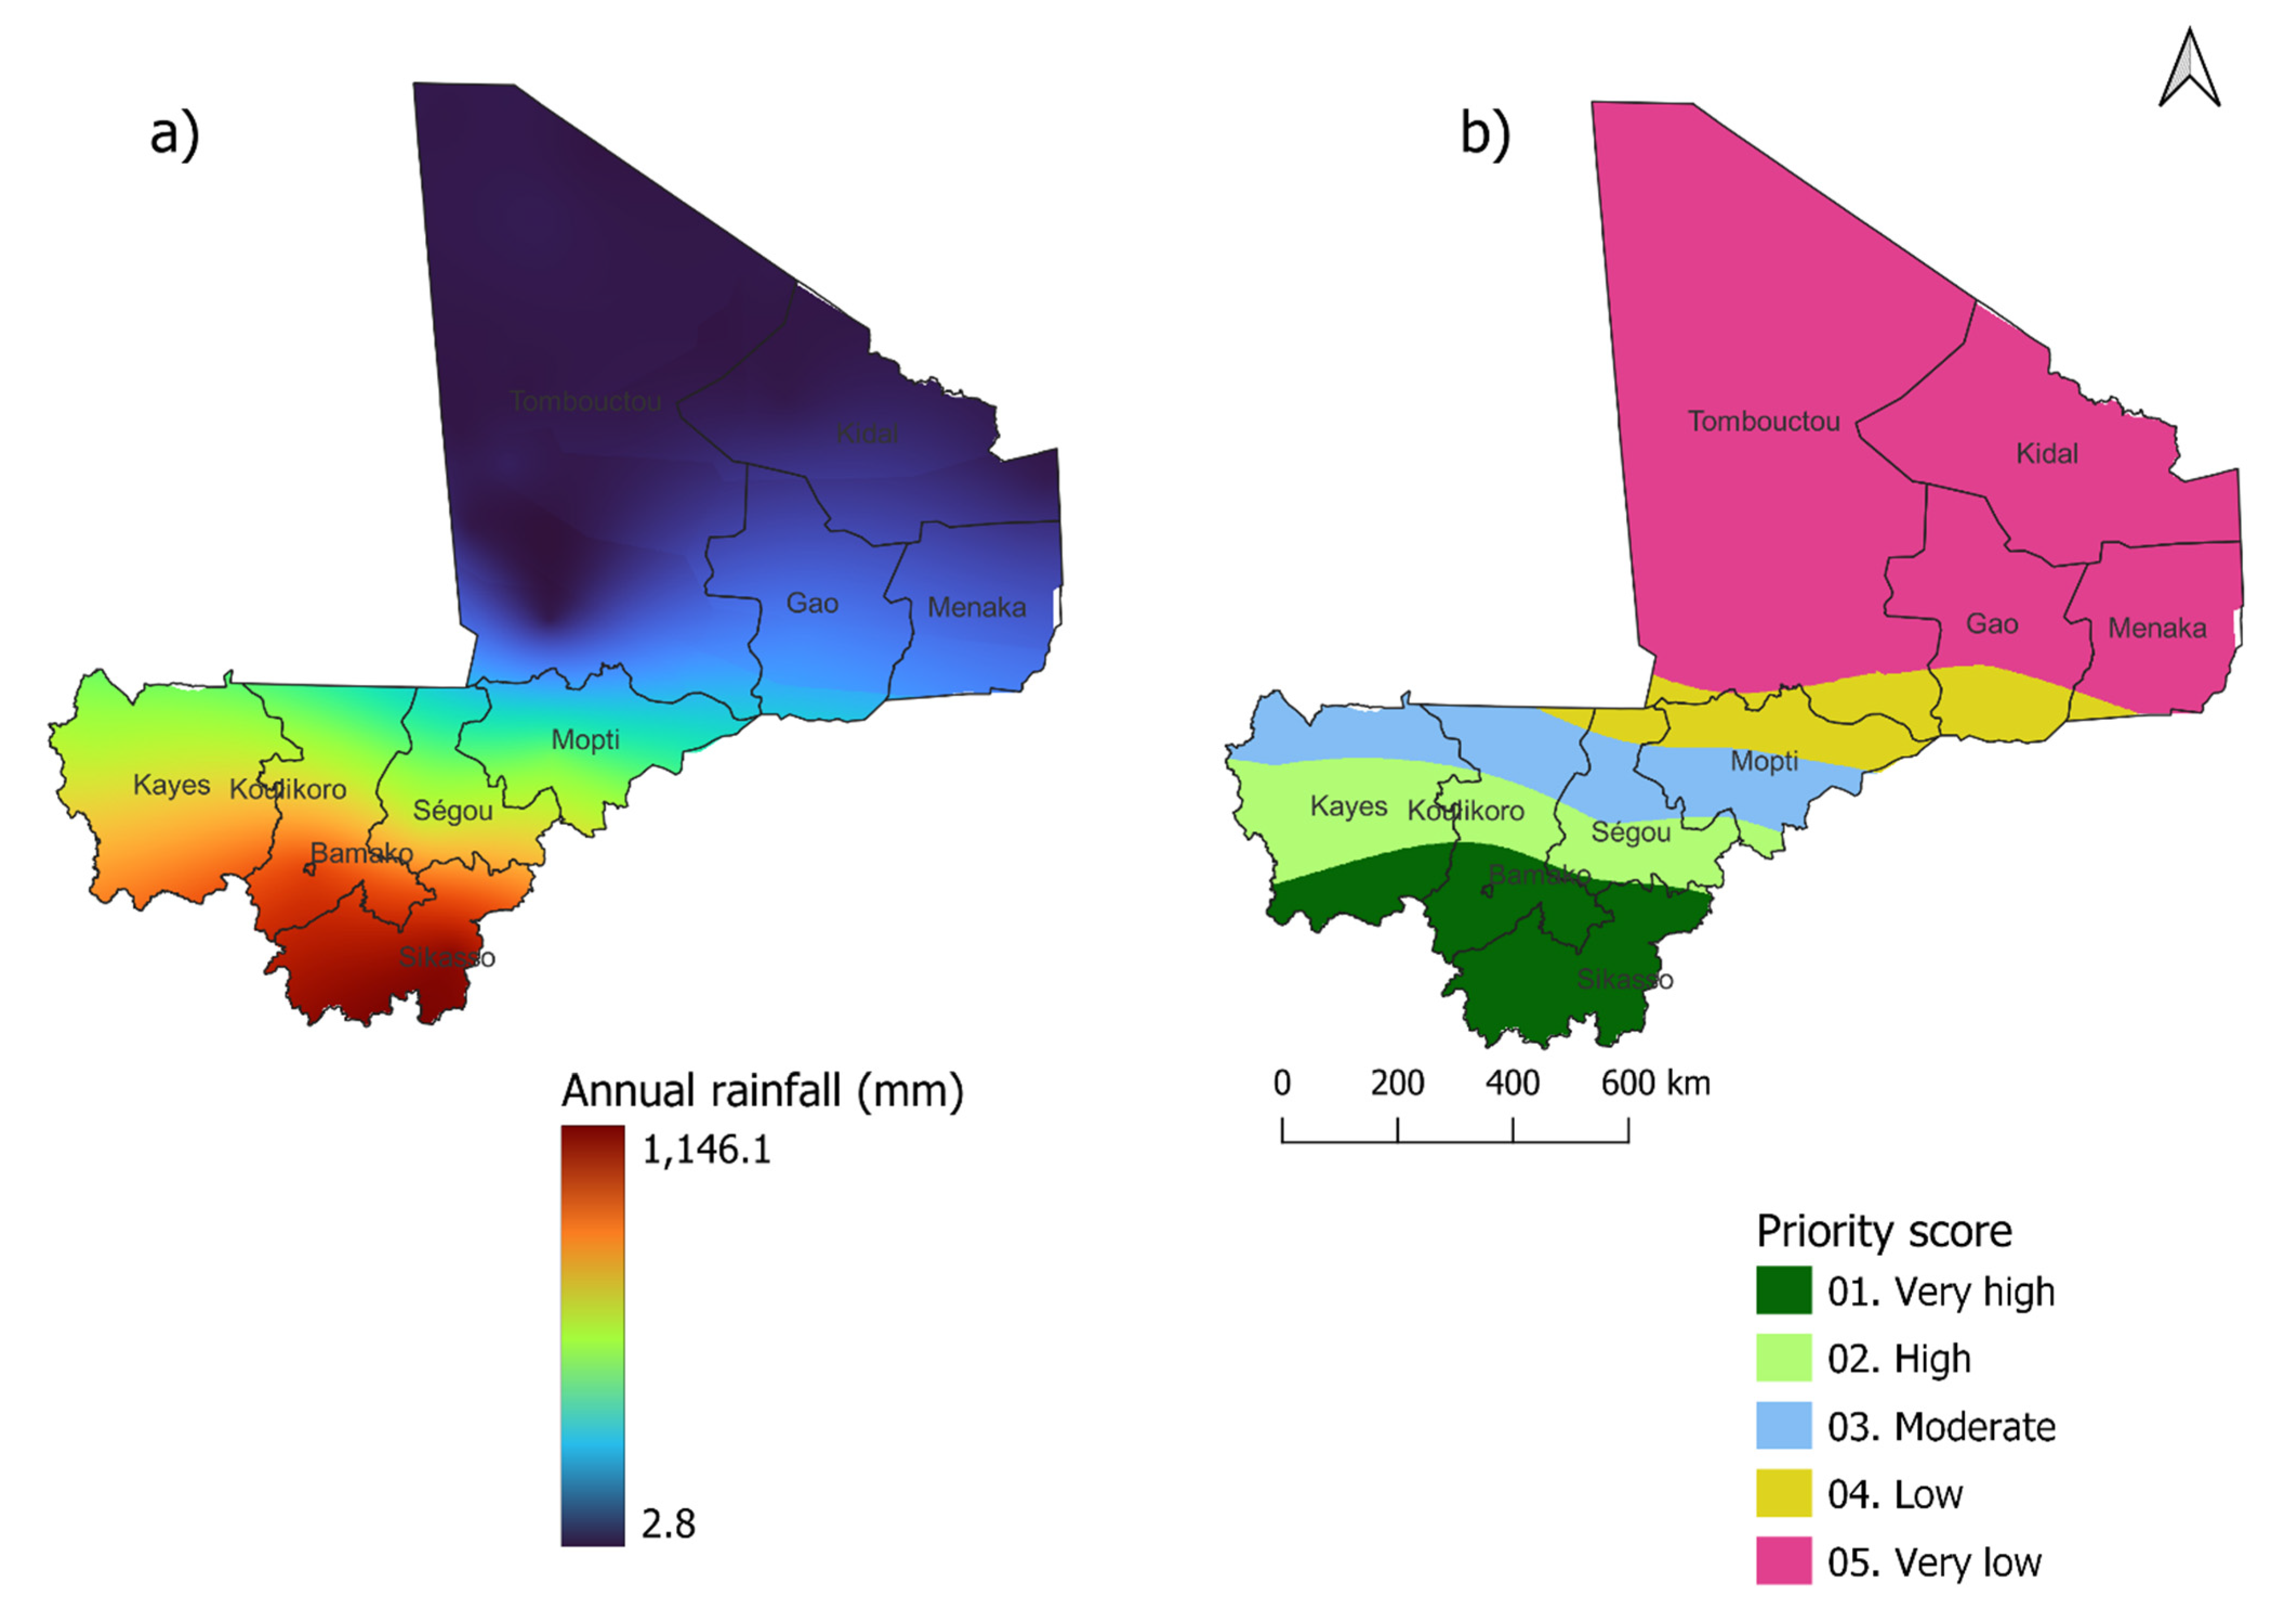
| Rainfall | Annual rainfall (mm) | [25] | |||||
| 1 km | 0–200 | 77,432,500 | 61.67 | Very low | 5 | ||
| 200–400 | 10,054,300 | 8.01 | Low | 4 | |||
| 400–600 | 11,937,600 | 9.51 | Moderate | 3 | |||
| 600–800 | 12,136,400 | 9.67 | High | 2 | |||
| ≥800 | 14,003,800 | 11.15 | Very high | 1 | |||
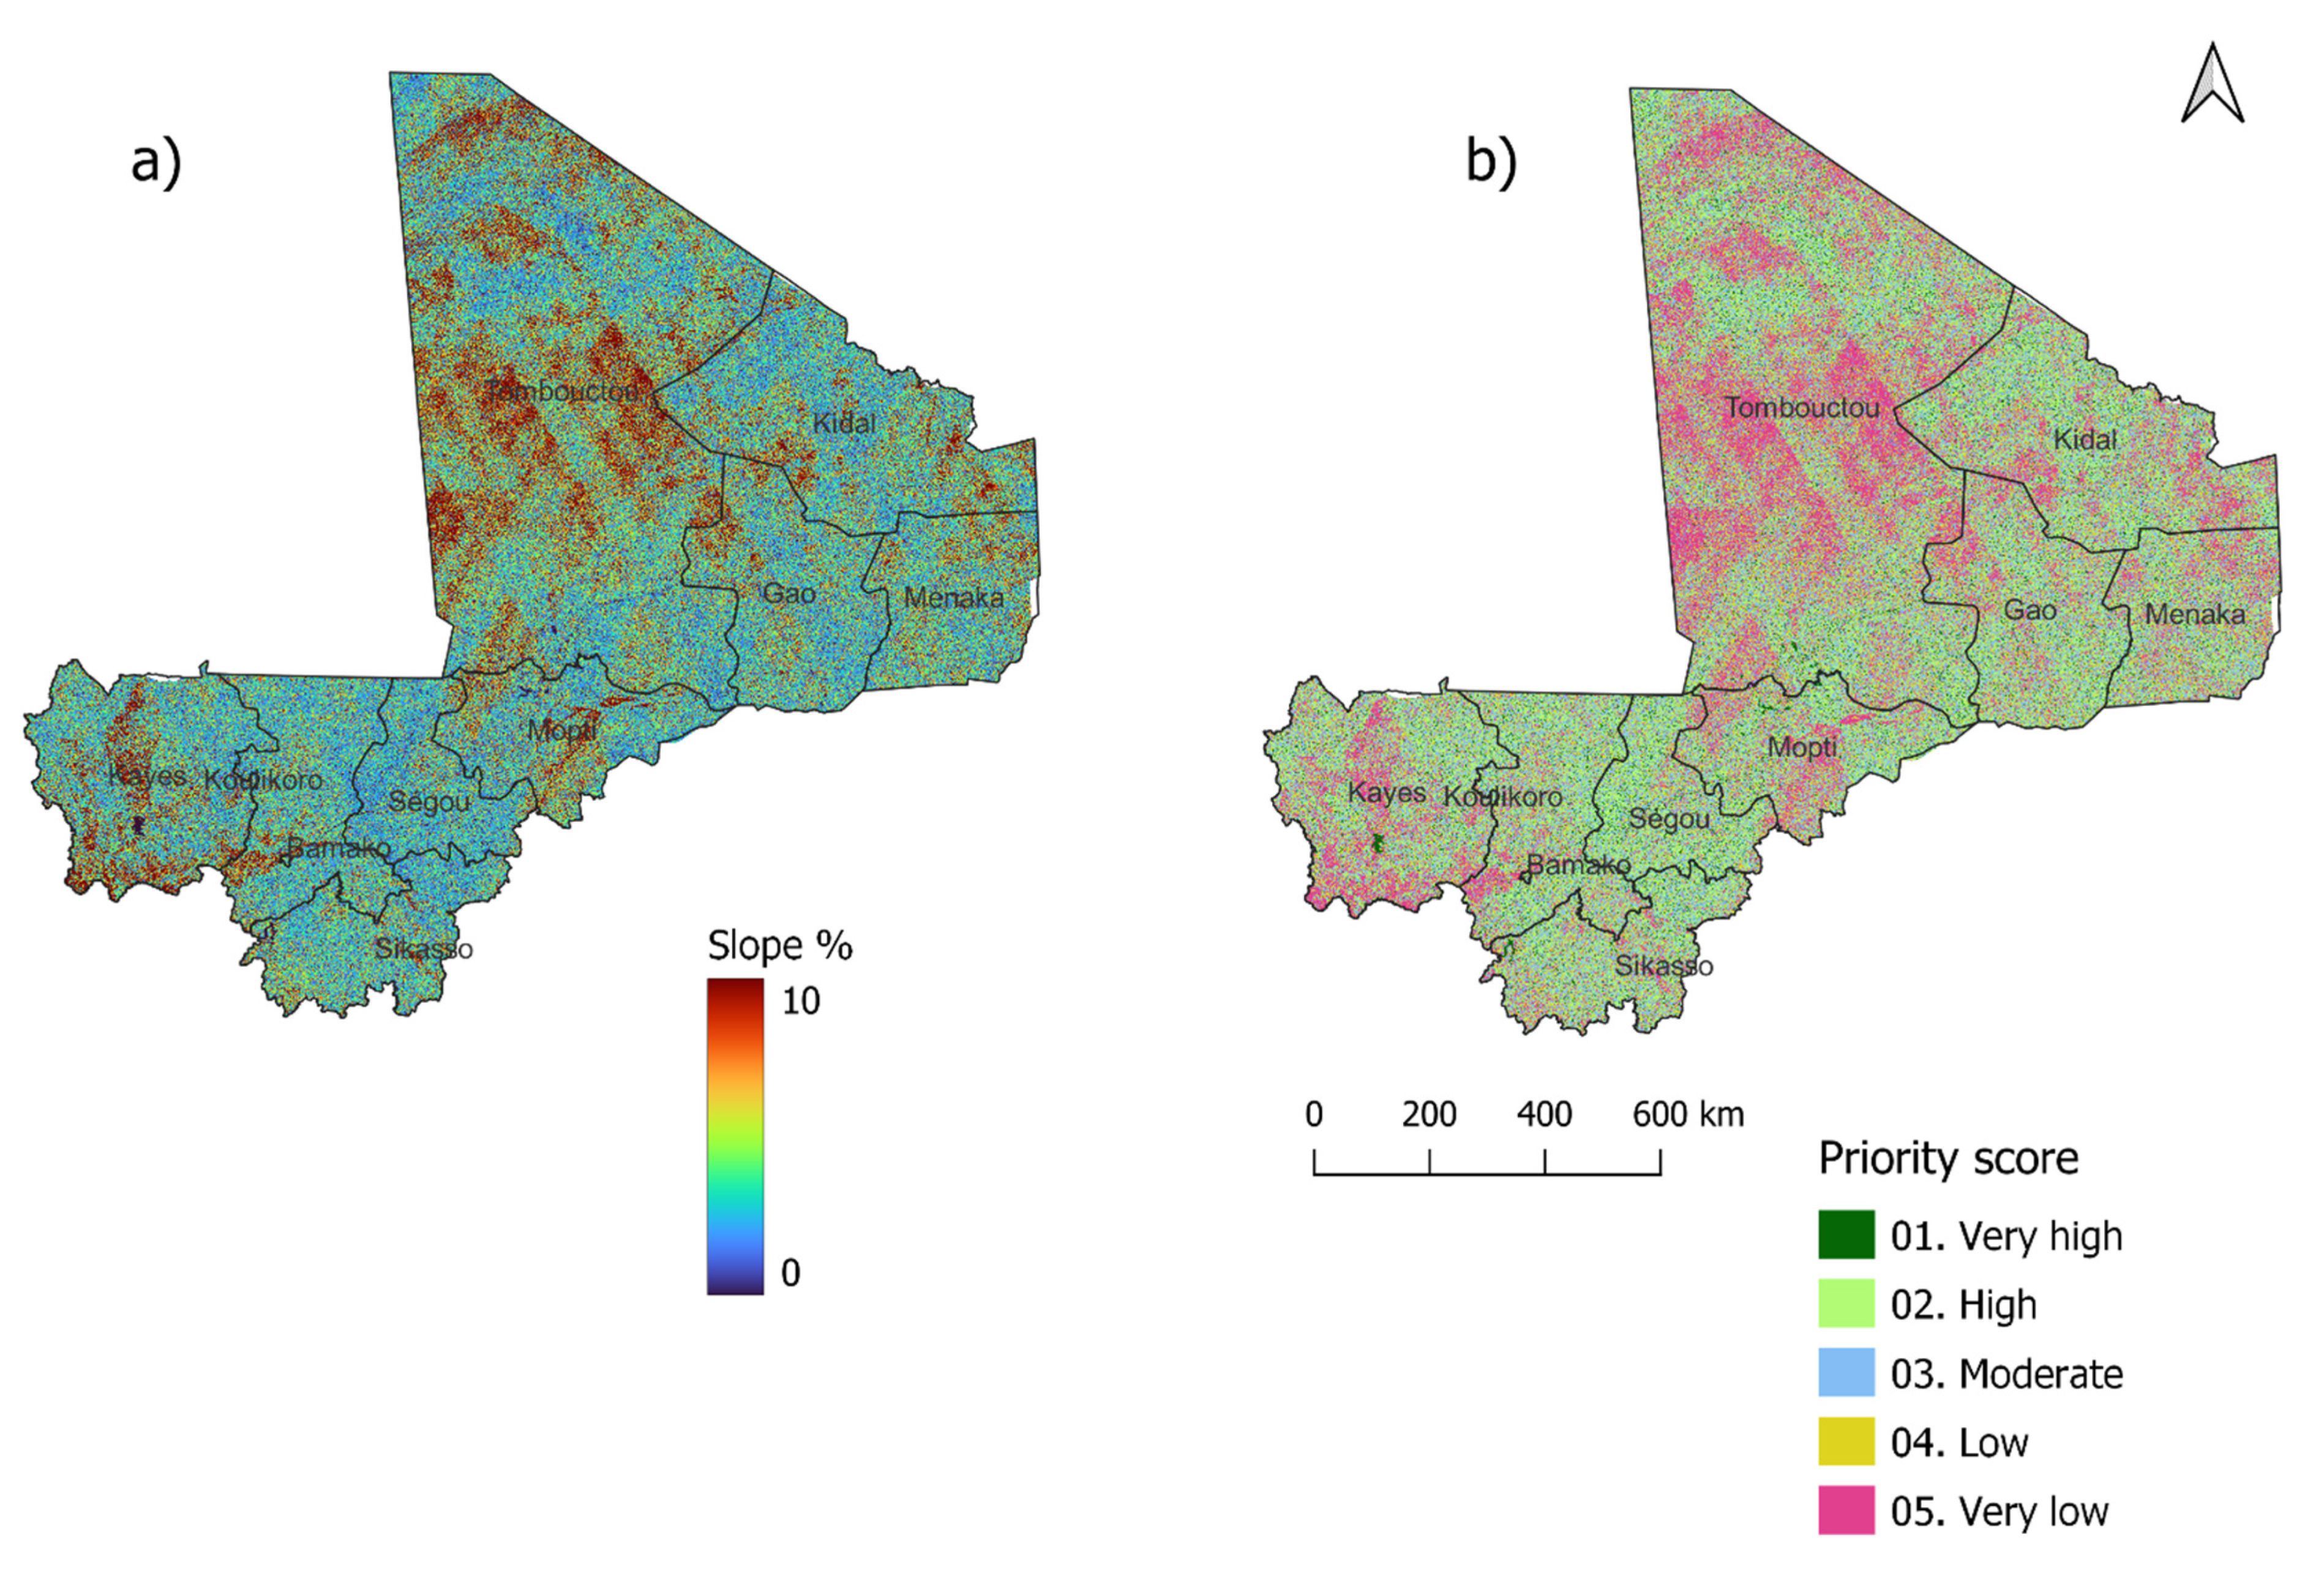
| Slope | Slope (%) | [3,4,25] | |||||
| 30 m | 0–2 | 15,175,499 | 12.11 | Very high | 1 | ||
| 2–4 | 39,009,923 | 31.12 | High | 2 | |||
| 4–6 | 30,679,517 | 24.48 | Moderate | 3 | |||
| 6–8 | 17,416,586 | 13.9 | Low | 4 | |||
| >9 | 23,070,395 | 18.41 | Very low | 5 |
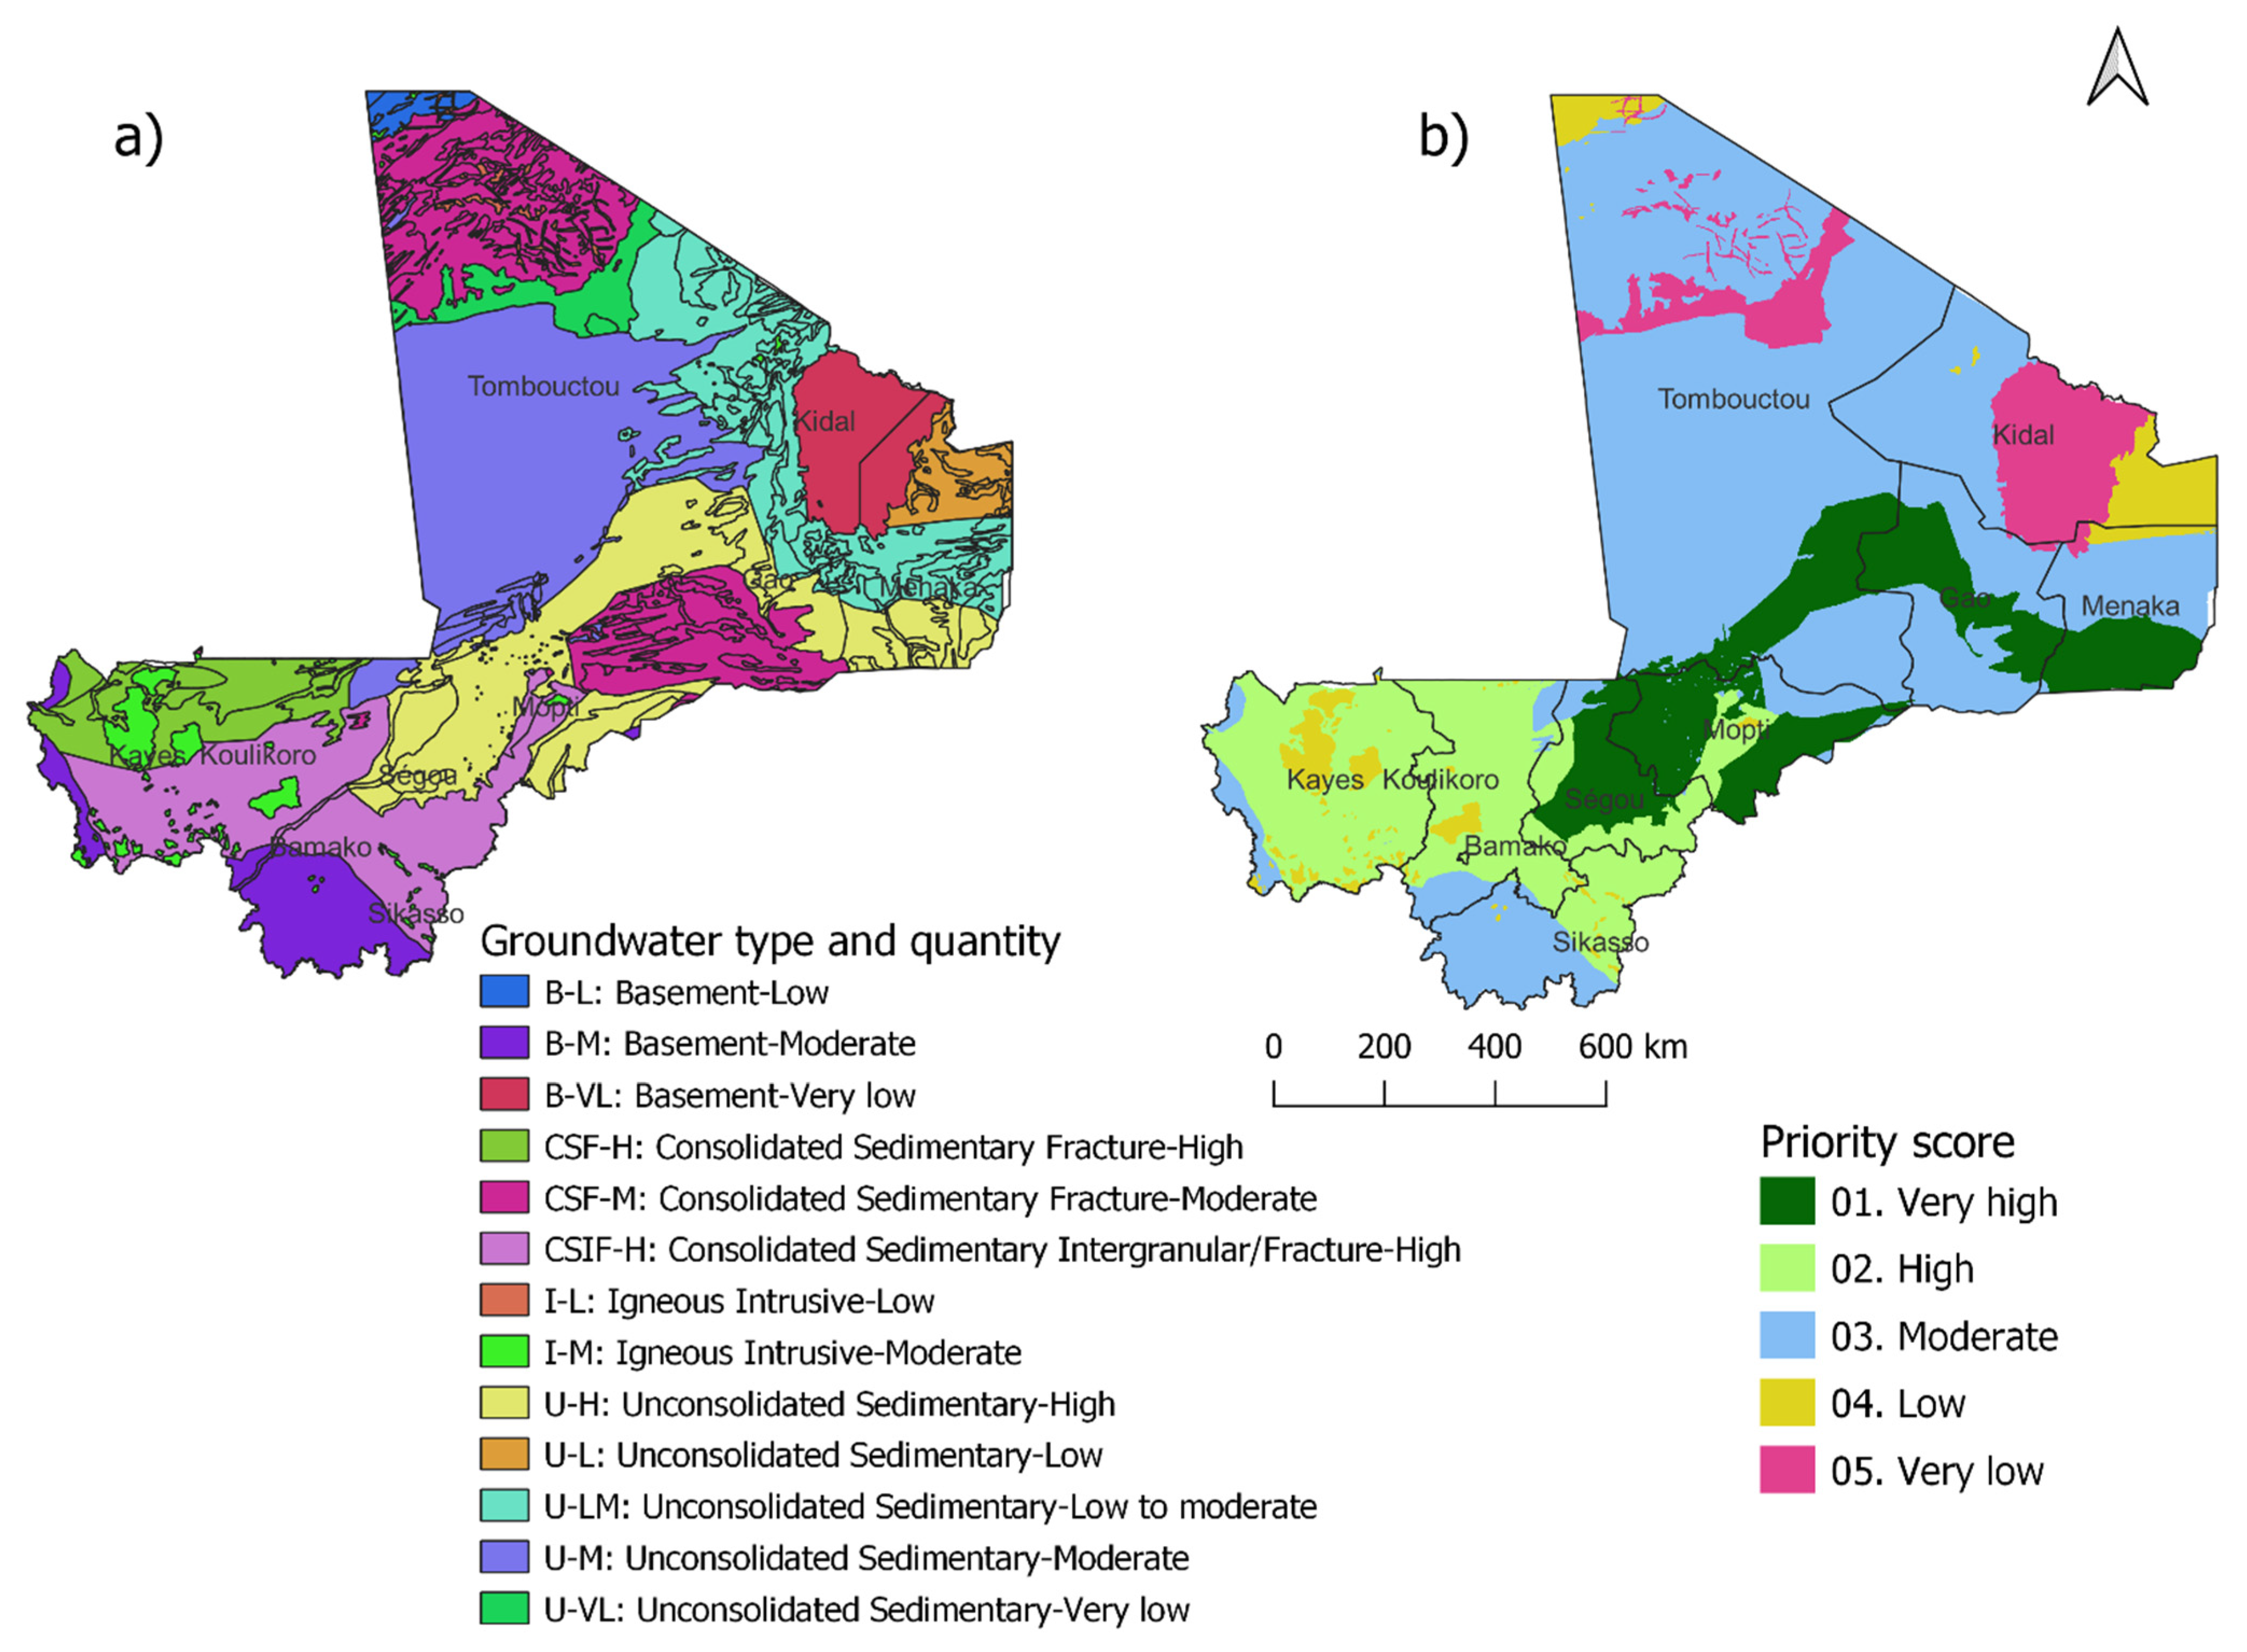
2.2.3. Groundwater
| Objectives | Methods | Parameters | Reference |
|---|---|---|---|
| Determine the suitability of land for surface irrigation | GIS and AHP | LULC, soil, topography (slope and altitude), and distance from surface water | [3] |
| Map suitable land for surface irrigation development | GIS and AHP | LULC, soil, slope, distance from surface water | [4] |
| Evaluate land suitability for surface and drip irrigation | RS and GIS | Slope, soil texture, soil drainage, and soil chemical characteristics | [10] |
| Assess land suitability for surface irrigation | GIS and AHP | Slope, LULC, soil depth, soil drainage, soil type, and distance from surface water | [28] |
| Develop land suitability map of lowland sub-basin area for surface irrigation | GIS and AHP | slope, soil texture, depth, drainage characteristics, soil type and LULC | [9] |
| Identify suitable lands for agricultural development | GIS and AHP | Slope, elevation, LULC, soil moisture, distance from river, soil characteristics, geology, aspect, distance from road | [8] |
| Prioritize watersheds for productivity enhancement and livelihood improvement | RS and GIS | Population, slope, rainfall, LULC, and soil | [25] |
| Determine suitable lands for agricultural use | GIS and AHP | Parameters of great soil group, slope, aspect, elevation, and land use capability class | [34] |
2.2.4. Soil
2.2.5. Rainfall
2.2.6. Slope
2.3. Integration of Thematic Layers
3. Results and Discussion
3.1. Selection and Weight of Thematic Layers
3.2. Cross Validation of Introplated Layer and Land Use/Land Cover Map
3.3. Integration of Thematic Layers for Site Selection
4. Conclusions
Author Contributions
Funding
Data Availability Statement
Conflicts of Interest
References
- Wada, Y.; Wisser, D.; Eisner, S.; Flörke, M.; Gerten, D.; Haddeland, I.; Hanasaki, N.; Masaki, Y.; Portmann, F.T.; Stacke, T. Multimodel projections and uncertainties of irrigation water demand under climate change. Geophys. Res. Lett. 2013, 40, 4626–4632. [Google Scholar] [CrossRef]
- Siebert, S.; Döll, P.; Hoogeveen, J.; Faures, J.-M.; Frenken, K.; Feick, S. Development and validation of the global map of irrigation areas. Hydrol. Earth Syst. Sci. 2005, 9, 535–547. [Google Scholar] [CrossRef]
- Hagos, Y.G.; Mengie, M.A.; Andualem, T.G.; Yibeltal, M.; Linh, N.T.T.; Tenagashaw, D.Y.; Hewa, G. Land suitability assessment for surface irrigation development at Ethiopian highlands using geospatial technology. Appl. Water Sci. 2022, 12, 98. [Google Scholar] [CrossRef]
- Girma, R.; Gebre, E.; Tadesse, T. Land suitability evaluation for surface irrigation using spatial information technology in Omo-Gibe River Basin, Southern Ethiopia. Irrig. Drain. Syst. Eng. 2020, 9, 1–10. [Google Scholar] [CrossRef]
- Partey, S.T.; Zougmoré, R.B.; Ouédraogo, M.; Campbell, B.M. Developing climate-smart agriculture to face climate variability in West Africa: Challenges and lessons learnt. J. Clean. Prod. 2018, 187, 285–295. [Google Scholar] [CrossRef]
- Mapuranga, D.; Muzerengi, T. Impact of small scale irrigation schemes in addressing food shortages in semi-arid areas: A case of Ingwizi irrigation Scheme in Mangwe District, Zimbabwe. Int. J. Humanit. Soc. Stud. 2017, 5, 5–6. [Google Scholar]
- Christine, J.; Willibald, L.; Dominik, R.; Michael, H.; Awulachew, S.B.; Hagos, F. Impact of Irrigation on Livelihood and Food Security in the Modern Hare River Irrigation Scheme in Southern Ethiopia; IWMI: Colombo, Sri Lanka, 2008. [Google Scholar]
- Pramanik, M.K. Site suitability analysis for agricultural land use of Darjeeling district using AHP and GIS techniques. Modeling Earth Syst. Environ. 2016, 2, 56. [Google Scholar] [CrossRef]
- Hailu, T.; Quraishi, S. GIS Based surface irrigation suitability assessment and development of map for the low land Gilo Sub-Basin of Gambella, Ethiopia. Civ. Environ. Res. 2017, 9, 21–27. [Google Scholar]
- Rabia, A.H.; Figueredo, H.; Huong, T.; Lopez, B.; Solomon, H.; Alessandro, V. Land suitability analysis for policy making assistance: A GIS based land suitability comparison between surface and drip irrigation systems. Int. J. Environ. Sci. Dev. 2013, 4, 1–6. [Google Scholar] [CrossRef]
- Murthy, K. Ground water potential in a semi-arid region of Andhra Pradesh-a geographical information system approach. Int. J. Remote Sens. 2000, 21, 1867–1884. [Google Scholar] [CrossRef]
- Mattikalli, N.; Devereux, B.; Richards, K. Integration of remotely sensed satellite images with a geographical information system. Comput. Geosci. 1995, 21, 947–956. [Google Scholar] [CrossRef]
- Kamaraju, M.; Bhattacharya, A.; Reddy, G.S.; Rao, G.C.; Murthy, G.; Rao, T.C.M. Ground-Water Potential Evaluation of West Godavari District, Andhra Pradesh State, India—A GIS Approach. Groundwater 1996, 34, 318–325. [Google Scholar] [CrossRef]
- Al-Djazouli, M.O.; Elmorabiti, K.; Rahimi, A.; Amellah, O.; Fadil, O.A.M. Delineating of groundwater potential zones based on remote sensing, GIS and analytical hierarchical process: A case of Waddai, eastern Chad. GeoJournal 2021, 86, 1881–1894. [Google Scholar] [CrossRef]
- Mohammadi-Behzad, H.; Charchi, A.; Kalantari, N.; Nejad, A.M.; Vardanjani, H.K. Delineation of groundwater potential zones using remote sensing (RS), geographical information system (GIS) and analytic hierarchy process (AHP) techniques: A case study in the Leylia–Keynow watershed, southwest of Iran. Carbonates Evaporites 2019, 34, 1307–1319. [Google Scholar] [CrossRef]
- Panahi, M.R.; Mousavi, S.M.; Rahimzadegan, M. Delineation of groundwater potential zones using remote sensing, GIS, and AHP technique in Tehran–Karaj plain, Iran. Environ. Earth Sci. 2017, 76, 792. [Google Scholar] [CrossRef]
- Fallahpour, A.; Olugu, E.U.; Musa, S.N.; Wong, K.Y.; Noori, S. A decision support model for sustainable supplier selection in sustainable supply chain management. Comput. Ind. Eng. 2017, 105, 391–410. [Google Scholar] [CrossRef]
- Canco, I.; Kruja, D.; Iancu, T. AHP, a Reliable Method for Quality Decision Making: A Case Study in Business. Sustainability 2021, 13, 13932. [Google Scholar] [CrossRef]
- Aksoy, E.; San, B.T. Geographical information systems (GIS) and multi-criteria decision analysis (MCDA) integration for sustainable landfill site selection considering dynamic data source. Bull. Eng. Geol. Environ. 2019, 78, 779–791. [Google Scholar] [CrossRef]
- Goldblatt, R.; You, W.; Hanson, G.; Khandelwal, A.K. Detecting the boundaries of urban areas in india: A dataset for pixel-based image classification in google earth engine. Remote Sens. 2016, 8, 634. [Google Scholar] [CrossRef]
- Ruiz Hernandez, I.E.; Shi, W. A Random Forests classification method for urban land-use mapping integrating spatial metrics and texture analysis. Int. J. Remote Sens. 2018, 39, 1175–1198. [Google Scholar] [CrossRef]
- Breiman, L. Random forests. Mach. Learn. 2001, 45, 5–32. [Google Scholar] [CrossRef]
- Feng, Q.; Liu, J.; Gong, J. UAV remote sensing for urban vegetation mapping using random forest and texture analysis. Remote Sens. 2015, 7, 1074–1094. [Google Scholar] [CrossRef]
- Kamusoko, C.; Gamba, J. Simulating urban growth using a random forest-cellular automata (RF-CA) model. ISPRS Int. J. Geo-Inf. 2015, 4, 447–470. [Google Scholar] [CrossRef]
- Gumma, M.K.; Birhanu, B.Z.; Mohammed, I.A.; Tabo, R.; Whitbread, A.M. Prioritization of watersheds across Mali using remote sensing data and GIS techniques for agricultural development planning. Water 2016, 8, 260. [Google Scholar] [CrossRef]
- Gumma, M.K.; Pavelic, P. Mapping of groundwater potential zones across Ghana using remote sensing, geographic information systems, and spatial modeling. Environ. Monit. Assess. 2013, 185, 3561–3579. [Google Scholar] [CrossRef]
- Paul, M.; Negahban-Azar, M.; Shirmohammadi, A.; Montas, H. Assessment of agricultural land suitability for irrigation with reclaimed water using geospatial multi-criteria decision analysis. Agric. Water Manag. 2020, 231, 105987. [Google Scholar] [CrossRef]
- Negasa, G.; Wakjira, G. Assessment of Irrigation Land Suitability for Surface Irrigation in Birbir River Watershed Using Geographic Information System Technique in Oromia Region, Ethiopia. Softw. Eng. 2021, 9, 45. [Google Scholar] [CrossRef]
- Louis, J.; Debaecker, V.; Pflug, B.; Main-Knorn, M.; Bieniarz, J.; Mueller-Wilm, U.; Cadau, E.; Gascon, F. Sentinel-2 Sen2Cor: L2A processor for users. In Proceedings of the Proceedings Living Planet Symposium 2016, Prague, Czech Republic, 9–13 May 2016; pp. 1–8. [Google Scholar]
- R Core Team. R: A Language and Environment for Statistical Computing; R Foundation for Statistical Computing; R Core Team: Vienna, Austria, 2020; Available online: https://www.R-project.org/ (accessed on 1 January 2022).
- Liaw, A.; Wiener, M. Classification and regression by randomForest. R News 2002, 2, 18–22. [Google Scholar]
- Dochartaigh, B.E.O. User Guide: Africa Groundwater Atlas Country Hydrogeology Maps, Version 1.1. Available online: https://www2.bgs.ac.uk/africagroundwateratlas/ (accessed on 1 January 2022).
- Jones, A.; Breuning-Madsen, H.; Brossard, M.; Dampha, A.; Deckers, J.; Dewitte, O.; Gallali, T.; Hallett, S.; Jones, R.; Kilasara, M. Soil Atlas of Africa; European Commission, Publications Office of the European Union: Luxembourg, 2013; p. 176. [Google Scholar]
- Akıncı, H.; Özalp, A.Y.; Turgut, B. Agricultural land use suitability analysis using GIS and AHP technique. Comput. Electron. Agric. 2013, 97, 71–82. [Google Scholar] [CrossRef]
- Sparks, A. Nasapower: NASA-POWER Data from R. 2022, R Package Version 4.0.7. Available online: https://CRAN.R-project.org/package=nasapower (accessed on 1 January 2022).
- QGIS.org. QGIS Geographic Information System. QGIS Association. 2022. Available online: http://www.qgis.org (accessed on 1 January 2022).
- Saaty, T.L. A scaling method for priorities in hierarchical structures. J. Math. Psychol. 1977, 15, 234–281. [Google Scholar] [CrossRef]
- Abtew, W.; Obeysekera, J.; Shih, G. Spatial analysis for monthly rainfall in south Florida. JAWRA J. Am. Water Resour. Assoc. 1993, 29, 179–188. [Google Scholar] [CrossRef]
- Malabo Montpellier Panel. Water-Wise: Smart Irrigation Strategies for Africa: Mali. Dakar. Available online: https://www.mamopanel.org/media/uploads/files/Water-wise_case_study_Mali.pdf (accessed on 1 March 2022).
- Agriculture and Processed Foods. Local Irigation: Improving Water Management to Boost Agriculture and Reduce Poverty. Available online: https://www.international.gc.ca/world-monde/stories-histoires/2019/mali-irrigation.aspx?lang=eng (accessed on 1 March 2022).

| Accessibility to Surface Water | Land Use/Land Cover | Groundwater | Soil | Rainfall | Slope | Weightage | Weightage % | |
|---|---|---|---|---|---|---|---|---|
| Accessibility to surface water | 1 | 0.238 | 23.8 | |||||
| Land use/land cover | 1 | 1 | 0.218 | 21.8 | ||||
| Groundwater | 1 | 1 | 1 | 0.165 | 16.5 | |||
| Soil | 0.33 | 0.5 | 1 | 1 | 0.132 | 13.2 | ||
| Rainfall | 0.5 | 0.5 | 2 | 1 | 1 | 0.148 | 14.8 | |
| Slope | 0.5 | 0.5 | 0.5 | 1 | 0.5 | 1 | 0.099 | 9.9 |
| Consistency ratio | 5 % (consistency is acceptable) | |||||||
| Sum | 1 | 100 | ||||||
| Classes | Reference Data | |||||||||||
|---|---|---|---|---|---|---|---|---|---|---|---|---|
| Derived classification | 01 | 02 | 03 | 04 | 05 | 06 | 07 | 08 | 09 | RT | UA | |
| 01. Irrigated croplands | 32 | 2 | 0 | 0 | 4 | 2 | 0 | 0 | 0 | 40 | 80% | |
| 02. Rainfed-croplands | 1 | 12 | 1 | 8 | 2 | 0 | 0 | 0 | 0 | 24 | 50% | |
| 03. Grasslands/savannas | 0 | 0 | 20 | 0 | 0 | 0 | 2 | 1 | 0 | 23 | 87% | |
| 04. Grasslands with shrublands/croplands | 0 | 5 | 0 | 9 | 0 | 0 | 0 | 0 | 0 | 14 | 64.3% | |
| 05. Forests/shrublands | 2 | 2 | 0 | 1 | 24 | 0 | 0 | 0 | 0 | 29 | 82.8% | |
| 06. Water | 0 | 0 | 0 | 0 | 0 | 10 | 0 | 0 | 2 | 12 | 83.3% | |
| 07. Consolidated bare areas (hardpans, gravels, bare rock, stones, boulders) | 0 | 0 | 0 | 0 | 0 | 0 | 16 | 0 | 0 | 16 | 100% | |
| 08. Non-consolidated bare areas (sandy desert) | 0 | 0 | 0 | 0 | 0 | 0 | 0 | 14 | 0 | 14 | 100% | |
| 09. Urban lands | 0 | 1 | 0 | 0 | 1 | 0 | 0 | 0 | 31 | 33 | 93.9% | |
| Column total | 35 | 22 | 21 | 18 | 31 | 12 | 18 | 15 | 33 | 205 | ||
| Producers’ accuracy | 91.4% | 54.5% | 95.2% | 50% | 77.4% | 83.3% | 88.9% | 93.3% | 93.9% | |||
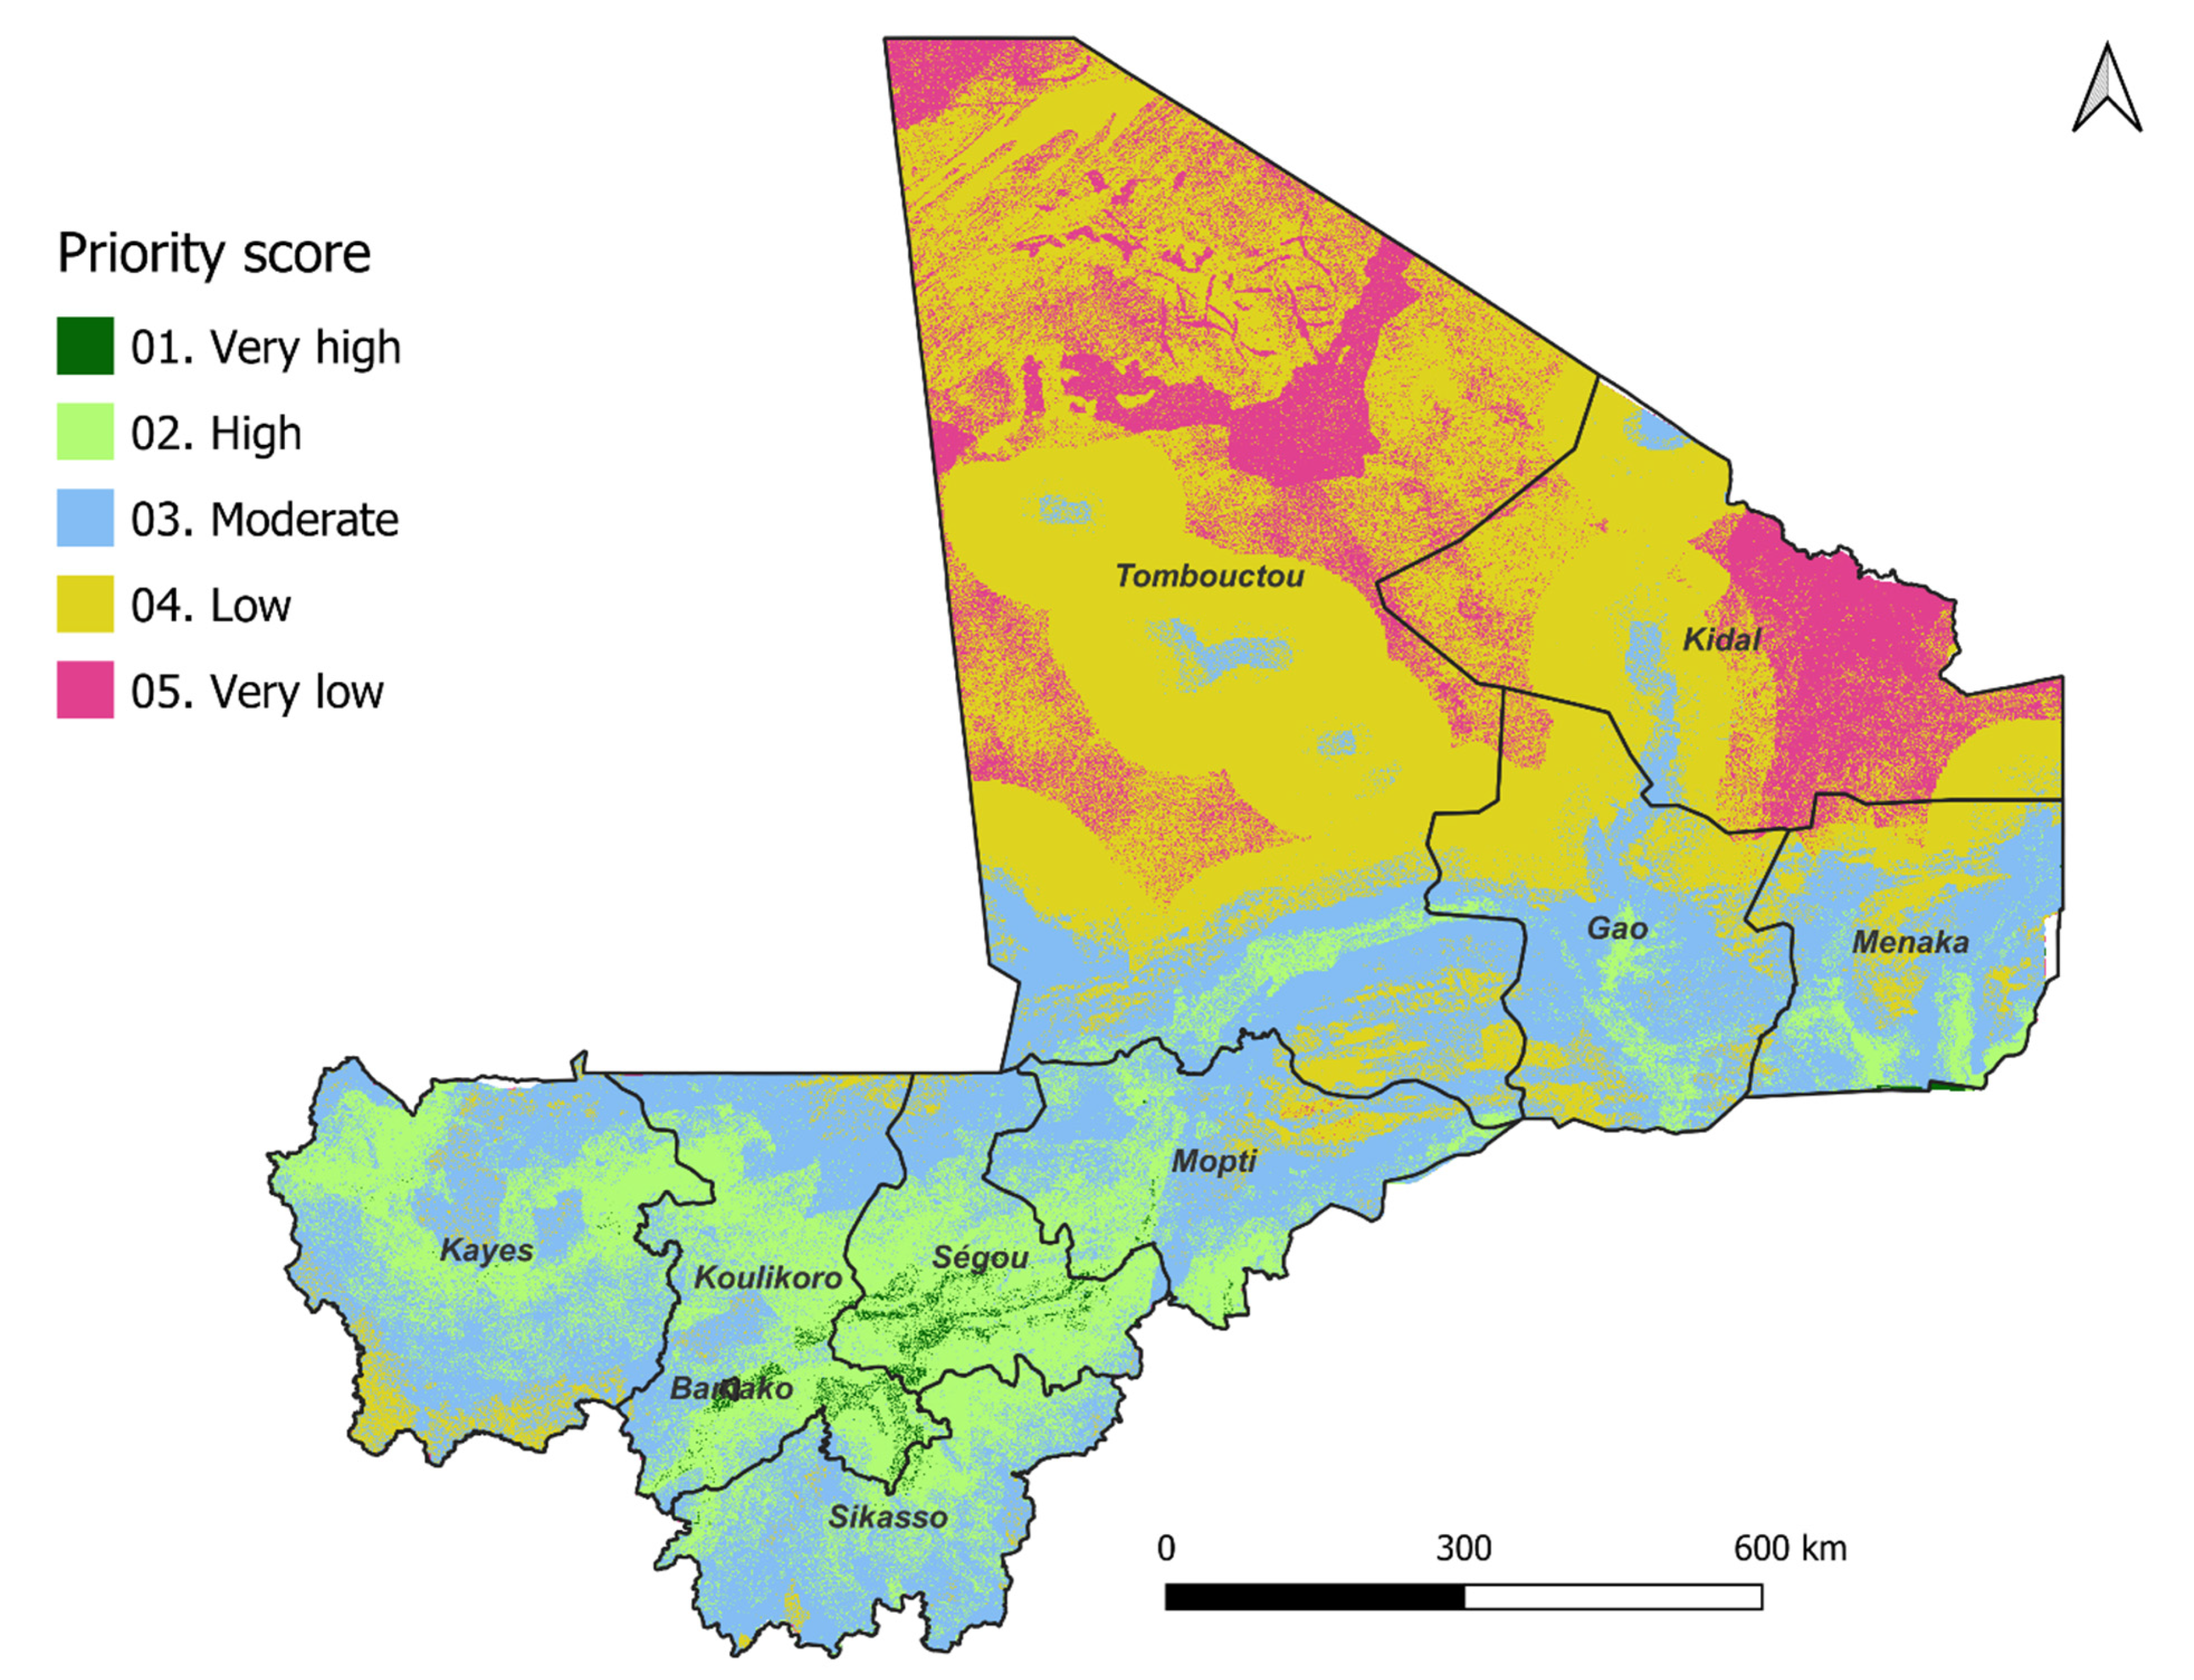
| Regions | Very High | High | Moderate | Low | Very Low | Row Sum |
|---|---|---|---|---|---|---|
| Bamako | 1380 (5.6%, 0.21%) | 23,159 (94.3%, 0.11%) | - | - | - | 24,538 |
| Koulikoro | 243,512 (2.68%, 38%) | 4,490,139 (49.4%,21.5%) | 4,099,692 (45%,10.8%) | 241,935 (2.6%, 0.48%) | 98 (0.01%, 0.0062%) | 9,075,377 |
| Kayes | 6504 (0.059%, 1%) | 4,449,044 (36%, 21.3%) | 6,752,207 (54.9%, 17.8%) | 1,074,172 (8.7%, 2.1%) | 12,281,927 | |
| Sikasso | 26,509 (0.37%, 4.1%) | 2,738,449 (38%, 13%) | 4,150,247 (58.9%, 11%) | 127,817 (1.8%, 0.2%) | - | 7,043,022 |
| Segou | 340,384 (5.5%, 53%) | 4,079,982 (66%, 19%) | 1,639,147 (26.6%, 4.3%) | 91,255 (1.4%, 0,18%) | - | 6,150,769 |
| Mopti | 23,159 (0.29%, 3.6%) | 2,369,782 (30%, 13%) | 4,765,284 (60%, 12.5%) | 712,403 (9%, 1.4%) | 10,150 (0.12%, 0.64%) | 7,880,777 |
| Gao | - | 858,648 (17%, 4%) | 5,007,811 (49%, 13%) | 4,066,777 (40%; 8%) | 138,558 (1.3%; 0.8%) | 10,071,793 |
| Tombouctou | - | 850,173 (17%, 4%) | 6,461,097 (12.9%, 17%) | 32,080,100 (64%; 64%) | 10,353,740 (20.8%; 65%) | 49,745,112 |
| Kidal | - | - | 676,531 (4.5%, 1.8%) | 9,114,105 (61%, 18.3%) | 5,120,353 (34%, 32%) | 14,910,989 |
| Menaka | - | 1,001,740 (13%, 4.8%) | 4,313,147 (56%, 11.4%) | 2,222,945 (28.8%, 4%) | 157,085 (2%, 0.9%) | 7,694,917 |
| Column sum | 641,448 | 20,861,115 | 37,865,163 | 49,731,509 | 15,779,986 | 124,879,221 |
Publisher’s Note: MDPI stays neutral with regard to jurisdictional claims in published maps and institutional affiliations. |
© 2022 by the authors. Licensee MDPI, Basel, Switzerland. This article is an open access article distributed under the terms and conditions of the Creative Commons Attribution (CC BY) license (https://creativecommons.org/licenses/by/4.0/).
Share and Cite
Attia, A.; Qureshi, A.S.; Kane, A.M.; Alikhanov, B.; Kheir, A.M.S.; Ullah, H.; Datta, A.; Samasse, K. Selection of Potential Sites for Promoting Small-Scale Irrigation across Mali Using Remote Sensing and GIS. Sustainability 2022, 14, 12040. https://doi.org/10.3390/su141912040
Attia A, Qureshi AS, Kane AM, Alikhanov B, Kheir AMS, Ullah H, Datta A, Samasse K. Selection of Potential Sites for Promoting Small-Scale Irrigation across Mali Using Remote Sensing and GIS. Sustainability. 2022; 14(19):12040. https://doi.org/10.3390/su141912040
Chicago/Turabian StyleAttia, Ahmed, Asad Sarwar Qureshi, Abdoulah M. Kane, Bokhir Alikhanov, Ahmed M. S. Kheir, Hayat Ullah, Avishek Datta, and Kaboro Samasse. 2022. "Selection of Potential Sites for Promoting Small-Scale Irrigation across Mali Using Remote Sensing and GIS" Sustainability 14, no. 19: 12040. https://doi.org/10.3390/su141912040
APA StyleAttia, A., Qureshi, A. S., Kane, A. M., Alikhanov, B., Kheir, A. M. S., Ullah, H., Datta, A., & Samasse, K. (2022). Selection of Potential Sites for Promoting Small-Scale Irrigation across Mali Using Remote Sensing and GIS. Sustainability, 14(19), 12040. https://doi.org/10.3390/su141912040


