Abstract
Understanding the shear characteristics of paddy fields is of great significance for the design of high-trafficability paddy wheels and to improve the trafficability of the tiller in paddy fields. Taking the paddy soil in Poyang Lake area of Jiangxi Province as the research object, a simple, self-designed bevameter was constructed to measure the apparent cohesion c and apparent internal friction angle of paddy soil with water content of 37% by weight using an annular shear plate. The effects of different shear speeds, shear grouser heights, and shear plate diameters on the measured c and were investigated. The measured values of c and were 1.89–2.35 kPa and 10.2–11.4°(deg), respectively. With the increase in shear speed, shear plate diameter, and grouser height, the value of c increased. Shear plate diameter and shear speed had small effect on c, whose change rate did not exceed 7.8%. However, shear grouser height had a greater influence on c, and the measured c increased by 24.5%. The influence of the three factors on followed the order: shear speed > shear plate diameter > shear grouser height, but the variation in did not exceed 1.2°(deg). The optimal operational conditions were: shear plate diameter of 250 mm with inner diameter of 150 mm, shear grouser height of 10 mm, with a shear speed of π/120 rad/s, and the apparent cohesion and apparent internal friction angle are 1887.8 pa and 11.06° (deg), respectively.
1. Introduction
Jiangxi Province is the main grain production region in China, ranking third in paddy sown area and total output. Improving the mechanization level of paddy field operations, and mechanizing paddy field cultivation, transplanting, fertilizing, and harvesting, can increase the production capacity [1,2]. The micro-tiller is the main power machine for paddy field cultivation, which is a light and compact mill type, enabling flexible operation [3]. However, when the wheel of the micro-tiller walks on the surface of the paddy soil, adhesion is low and running resistance and energy consumption is large due to severe sinking and slipping of the vehicle [4]. Therefore, it is important to improve the trafficability of the micro-tiller on the surface of the paddy soil [5,6,7].
Moreover, it is essential to understand the physical and mechanical properties of paddy soil for the design of reasonable soil-touching components. Previous studies have focused on synchronous side-deep fertilization of rice hole sowing [8,9] and mechanized rice direct seeding [10], which are related to paddy soil preparation and formation [11]. However, the above studies did not mention the mechanical properties of surface and subsurface paddy soil, such as soil-shear strength [12]. The main parameters for evaluating soil-shear strength are cohesion c (Pa) and internal friction angle (measured in degrees) [13], which are related by the Mohr–Coulomb law:
where is the shear stress (Pa) and is the normal stress (Pa). It should be noted that when the soils are moist, c and in the Mohr–Coulomb equation represent the apparent cohesion and apparent internal friction angle due to the effect of pore water pressure [14].
The methods for measuring soil shear strength are mainly divided into indirect and direct shear methods [15]. The indirect shear method usually estimates the shear strength of soil through soil compression and permeability tests [16,17], whereas the direct shear methods include translational methods and rotational methods. In the translational methods, the measured soil samples are placed into the direct shear box and four combined shear [18], double direct shear, and constant deformation direct shear apparatus [19,20] are applied to determine the shear strength. Alternately, shear grousers installed on the track are applied as a shear component [21] to obtain the shear strength. The rotational methods mainly use different types of rotational shear components to interact with the soil, such as hollow cylinders [22], ring-shear devices [23,24,25], torsional shearing devices [26,27], vane shear test tools [28,29], or direct shear testers with rotational displacement and unlimited strain [30]. The shear strength of various soil types is calculated by recording parameters such as normal stress, torsional shear force, shear displacement or angle, and velocity.
Paddy soil is a typical soft ground type with obvious stratification; the soil cap is composed of the plough layer and the plow pan layer. The depth of the plough layer is generally 18–22 cm, with loose soil, whereas the plow bottom is generally 6–9 cm, with dense soil. When the water content of paddy soil is between 22% and 35% by weight, the rotation shear method is generally used to test the in situ shear strength of the plough layer [28,31,32].
Therefore, a lightweight, portable bevameter with simple structure was designed herein to measure c and of surface and subsurface cohesive paddy soil with high water content. Subsequently, the effects of different shear speeds, shear grouser heights, and shear plate diameters on the shear mechanical parameters of paddy soil were investigated. The optimum test parameters were obtained according to the test results, and the apparent cohesion and apparent internal friction angle of paddy soil were measured under the test parameters.
2. Experiments and Methods
2.1. Sampling
Paddy soil was taken from the plough layer at a depth of 0–20 cm in 28.957370° N, 116.062260° E, Xinjian County, China. After drying and sieving, the physical parameters, including liquid and plastic limit, particle size distribution, and specific gravity (dry bulk density), were measured (Table 1). The liquid limit represents the threshold water content of the plastic state and the fluid state for clay soil. When the water content of the soil reaches or exceeds the liquid limit, plasticity changes to fluidity. Furthermore, there is almost no connection force between soil particles [33,34]. To improve the trafficability of the tiller operating in fluid soil and to understand the nature of the fluid soil, shear parameter tests were conducted on the fluid soil with a water content of 37% by weight, which is slightly above the liquid limit.

Table 1.
Physical parameters of the tested soil.
2.2. Test Device
The overall structure of the simple bevameter is shown in Figure 1. A control cabinet was installed on the braced frame, and an electromagnet was installed at the end of the electric push rod. The drive motor and the torque sensor were connected and linked to the shear shaft, which was used to fix the shear plate by a flange through a connecting piece.
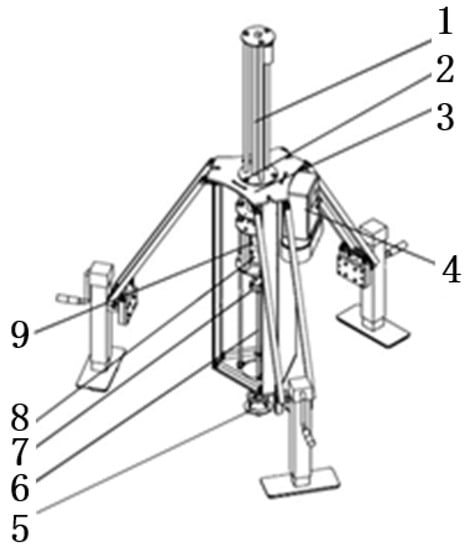
Figure 1.
Drawing showing the structure of the simple bevameter. 1. electric push rod, 2. coupling bolt, 3. braced frame, 4. control cabinet, 5. shear plate, 6. shear shaft, 7. connecting piece, 8. torque sensor, 9. drive motor.
When the shear test was carried out, a computer was used to input instructions to the control cabinet. After receiving the instructions, the control cabinet controlled the electric push rod to drive the drive motor, the torque sensor, and the shear plate to move down along the three linear guides as a whole. When the shear plate contacted the soil, the power supply of the electromagnet used to connect the electric push rod and the drive motor was disconnected. Then, the drive motor, the torque sensor, and the shear plate as a whole fell on the soil under the action of the system weight of 6.2477 kg and the shear plate gravity. After 30 s, the drive motor rotated and drove the shear plate to shear the soil.
The structure of the shear plate is shown in Figure 2. The shear ring is connected to the small disc by four screws, and a flange is fixed on the small disc to connect to the shear shaft. Figure 3 shows the schematic diagram of the shear ring and the grousers. The diameters of the outer and inner rings of the shear ring installed on the six grousers are D and d, respectively. This experiment involves three different diameters of shear plates (A, B, and C) and three different grouser heights (h). The specific sizes and total weights are shown in Table 2.
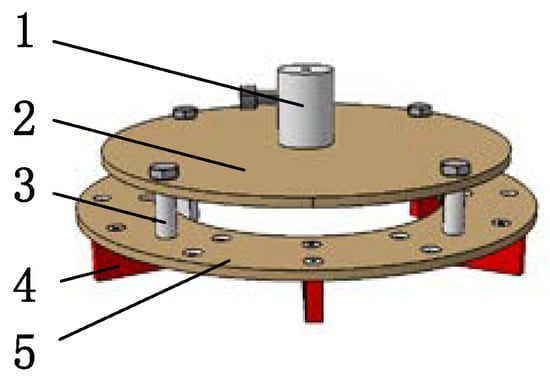
Figure 2.
Structure of the shear plate. 1. flange, 2. small disc, 3. screw, 4. grouser, 5. shear ring.
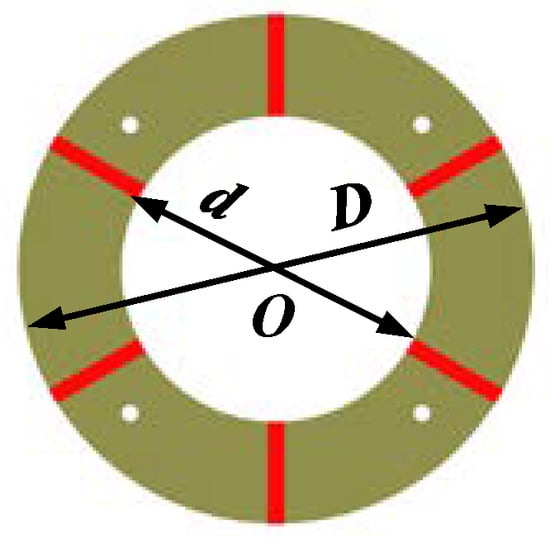
Figure 3.
Schematic diagram of the shear ring, where D and d are outer and inner diameter, respectively, and O is the center.
Table 2.
Specific size and total weight m1 values.
2.3. Testing Method
To investigate the most suitable conditions for field shear tests, the normal stress, which is the ground pressure on unit area of the shear plate, was taken as the independent variable. Subsequently, the soil shear mechanical parameters under different shear speeds (π/360, π/180, and π/120 rad/s), different grouser heights, and different shear plate diameters were measured.
The paddy soil shear test was carried out using a soil bin with a length of 5 m, a width of 1.2 m, and a height of 1.2 m. Prior to each test, the paddy soil was prepared by the rotary tiller. The specific preparation process was as follows: (1) adjusting the water content of the paddy soil at 37% by weight; (2) preparing the soil at a depth of 20 cm and a speed of 0.5 m/s; (3) smoothing the surface using a scraper. Subsequently, the following steps were taken:
- (1)
- Increasing the vertical load to the set value and inserting the control instruction of the electric push rod to drive the shear plate downward. When the shear plate contacted the soil, the electromagnet was disconnected, and the shear plate fell into the soil under gravity.
- (2)
- Ensuring the grousers fall into the soil, waiting 30 s, as shown in Figure 4a.
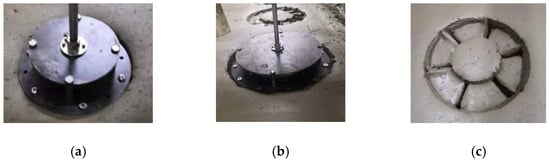 Figure 4. Testing process, (a) initial stage, (b) shear stage, (c) soil deformation.
 - (3)
- Starting the test and recording the test data.
- (4)
- After the test, connecting the electromagnet power supply and controlling the push rod to connect with the shear component to pull the shear plate back to the initial position. Figure 4b,c show the final state and soil deformation of the shear test.
- (5)
- Cleaning up the paddy soil adhered to the shear plate.
- (6)
- Repeating the process three times under the same conditions.
- (7)
- Replacing the test conditions, repeating the soil preparation and steps (1)–(6).
2.4. Shear Model
Janosi improved the Mohr–Coulomb law [35,36,37] and the modified equation is as follows:
where j is the soil shear displacement(m) and j0 is the shear stress-displacement curve modulus of the soil(m), which can be obtained by the relationship between soil shear stress and displacement (see Figure 5).
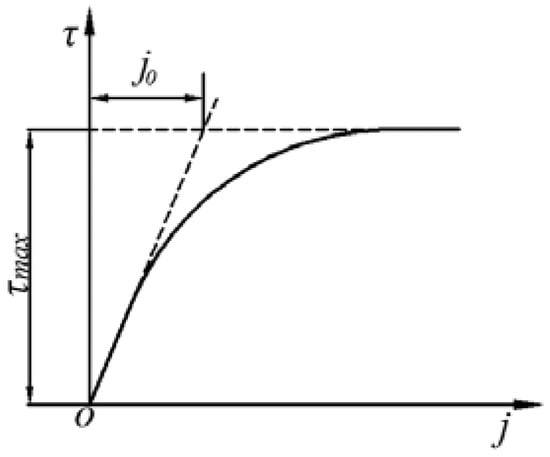
Figure 5.
Relationship between soil shear stress and displacement.
The main part of the simple bevameter is the shear ring, as shown in Figure 6, where r1 and r2 are the radii(m). The ring is divided into several infinitesimal elements ABCD, where is the angle of the differential element ABCD to the entire ring and is the width of the differential element. The torque T(N·m) of the entire ring can be calculated by the calculus method (Equation (3)):
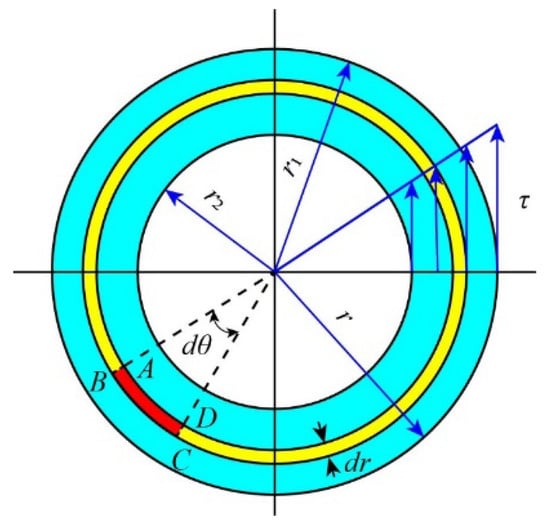
Figure 6.
Diagram of the shear ring section.
By solving Equation (3), the following formula is obtained:
Therefore, for the ring-shear device, by measuring the change in the torque acting on the center O point of the ring with the shear angle and the normal stress , combined with the Mohr–Coulomb law, c and of the soil can be determined.
3. Data Processing
The relationship between shear torque and time, obtained under different test conditions, was converted into the relationship between shear stress and angle. The torque was converted into the shear force, according to Equation (4), and the angle was obtained by multiplying the test time by the shear velocity. The normal stress of the test is a dependent variable and can be calculated by Equation (5):
where is the total weight(kg) of the shear plate, grousers and system, is the added weight(kg), and g is the acceleration of gravity(m·s−2).
To introduce the data source in more detail, the test results of shear plate A, with a grouser height of 30 mm and a shear speed of π/180 rad/s, were selected. Figure 7 shows the relationship between shear stress and shear angle under these conditions.
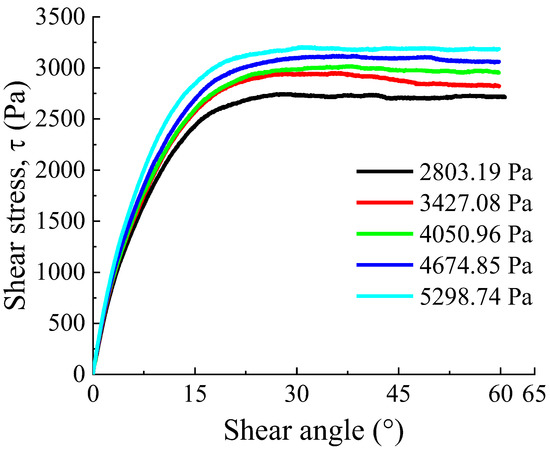
Figure 7.
Relationship between shear stress and shear angle.
As seen in Figure 7, the value of increases with the increase in shear angle, and its slope first increases and then decreases. Finally, it is horizontal, indicating that when a certain angle is reached, the value of no longer changes with an increase in rotational shear angle values.
With a simple transformation of Equation (2), the following formula is obtained:
where is the shear angle and is the shear stress–shear angle curve modulus(°measured in degrees, deg) of the soil, which can also be obtained by the method shown in Figure 5. The values of and , as shown in Table 3, can be obtained by fitting the relationship between the shear stress and the shear angle of the soil, according to Equation (6).
Table 3.
Values of and .
Based on the results, when the shear speed was π/180 rad/s and the normal stress was 2803.19–5298.74 Pa, the value of was 7.311–7.919° (deg). The value of obtained under different normal stress values was substituted into the Mohr–Coulomb law for fitting (Figure 8a). The coefficient of determination R2 was 0.98, and c and values were 2274.88 Pa and 10.26° (deg), respectively.
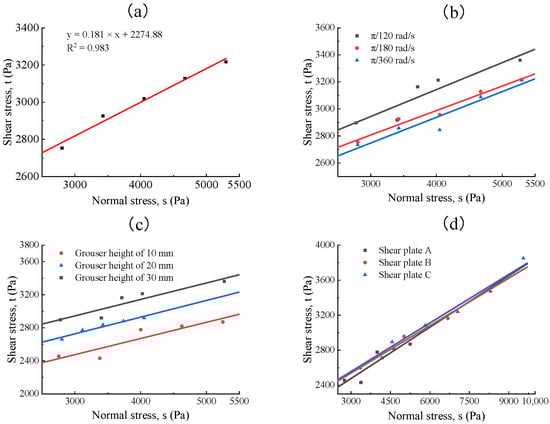
Figure 8.
(a) Fitting results of shear stress to normal stress, (b) Relation curve of normal stress–shear stress under different shear speeds, (c) Relation curve of normal stress–shear stress under different grouser heights, (d) Relationship between normal stress and shear stress under different shear plate diameters.
4. Results and Analysis
4.1. Influence of Shear Speed
To determine the influence of shear speed on the test results, the grouser height and the shear plate diameter should not be too small [24]. The smaller the diameter of the shear plate, the greater the sinkage during shearing under the same load, which would impede the instrument cleaning and testing. When the grouser height is too small, the measured shear stress is relatively small, leading to a large error. Thus, the shear plate A and the grouser height of 30 mm were selected for comparison of the soil shear strength under different shear speeds. The relation curve of the normal stress–shear stress is shown in Figure 8b, from which the slope and intercept of the straight line were obtained. Based on this, c and were calculated as shown in Table 4.
Table 4.
Values of and under different shear speeds.
Based on Table 4, the value of c increased from 2177.4 to 2346.2 Pa with the increase in shear speeds, with a variation of 7.75%, indicating that the shear speed had little effect on the value of c. The value of first decreased and then increased, with a variation of approximately 1.0° (deg), indicating that the shear speed also had little effect on the value of . Considering the measurement error and the subtle differences in each soil preparation, it can be concluded that the shear speed has little or no effect on the test results, consistent with the literature [30]. Based on the in situ test, the shear speed of π/120 rad/s was selected for the subsequent experiments.
4.2. Influence of Grouser Height
To investigate the influence of grouser height on the soil shear strength, the shear plate A and a shear speed of π/120 rad/s were selected. The relation curve of normal stress–shear stress is shown in Figure 8c. Table 5 shows the values of apparent cohesion c and apparent internal friction angle , obtained according to the intercept and slope of the fitting line.
Table 5.
Values of and under different grouser heights.
Based on the results shown in Table 5, grouser height only slightly affected under the same shear plate and shear speed. The value of changed within 0.36° (deg) with the change in grouser height. The value of c changed greatly from 1887.8 to 2346.2 Pa with increase in grouser height, with a change rate of 24.3%. However, it is usually considered advantageous for accurate results to use grousers that are as low as possible because the error produced by soil shear at the side edges decreases. Therefore, the test results obtained with a grouser height of 10 mm are closest to the actual values because failure occurs not only in the horizontal plane (r1 − r2), but also in the inner and outer vertical cylindrical surfaces of the annulus [14].
4.3. Influence of Shear Plate Diameter
To investigate the influence of shear plate diameter on the shear results, grouser height of 10 mm and shear speed of π/120 rad/s were selected. The relationship between normal stress and shear stress is shown in Figure 8d, and c and were obtained as shown in Table 6, according to the intercept and slope of the fitting line.
Table 6.
Values of and under different shear plate diameters.
Based on Table 6, at consistent shear grouser heights and shear speeds, the measured c increased gradually, with a small change rate, when the shear plate diameter decreased. Moreover, the variation of was only about 0.8° (deg) with the change in shear plate diameter. Thus, it can be inferred that the shear plate diameters had little effect on the measured results of c and . However, the larger the shear plate diameter, the smaller the sinkage caused by the flow of soil under the same load, facilitating subsequent instrument cleaning. Therefore, the choice of a shear plate with a larger diameter is beneficial to the test in the field experiment [11]. Based on these results, the optimal conditions were found to be: shear plate A with an outer diameter of 250 mm and an inner diameter of 150 mm, a grouser height of 10 mm, and a shear speed of π/120 rad/s.
5. Conclusions
The shear mechanical parameters of cohesive soil in the paddy plough layer, with a water content of about 37% by weight, were measured using a simple bevameter. The values of c and were 1887.8–2346.2 Pa and 10.2–11.4° (deg), respectively. The results show that the shear speed and the shear plate diameters have little effect on the soil test results. When the shear speed is π/360 rad/s, the apparent cohesion and apparent internal friction angle are 2177.4 pa and 10.76 ° (deg), respectively. When the shear speed is π/120 rad/s, the apparent cohesion and apparent internal friction angle are 2346.2 pa and 11.25 °(deg) deg, respectively. The increase rates are 7.75% and 4.55%, respectively, and there is no significant change. The value of c changed greatly from 1887.8 to 2346.2 Pa with increase in grouser height, with a change rate of 24.3%. For in situ tests, it is recommended to select a shear plate with outer diameter of 250 mm and inner diameter of 150 mm, a shear grouser height of 10 mm, and a shear speed of π/120 rad/s, to obtain accurate results. Understanding the mechanical parameters of paddy soil can not only help evaluate the performance of conventional agricultural machinery in paddy fields, but also provide a soil parameter basis for drag reduction optimization of tillage components and soil tillage. Future work will focus on equations taking the grouse height into account.
Author Contributions
Data curation, L.L. and J.Z.; Methodology, L.L. and J.Z.; Software, B.H. and Y.Z.; Supervision, M.L.; Writing—original draft, L.X.; Writing—review & editing, L.X. and J.L. All authors have read and agreed to the published version of the manuscript.
Funding
This work was partially funded by the National Natural Science Foundation of China (51865018) and the Natural Science Foundation of Jiangxi Province (20192BAB206025).
Conflicts of Interest
The authors declare that they have no known competing financial interests or personal relationships that could have appeared to influence the work reported in this paper.
References
- Zhen, H.; Li, J.; Gao, P.; Huang, B.; Ni, J.; Wei, C. Determining the Shear Strength and Permeability of Soils for Engineering of New Paddy Field Construction in a Hilly Mountainous Region of Southwestern China. Int. J. Environ. Res. Public Health 2020, 17, 1555–1558. [Google Scholar]
- Kuipers, H. Tillage machinery systems as related to cropping systems. J. Terramechanics 1985, 22, 176. [Google Scholar] [CrossRef]
- Zeng, J.; Li, J.; Li, L.; Qiu, H.; Wu, C.; Bao, Y.; Liu, M.; Xue, L. Traction Performance Test of Micro-cultivator Wheel in Paddy Soil. Acta Agric. Univ. Jiangxiensis 2022, 1–9. Available online: https://kns.cnki.net/kcms/detail/36.1028.S.20220101.1324.006.html (accessed on 21 August 2022).
- Li, J.; Huang, H.; Wang, Y.; Tian, L.; Ren, L. Research Progress of Soft Ground Machine System. Trans. Chin. Soc. Agric. Mach. 2015, 46, 306–320. [Google Scholar]
- Massah, J.; Noorolahi, S. Design, development and performance evaluation of a tractor-mounted bevameter. Soil Tillage Res. 2010, 110, 161–166. [Google Scholar] [CrossRef]
- Ani, O.A.; Uzoejinwa, B.B.; Ezeama, A.O.; Onwualu, A.P.; Ugwu, S.N.; Ohagwu, C.J. Overview of soil-machine interaction studies in soil bins. Soil Tillage Res. 2018, 175, 13–27. [Google Scholar] [CrossRef]
- Zhao, R.; Hu, L.; Luo, X.; Zhang, W.; Chen, G.; Huang, H.; Lai, S.; Liu, H. Method for estimating vertical kinematic states of working implements based on laser receivers and accelerometers. Biosyst. Eng. 2021, 203, 9–21. [Google Scholar] [CrossRef]
- Zhong, X.; Peng, J.; Kang, X.; Wu, Y.; Luo, G.; Hu, W.; Zhou, X. Optimizing agronomic traits and increasing economic returns of machine-transplanted rice with side-deep fertilization of double-cropping rice system in southern China. Field Crops Res. 2021, 270, 108191. [Google Scholar] [CrossRef]
- Chen, X.; Luo, X.; Wang, Z.; Zhang, M.; Hu, L.; Zeng, S.; Mo, Z. Experimental Study on Synchronous Lateral Deep Fertilization Technology of Rice Seeding in Hole. Trans. Chin. Soc. Agric. Eng. 2014, 30, 1–7. [Google Scholar]
- Zhang, M.; Wang, Z.; Luo, X.; Zang, Y.; Yang, W.; Xing, H.; Wang, B.; Dai, Y. Review of precision rice hill-drop drilling technology and machine for paddy. Int. J. Agric. Biol. Eng. 2018, 11, 1–11. [Google Scholar] [CrossRef]
- Larson, W.E.; Blake, G.R.; Allmaras, R.R.; Voorhees, W.B.; Gupta, S.C. Mechanics and Related Processes in Structured Agricultural Soils; Springer Science & Business Media: Berlin/Heidelberg, Germany, 1989. [Google Scholar]
- Koolen, A.J.; Vaandrager, P. Relationships between soil mechanical properties. J. Agric. Eng. Res. 1984, 29, 313–319. [Google Scholar] [CrossRef]
- Wong, J.Y. Theory of Ground Vehicles; John Wiley & Sons: New York, NY, USA, 2001. [Google Scholar]
- Koolen, A.J.; Kuipers, H. Agricultural Soil Mechanics; Springer: Berlin/Heidelberg, Germany, 1983. [Google Scholar]
- Stefanow, D.; Dudziński, P.A. Soil shear strength determination methods—State of the art. Soil Tillage Res. 2021, 208, 104881. [Google Scholar] [CrossRef]
- Elton, D.; Patawaran, M.A. Mechanically Stabilized Earth Reinforcement Tensile Strength from Tests of Geotextile-Reinforced Soil. Transp. Res. Rec. J. Transp. Res. Board 2004, 1868, 81–88. [Google Scholar] [CrossRef]
- Tsuchida, T.; Noguchi, T. Determination of design shear strength of clay based on the comparison between unconfined compressive strength and the strength obtained by triaxial test. Jpn. Geotech. Soc. Spec. Publ. 2016, 2, 451–456. [Google Scholar] [CrossRef]
- Dadkhah, R.; Ghafoori, M.; Ajalloeian, R.; Lashkaripour, G.R. The Effect of Scale Direct Shear Test on the Strength Parameters of Clayey Sand in Isfahan City, Iran. J. Appl. Sci. 2010, 10, 2027–2033. [Google Scholar] [CrossRef]
- Feng, X.; Ding, Q.; Ding, W.; Ji, C.; Wang, D. The relationship between cone index of remolded clay and shear strength. Trans. Chin. Soc. Agric. Eng. 2011, 27, 146–150. [Google Scholar]
- Fang, H.; Zhang, Q.; Ji, C.; Guo, J. Soil shear properties as influenced by straw content: An evaluation of field-collected and laboratory-remolded soils. J. Integr. Agric. 2016, 15, 2824–2854. [Google Scholar] [CrossRef]
- Dudzinski, P.A.; Stefanow, D. Method for predicting dynamic shear strength in soils—Part II: Validation of the new criterion using an innovative test device. J. Terramechanics 2019, 86, 39–46. [Google Scholar] [CrossRef]
- Ye, B.; Lu, J.; Ye, G. Pre-shear effect on liquefaction resistance of a Fujian sand. Soil Dyn. Earthq. Eng. 2015, 77, 15–23. [Google Scholar] [CrossRef]
- Apfelbeck, M.; Kuß, S.; Rebele, B.; Schäfer, B. A systematic approach to reliably characterize soils based on Bevameter testing. J. Terramechanics 2011, 48, 360–371. [Google Scholar] [CrossRef][Green Version]
- Pan, J.; Ji, C. Fuzzy clustering of paddy field soils in South China. J. Terramechanics 1998, 35, 21–24. [Google Scholar]
- Iverson, N.R.; Baker, R.W.; Hooyer, T.S. A ring-shear device for the study of till deformation: Tests on tills with contrasting clay contents. Quat. Sci. Rev. 1997, 16, 1057–1066. [Google Scholar] [CrossRef]
- Schjønning, P. Topsoil shear strength—Measurements and predictions. Soil Tillage Res. 2021, 212, 105049. [Google Scholar] [CrossRef]
- Schjønning, P.; Lamandé, M.; Keller, T.; Labouriau, R. Subsoil shear strength—Measurements and prediction models based on readily available soil properties. Soil Tillage Res. 2020, 200, 104638. [Google Scholar] [CrossRef]
- Cerato, A.B.; Lutenegger, A.J. Disturbance Effects of Field Vane Tests in a Varved Clay. In Proceedings of the 2nd International Conference on Site Characterization, Porto, Portugal, 19–22 September 2004. [Google Scholar]
- Olmedo, N.A.; Fisseha, B.; Wilson, W.; Barczyk, M.; Lipsett, M.G. An automated vane shear test tool for environmental monitoring with unmanned ground vehicles. J. Terramechanics 2020, 91, 53–63. [Google Scholar] [CrossRef]
- Schmitt, R.; Feise, H. Influence of Tester Geometry, Speed and Procedure on the Results from a Ring Shear Tester. Part. Part. Syst. Charact. 2010, 21, 403–410. [Google Scholar] [CrossRef]
- Ji, C.; Pan, J. Research on fuzzy prediction of soil strength in paddy field. Trans. Chin. Soc. Agric. Mach. 1999, 2, 8–12. [Google Scholar]
- Ji, C.; Chen, M.; Pan, J. Research on the methods and instruments for predicting the sinkage of paddy vehicles according to the rheological properties of paddy soil. Trans. Chin. Soc. Agric. Mach. 1986, 1, 21–31. Available online: https://oversea.cnki.net/KCMS/detail/detail.aspx?dbcode=CJFD&dbname=CJFD8589&filename=NYJX198601002&uniplatform=OVERSEA&v=E0Kcm_MoeEUSFdioNC282gG9C62vjFNcgCdL7sbxbBL_eizXt9aQIq72mhQIBFBm (accessed on 21 August 2022).
- Zheng, L.; Luo, X.; Zeng, S.; Wang, Z. Experiment on shear characteristics of rice stubble-soil complex. Trans. Chin. Soc. Agric. Mach. 2017, 48, 63–71. [Google Scholar]
- Tagar, A.A.; Ji, C.; Ding, Q.; Adamowski, J.; Chandio, F.A.; Mari, I.A. Soil failure patterns and draft as influenced by consistency limits: An evaluation of the remolded soil cutting test. Soil Tillage Res. 2014, 137, 58–66. [Google Scholar] [CrossRef]
- Edwards, M.B.; Dewoolkar, M.M.; Huston, D.R.; Creager, C. Bevameter testing on simulant Fillite for planetary rover mobility applications. J. Terramechanics 2017, 70, 13–26. [Google Scholar] [CrossRef]
- Mason, G.L.; Salmon, J.E.; McLeod, S.; Jayakumar, P.; Cole, M.P.; Smith, W. An overview of methods to convert cone index to bevameter parameters. J. Terramechanics 2020, 87, 1–9. [Google Scholar] [CrossRef]
- Xue, L.; Li, J.; Zou, M.; Zong, W.; Huang, H. In situ identification of shearing parameters for loose lunar soil using least squares support vector machine. Aerosp. Sci. Technol. 2016, 53, 154–161. [Google Scholar] [CrossRef]
Publisher’s Note: MDPI stays neutral with regard to jurisdictional claims in published maps and institutional affiliations. |
© 2022 by the authors. Licensee MDPI, Basel, Switzerland. This article is an open access article distributed under the terms and conditions of the Creative Commons Attribution (CC BY) license (https://creativecommons.org/licenses/by/4.0/).