Article

Spatial Mapping of Jamaica’s High-Resolution Wind Atlas: An Environmental-Sociotechnical Account

1
Graduate School of Science, Technology, Information Sciences, Tsukuba University, 1-1-1, Tennodai, Tsukuba City 305-8577, Japan
2
Graduate School of Life and Environmental Sciences, Tsukuba University, 1-1-1, Tennodai, Tsukuba City 305-8577, Japan
*
Author to whom correspondence should be addressed.
Sustainability 2022, 14(19), 11933; https://doi.org/10.3390/su141911933
Submission received: 30 June 2022 / Revised: 9 September 2022 / Accepted: 14 September 2022 / Published: 21 September 2022

Abstract

:
To utilize wind energy, how it works, its value, and where the best locations are for extrapolation must be understood. A high-resolution wind atlas of Jamaica aids the understanding of the sociophysical phenomena leading to a better understanding of wind energy on the island. This study incorporates a mesoscale method with eight years of relevant data in ArcGIS 10.8.1 to derive then indicate sites for potential onshore wind power plants (WPP). It uses secondary and real-time data from domestic and international sources to evaluate economic, environmental, and sociotechnical criteria. The results indicate a high possibility for future wind power (WP) generation expansion since 2867.15 km2, 26% of the land is available. With the installation of Vestas V80 turbines, 62,818.71 GWh/year can be generated. Conversely, Vestas V112 turbine installation can produce 56,321.74 GWh/year of electrical energy. The average speed goes up to 12.5 miles per hour, while the power density of the 10% windiest areas is between 156.60 and 768.37 W/m2 at 50 m above ground, with several parishes having appropriate locations for WPPs. Thus, 29-point sites are identified in the study. However, St. Elizabeth and Manchester are most favorable, with mean wind speeds of 8.26 m/s and 10.08 m/s, respectively, in the excellently suitable zones. The research offers several advantages, which encompass the quantification of wind potential with and without prohibition, assessment of wind suitability on the island of Jamaica, reduction in environmental damage, and available data amelioration to aid better energy policy decisions, which will ensure a faster and easier transition from fossil fuel (FF) to renewable energy (RE) to meet Jamaica’s 2030 50% RE generation target. Specifically, the atlases will assist policymakers and WP developers in making informed decisions by reducing costs, time, and ambiguities to enhance the development of renewable energy use for electrical energy in Jamaica. The Geographical Information System (GIS), which is one of the most popular energy assessment tools, was utilized to derive suitable land zones of 24.41 to 26% for onshore wind farm development in Jamaica. It incorporates environmental, economic, social, safety, and technical criteria with underlining categorical variables as indicators to derive the quantitative values appropriate for Jamaica’s landscape and comparable to international studies with similar objectives. It found that unrestricted areas can theoretically generate up to 62,818 GWh per year of electrical energy.

1. Introduction

Wind energy is a fast-growing renewable energy (RE) technology worldwide because of its benefits. Its efficient, safe, and environmentally sustainable nature causes it to be an attractive RE source though it is a relatively new technology [1,2]. In addition, the locally inexhaustive nature, competitive prices, recent technological developments, decarbonization mechanism, and reduced costs are among its advantages, as mentioned by Xu and Liu, 2020 [3]; and Cross, 2018 [4]. Therefore, it continues to proliferate, with the International Energy Agency pointing to onshore wind electricity generation increasing by 144 terawatts-hour (TWh) (+11%) in 2020, which has doubled since 2019, namely because of increased commissioning in the United States and China [5].
The Caribbean region has also seen an average 10% increase in electricity generation from wind energy by 2020 [6]. Moreover, the area has seen project growth and technological development over the past 20 years, making this power source among the fastest growing in the Caribbean [6]. Indeed, the region’s location makes it privy to great wind power density values above average compared to other places in the subtropical Atlantic Ocean, owing to the relatively low humidity and intense radiation coupled with high winds typical of tropical locations. Moreover, the strong northeastern trade winds in the Atlantic Ocean from the North Atlantic Subtropical High (NASH) contribute to increased power densities [7,8].
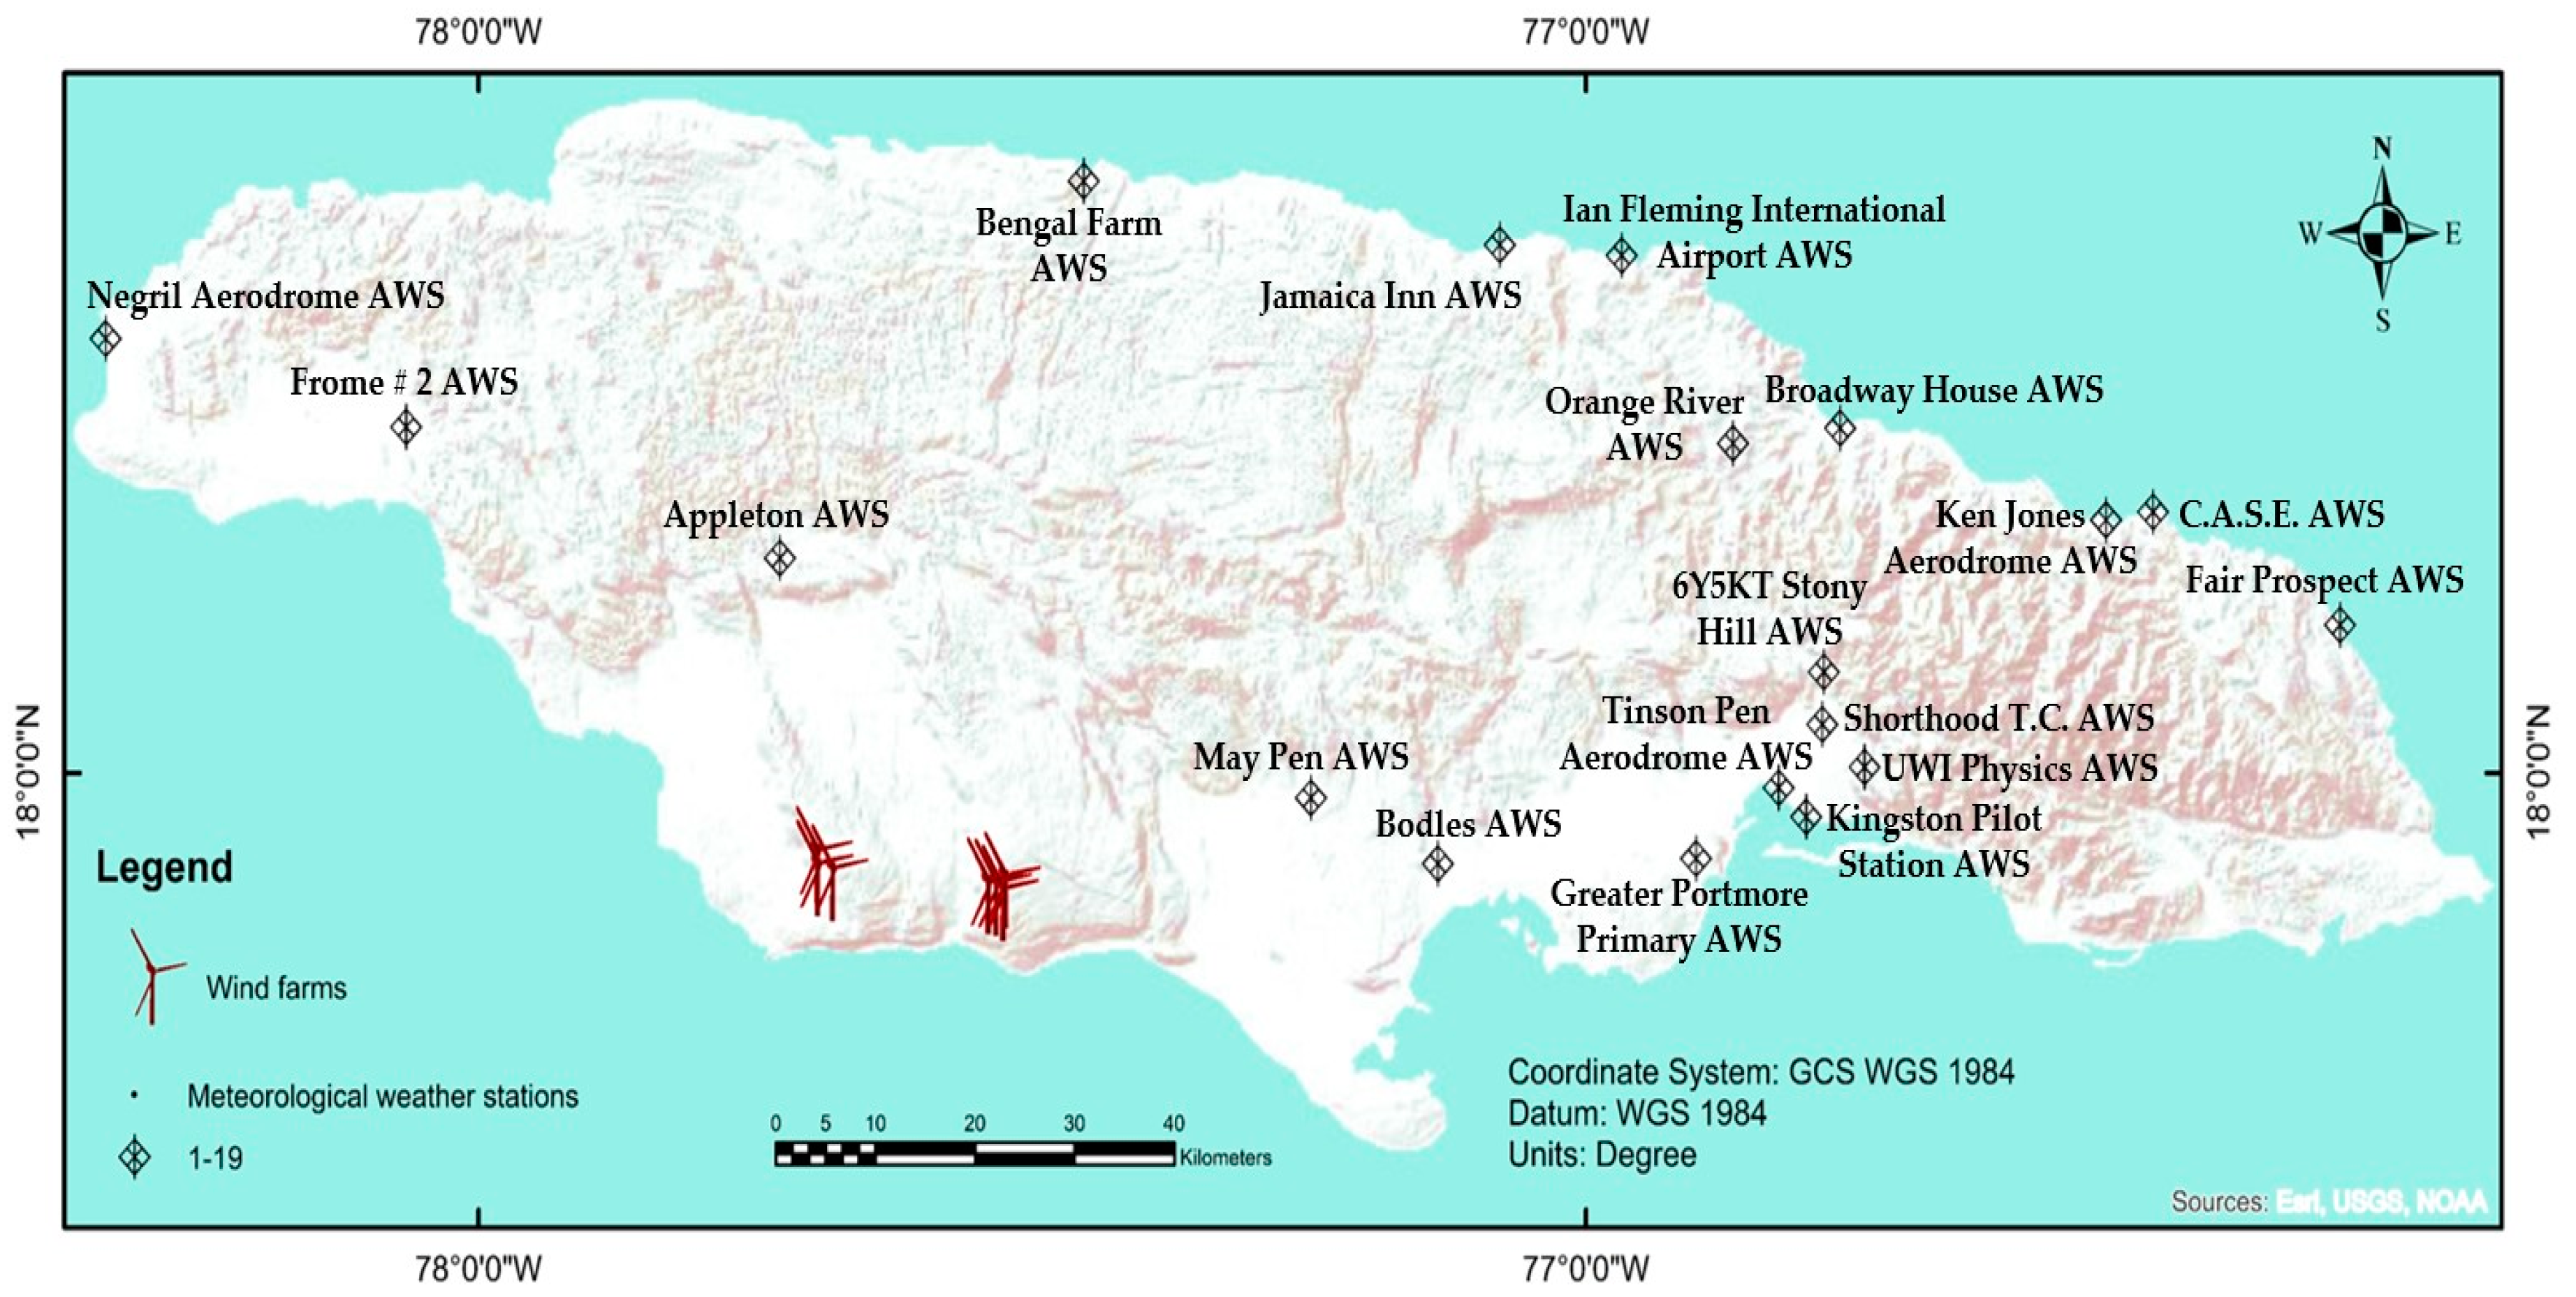
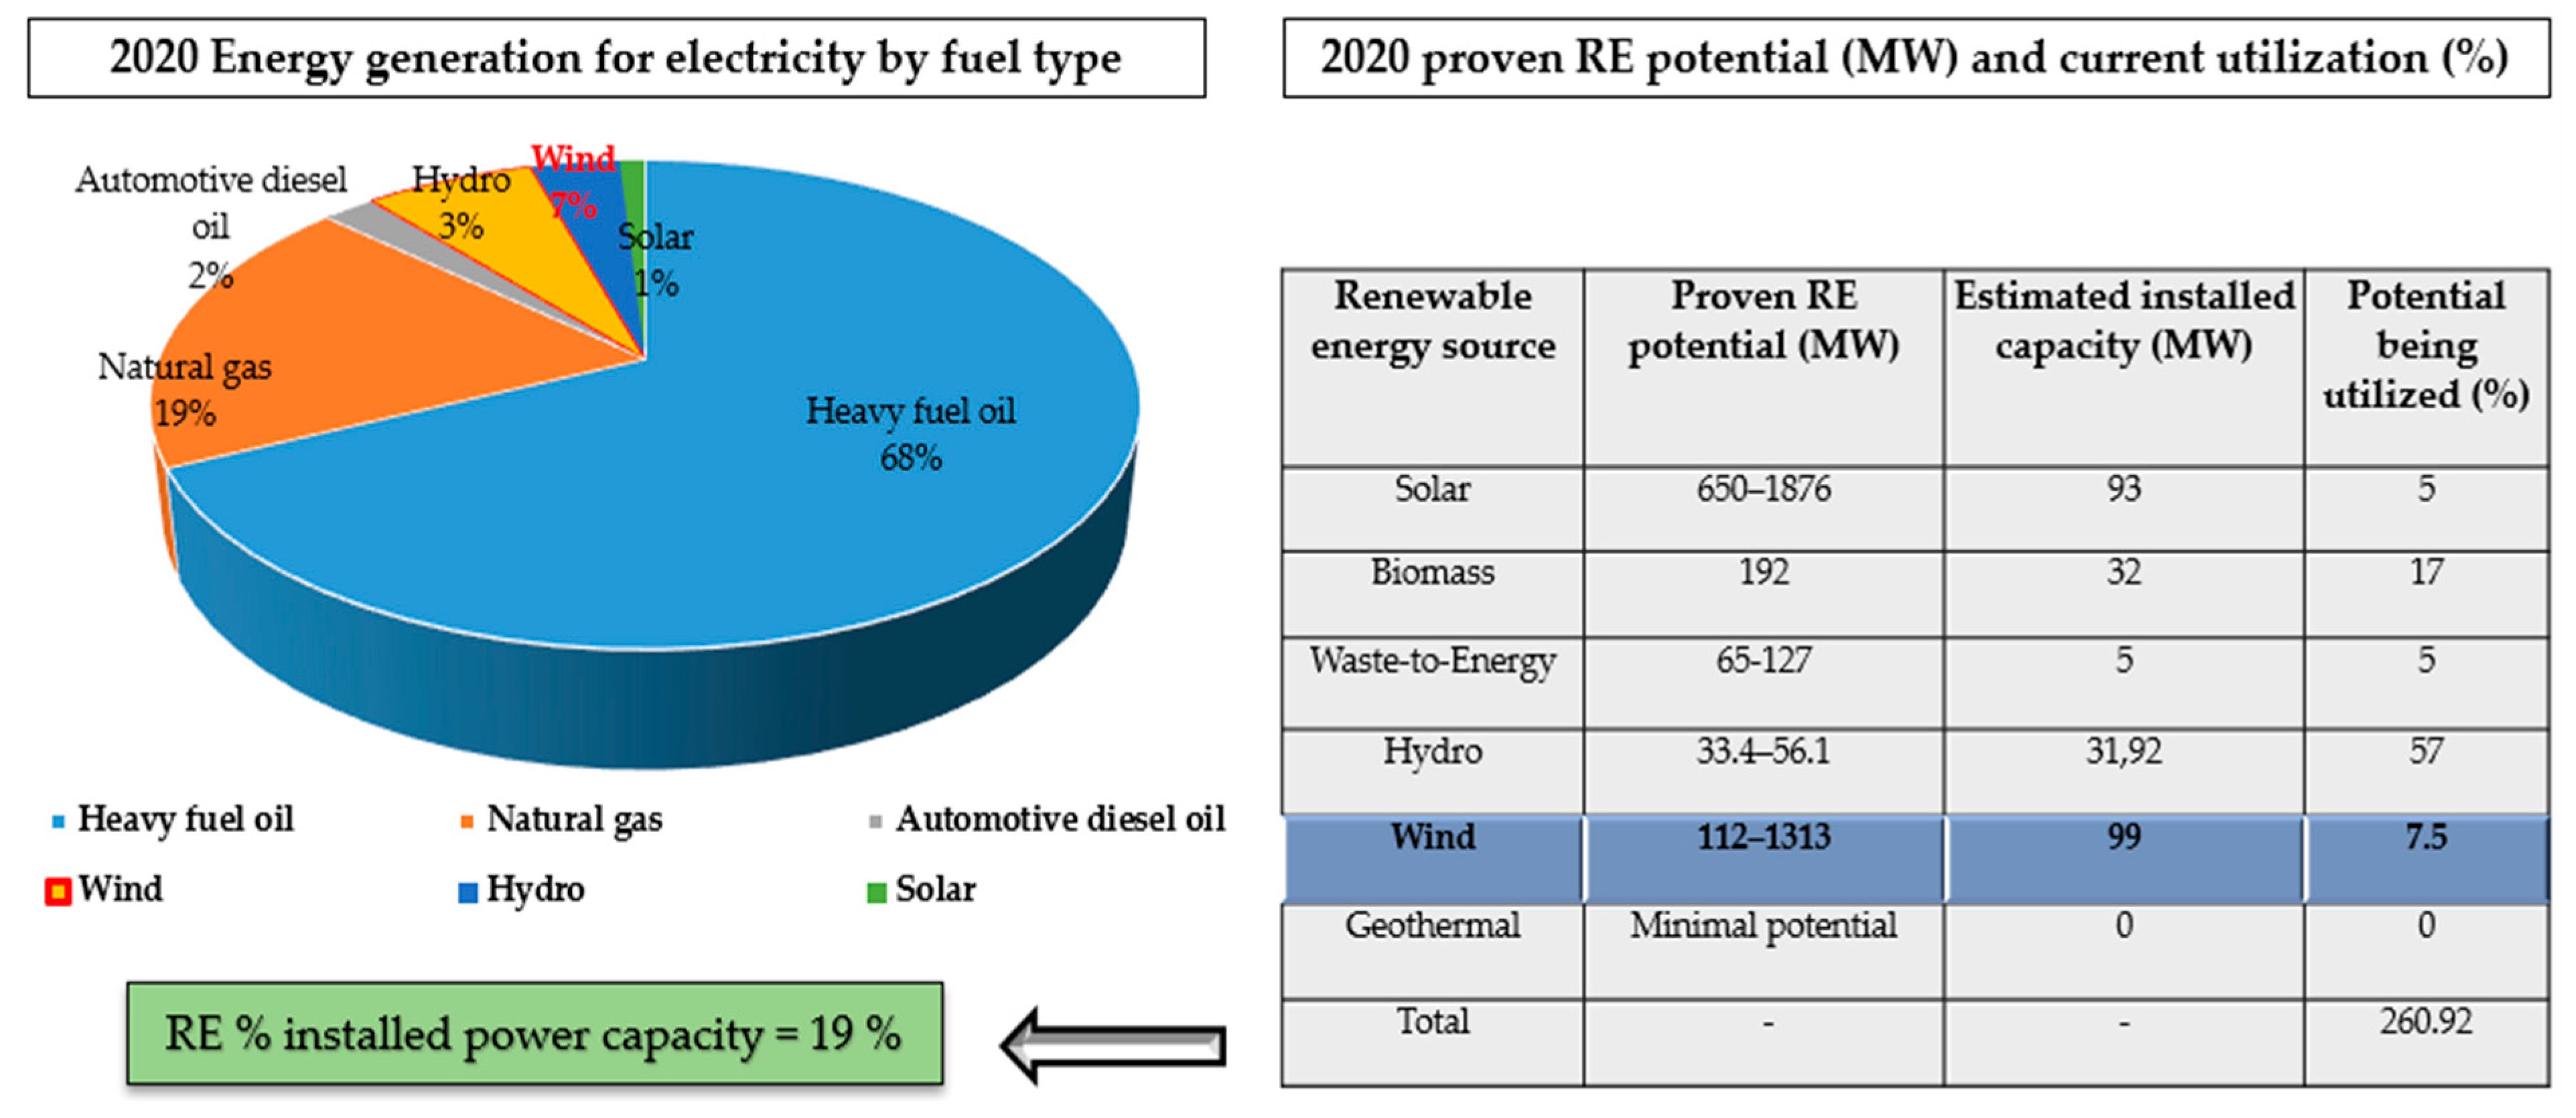
Jamaica, like its neighbors, boasted a high wind speed of up to 15 m/s annually within the eight years calculated in this study. Like solar power, wind power is in the early stages of development in terms of its potential to expand, utilizing 99 MW of the estimated 1313 MW, which is 7.54% [9,10,11]. Figure 1 indicates the current wind-based energy used for the island’s electrification. Four onshore wind plants comprising six farms that cover the 99 MW output generation are shown in Table 1. Moreover, the enormous untapped potential requires the promotion of wind power expansion.
Consequently, considering past studies by Bailey et al., 2013 [14], Chen et al., 1990 [15], Chen et al., 2020 [16], the Romanian Agency for International Development Cooperation—RoAid, 2019 [17], among others, the study aims to provide wind atlases (WAs) with suitable locations for future wind farms utilizing current data. Subsequently, the specific objectives are to create comprehensive high-resolution onshore WAs with socioeconomic, environmental, and technical factors included in the assessment and give suitable locations for utility-scale WPP. It is hypothesized that favorable wind conditions brought about by the northeasterly trade winds will yield several appropriate areas where wind farms can be deployed, as indicated in the island’s wind rose, Figure 2.
Jamaica’s National Energy Policy serves to promote wind power expansion but has no clear demarked rules regarding wind power installation for RE expansion. It welcomes new investor opportunities in mini-hydro, wind, solar, biomass, and waste-to-energy, namely, to decrease the costs of renewable energy while offsetting expenditure spent on imported petroleum coupled with unstable oil prices, according to the Ministry of Science, Energy, and Technology, 2017, in the Jamaica Energy Investor Guide, 2017 [19]. However, expansion is contingent on site and resource assessments, as these are primary factors when considering wind power generation.
This study’s high-resolution resource wind atlases eliminate challenges brought about by environmental and socioeconomic impediments. The evaluation applies comprehensive time-series data spanning eight years, 2009 to 2017, to improve the available data for policymakers considering the national RE plan outlined in the Jamaica National Energy Policy (NEP), keeping with its long-term commitment to becoming a developed nation by 2030 according to Vision 2030 Jamaica–National Development Plan (NDP) [20]. The targets include a 20% renewable energy mix of total energy supply by 2030 with 70% diversification among renewable energy sources and a greenhouse gas emission (GHG) reduction of 7.8% [9,20,21]. Moreover, on October 16, 2018, the prime minister of Jamaica, Andrew Holiness, directed the government to increase the target to 50% [12,18]. Given Jamaica’s RE goals and future development plans, onshore utility-scale wind farm (WF) expansion is warranted.

2. Materials and Methods

This section explains the methods and materials adopted when collecting and analyzing data for creating incorporated wind atlases. The methodology used in developing socioenvironmental-technical WAs of Jamaica is based on mesoscale modeling with local topographic or thermally induced circulation data integrated with the Global Wind Atlas (GWA), a web-based application used to identify locations with high winds for potential wind power exploitation. The source data has a 250 m horizontal resolution derived by downscaling or microscaling the topographic information of the ERA5, the fifth generation of atmospheric reanalysis data set from the European Center for Medium-Range Weather Forecast (ECMWF) at different levels above ground (AGL) as of 1950 to present. It supplies hourly data of ample land, atmospheric, and oceanic climate variables. Precisely, the modeling process composes WAsP, wind resources assessment by software incorporating wind conditions for siting wind turbines on wind farms. Calculation of local wind climates for every 250 m at five heights, 10, 50, 100, 150, and 200 m, with a 250 m grid local wind climate evaluation for every node was executed [22].
Secondary plus real-time large-scale, long-term atmospheric, and topographic data were also gathered from the National Aeronautics and Space Administration (NASA), the National Oceanic and Atmospheric Administration (NOAA), and the Jamaica Meteorological Service Division (metServiceJA). Data utilized spans a period of eight years, given availability. After data gathering and compilation, the statistical processing resulted in small-scale representational output. ArcGIS, 10.8.1 was used to determine the most suitable locations for individual power plants with utility-scale WFs integrating techniques outlined by Matejicek, 2017 [23], and Shahinkhoo, 2018 [24], in “Assessment of energy sources using GIS” and “A GIS-based approach for analyzing wind energy development in SH”, respectively [23,24].
Figure 3 outlines different portions of the methodology used to create the wind atlases presented in this paper. First, the study used 50 and 100 m AGL, the former representative of the current hub height placement of most wind turbines on wind farms in Jamaica, while the latter denotes the hub height used on modern-day wind farms [25,26]. Data was then utilized based on varying wind-based literature from scientific journals and textbooks gathered from Science Direct, Google Scholar, and Amazon book sale databases. The study aimed to determine the most valuable parameters for these wind atlases. Furthermore, environmental risk assessments of potential WFs were carried out in ArcGIS with the 3D analysis tool to produce a roughness index map. Subsequently, atlases in this work served as possible solutions toward eliminating challenges when installing utility-scale WFs.

2.1. Data Gathering and Selection

The first step in developing wind atlases was to gather relevant data from diverse sources for a stratified approach to classifying systems. These sources included scientific research articles and wind climate high-resolution mesoscale data from GWA, NASA, NOAA, and Jamaica Meteorological Service Division (metServiceJA) of the Ministry of Housing, Urban Renewal, Environment, and Climate Change, which provided solar and wind data from 2008 to 2019. The wind speed measurements used nineteen different weather stations. These are located on various parts of the island, including Appleton, Bengal Farm, Bodles, Broadway House, Burnt Ground, College of Agricultural Science (CASE), Duckenfield, Fair Prospect, Fort George Botanical, Greater Portmore Primary, Grove Place, Ken Jones Aerodrome, Manson River, May Pen, Orange Valley (Orange River), Shorthood Teachers’ College (Shorthood T.C.), Roehampton, Tinson Pen, and University of the West Indies Physics AWS. Figure 4 indicates meteorological mast location coverage, which is comprehensive with varying positions all over Jamaica and indicates current wind turbine locations. Despite Jamaica having six wind farms, most are at 50 m hub height, although modern-day wind farms are at approximately 100 m, as noted in the works of Enevoldsen and Permien, 2018 [25], plus von Krauland et al., 2021 [26]. The physical measurements were summarized using Microsoft Excel Processing and then coupled with a high-resolution mesoscale dataset of 250 m horizontal resolution in ArcGIS 10.8.1 for geoprocessing.

2.2. Resource Assessment

Several factor variables for restricted and suitable site locations were decided from the literature review to determine potential wind energy availability. The model encapsulates wind power exploitation encompassing environmental, social, economic, and technical aspects. Table 2 and Table 3 specify some literature scrutinized to derive the restricted parameters. Furthermore, Table 3 underscores an account of the constraint variables and their importance to the selection method.

2.3. Geoprocessing

Geoprocessing involves comparing and analyzing data by utilizing a specific framework with tools to transform geographic and related data to produce new output datasets as direct results. This study consists of buffering restricted areas by measured distances, then reclassifying rasterized data of boundaries with restrictions, and finally, using rasterized layers to data-mine available land territory. Given the obstructive nature of wind turbines, creating distance between land-use infrastructure and wind turbines on utility-scaled farms is essential. Thus, buffered spaces applied in the study are treated as constraint variables for wind classification using a binary scale within which zero represents a restriction that is not viable for wind power development. Alternatively, one (1) illustrates feasible areas without prohibition for onshore wind development. These constraint variables were combined into binary form and multiplied to produce the constrained wind layer. Distances applied to the buffer zones are within the range of numerous studies highlighted in Table 3. Additionally, regulations from the National Environmental and Planning Agencies in Jamaica were applied after an extensive literature review. Adaptation of local standards serves to authenticate local context as is required for suitability.

2.4. Wind Resources Analysis

Knowing wind speed is essential to determining the potential energy of wind values and then locating appropriate sites. Thus, records from anemometer data proved useful as data gathered from this instrument was extrapolated for the quantitative assessment of wind speed profile. Wind regimes recorded by anemometer require data from 12 or more months [30]. However, site-specific recordings are more useful for investor value. The study utilized a mesoscale model developed by the Technical University of Denmark (DTU) in GWA. The data was compared to that gathered from the nineteen meteorological towers across Jamaica, as illustrated in Figure 4.
In the results section, the potential annual energy yield from two energy turbines currently used in Jamaica was commutated by information from the measured data set. GWA fills the gap of providing interrupting data outweighing that provided by metServiceJA, which bore missing information. Local non-commercial digital wind data was unavailable notwithstanding the production of wind atlases by Chen et al., 1990 [15], Romania’s International Development Cooperation Agency (RoAid), 2019 [16], and the Ministry of Science, Energy, and Technology, 2017 [19]. However, these studies neglect to reference specific wind thresholds and locations. The maps represent cumulative energy potential, but as wind development expands, it helps provide atlases with distinct hub height references of 50 to 100 m for an average size capacity of 2 or greater MW onshore wind farms [30].

Wind Speed Selection

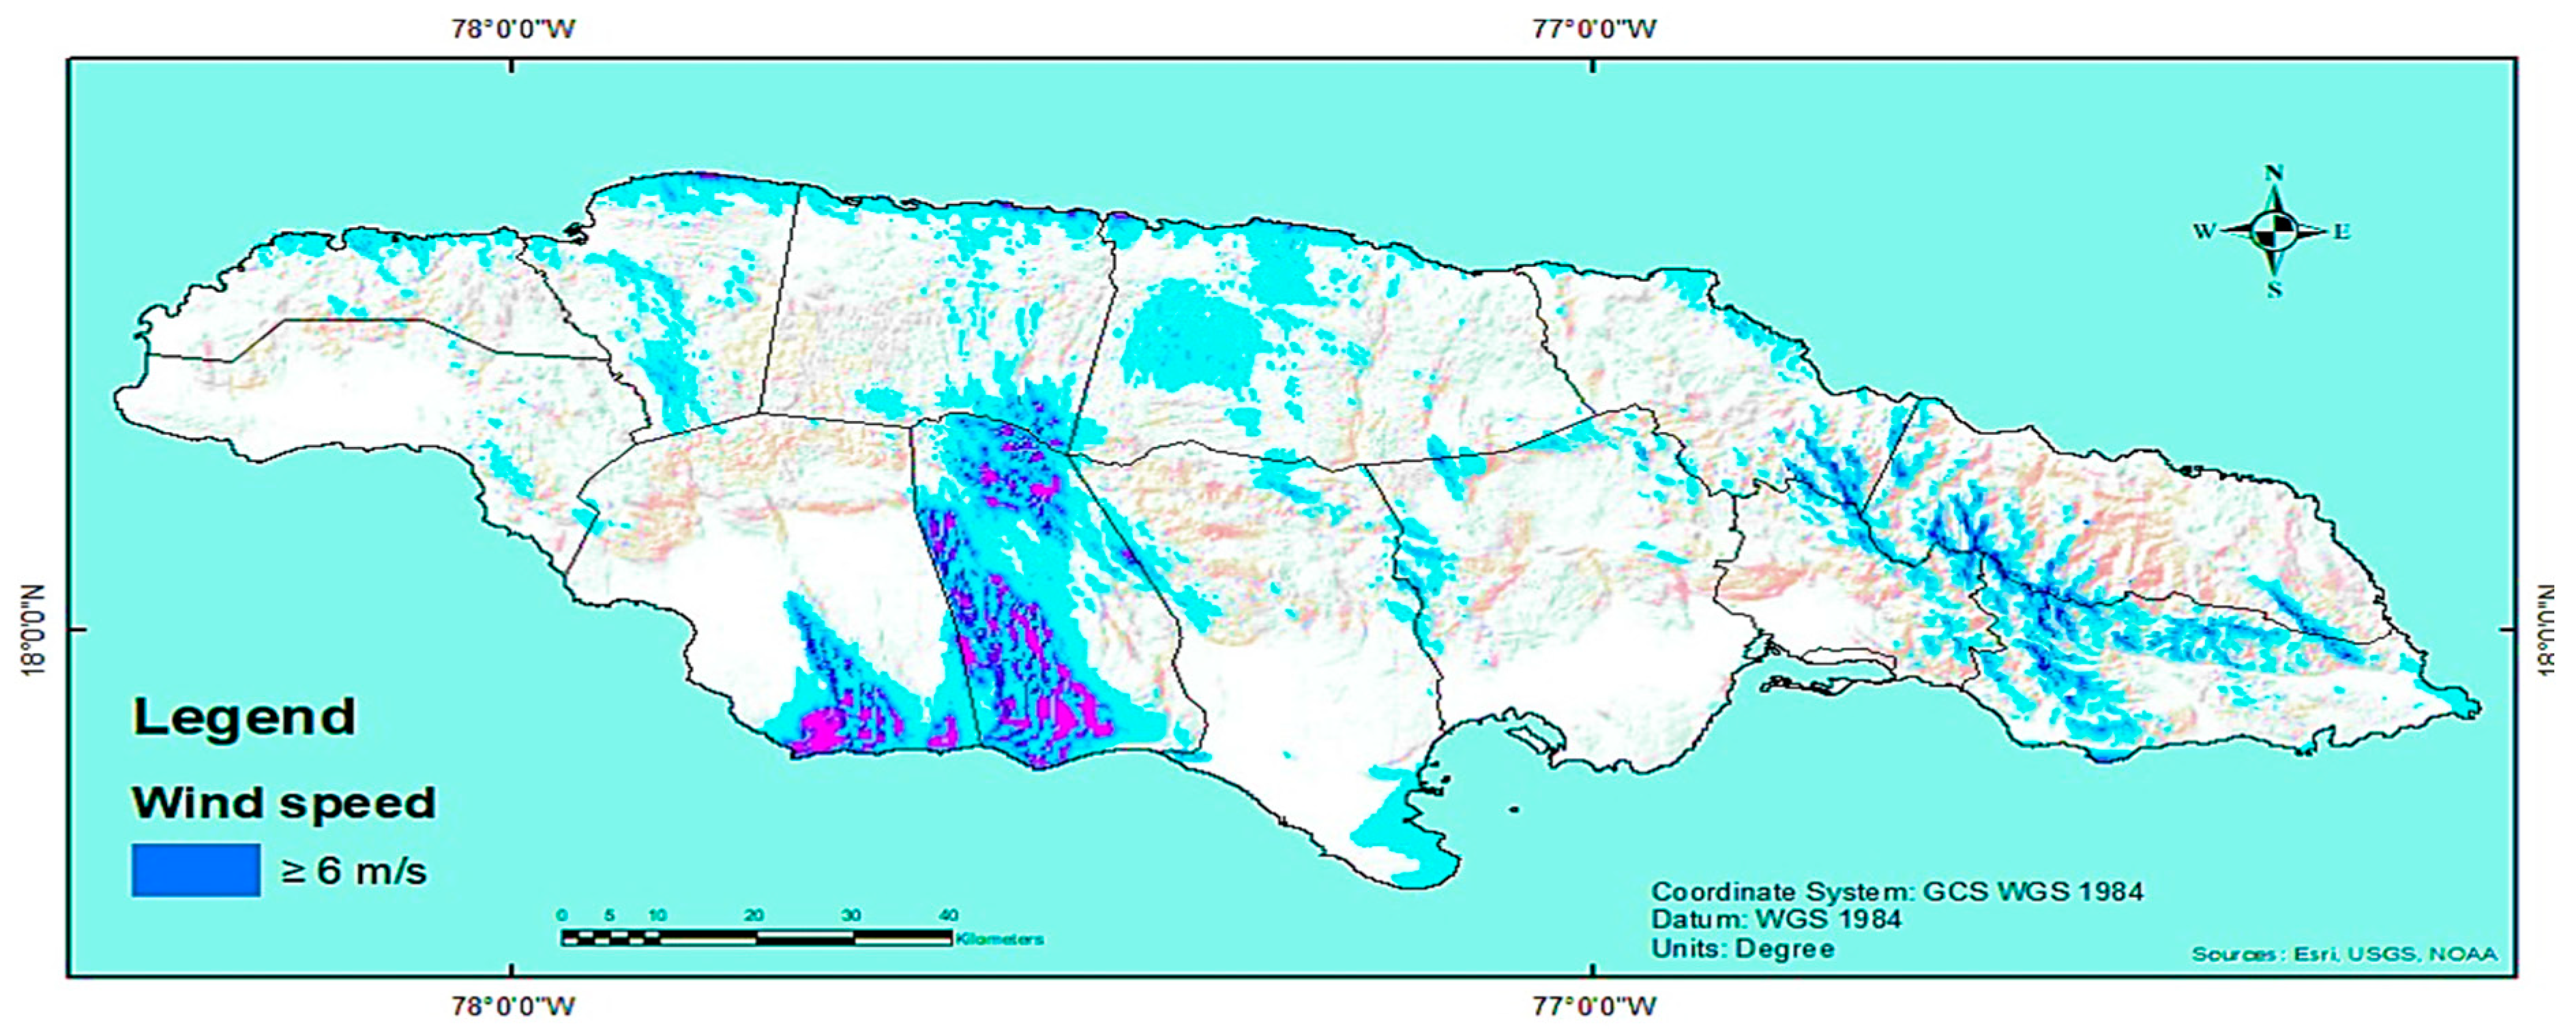
The selection of appropriate wind speed at ideal locations constitutes an essential requirement for a good wind farm site choice, which means selecting the correct information from a modicum of available data. Consequently, the atlases incorporated annual mean wind speeds with an average of ≥6 m/s wind speed at altitudes of 50 and 100 m, as displayed in Figure 5. Information contained within the accounts for long-term time series climate atmospheric and terrain data of eight years, including weekly, monthly, plus yearly wind measured by met mast stations is represented in Figure 4.

2.5. Developing Suitability for Environmental-Sociotechnical Atlas

The literature review provided extensive wind atlas data from different countries, which were applied to the generated Jamaican atlases. Several of these academic contributions focused heavily on wind resource and their quantification. For instance, in the works by Chen, 1990 [15], RoAid, 2019 [17], von Krauland et al., 2021 [26], Enevoldsen and Permien, 2018 [29], and Warren and McFadyen, 2010 [39]. However, while this approach is novel, expanded examination revealed a high combination of mesoscale data sets alongside physical landscape measurement, and climate data results can be included for a robust research design that effectively reflects the study area’s structural and functional characterization for fitting long-term wind-related RE investments, as carried out in this study. Such a study is valuable when choosing a wind farm’s site location.
Previous GIS-based wind atlas studies’ methodology was applied to this research to create a more expansive dimension for the inclusion of criteria defined within the subcategories of environmental, social, technical, and economic parameters, which might ultimately negatively or positively affect a site’s choice [27,28,33] and [30]. Zahedi et al., 2022 [33] and Enevoldsen and Permien, 2018 [29] classified variables that accounted for the criteria measurements; this study adopted a similar approach. Table 3 provides the restrictions and descriptions of selected variables. Furthermore, the study considered the application of selected wind turbines and energy output from chosen turbines based on current utilization in Jamaica.
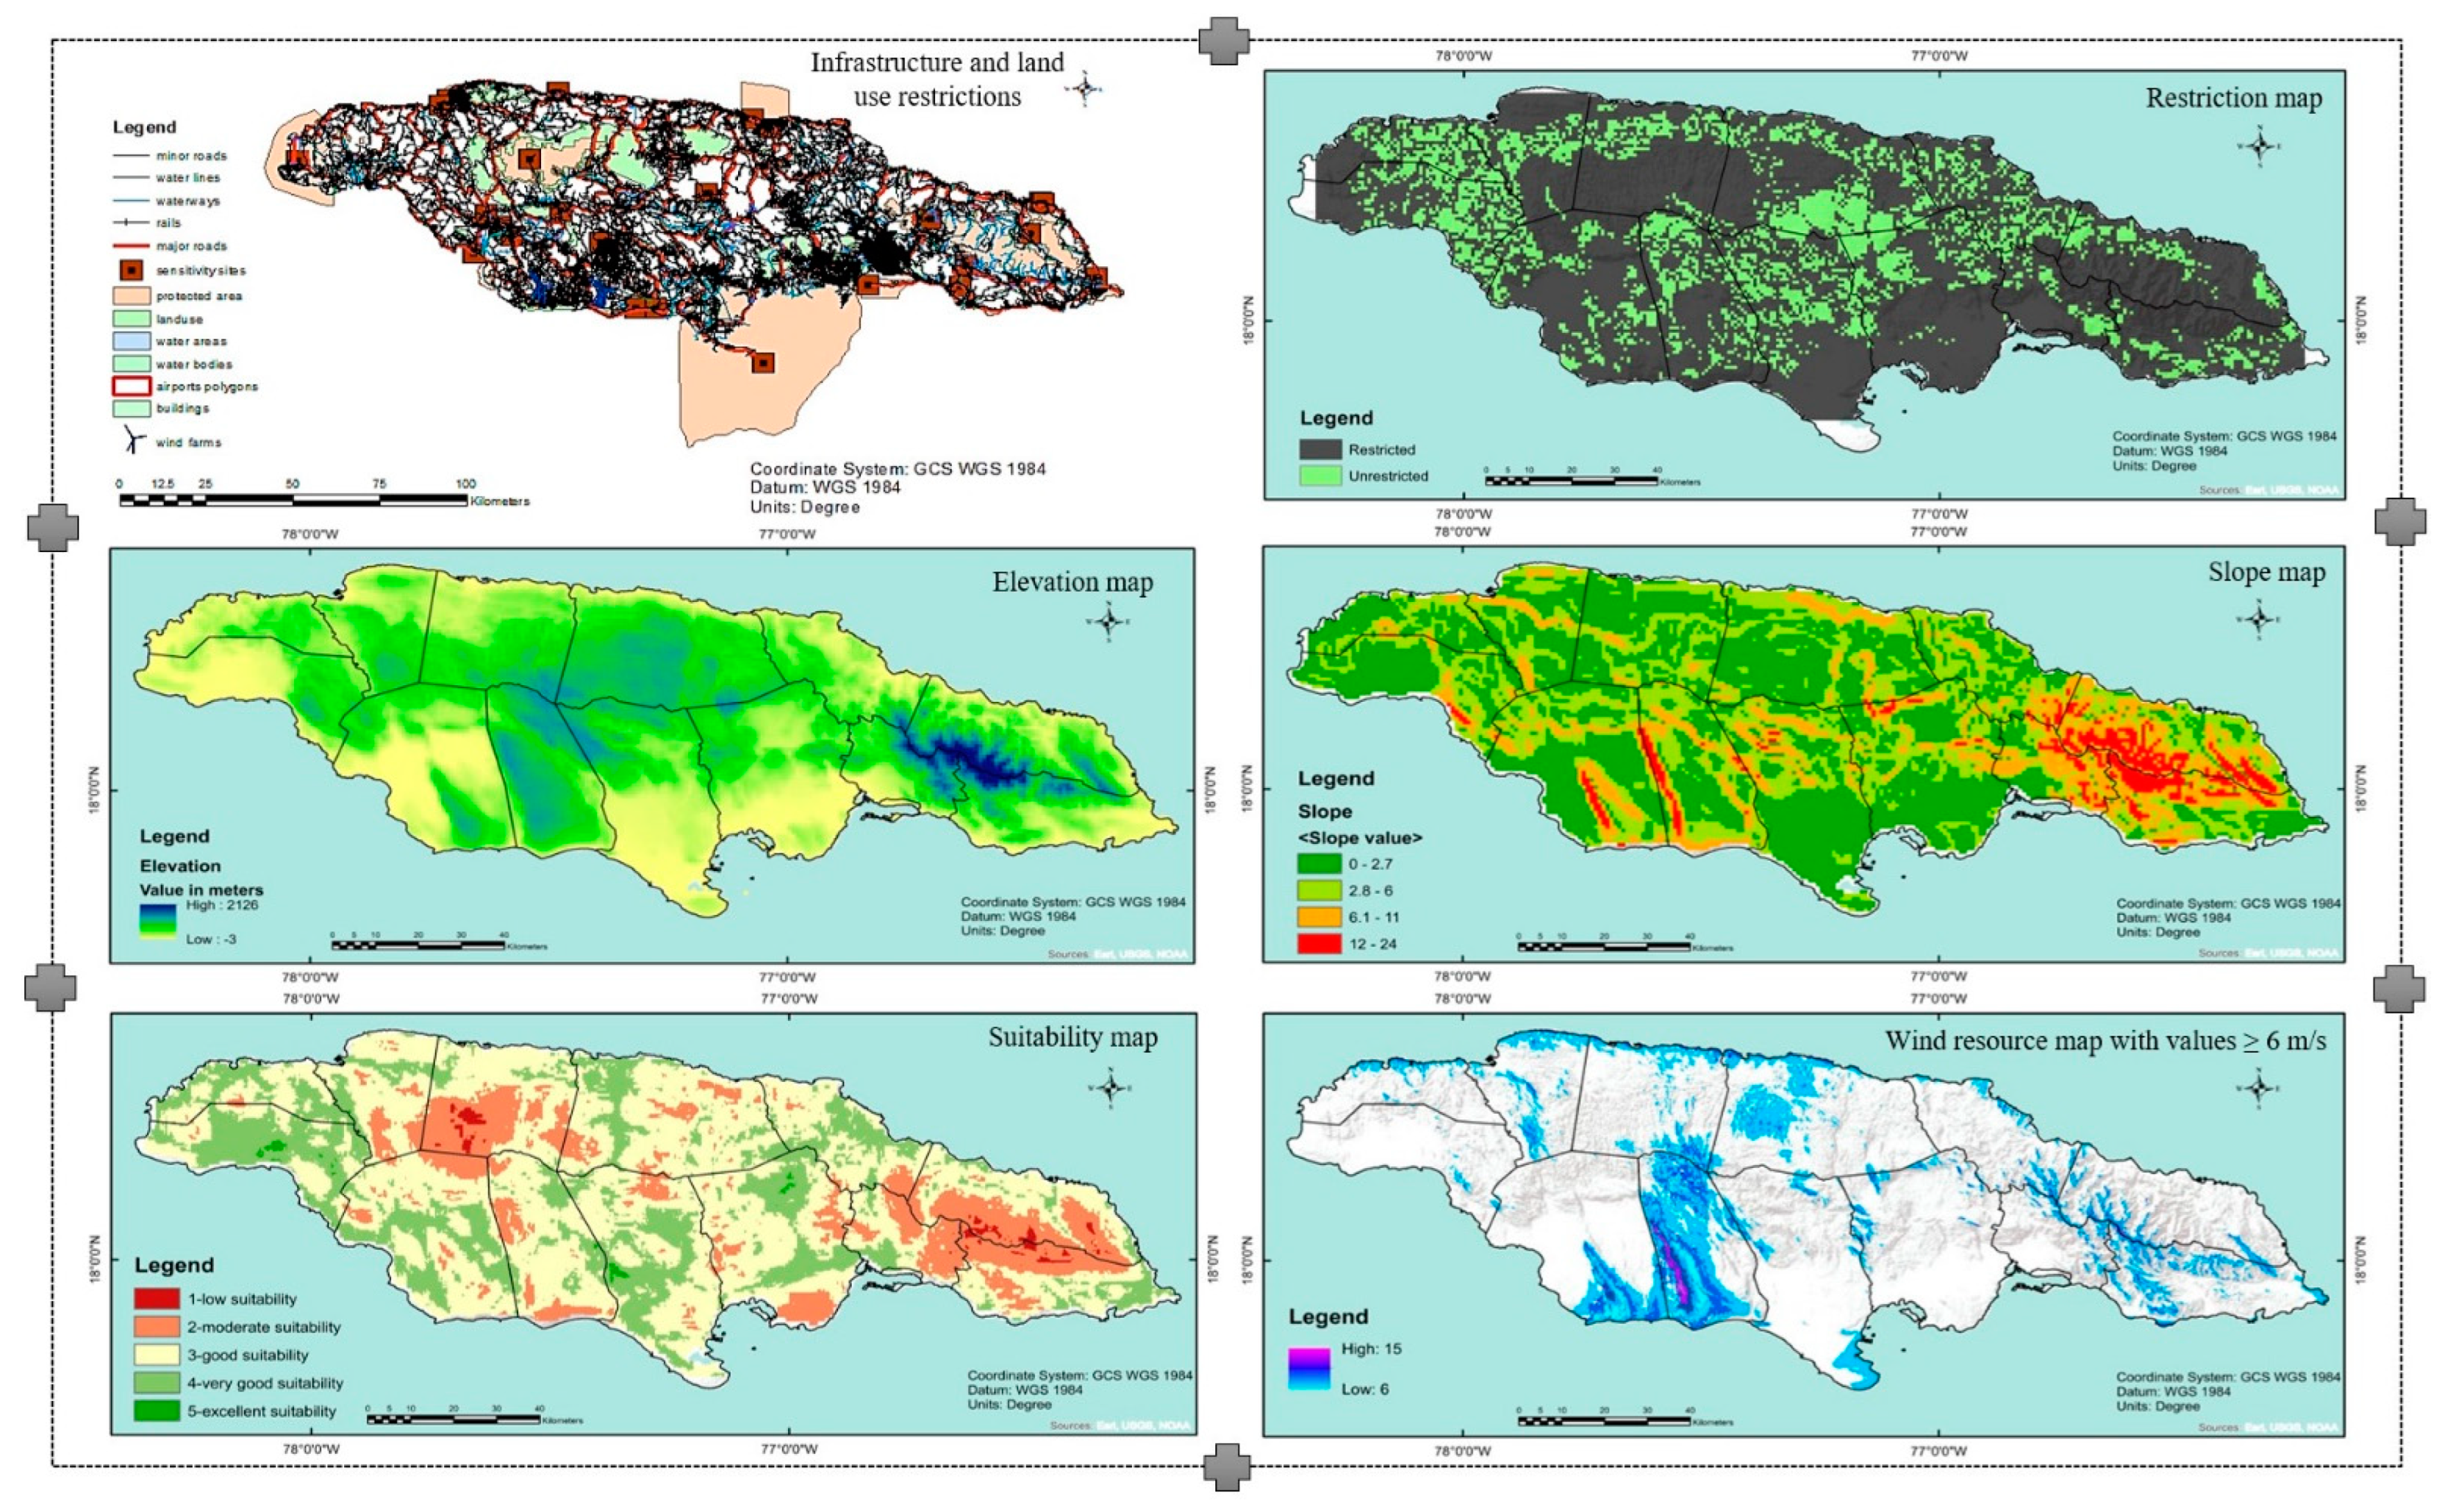
After grouping, the restrictions outlined in Table 3 were applied to derive suitability for WPPs. Subsequently, three steps were followed. The first step was generating the restriction, suitability, slope, elevation, and wind resource maps. The second step involved incorporating wind speed data from Global Wind Atlas. The heights of 50 and 100 m were selected, with the former representative of most wind plant farms in Jamaica and the latter of the most recently developed turbines used on wind farms worldwide [26]. The top of Figure 6 shows the parameters included in the rasterized version of the buffered zones in a restriction map for wind farm site suitability. Thirdly, restriction, slope, elevation, and wind resource maps were overlayed and merged to produce the final suitability map.
Overlaying these maps highlighted available locations for positioning potential wind farms, further estimating annual electrical energy output. The fourth step was determining the available land area for possible wind farm development. In this stage, the restricted area was subtracted from the administrative boundary map using the raster calculator functions. Finally, the number of available cells was summed up by statistical procedure in the statistical tools section of ArcGIS, resulting in the total available area for developing potential wind farms. In the case study, the land area for wind and power expansion was used to estimate the number of wind turbines and potential energy output in GWh per km2.

2.5.1. Slope

Steep slopes in land gradient can hinder renewable energy farms—solar, and wind power included—as they hamper installation and continual site maintenance access. Therefore, sloped areas are a vital determinant of site selection as it impacts the amount of money spent on transport to and from a site. Moreover, the placement of wind turbines is crucial to the final potential energy output and should not be placed between hills, mountains, or locations with large slope gradients to present optimal energy acquirement. The slope layer was derived from Jamaica’s DEM file obtained from NASA’s SRTM by utilization of the slope function in ArcGIS. All gradients above 10% were excluded from the classification, and those lower than 10% were absorbed in the overlay suitability model. Works by Baseer et al., 2017 [27], Zahedi et al., 2022 [33], Watson and Hudson, 2015 [28], and Baban and Parry, 2001 [40] point to similar characterization in wind energy assessments.

2.5.2. Elevation

This study considered elevation a critical decision-making criterion because some areas in Jamaica are prone to flooding [41]. To reduce social, environmental, and economic losses, those areas equal to and more significant than thirty meters were included in the suitability. Construction and maintenance of wind farms are costly, so flooding sometimes leads to landslides and other natural hazards such as large debris flow from fallen wind turbines into residential zones. Furthermore, wind at higher altitudes is more robust and stable, resulting in more significant opportunities to harvest higher energy yields.

2.5.3. Wind Power Calculation

Studies indicate diverse ways of calculating potential wind power. However, one commonality exists, the computed value highly depends on specific wind turbines at certain locations considering air density plus wind velocity. According to Costoya et al., 2019 [7], the following equation is applicable in deriving wind power density (WPD), which determines the amount of potential energy to be converted by wind turbines on wind farms. The expression represents wind power density
WPD   =   ½ ρ a w H 3
This is equivalent to ½ times the air density of the site times wind speeds at the location cubed, where ρ a equals air density at site 50 m AGL. The amount of energy available for wind turbine conversion at a specific location is found with this value, rendering it an appropriate valuation method when comparing site locales for situating wind farms. Further calculations involve wind turbine requirements and design, such as hub height, rotor diameter, and annual power yield produced by the turbine [7,33].
Nonetheless, these values are available in raster files in GWA, which uses operations performed by the wind atlas analysis and application program (WAsP software). The data software uses unprocessed wind information combined with the roughness index, roughness terrain length, elevation, and power density of the study area, then calculates wind speed at desired heights above ground based on selected study goals for the research location. Finally, the map generated is converted into a digital map in ArcGIS 10.8.1 environment, as indicated in Figure 5.

2.5.4. Number of Wind Turbines and Spacing

Turbine spacing on utility-scale wind farms with more than 500 turbines requires specific measurements to reduce or eliminate the wake effect. Within unprohibited areas, it is determined by the median minimum, 3.45 times the rotor diameter in meters, or the average maximum, 5.3 times the rotor diameter of selected turbines [29,42]. Therefore, one turbine’s space, along with the spacing between others, is found through equations (2) and (3), adopted from the work of Enevoldsen and Permien, 2018 [29]. Finally, the result is divided into the land area for wind power expansion.
A = π r 2 = π ( rotor   diameter 2.65 ) 2 = / 1,000,000
A = π r 2 = π ( rotor   diameter 5.3 ) 2 = / 1,000,000
For example,
A = π r 2 = π ( 112   m 2.65 ) 2 A = 88090.242   m 1000000 = 0.088   km 2
Consequently, turbine spacing T S and the total number of turbines T T are determined below.
T S = 112   m 5.3 2 1000000 = 593.6   m 2 1000000 = 0.35236   km 2
T T = 0.35236   km 2 + 0.088   km 2 = 2682.6924   km 2 0.440   km 2 = 6090
The estimation of the number of turbines is determined by computing the total number of turbines that can fit in available land space; that is, rotor diameter divided by space horizontal distance in kilometers plus the area occupied by one turbine into the total land area open for wind energy generation. For example, space in horizontal distance between turbines equals rotor diameter times median maximum for turbine spacing squared divided by one million. Consequently, the area in horizontal distance between turbines is equal to 120 m (rotor diameter) times 5.3 (median maximum), equivalent to 593.6 m. Subsequently, the result is squared and divided by a million to derive the horizontal distance for turbine spacing equal to 0.35236 km2, as outlined above. This is appropriate since Malvern Wind Farm in Malvern, Saint Elizabeth, Jamaica, uses a similar measurement of 0.34803 per turbine spacing in rows [43].
Thereafter, the total number of turbines for wind energy expansion equals turbine space occupied by one turbine plus recommended spacing between turbines divided into the total unconstrained land area. Based on the above computation, the total number of turbines for this study equals 6090, which is useful for electric energy output computation.
Final calculations to determine potential wind power generation involves multiplying power production in kWh per year times 0.80, which represents energy reduction from wake effect and turbine availability times the total number of turbines in an open area.

3. Results and Discussion

This segment focuses on the results of the environmental-sociotechnical wind atlas by representing and analyzing distinctive features of (1) restricted and unrestricted zones, (2) wind resource mapping, (3) the resultant environmental-sociotechnical atlases, (4) suitable site locations, and (5) potential energy to be generated from proposed locations.

3.1. Restricted and Unrestricted Zones

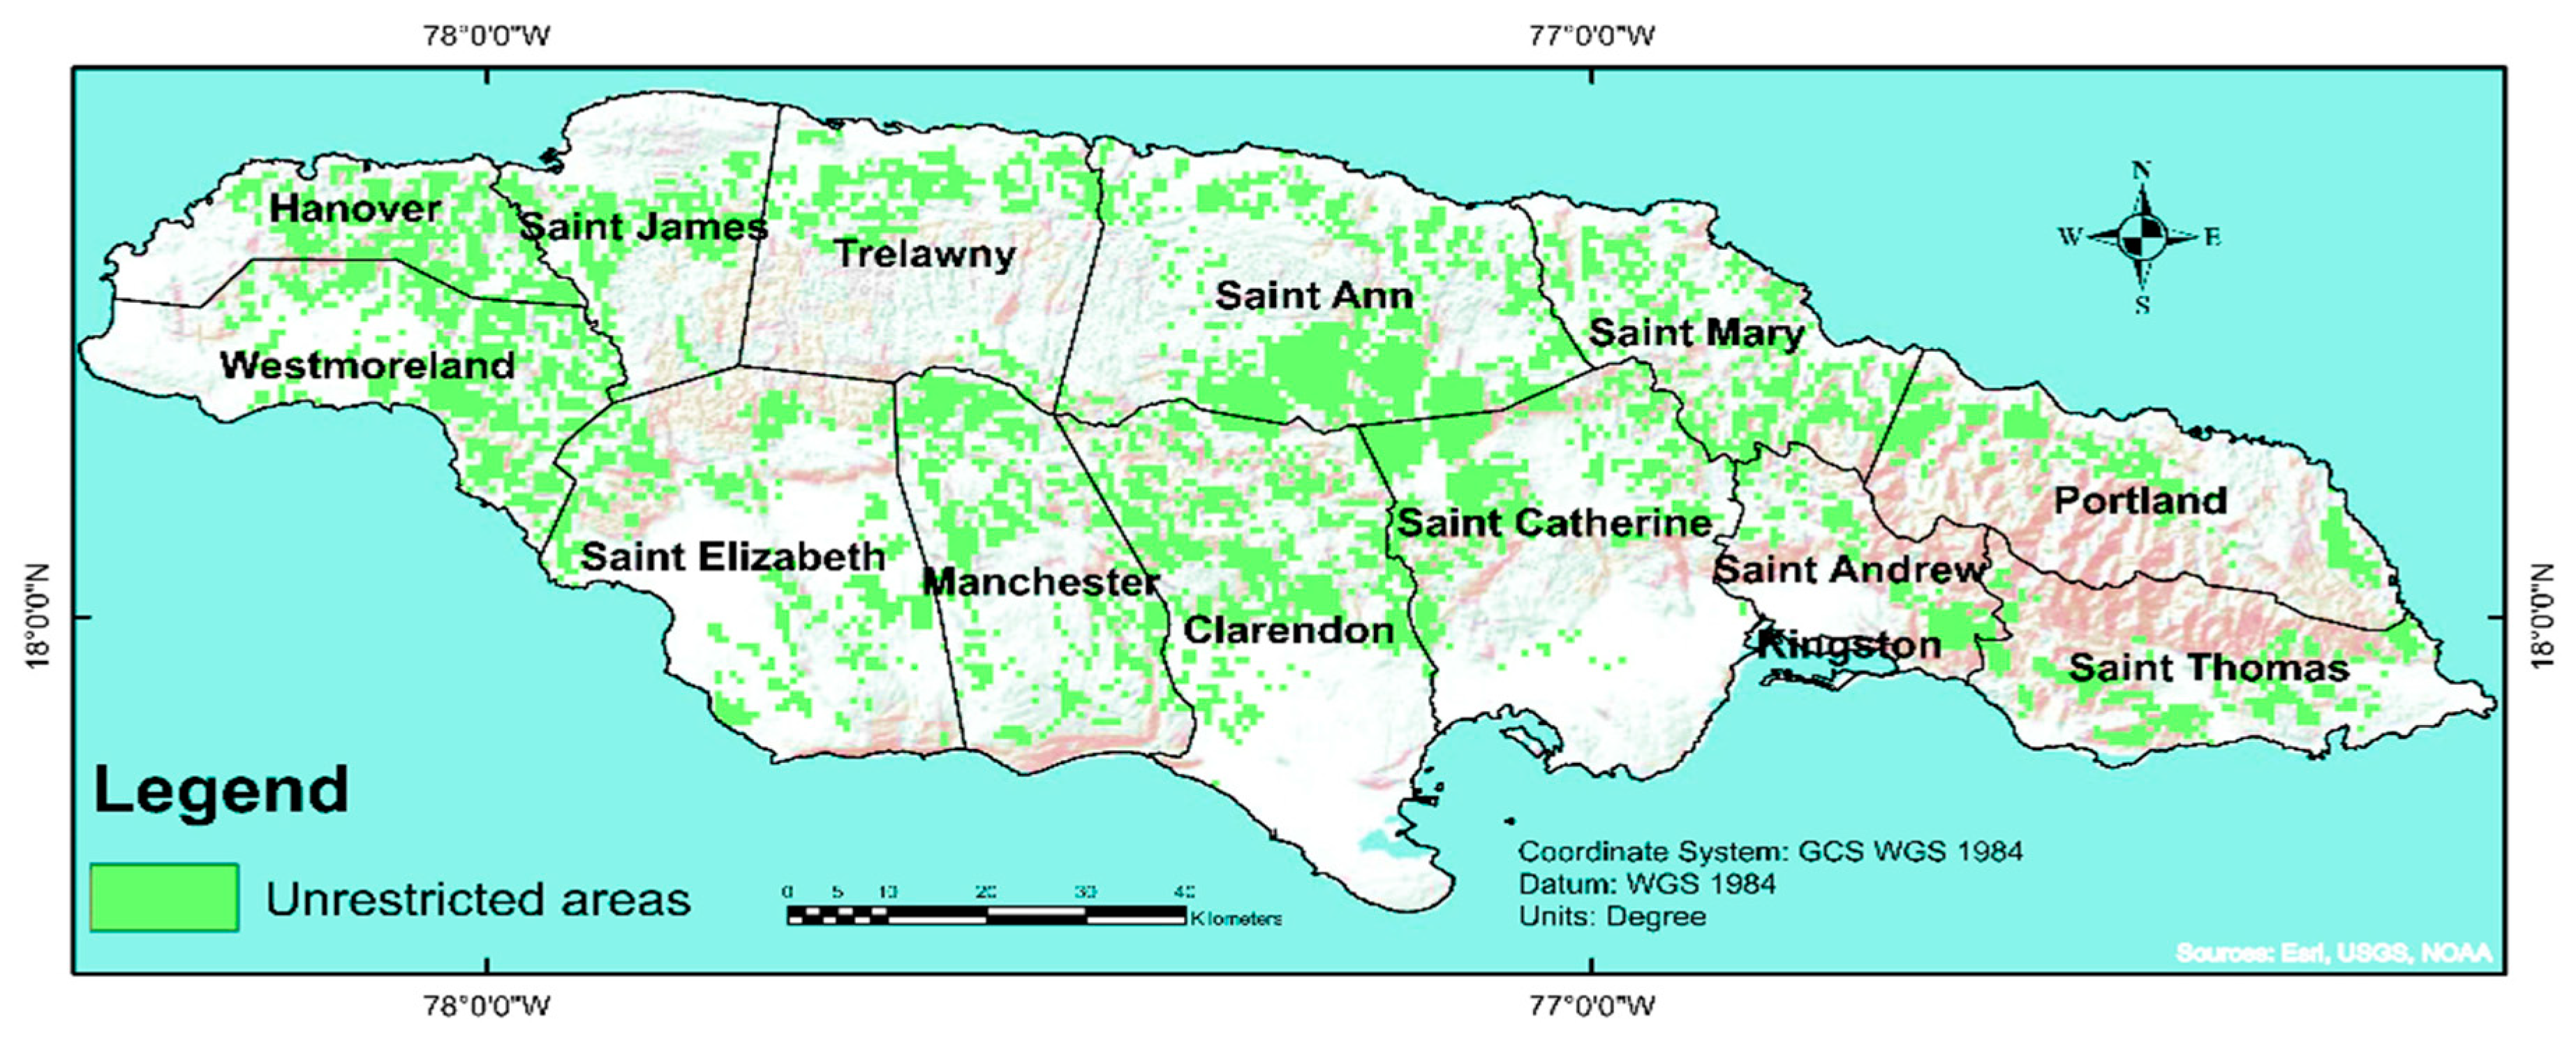
The available location map in Figure 7 was derived by calculating and combining buffered zones of different variables listed in Table 3 and Figure 6. Variables consist of major and minor roads, railways, sensitive and protected sites, land use, waterways, water bodies, airports, and existing wind farms. First, the raster calculator function in ArcGIS subtracted the result from Jamaica’s administrative boundary. After that, the raster layer statistics tool in spatial analyst tools was utilized to summarize available cells, characterizing the amount of land area available and prohibited wind farm installation. The result shows that the total land area available for wind power expansion after applied restriction, without accounting for wind speed at varying thresholds, is 2867.15 km2, 26% of Jamaica’s total land mass of 10,990 km2. To further generate probable locations for onshore wind farm development with annual wind speeds of 6, 8, and ≥10 m/s at 50 and 100 m AGL, see Figure 8 and Figure 9.
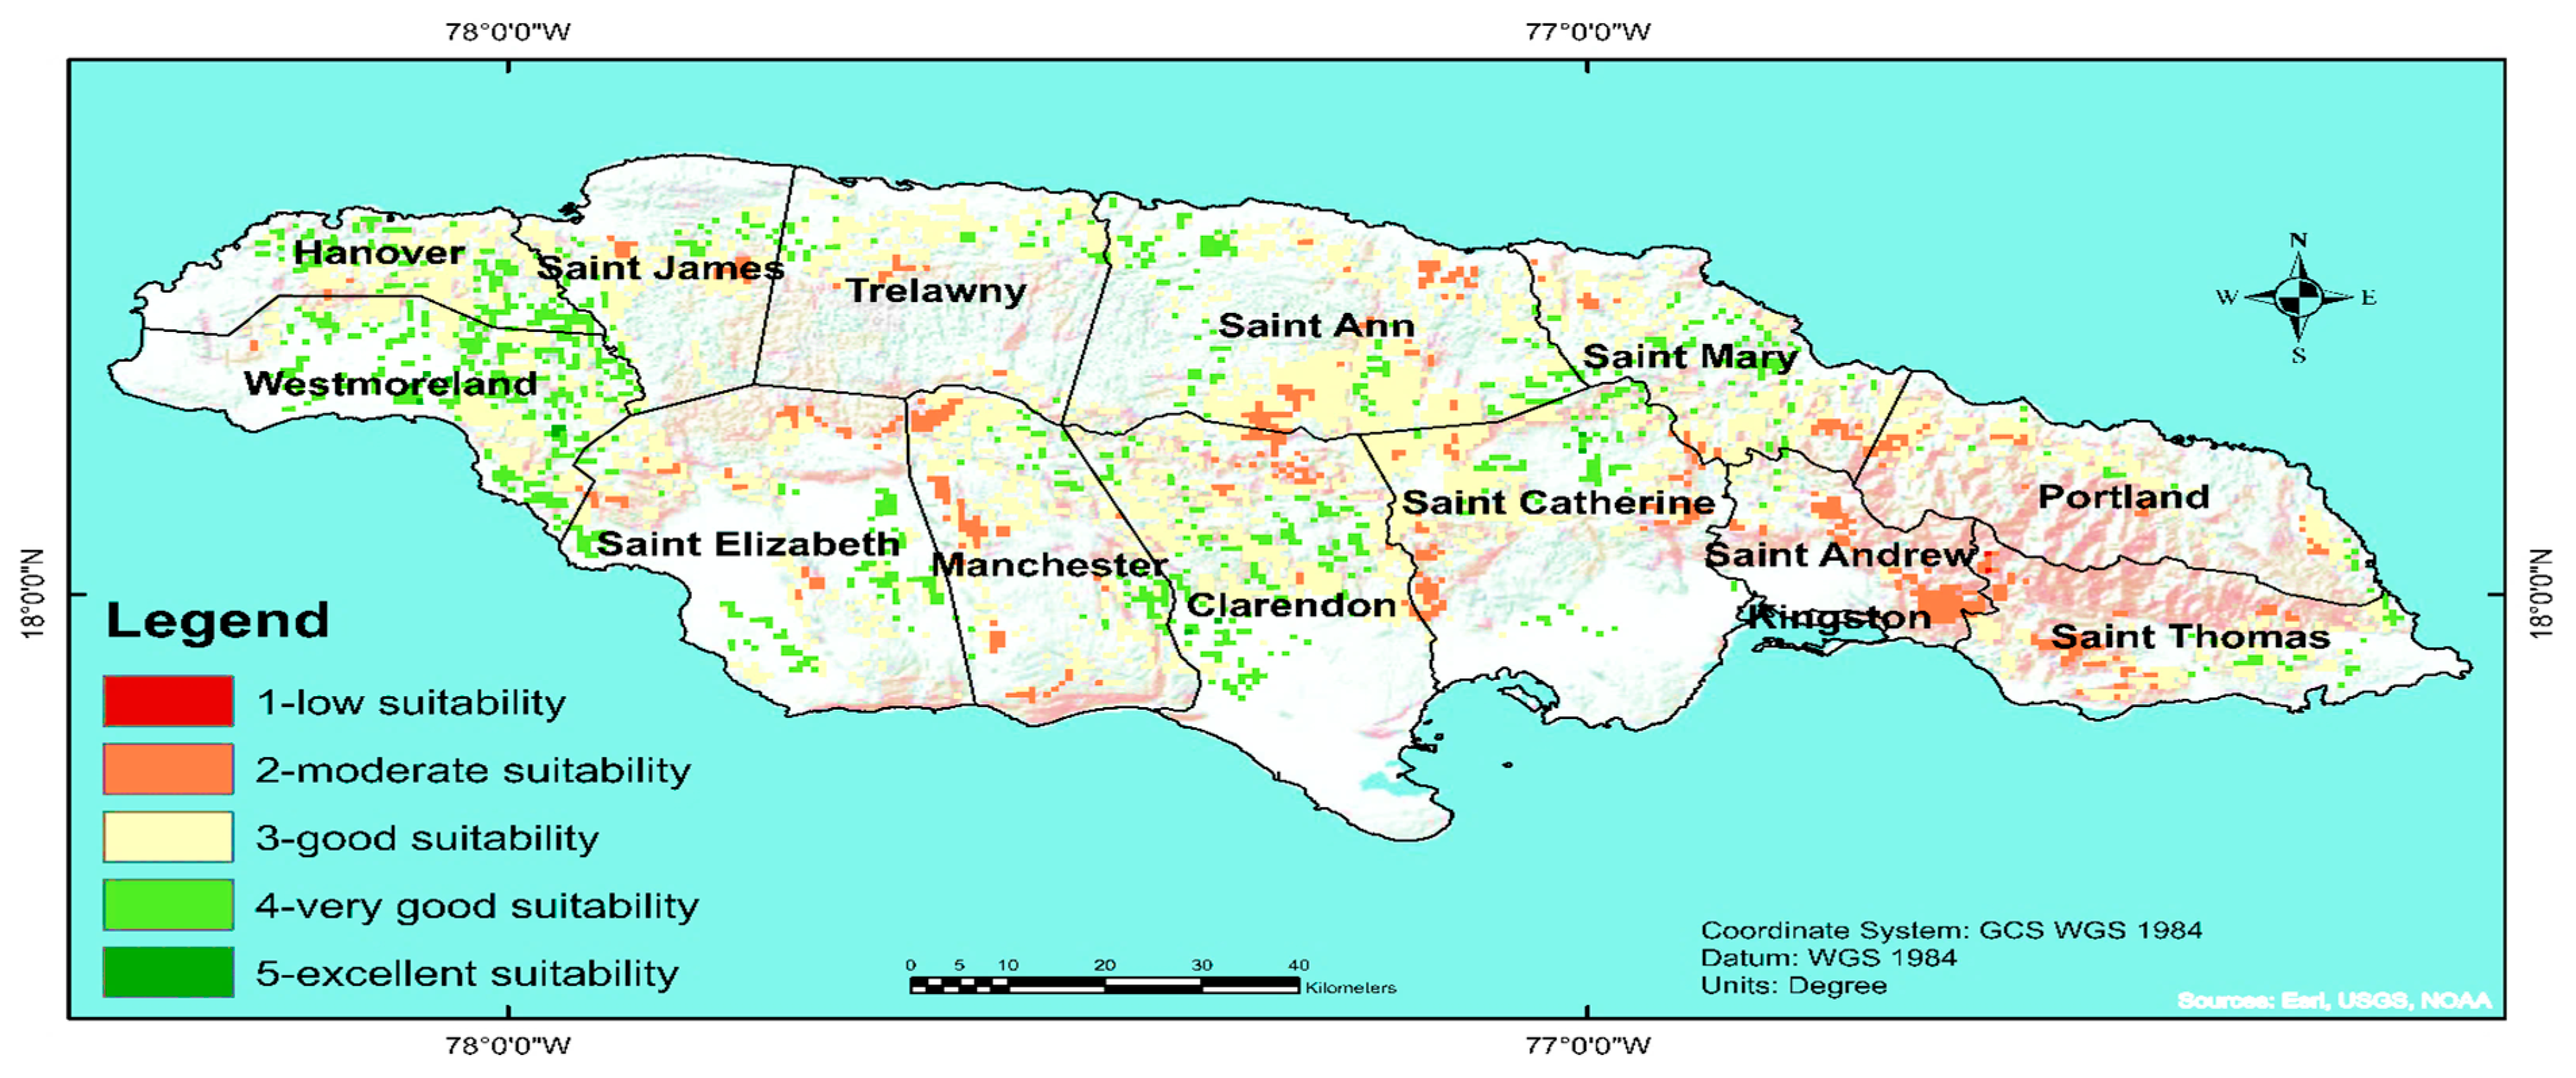
After overlaying the elevation, slope, and restriction layers with the suitability map layer, land availability was reduced to 2682.69 km2 or 24.41% of total available land, Figure 10. The restriction incorporates current land use, protected areas, sensitive sites, major and minor roads, railways, waterways, waterbodies, existing wind farms, and airports, see Figure 6. Table 3 outlines the restrictions for prohibitions.

3.2. Wind Resource Mapping

The atlas with combined wind thresholds of ≥6 m/s at 50 and 100 m AGL, Figure 11, indicates certain parishes have land accessible for wind farm investment. Inspection of the atlases reveals major spots are concentrated in the parishes of St. Elizabeth and Manchester that have annual mean wind speeds of 8.26 m/s and 10.08 m/s, correspondingly above Jamaica’s mean wind speed of 7.51 m/s. Equally, an examination of real-time data for the month of January 2022 using GWA illustrates the mean power densities of these parishes are far greater than the national average of 436 W/m2. Manchester’s mean power density almost doubled the national average at 956 W/m2, and St. Elizabeth amounted to 557 W/m2 at 100 m AGL. Consequently, all of Jamaica’s six wind farms are in these parishes; Figure 4 shows wind farm locations.
Nonetheless, areas on the north coast in the parishes of Hanover, St. James, Trelawny, St. Ann, and St. Mary are accessible for further exploration. Moreover, several locations have a potential abundance of wind power. For example, areas in Clarendon, St. Catherine, St. Thomas, and Portland are viable for wind energy generation. Mainly mountainous locations in St. Andrew, Portland, and St. Thomas are suitable within unrestricted zones. However, these locations are not streamlined and pointed in the list of eligible sites because we assumed such places have underdeveloped infrastructure and obstructions aligned with increased transportation and installation costs.
The wind atlases produced along with suitable locations are derived without onsite visits. Nonetheless, validation is made through data from the Jamaica Meteorological Service Division. This paper does not outline the results from these stations since gaps exist. Moreover, time references are inconsistent with this study’s time series analysis. An action deemed necessary to avoid irregularities from modeled error computation. Another deficiency solely depends on metServiceJA stations’ locations, namely in coastal regions, Figure 4. Thus, the adopted approach enables the comparative analysis of the atlases, which can be understood by a large community, credited to the high-resolution visual aids. Furthermore, the mesoscale method uses reverse processes that facilitate specific wind speeds at given locations to be verified with great certainty [44].
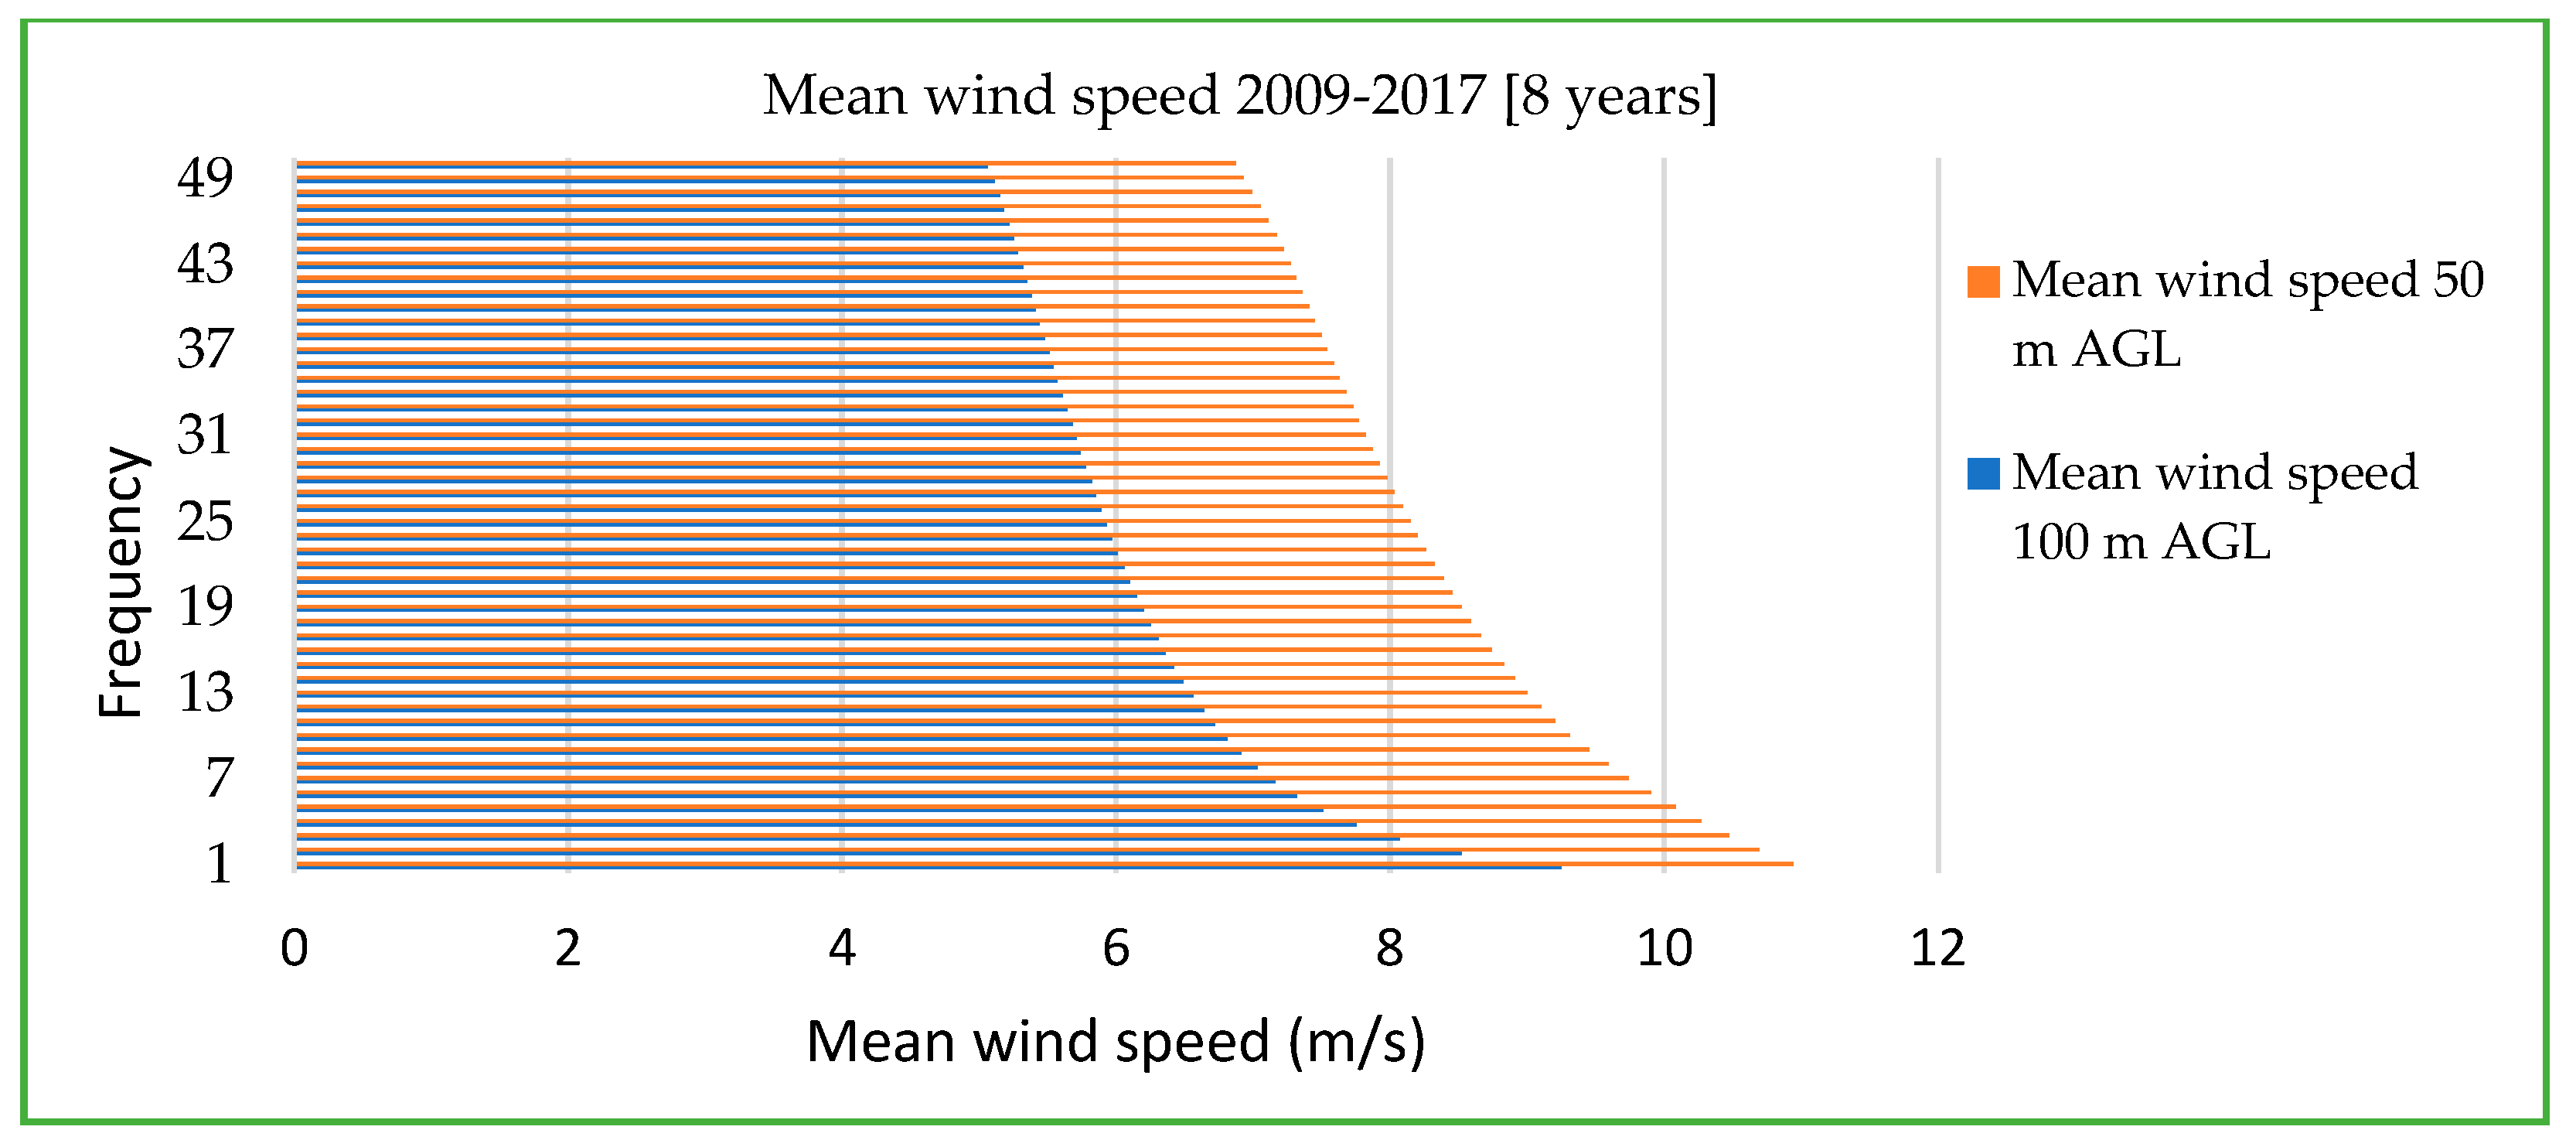
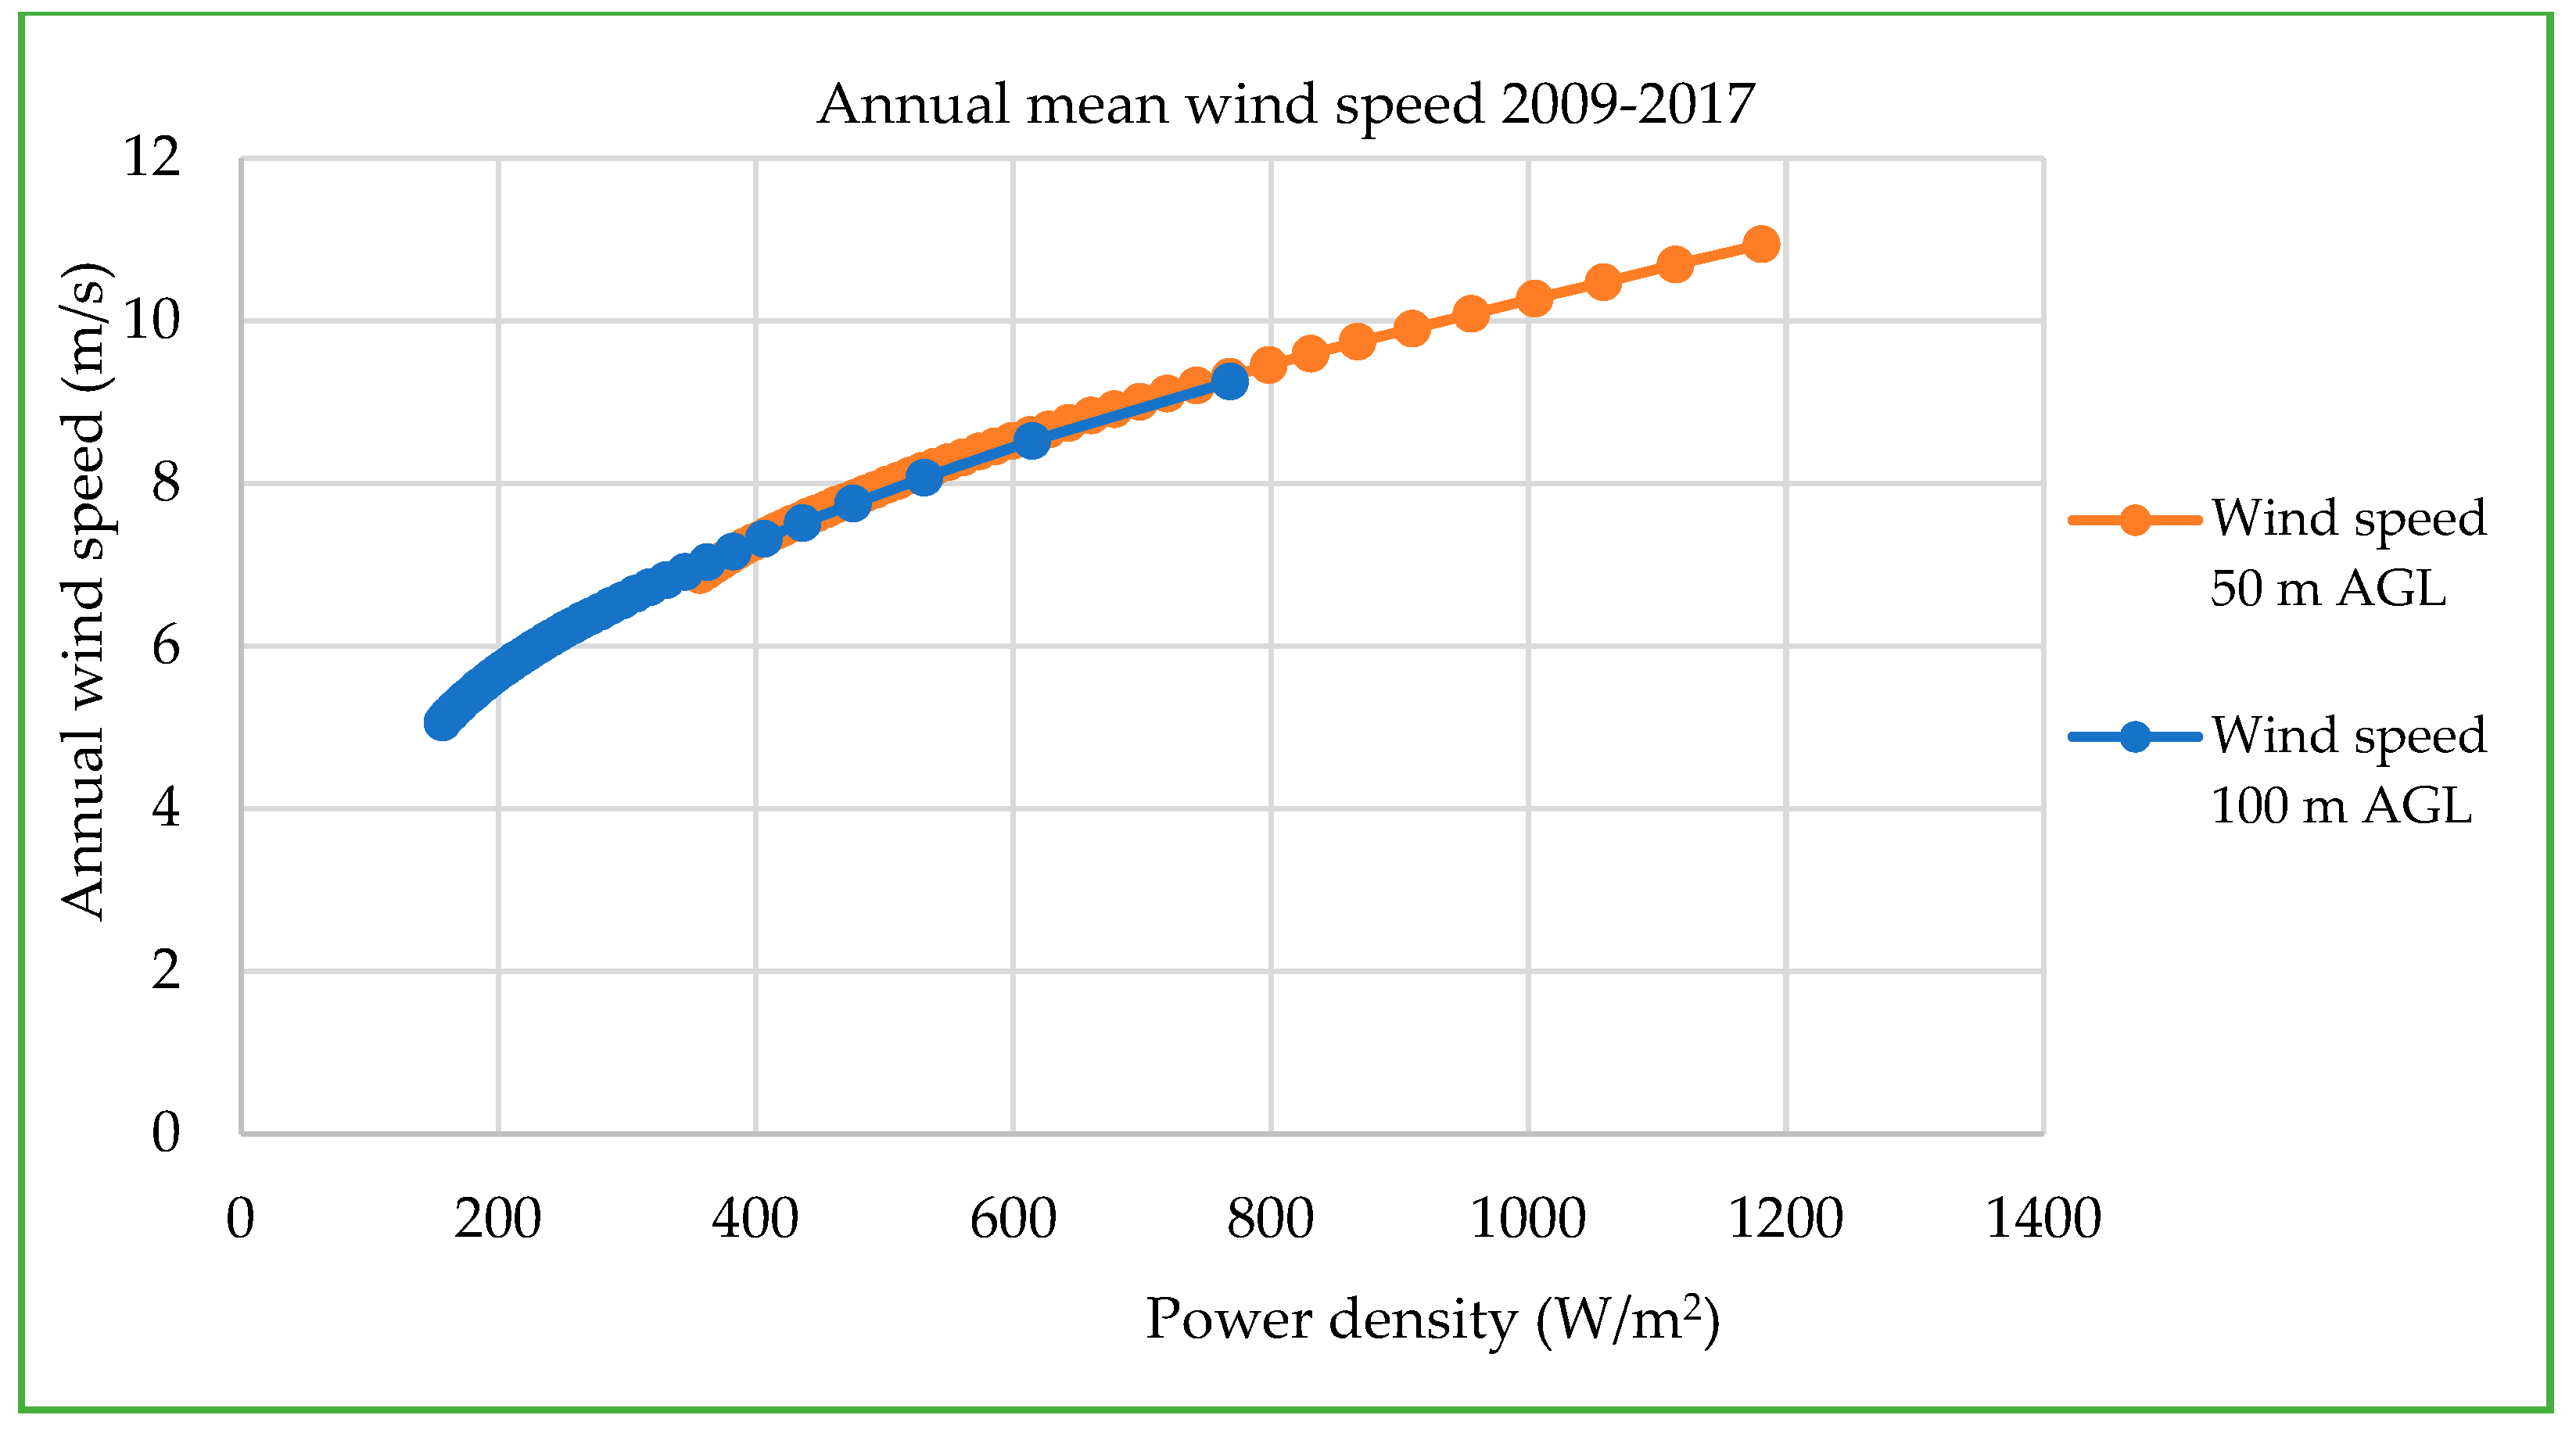
A combination of the restriction, suitability, and wind threshold maps—Figure 7, Figure 10 and Figure 11—with the suitability map excluding prohibited areas resulted in Figure 12. Initially, wind resource extrapolation and computation were considered at 50 and 100 m AGL, as shown in Figure 11. However, Figure 8 indicates wind speed at ≥6 m/s covers more of the island at 100 m. Therefore, wind speed and power densities were examined at both altitudes. A comparison of mean wind speeds and power densities illustrated that 50 m AGL power density was more expansive than 100 m AGL. Figure 13 and Figure 14 align with Jamaica’s wind farms having turbines at 50 m hub height. For example, Munro College Wind Farm in St. Elizabeth, Munro Wind Farm in St. Elizabeth, and Wigton I Wind Farm Greater in Manchester. Extensive power density at 50 m hub height can result from terrain roughness and changes in specific topography. Furthermore, thermally driven flow can compromise wind threshold, directly impacting wind speed and, by extension, power density notwithstanding, 100 m is ideal for modern-day wind farms, according to von Krauland et al., 2021 [26] in conjunction with other experts. The electric grid system is also included indicating the suitable zones are within satisfactory access to the island’s electric grid network.
A thorough examination of the results reveals that the southern parts of St. Elizabeth and Manchester, along with the north of Mandeville plus the mountainous regions of Portland, boasted the highest aggregate wind speeds over the eight years investigated. On the other hand, western and northern parishes yielded moderate to low wind thresholds even in coastal regions. Notably, since the wind atlases produced utilized mast stations for verification purposes and did not include onsite measurements, a degree of uncertainty exists as data gathered from metServiceJA was incomplete, amplifying the possibility of erroneous modeling and calculation errors in the potential output.

3.3. Socioenvironmental Technical Atlases

Examination of local wind atlases revealed that consideration for current wind farms, location of sensitive and protected sites, and the coordinates for proposed sites were not included in formulating a framework for referencing future wind power expansion. Consequently, studies of RoAid, 2019 [17], referenced Point Morant and Stoney Point as two of the four probable locations for future commercial wind farms. However, erecting wind farms in these places would encroach on valuable ecosystems which comprise endemic species. In addition, both locations are known protected areas, with Morant Point being home to a bird sanctuary in Amity Hall, Jamaica. Moreover, Stoney Point is within range of Portland Bight Wetlands and Cays, Jamaica’s only Ramsar site situated in St. Catherine and Clarendon, 24,542 hectares, 17°49″ N 077°04″ W. These are designated protected areas by the government of Jamaica, deeming them uncertain for utility-scale developments, regardless of high wind thresholds. Primarily, Jamaica’s wind power investigation focuses on wind gusts and other climatic data to construct wind atlases, expressed in the works of Chen, 1990 [15], Chen et al., 2020 [16], RoAid, 2019 [17], Ministry of Science, Energy, and Technology “Jamaica Energy Investor Guide,” 2017 [19], and Daniel, 1991 [45].
In contrast, this study combined physical measurements and mesoscale data with Jamaica’s geospatial data, including physical landscape, thereby constructing a firm foundation for substantiating wind power expansion. The multidimensional approach combined GIS-based research with comprehensive strategies to downscale and then conclude appropriate parameters [24,29,30,40] for a comprehensive case study. Furthermore, to minimize uncertainties, the simulated evolution adopted multi-model features in the form of factor variables covering economic viability by assessing the distance to major and minor roads, railways, and transportation lines. The restricted areas included sensitive and protected zones to limit negative impacts. Moreover, a progressive wind study itemized factors that minimize social opposition to wind-based protection by having land use, waterways, and airport locations. The siting of wind farms is known to directly impact the last parameter, airports, by affecting airplane radar tracking. Furthermore, inappropriately placed wind farms may be hazardous to low-flying aircraft affecting the safety of pilots and passengers.
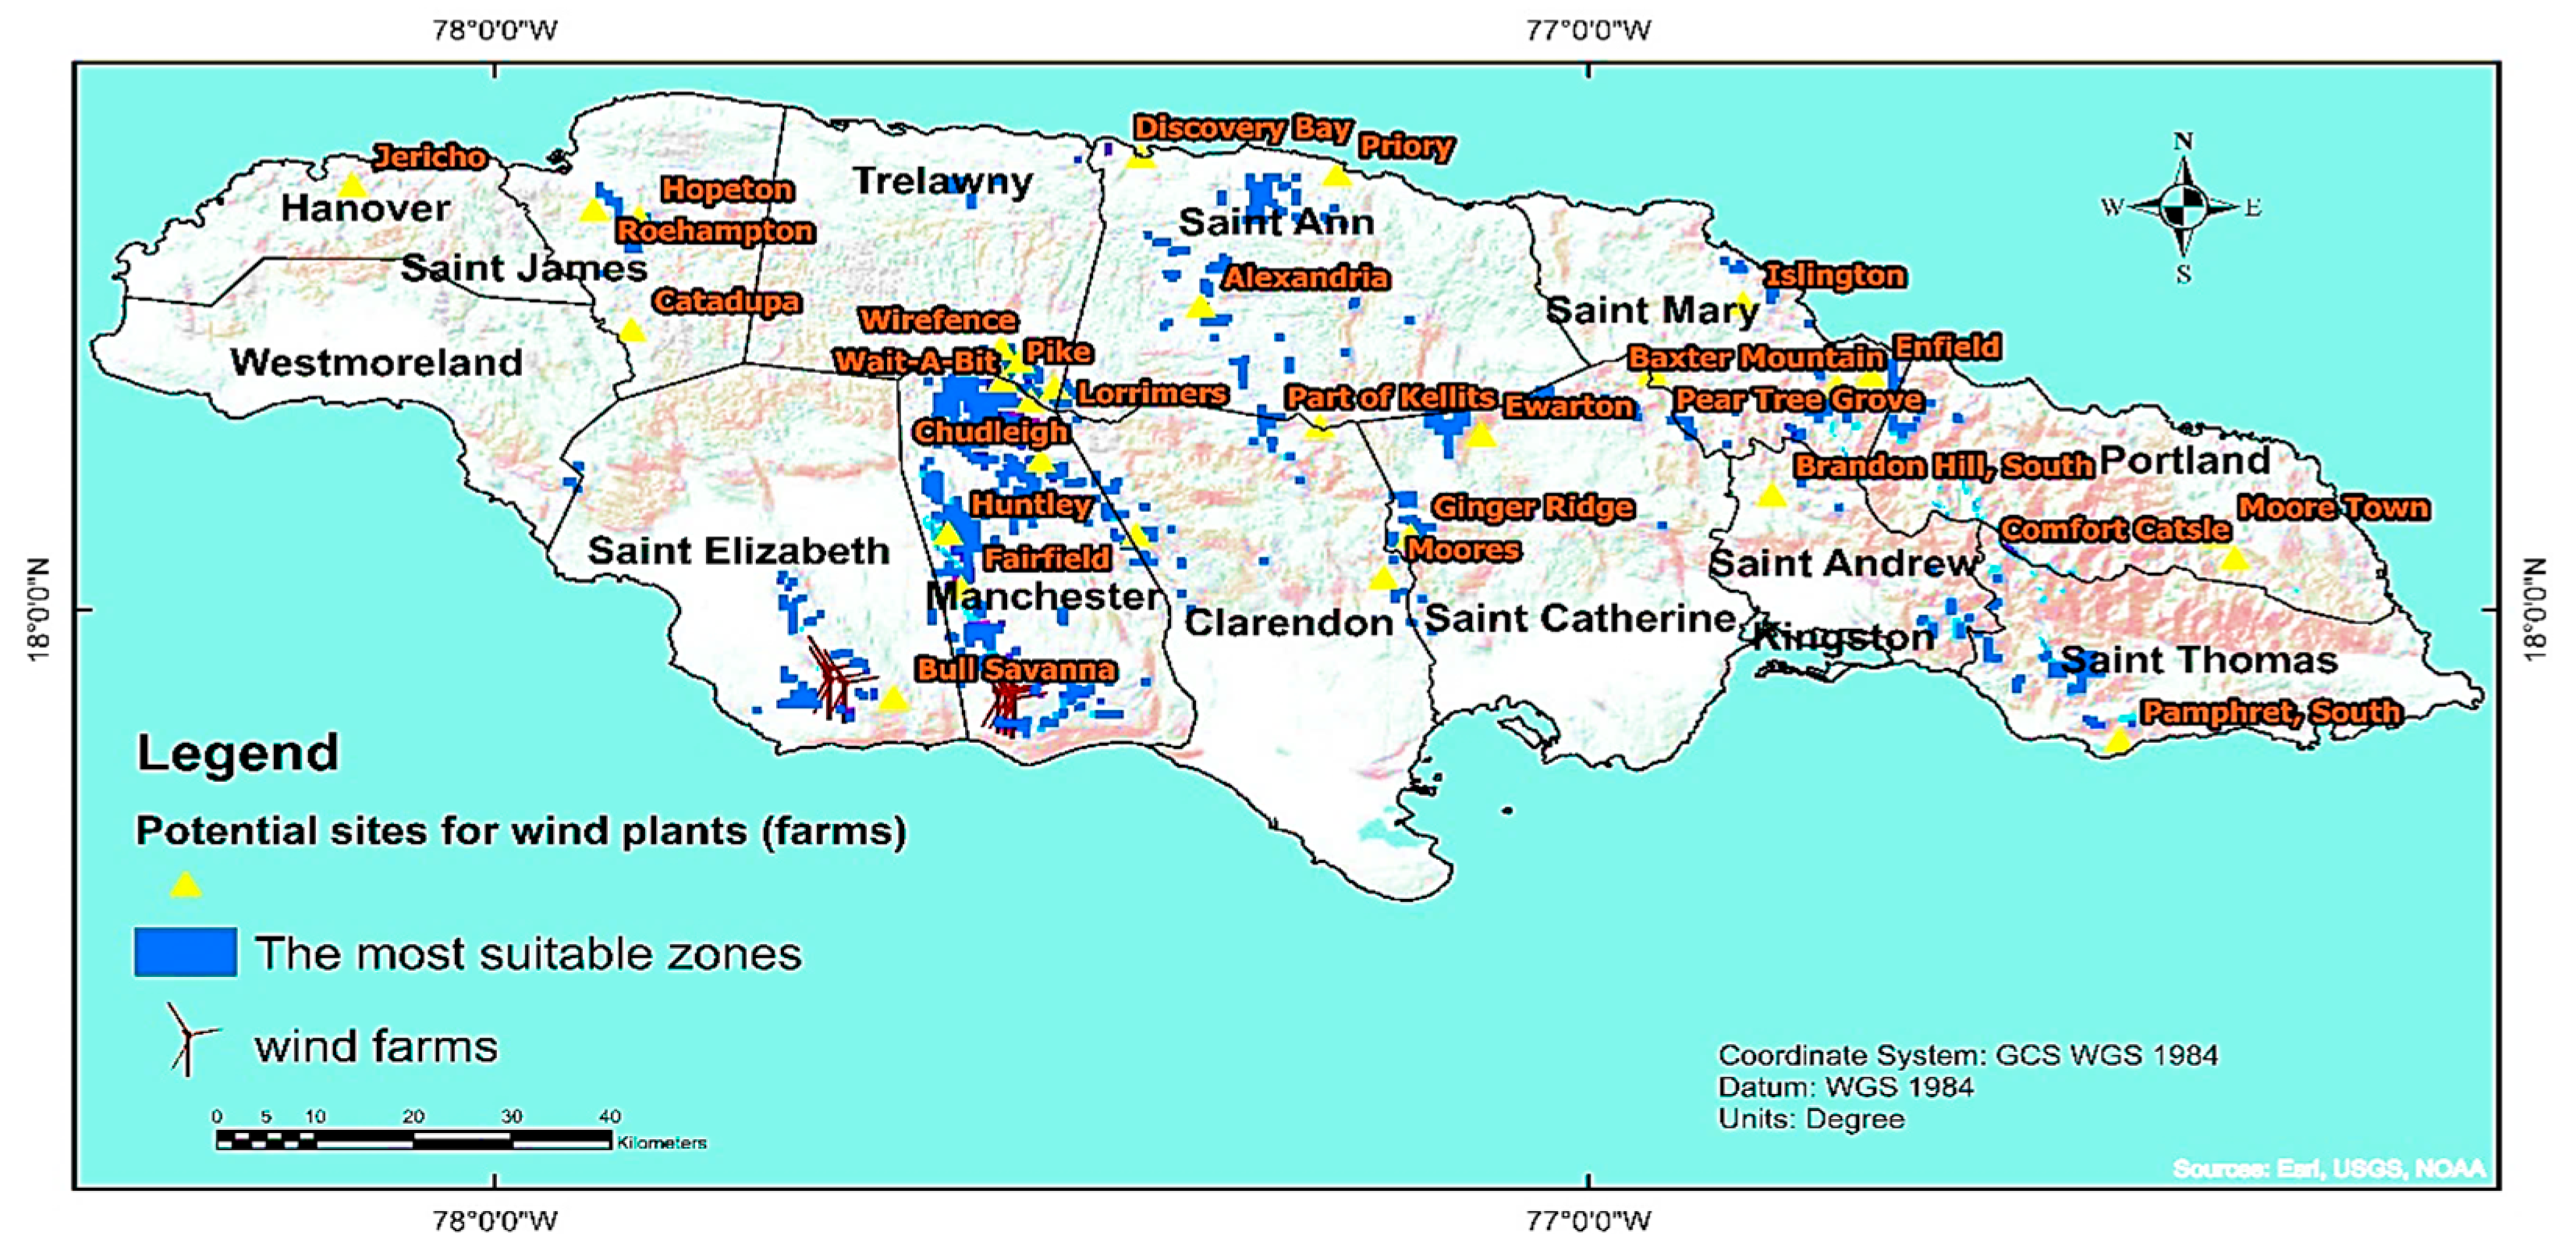
Subsequently, the multidimensional model assembled simultaneous methods beyond the technical factors, including wind speed, wake effect from operating wind farms, elevation, and slope. Figure 6 shows the different mapped layers combined to materialize the suitability map in Figure 12, while Table 3 itemizes restrictions and parameters accounting for future projection given local conditions at different climatic, geographic, and socioeconomic statuses. Figure 15 shows atlases with further simulation, extrapolating the zones within the most suitable areas to distinctly reference areas of main targets for onsite measurements. It also indicates mapped locations that could be significant in future onsite examinations. Next, Table 4 provides a list of sites with coordinates for further investigation.

3.4. Practical Application

Table 5 displays elements of two scenarios incorporating wind turbines for potential wind installation to the 2682.69 km2 of land available for wind power growth. Specifications of the turbines are outlined in Table 5 The projected land availability of 24.41% of total land allows the determination of the potential number of wind turbines for generating wind energy. Wind power density over the available land area, current wind turbines being utilized in Jamaica, market amiability, and turbine technical specifications were used to determine the potential wind power. Vestas V80 and Vestas V112 were selected as local wind farms are using them. Furthermore, rotor diameters of 80 and 112 m represent three of six currently utilized on the island.
Determination of wind turbine arrangement is an essential element on wind farms since wind turbines need adequate spacing to avoid the wake effect, which diminishes the amount of energy production because of wind speed changes impacting turbines. Similarly, the wake effect from existing wind farms was considered in the suitability analysis. Two scenarios from turbine spacing were explored in the work of Enevoldsen and Permien, 2018 [29], and Enevoldsen and Valentine, 2016 [42]. The first recommends spacing 3.45 times the rotor diameter, the median minimum for arranging more than 500 wind turbines. Contrarily, a median maximum of 5.3 times the rotor diameter is also proposed for onshore wind farms. The latter was selected to estimate the aggregate number of turbines since Vestas V112 turbines on Malvern Wind Farm in Cornwall, St. Elizabeth, built in 2016, corresponded. This aligned with calculative measurements of examples in their work and was pragmatic to Jamaica’s geographical landscape.
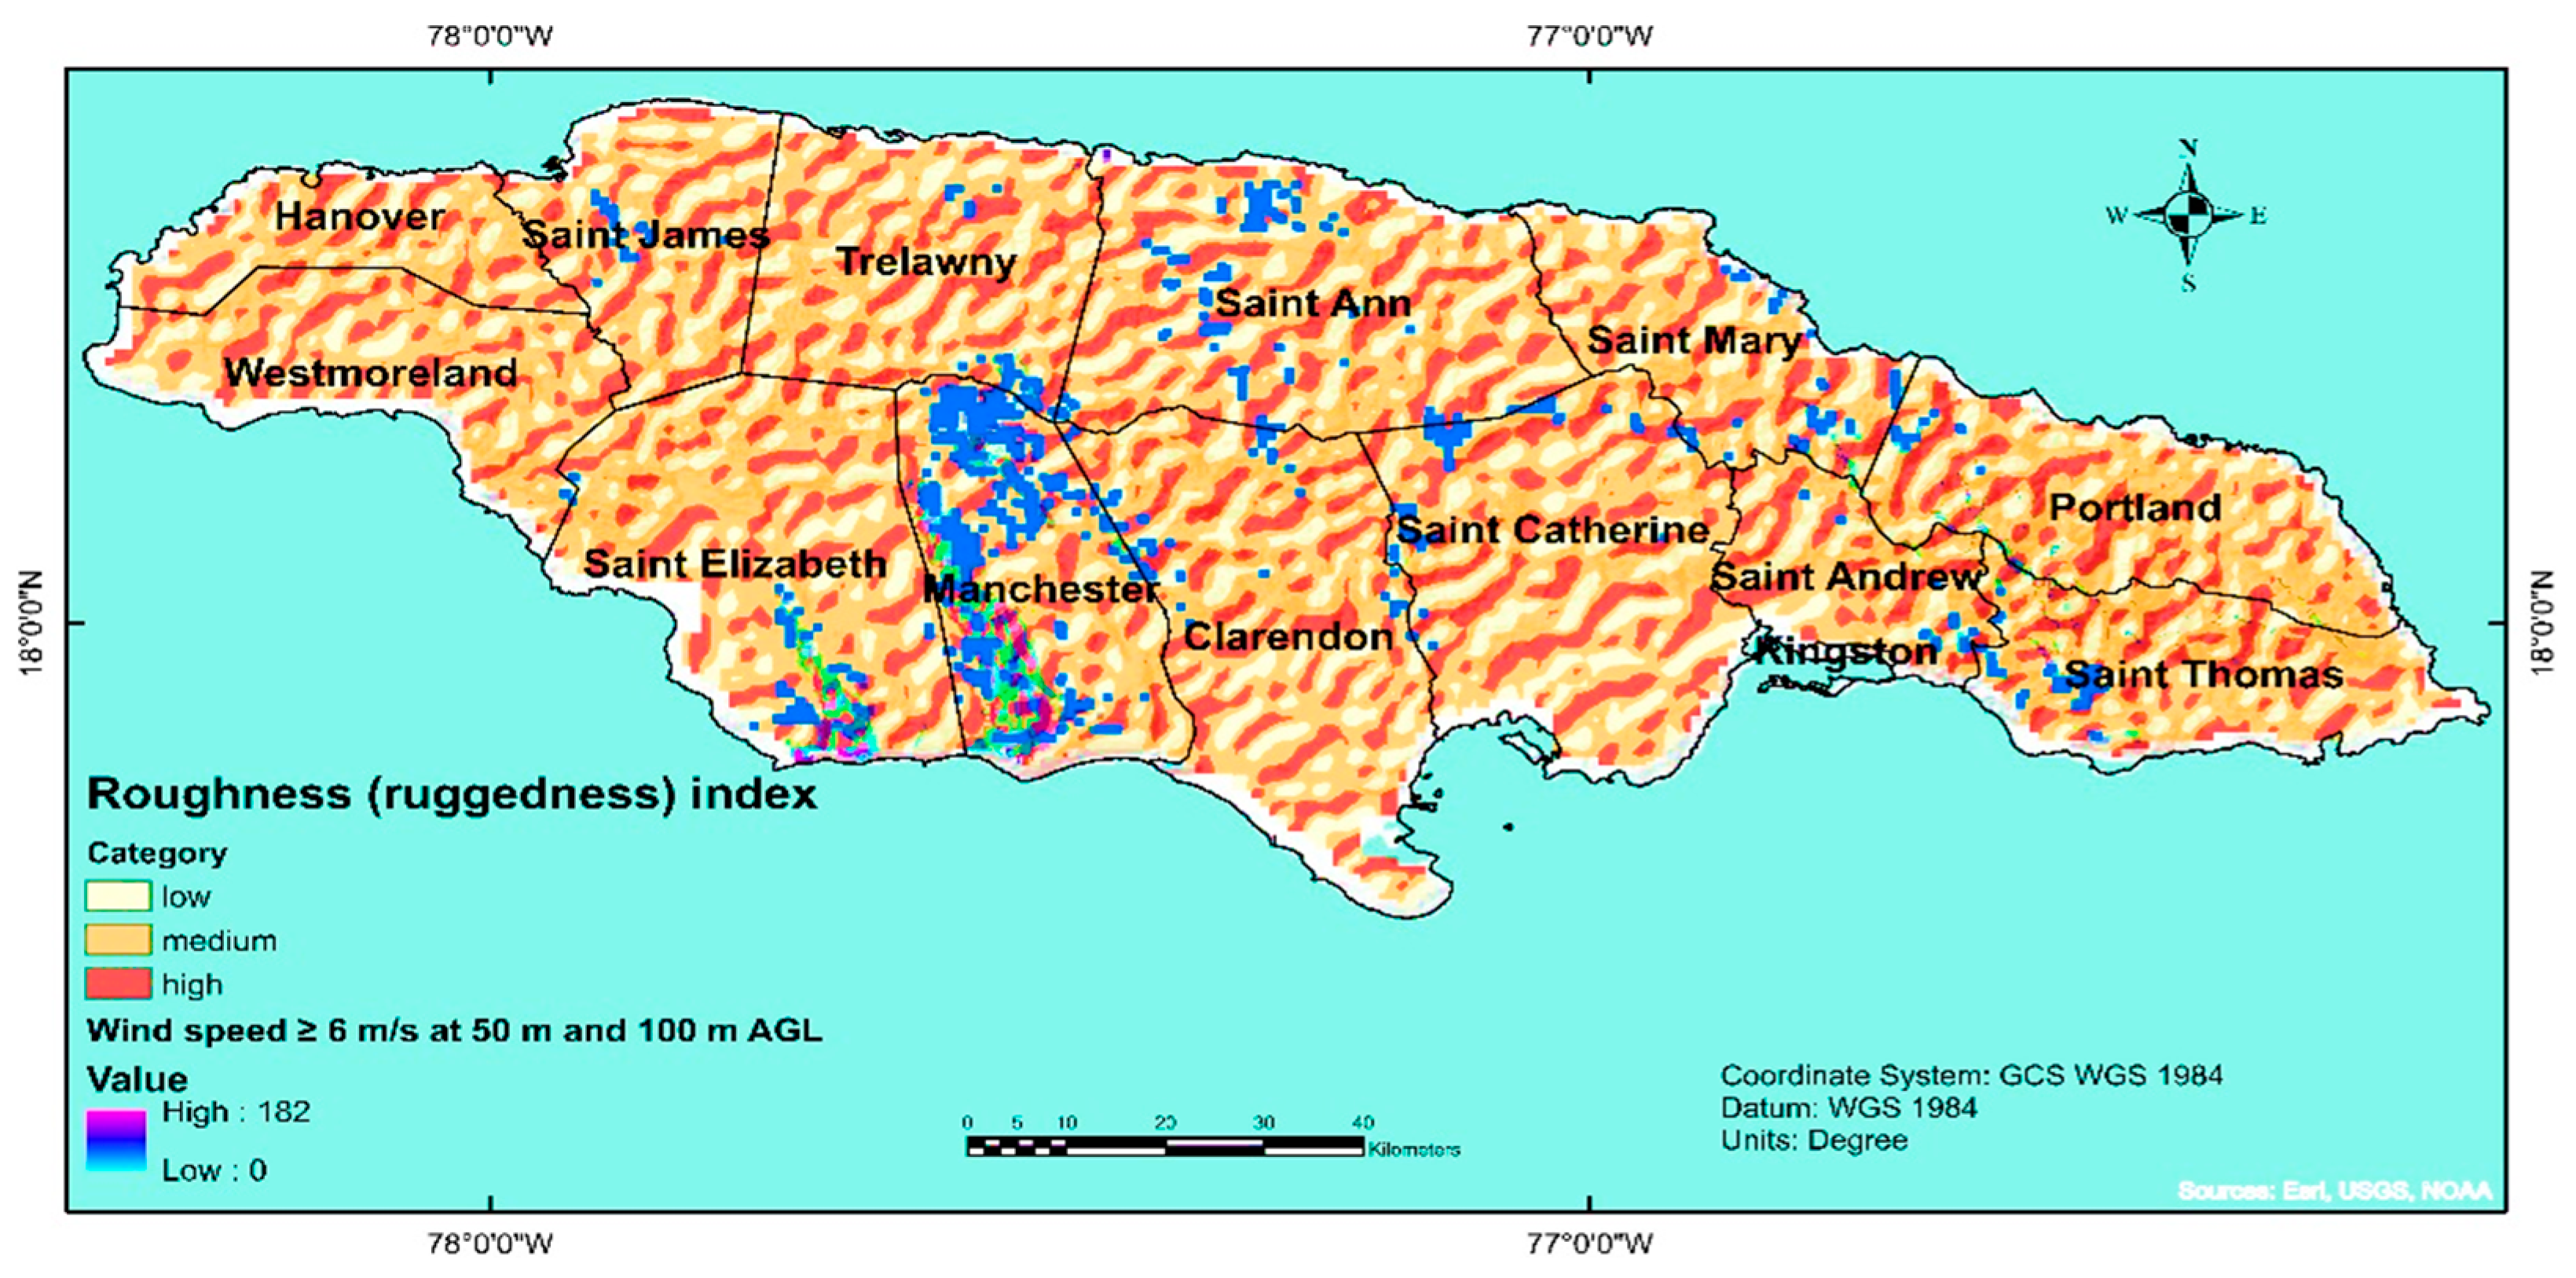
The result of the roughness length revealed that the available landscape was within the range of low to medium, as seen in Figure 16. Nonetheless, with turbine spacing 5.3 times turbines rotor diameter, even forested lands are appropriate for wind development. Table 5 outlines the number of turbines and land area demand for one turbine, giving an aggregate of 11,937 Vestas V80 wind turbines with 424 m horizontal distance between turbines fitting space of 0.179 km2 each. Theoretically, 6090 Vestas V112 wind turbines with 593.60 horizontal distance positioning would be suitable, with each turbine occupying a 0.352 km2 dimension. The estimation follows the concept of the total number of turbines equal to the area occupied by the turbine and the horizontal distance between turbines. The results of the two scenarios are in Table 5.
Consequently, the total number of turbines with the Vestas V80 scenario is 11,937, and Vestas V112, 6090. Although the result is theoretical, it helps express the electrical energy output probability from installing these turbines. For example, installing Vestas V80 turbines could yield 62,818 GWh/year with operating hours of 7487 h per year at a capacity factor of 37.5%. Accordingly, following the same notion, the Vestas V112 model could hypothetically generate 56,321 GWh/year of electrical energy under similar conditions with slightly higher operating hours of 8085 at 42.9% capacity.
Several RE proponents may argue that wind power’s worldwide accessibility and its continuous expansion will propel the replacement of fossil fuels, such as coal, petroleum, and natural gas. However, limiting factors exist, including limited land space, the massive size of wind turbines, and other moving parts. In addition, thousands of wind power plants are needed to yield the equivalent energy produced by one coal power station. Another drawback is low or non-existing wind power development subsidies in some countries, including Jamaica. Jamaica encourages renewable energy suppliers to tender bids, provides tax breaks, soft loans, and has feed-in tariffs for households and small to medium-sized businesses (SMEs) [19]. Nonetheless, these support systems limit development scope as they fail to cushion blows from failed projects and might lead to a low amount of investors because of the high initial investment input needs which yield long waits for financial returns.

4. Conclusions

The environmental-sociotechnical wind atlases of Jamaica offer renewable energy practitioners, investors, and policymakers’ insights into future wind development projects as Jamaica encourages wind power investment indicated in “Jamaica Energy Investor Guide″ of 2017 [19]. Additionally, identifying plausible areas for distinctive analysis saves time and capital resources since it eliminates unforeseen eventualities related to intrusion on areas of environmental significance, mainly protected regions and places deemed ill-suited given terrain roughness. The study utilizes combined quantitative and qualitative data methodologies to realize national environmental-sociotechnical wind atlases appropriate for guiding wind power expansion in Jamaica. Although wind atlases in this study are specific to Jamaica, the comprehensive approach applies to other countries as the method is malleable with variables dependent on the location’s social-economic, geographic, and environmental construct. If Jamaica hopes to meet its CARICOM commitment of 40% renewable energy for total electrical energy generation by 2040 [11], plus the national goal of 50% by 2030, an increase in wind power development is necessary to utilize the 60% untapped potential [46,47]. The study underscores opportunities to reduce fossil fuel-based electricity while decreasing greenhouse gas emissions as associated with plans outlined in the National Development Contribution (NDC). The NDC outlines proposals to reduce GHG emissions by 8.2 million metric tons (8.2 M MT CO2eq) before 2030.
Geographical Information System (GIS), a popular energy assessment tool, was utilized to derive suitable land zones of 24.41 to 26% for onshore wind farms in Jamaica, including environmental, economic, social, safety, and technical criteria with underlining categorical variables as indicators to derive quantitative values appropriate for Jamaica’s landscape and is comparable to international studies with similar objectives. It found that available areas can theoretically generate up to 62,818 GWh per year of electrical energy. The high-resolution wind atlases of 250 m indicate twenty-nine point locations for direct onsite assessment for potential wind farms minimizing prospective capital losses for such investigations, including time, money, and planning resources. The study presents policymakers and potential investors with a tool encompassing comprehensive analysis for the expansion of wind power development.

5. Limitations

This study does not address the importance of local perceptions and the acceptance of wind farm expansion by including stakeholders’ opinions, and neither does it have onsite measurements using wind-scape measuring devices known to reduce uncertainties and eliminate bias. Subsequently, further research highlights stakeholders’ views by applying the multi-criteria decision-making (MCDM) GIS approach. The method compensates for shortfalls in this study by assessing the comparative importance of several variables utilized as criteria and subcriteria when making complex decisions [48]. The literature review identified Jamaican wind farm potential site location studies for on, and offshore wind farms lack stakeholder opinions. The works of Bailey et al., 2013 [14], Chen, 1990 [15], Chen et al., 2020 [16], and RoAid, 2019 [17] pointed out appropriate locations for onshore and offshore wind farms without weighing environmental conditions against technical, economical, and social factors contingent on stakeholders’ ideas. Subsequently, stakeholders’ input is warranted. Though the study encompasses a multidimensional approach that supports policymakers, it can be strengthened with stakeholders’ input along with an economic assessment of proposed project investment according to potential energy from specific site locations.
Furthermore, suitability models ought to be created for extrapolating wind resources at 100 m AGL since the power density for January 2022 indicates a more significant amount in comparison to values at 50 m AGL. Recently, researchers have suggested that modern-day onshore wind farms are installed at 100 m of hub height [26]. The latter alternative will offer additional options for investors and policy planners to investigate other site locations as Jamaica expands its renewable energy sources for energy self-sufficiency. Thus, these components should be addressed in a future study.

Author Contributions

D.R. wrote the first draft of the manuscript. After that, Professors H.Y. and T.M. reviewed and edited the work. They also advised throughout the research process. All authors have read and agreed to the published version of the manuscript.

Funding

This research was supported by the JST SPRING Fellowship, Support for Pioneering Research Initiated by the next generation from the University of Tsukuba under grant number JPMJSP2124-2021.

Institutional Review Board Statement

Not applicable.

Informed Consent Statement

Not applicable.

Data Availability Statement

All data are reported in this work.

Acknowledgments

The principal author thanks Helmut Yabar and Takeshi Mizunoya from the University of Tsukuba, without whom the research would not be possible. In addition, we are grateful for support from the Ministry of Industry, Commerce, Agriculture & Fisheries, the Ministry of Science, Energy, and Technology in Jamaica, the Jamaican government’s Meteorological Service Division which provided data, and the JST X UT Fellowship SPRING Support for Pioneering Research Initiated by the next generation from the University of Tsukuba.

Conflicts of Interest

The authors declare there is no conflict of interest exists.

References

  1. The United States Environmental Protection Agency. Renewable Energy Fact Sheet: Wind Turbines. 2013. Available online: https://www.epa.gov/sites/default/files/2019-08/documents/wind_turbines_fact_sheet_p100il8k.pdf (accessed on 15 April 2022).
  2. The World Wind Energy Association. SUSTAINABILITY and due diligence GUIDELINES. 2004. Available online: http://www.wind-works.org/articles/WWEA_Sust_Guide.pdf (accessed on 19 May 2022).
  3. Cross, D.T. Placing Wind Farms too Close Together Isn’t a Good Idea. 2018. Available online: https://www.sustainability-times.com/low-carbon-energy/placing-wind-farms-too-close-together-isnt-a-good-idea/#:~:text=Upwind%20farms%20generate%20%E2%80%9Cwake%20effects,researchers%20in%20the%20United%20States (accessed on 4 April 2022).
  4. Xu, J.; Liu, T. Technological paradigm-based approaches towards challenges and policy shifts for sustainable wind energy development. Energy Policy 2020, 142, 111538. [Google Scholar] [CrossRef]
  5. Wind Power. 2021. Available online: https://www.iea.org/reports/wind-power (accessed on 4 April 2022).
  6. Wright, R.M. Wind energy development in the Caribbean. Renew. Energy 2001, 24, 439–444. Available online: https://www.sciencedirect.com/science/article/pii/S096014810100026X?casa_token=e8AwWPFSDo4AAAAA:8jFuHRh7v8y-ATZaJNsAZNKFdVg3YlPYRImXIcpNjrk6pq77djzjvnQZDSm7By2FkT2Pl4l3 (accessed on 4 March 2022). [CrossRef]
  7. Costoya, X.; DeCastro, M.; Santos, F.; Sousa, M.C.; Gómez-Gesteira, M. Projections of wind energy resources in the Caribbean for the 21st century. Energy 2019, 178, 356–367. Available online: https://www.sciencedirect.com/science/article/pii/S0360544219307546?casa_token=PriUKy8t5zEAAAAA:coGQW_LGTuML4dg1V5SclHvwjSDLhcDjIev8wewD-PQwwJWGKgOqYeUdSfzqJ29oFgyEXO2h (accessed on 22 March 2022). [CrossRef]
  8. wei Zheng, C.; Pan, J. Assessment of the global ocean wind energy resource. Renew. Sustain. Energy Rev. 2014, 33, 382–391. [Google Scholar] [CrossRef]
  9. Energy Division, Ministry of Science Energy and Technology. 2017 Energy Report Card Jamaica. 2018. Available online: https://europa.eu (accessed on 2 February 2022).
  10. United States Department of Energy. Energy Transitions Initiatives: Jamaica Energy Snapshot. 2020. Available online: Energy.gov/sites/default/files/2020/09/f79/ETI-Energy-Snapshot-Jamaica_FY20.pdf (accessed on 18 February 2022).
  11. Ochs, A.; Konold, M.; Auth, K.; Musolino, E.; Killeen, P. Caribbean Sustainable Energy Roadmap and Strategy (C-SERMS); Worldwatch Institute: Washington, DC, USA, 2015; Volume 29, Available online: http://www.worldwatch.org/system/files/C-SERMS_Baseline_10 (accessed on 13 February 2022).
  12. Richards, D.; Yabar, H. Potential of Renewable Energy in Jamaica’s Power Sector: Feasibility Analysis of Biogas Production for Electricity Generation. Sustainability 2022, 14, 6457. [Google Scholar] [CrossRef]
  13. THE WIND POWER Jamaica Production Capacity. 2019. Wind Energy Marketing Intelligence. Available online: https://www.thewindpower.net/country_en_30_jamaica.php (accessed on 10 April 2022).
  14. Bailey, K.A.; Muir, D.D.; Chambers, T. Offshore Wind Farm as Jamaica’s Possible Primary Source of Renewable Energy. Arts Sci. Technol. 2013, 6, 34. [Google Scholar]
  15. Chen, A.A.; Daniel, A.R.; Daniel, S.T.; Gray, C.R. Wind power in Jamaica. Sol. Energy 1990, 44, 355–365. [Google Scholar] [CrossRef]
  16. Chen, A.A.; Stephens, A.J.; Koon, R.K.; Ashtine, M.; Koon, K.M.K. Pathways to climate change mitigation and stable energy by 100% renewable for a small island: Jamaica as an example. Renew. Sustain. Energy Rev. 2020, 121, 109671. [Google Scholar] [CrossRef]
  17. Romanian Agency for International Development Cooperation—RoAid. A Review of the Jamaican Energy Sector and Development Opportunities. 2019. Available online: https://ridgeline-industrial.ro/Studiu-fezabilitate-Jamaica-V4-15-Mar-2019.pdf (accessed on 13 February 2022).
  18. Global Wind Atlas. 2022. Available online: https://globalwindatlas.info/ (accessed on 2 January 2022).
  19. Planning Institute of Jamaica. Vision 2030 Jamaica: National Development Plan; PIOJ: Kingston, Jamaica, 2009. [Google Scholar]
  20. Ministry of Energy and Mining. National Renewable Energy Policy (2009–2030). 2010. Available online: https://www.mset.gov.jm/sites/default/files/pdf/Draft%20Renewable%20Energy%20Policy.pdf (accessed on 9 March 2022).
  21. Jamaica Information Service, Office of the Prime Minister, Jamaica to Increase Renewables Target to 50%—PM Holness. 2018. Available online: https://jis.gov.jm/jamaica-to-increase-renewables-target-to-50-pm-holness/ (accessed on 13 November 2018).
  22. Ministry of Science, Energy, and Technology. JAMAICA—Regulatory Indicators for Sustainable Energy. “JAMAICA ENERGY INVESTOR GUIDE”. 2017. Available online: https://rise.esmap.org/data/files/library/jamaica/Renewable%20Energy/Supporting%20Documentation/Jamaica_Energy_Investor_Guide.pdf (accessed on 16 January 2022).
  23. Matejicek, L. Assessment of Energy Sources Using GIS; Springer: Berlin/Heidelberg, Germany, 2017. [Google Scholar]
  24. Shahinkhoo, H. Assessment of Energy Sources Using GIS and A GIS-Based Approach for Analyzing Wind Energy Development in SH; AkademikerVerlag: Saarland, Germany, 2018. [Google Scholar]
  25. Enevoldsen, P. A sociotechnical framework for examining the consequences of deforestation: A case study of wind project development in Northern Europe. Energy Policy 2018, 115, 138–147. [Google Scholar] [CrossRef]
  26. von Krauland, A.K.; Permien, F.H.; Enevoldsen, P.; Jacobson, M.Z. Onshore wind energy atlas for the United States accounting for land use restrictions and wind speed thresholds. Smart Energy 2021, 3, 100046. [Google Scholar] [CrossRef]
  27. Baseer, M.A.; Rehman, S.; Meyer, J.P.; Alam, M.M. GIS-based site suitability analysis for wind farm development in Saudi Arabia. Energy 2017, 141, 1166–1176. [Google Scholar] [CrossRef] [Green Version]
  28. Watson, J.J.; Hudson, M.D. Regional Scale wind farm and solar farm suitability assessment using GIS-assisted multi-criteria evaluation. Landsc. Urban Plan. 2015, 138, 20–31. [Google Scholar] [CrossRef]
  29. Enevoldsen, P.; Permien, F.H. Mapping the wind energy potential of Sweden: A sociotechnical wind atlas. J. Renew. Energy 2018, 2018, 1650794. [Google Scholar] [CrossRef]
  30. Sliz-Szkliniarz, B.; Vogt, J. GIS-based approach for the evaluation of wind energy potential: A case study for the Kujawsko–Pomorskie Voivodeship. Renew. Sustain. Energy Rev. 2011, 15, 1696–1707. [Google Scholar] [CrossRef]
  31. National Environment and Planning Agency, Jamaica. Available online: https://www.nepa.gov.jm/index.php/certificates/cites/procedures (accessed on 3 January 2022).
  32. Cevallos-Sierra, J.; Ramos-Martin, J. Spatial assessment of the potential of renewable energy: The case of Ecuador. Renew. Sustain. Energy Rev. 2018, 81, 1154–1165. [Google Scholar] [CrossRef]
  33. Zahedi, R.; Ghorbani, M.; Daneshgar, S.; Gitifar, S.; Qezelbigloo, S. Potential measurement of Iran’s western regional wind energy using GIS. J. Clean. Prod. 2022, 330, 129883. [Google Scholar] [CrossRef]
  34. Jamaica Public Service. Available online: https://www.jpsco.com/ (accessed on 16 January 2022).
  35. Bureau of Standards Jamaica. Jamaica National Building Code, Volume 2: Energy Efficiency Building Code, Requirements, and Guidelines. Available online: https://rise.esmap.org/data/files/library/jamaica/JAMAICA%20Supporting%20Documents/EE/EE%2023.1%20JAMAICA%20National%20Building%20Code,%20Volume%202,%20Energy%20Efficiency%20Building%20Code%201994.pdf (accessed on 14 January 2022).
  36. William, R. Regional Energy Efficiency Building Code to be Developed. Jamaica Information Service, Kingston. 31 March 2017. Available online: https://jis.gov.jm/regional-energy-efficiency-building-code-developed/ (accessed on 18 February 2022).
  37. Siyal, S.H.; Mörtberg, U.; Mentis, D.; Welsch, M.; Babelon, I.; Howells, M. Wind energy assessment considering geographic and environmental restrictions in Sweden: A GIS-based approach. Energy 2015, 83, 447–461. [Google Scholar] [CrossRef]
  38. Rodman, L.; Meentemeyer, R. A geographic analysis of wind turbine placement in Northern California. Energy Policy 2006, 34, 2137–2149. [Google Scholar] [CrossRef]
  39. Warren, C.R.; McFadyen, M. Does community ownership affect public attitudes to wind energy? A case study from south-west Scotland. Land Use Policy 2010, 27, 204–213. [Google Scholar] [CrossRef]
  40. Baban, S.M.; Parry, T. Developing and applying a GIS-assisted approach to locating wind farms in the UK. Renew. Energy 2001, 24, 59–71. [Google Scholar] [CrossRef]
  41. Nandi, A.; Mandal, A.; Wilson, M.; Smith, D. Flood hazard mapping in Jamaica using principal component analysis and logistic regression. Environ. Earth Sci. 2016, 75, 1–16. [Google Scholar] [CrossRef]
  42. Enevoldsen, P.; Valentine, S.V. Do onshore and offshore wind farm development patterns differ? Energy Sustain. Dev. 2016, 35, 41–51. [Google Scholar] [CrossRef]
  43. Environmental & Engineering Managers Ltd. Environmental Impact Assessment Blue Mountain Renewables 34 MW Wind Farm Project Malvern, St. Elizabeth. 2014. Available online: https://www.nepa.gov.jm/sites/default/files/2019-12/BMR_Jamaica_Wind_Environmental_Impact_Assessment_2014.pdf (accessed on 4 January 2022).
  44. Landberg, L.; Myllerup, L.; Rathmann, O.; Petersen, E.L.; Jørgensen, B.H.; Badger, J.; Mortensen, N.G. Wind resource estimation—an overview. Wind Energy Int. J. Prog. Appl. Wind Power Convers. Technol. 2003, 6, 261–271. [Google Scholar] [CrossRef]
  45. Daniel, A.R.; Chen, A.A. Stochastic simulation and forecasting of hourly average wind speed sequences in Jamaica. Sol. Energy 1991, 46, 1–11. [Google Scholar] [CrossRef]
  46. Makhijani, S.; Ochs, A.; Weber, M.; Konold, M.; Lucky, M.; Ahmed, A. Jamaica Sustainable Energy Roadmap: Pathways to an Affordable, Reliable, Low-Emission Electricity System; Worldwatch Institute: Washington, DC, USA, 2013. [Google Scholar]
  47. International Renewable Energy Agency (IRENA). ENERGY PROFILE Jamaica. 2021. Available online: https://www.irena.org/IRENADocuments/Statistical_Profiles/Central%20America%20and%20the%20Caribbean/Jamaica_Central%20America%20and%20the%20Caribbean_RE_SP.pdf (accessed on 6 February 2022).
  48. Van Haaren, R.; Fthenakis, V. GIS-based wind farm site selection using spatial multi-criteria analysis (SMCA): Evaluating the case for New York State. Renew. Sustain. Energy Rev. 2011, 15, 3332–3340. [Google Scholar] [CrossRef]
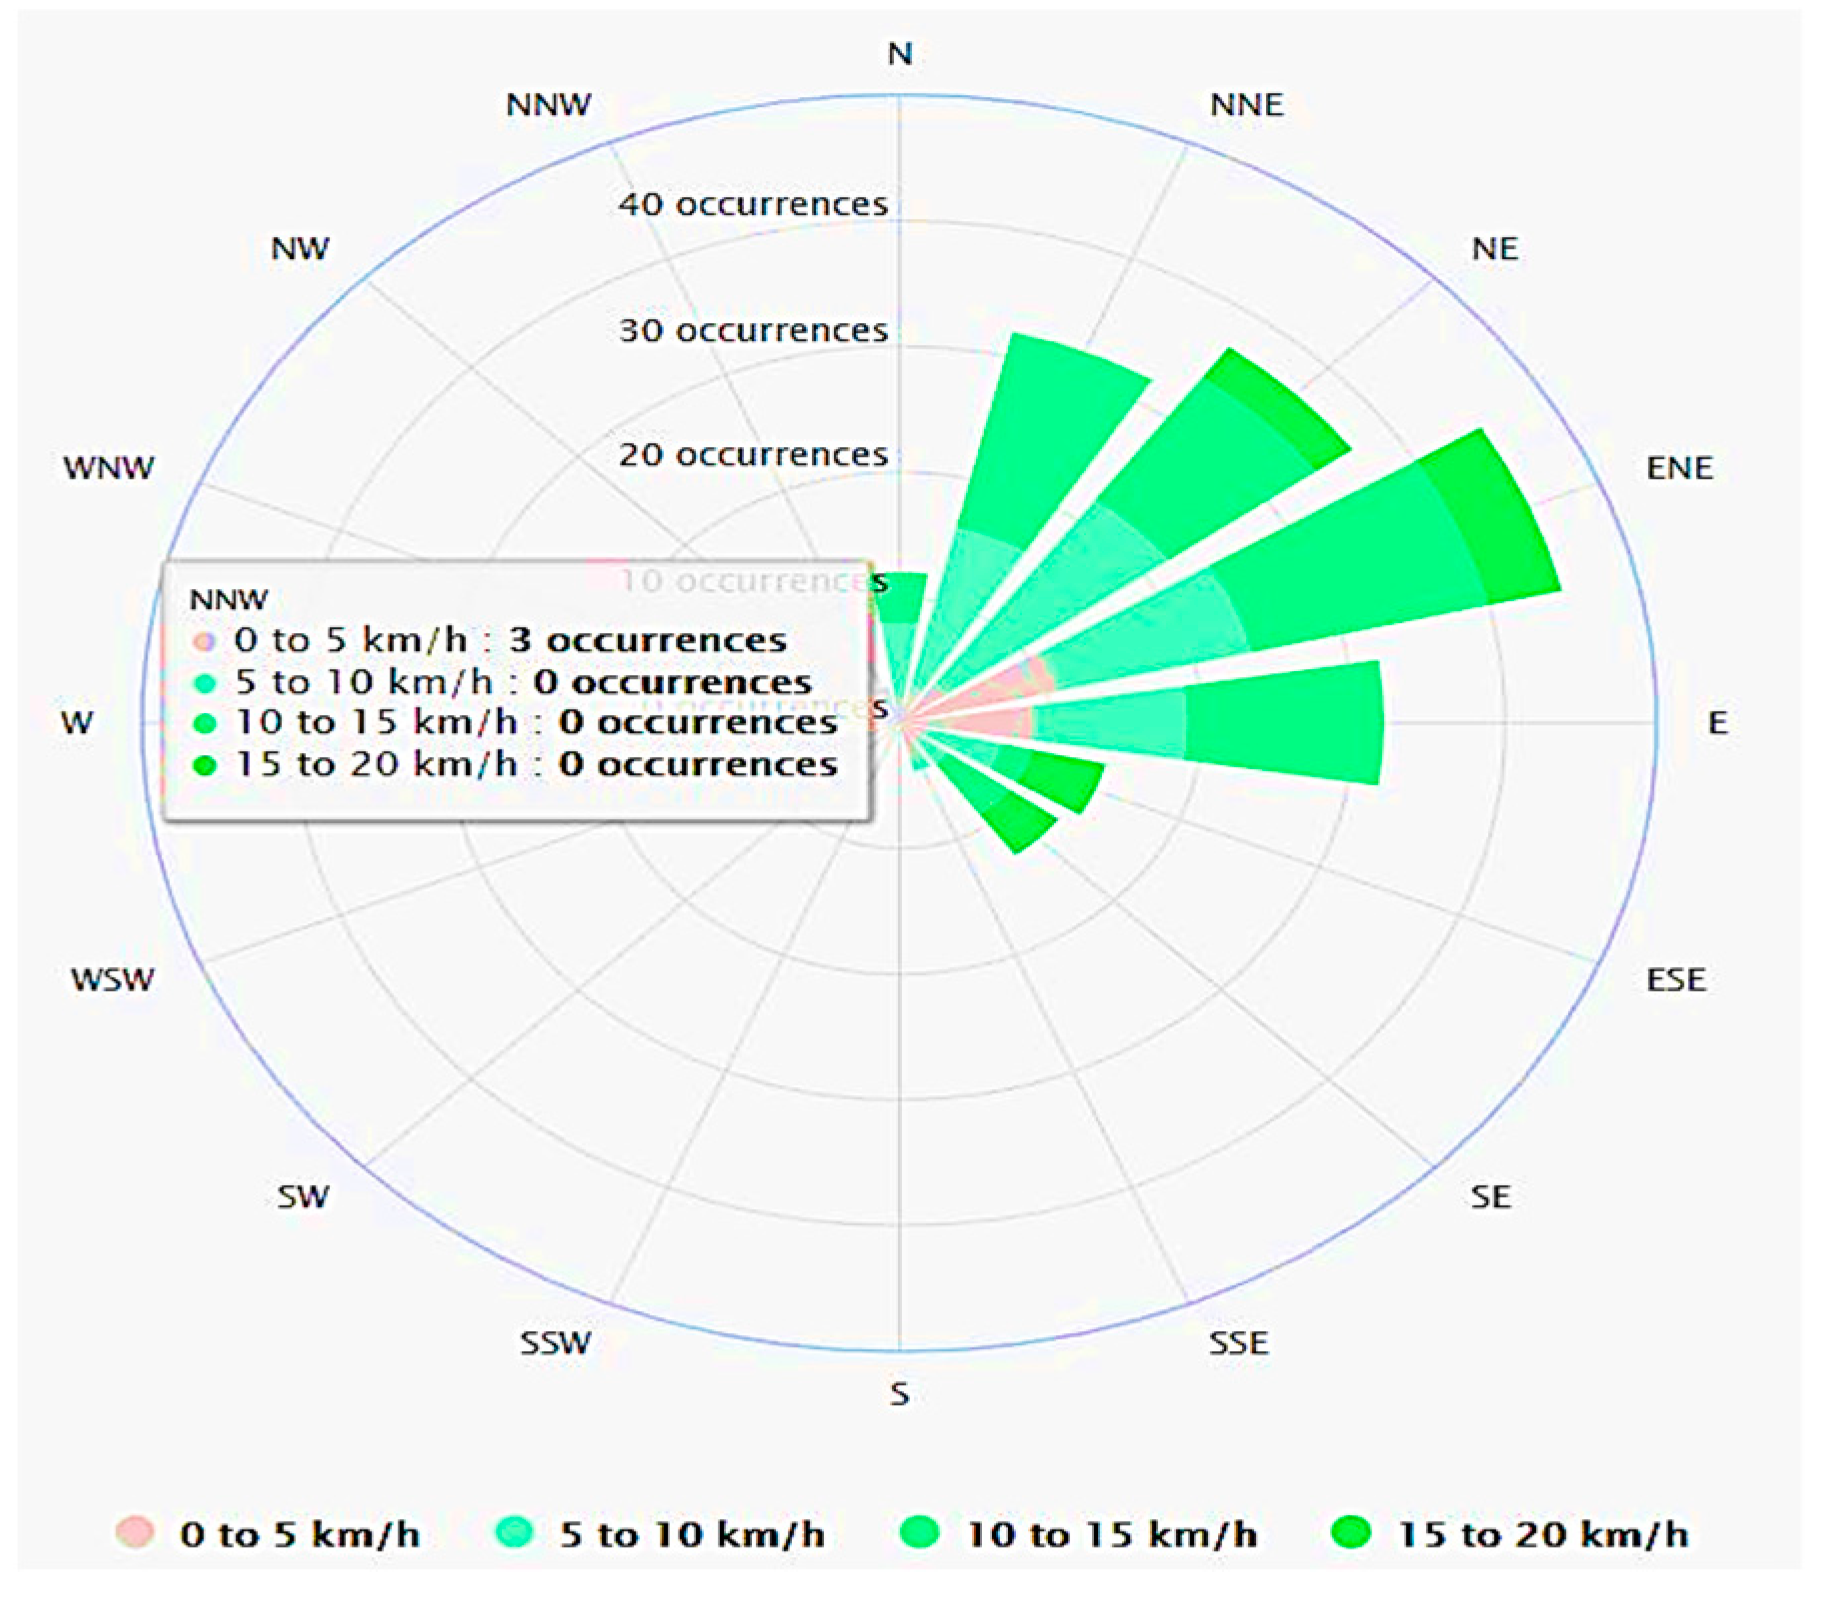
Figure 1. Jamaica’s electricity generation mix as of 2020. Sources [9,10,11,12].
Sustainability 14 11933 g001
Figure 2. Jamaica’s wind rose, which shows wind chiefly blows northeastern. The wind rose was generated by Global Wind Atlas online software [18].
Sustainability 14 11933 g002
Figure 3. The methodological framework of Jamaica’s wind atlases assessment. Authors’ derivation based on literature review.
Sustainability 14 11933 g003
Figure 4. Physical instruments for wind speed measuring-meteorological stations and current wind farm locations on the map of Jamaica.
Sustainability 14 11933 g004
Figure 5. Jamaica’s yearly wind resource threshold at 50 and 100 m AGL. Annual wind speed at 50 m AGL (left), Annual wind speed at 100 m AGL (right).
Sustainability 14 11933 g005
Figure 6. Consolidated maps for highly suitable onshore wind farm locations. Jamaica’s restriction, slope, elevation, suitability, and wind resource maps are integrated to produce Jamaican wind atlases and convenient site placement for onshore wind farms.
Sustainability 14 11933 g006
Figure 7. Jamaica’s unrestricted area map. This map indicates available suitable land for wind farm expansion after applying restrictions on physical infrastructure and land use.
Sustainability 14 11933 g007
Figure 8. The sequence of increasing wind thresholds for Jamaica at 100 m AGL.
Sustainability 14 11933 g008
Figure 9. The concatenation of increasing wind thresholds for Jamaica at 50 m AGL.
Sustainability 14 11933 g009
Figure 10. Available suitable land for onshore wind farm expansion. It highlights appropriate locales after applying restriction and suitability parameters.
Sustainability 14 11933 g010
Figure 11. Annual mean wind thresholds of ≥6 m/s at 50 and 100 m AGL.
Sustainability 14 11933 g011
Figure 12. Map of the most suitable zones within the suitability along with the national electric grid network. The map highlights the most sensible zones within suitability according to wind threshold and other factors within the study.
Sustainability 14 11933 g012
Figure 13. Mean wind speeds of 50 m and 100 m AGL comparison. This indicates the annual mean wind speeds’ frequencies are similar in values but deviate at values greater than five m/s.
Sustainability 14 11933 g013
Figure 14. Mean wind speed along with power density at 50 and 100 m AGL. This illustrates that power density at 50 m exceeds that of 100 m, which accounts for greater electrical energy output when turbines are placed at 50 m hub height.
Sustainability 14 11933 g014
Figure 15. Further suitability in the excellently suited areas at 50 and 100 m AGL, ≥6 m/s. The extrapolated zones within the most suitable zones distinctly reference the relevant sites for probing. Furthermore, the point locations of the 29 selected bases for Jamaica’s onshore wind farm expansion are integrated.
Sustainability 14 11933 g015
Figure 16. Terrain roughness index and wind speeds ≥ 6 m/s at 50 and 100 m. AGL on a map of Jamaica.
Sustainability 14 11933 g016
Table 1. Jamaica’s current wind farm installations.
Name
(Windfarm)
Total Nominal Power (kW) No. of TurbinesHub Height (m)WP Type (OWF */OnWF *)
Munro Wind Farm3000
4
50OnWF
Munro College255
1
50OnWF
Malvern36,300
11
No data (-)OnWF
Wigton I20,700
23
50OnWF
Wigton II18,000
9
-OnWF
Wigton III24,000
12
-OnWF
Petroleum Corporation of Jamaica (PCJ)Suitability study on the way-OWF
Source: The Wind Power: Wind Energy Marketing Intelligence. (n.d.) [13]. The data was last updated in 2020. * OWF—offshore wind farm; * OnWF—onshore wind farm.
Table 2. Summary of constraint and factor variables applied in the study.
Study CriteriaVariableMeasurements (m), (%), (MW), and (Numbers)Parameter, References A–H
This StudyGlobal Wind Atlas (GWA) [18]von Krauland et al. (2021) [26]Basheer et al. (2017) [27]Watson and Hudson. (2015) [28]Enevoldsen and Permien. (2018) [29]Sliz-Szklin and Joachim. (2011) [30]Jamaica’s Environment and Planning Agency [31]Cevallos and Martine. (2018) [32]Raw count
Factor variables
(FV) for suitability model
Visibility impact 2000–4000 moxxooxx-o4
Slope 10–30%ooxooxo-o6
Resource potentialVaries (MW)o oxxoo-o5
Distance Transmission line <2000 moxxxxox-o3
Land cover (terrain roughness) Low to highooxxxxo-o4
Resource Frequency (WS) Variesooxoooo-o7
Population density variesxxoxxxx-x1
Wind turbinevariesoooxxxo-x4
Orography feature-oooxxxx-x3
Elevation >30ooxxxxo-o4
Wildlife distance <1000 moxxoxxx-x2
Weibull distribution -ooxxxxo-x3
Building 1–1500 mxxoooxoox5
Airport >1500 moxxxxoxox3
Road100–10,000 moxoooooox7
Railway 200–500 moxoxoxo-x4
Waterway170–200 moxoxxxx-x2
Waterbody0–200 moxoxxxx-x2
Land use 200–10,000 moxxooox-o5
Special site 1000–10,000 moxxooxoxx4
Protected area200–2000 moxxooxoxx4
Existing wind farm170 moxoxxxx-x2
Sources: Variables and count summary of parameters outlined are derived from references. A to H [22,26,27,28,29,30,31,32]. x = factor variables are not included in the study; and o = factor variables are included in the study.
Table 3. Summary of factor variables in restriction and suitability indicating restricted areas, buffered distances, sources, and description.
Characterization of Factor Variables (Restriction and Suitability Criteria)Factor Variables in the Suitability ModelBuffered Zone (Meters (m))DescriptionSource
Economic Roads: major and minor500 mMajor roads comprise highways, while minor roads are streets, lanes, alleyways, and trails. Practically, the building and maintenance of RE plants require physical access by road, railway, and waterway, which leads to the sites’ main entrances. The road around the perimeter is also necessary for infrastructural development, with internal roads for access to the substation, transmission boxes, and inverters. Conversely, delineated distances need to be applied between all roads in case of accidents from wind turbine malfunction, such as falling debris–blades. The recommended buffer distance varies from 170 m to 3000 m.von Krauland, 2021 [26];
Baseer et al., 2017 [27]; and Zahedi et al., 2022 [33]
Economic Railway500 mLike roads, railways provide access for installation plus continued maintenance. Nevertheless, to avoid damage to persons and properties from falling debris in time of turbine dislocation; therefore, it is recommended to install wind turbines at a specific distance from moving rails.Zahedi et al., 2022 [26]; Watson and Hudson, 2015 [28]; Enevoldsenand Permien, 2018 [29]
EconomicTransmission lines Nearby proximity of wind farms to the electricity grid is recommended to reduce the cost associated with installing and repairing transmission cables. The national electricity grid map in the study is created with data through provisional permission obtained from the Jamaica Public Service website, the largest electricity distributor on the island of Jamaica [34]. Baseer et al., 2017 [27]
EnvironmentalSensitivity sites and protected areas1000 mSensitivity sites include places designated as nationally significant because of their great historical value and outstanding national beauty. Building on these sites poses opposition while encroaching on the scenic quality of areas, potentially leading to natural and cultural degradation. Likewise, areas designated as protected sites are within boundaries of special access by law since they are nationally and internationally recognized as defined geographical spaces, dedicated and managed by legal means to achieve long-term consideration of ecosystem services and cultural values. They incorporate bird sanctuaries, the Blue and John Crow Mountains, Royal Palm Reserve, the Black River Morass, and Palisadoes– Port Royal Protected Area, among others. In addition, 1000 m is used as a buffer zone around these areas as deemed appropriate by Watson and Hudson, 2015 [33].Baseer et al., 2017 [27]; Zahedi et al., 2022 [33]
Social and safetyLand use 500 mThe land use data set consists of residential and commercial properties, which are utilized since specific building shapefiles are unavailable. In addition, public parks, forests, industrial facilities, farmland cemeteries, and other used spaces are represented. Distance to wind turbines from residential and urban areas is essential for public appeal since it sometimes causes opposition. A distance of 170 m [26] to 6000 m [27] is recommended to avoid pollution, flick emissions, and aesthetic appeal. Therefore, it is crucial to define constraint areas around land use. Jamaica’s 1994 Building Code, Volume 2: Energy Efficiency Building Code Requirements and Guideline, gives no clear rules for prohibitions regarding RE systems installation [35].
Similarly, the recently developed Regional Energy Efficiency Building Code does not provide such consideration. Instead, the focus is internal—for the building’s heating, lighting, cooling, and ventilation [36]. In addition, RE facility operators are obligated to comply with environmental standards outlined by the National Environmental Planning Agency (NEPA) and the National Land Agency after obtaining specific permits. However, the list of compliance found on NEPAS’s, the national Lang Agency’s website (web address: http://nep_gov.jm (accessed on 3 January 2022) [29], and libraries exclude boundary-specific prohibitions. Nevertheless, the recommended radius restrictions of a 500 m buffer zone were applied.
Baseer et al., 2017 [27]; Zahedi et al., 2022 [33]; Watson and Hudson, 2015 [28]; National Environment and Planning Agency, Jamaica, n.d. [31]; William, R. 2017 [36]
Social and safetyWaterways 200 mAlthough the distance from water bodies and waterways has been considered marginal or of low importance in some wind power site suitability studies, for example, in the works of Enevoldsen and Permien, 2018 [25], von Krauland et al.; 2021 [26], and Watson and Hudson, 2015 [28]. However, these areas are restricted since building wind power stations or erecting onshore wind farms in a lake, reservoir, pond, or gully is impractical. Furthermore, installing wind power systems in lake areas would require offshore-type turbines with different thresholds, including fitting foundational structures. Therefore, a 200 m buffer distance is inputted with references from Baseer et al., 2017 [27], Sliz-Szklinarz and Vogt, 2011 [32], and Siyal et al., 2015 [37].Baseer, et al., 2017 [27]; and Zahedi, et al., 2022 [33]
Social and safetyWaterbodies 200 m Like waterways, water bodies are inappropriate locations for situating wind farms. Thus, such areas are restricted in this study. Moreover, installing wind power systems in water bodies would require offshore-type turbines with different thresholds, including fitting foundational structures. Therefore, a 200 m buffer distance is recorded with references from Baseer et al., 2017 [27], Sliz-Szklinarz and Vogt, 2011 [30], and Siyal et al., 2015 [37].Baseer et al., 2017 [27]; and Zahedi, et al., 2022 [33]
Social and safetyAirports1500 mIt is essential to consider the safe distance from airports to avoid radar signal interpretation. Therefore, a buffered length of 1500 m is utilized in the restriction as adopted in [27,30].Baseer et al., 2017 [27]; and Sliz-Szkliniarz and Vogt, 2011 [30]
Technical ElevationLand area 30 m above sea level The atmospheric boundary layer has wind thresholds affected by topography and land cover. Therefore, Jamaica’s topography and land cover are included in the suitability to avoid discontinuity of wind flow and danger zones. The topographic data of the digital elevation model (DEM) utilized was obtained from THE WORLD BANK Data Catalog with Jamaica’s digital elevation model raster file comprising digital elevation of 30 m resolution. Additionally, topographic data was gathered from GWA [22], covering DEM files with a resolution of 0.1 to 1 km with surface elevation in meters, referred to as orography in WAsP terminology from The National Aeronautics and Space Administration (NASA) Shuttle Radar Topography Mission (SRTM) DEM provided as 1° by 1° tile in the WGS 1984 coordinate system with reprojected modeling at 150 m grid spacing using cubic interpopulation to correspond with an effective resolution of the SRTM data contained in raster data files from GWA [22]. Both models encompass ground elevation recorded in meters relative to mean sea level (MSL) based on the World Geodetic System (WGS) 1984 reference datum; the same reference used in ArcGIS 10.8.1 for maps created. Global Wind Atlas [18]; Sliz-Szkliniarz and Vogt, 2011 [30]; Cevallos-Sierra and Ramos-Martin, 2018 [32]
TechnicalResource potential (wind speed)Wind thresholds ≥ 6 m/sWhen situating wind farms, the mean interpolated wind speed throughout the data studied is recommended. This is expressed in many wind suitability studies, including von Krauland, 2021 [26], Baseer et al., 2017 [25], Zahedi et al., 2022 [26], plus Sliz-Szkliniarz and Vogt, 2011 [30]. This study uses GWA’s interpolated wind thresholds ≥ 6 m per second and verification from local weather stations. von Krauland, 2021 [26]; Baseer et al., 2017 [27]; Zahedi et al., 2022 [33]; and Sliz-Szkliniarz and Vogt, 2011 [30]
TechnicalExisting wind farms170 m times rotor diameterThe wake effects from all existing wind farms are avoided by applying 500 m, that is, the turbulence from the wakes of neighboring turbines. However, effectively high wind speed may be decreased by wake turbulence intensity due to the closeness of wind turbines, leading to the reduced potential to generate electricity and revenues supported by the works of Cross, 2018 [3], and von Krauland, 2021 [26] and where consideration for rotor diameter is given up to 50 km with the recommendation of 170 m times rotor diameter. Consequently, in the case of Jamaica, provisions are made for rotor diameters from 27 m to 112 m since BMR-operated Malvern Wind Farm in Malvern, St. Elizabeth, operates turbines with rotor diameters of 112 m.Cross, 2018 [3]; and von Krauland, 2021 [26]
TechnicalSlopeAreas ≤ 10°Some wind studies consider slopes as high sloping areas that hinder access to wind farms for installations and maintenance. Subsequently, areas with steep slopes are not considered. Wind research allows ranges from 10 to 30% or ridge crests with a threshold of 10 to 40° with a maximum correlation of 84%. The slope map is derived from the DEM file using features in the spatial analyst tool of ArcGIS.Baseer et al., 2017 [27]; Watson and Hudson, 2015 [28]; and Rodman, 2006 [38]
Sources: Derived from sources in the references of the table [3,22,26,27,28,29,30,31,32,33,34,35,36,37,38]. The table conveys a summary of constrained variables, buffered distances, source references for assembled data, and a description of constrained parameters when determining the threshold.
Table 4. Suitable site locations for wind power expansion.
Specific Suitable Areas with Geographic Location and Coordinates
Location SuitabilityParishDistrict, TownLatitudeLongitude
Location 1Saint ElizabethBull Savanna17°54′27.85″ N77°38′7.37″ W
Location 2ManchesterPike18°13′48.14″ N77°32′9.53″ W
Location 3Huntley18°4′29.86″ N77°35′8.25″ W
Location 4Colleyville18°12′34.95″ N77°30′36.28″ W
Location 5Chudleigh18°8′55.05″ N77°30′2.70″ W
Location 6Fairfield18°1′11.28″ N77°34′25.23″ W
Location 7ClarendonPart of Kellits18°11′1.01″ N77°14′45.80″ W
Location 8Part of Banana Ground18°4′23.01″ N77°24′48.35″ W
Location 9Moores18°1′45.67″ N77°11′13.76″ W
Location 10Saint CatherineGinger Ridge18°4′20.49″ N77°9′45.15″ W
Location 11Ewarton18°10′29.07″ N77°5′52.32″ W
Location 12Pear Tree Grove18°14′14.78″ N76°56′29.84″ W
Location 13Saint AndrewBrandon Hill, South18°6′50.26″ N76°49′55.67″ W
Location 14Saint ThomasPamphret, South17°51′51.00″ N76°30′52.58″ W
Location 15 Comfort Castle18°2′58.31″ N76°24′32.43″ W
Location 16Moore Town18°4′18.49″ N76°25′34.48″ W
Location 17Saint MaryEnfield18°14′5.03″ N76°44′29.15″ W
Location 18Islington18°18′28.60″ N76°51′31.78″ W
Location 19Baxter Mountain18°13′26.22″ N76°46′21.17″ W
Location 20Saint AnnDiscovery Bay18°27′27.09″ N77°24′33.48″ W
Location 21Alexandria18°18′19.55″ N77°21′15.96″ W
Location 22Priory18°26′20.68″ N77°13′47.38″ W
Location 23TrelawnyWirefence18°15′43.75″ N77°32′12.67″ W
Location 24Wait-A-Bit18°14′58.18″ N77°31′11.54″ W
Location 25Lorrimers18°13′20.91″ N77°29′16.06″ W
Location 26Saint JamesHopeton18°23′42.06″ N77°52′5.35″ W
Location 27Catadupa18°16′52.86″ N77°52′30.83″ W
Location 28Roehampton18°24′12.08″ N77°54′34.03″ W
Location 29HanoverJericho18°25′39.62″ N78°7′48.67″ W
Table 5. Technical specifications and scenarios for potential wind turbine expansion in Jamaica at 50 m AGL.
ScenarioRotor Diameter/Spacing Horizontal Distance (m)Area (km2)Number of Potential Turbines Turbine Swept Area m2Power Density (W/m2)Capacity Factor (%)Rated Capacity (kW)Full Load Hours (h/Year)Operating Hours (h/Year)Turbine Power Production (kWh/Year)Total Potential Wind Power (GWh/Year)
Scenario 1: Vestas V805.3/4240.17977611,9375027397.9037.502000328774876,578,15162,818
Scenario 2: Vestas V1125.3/593.600.3523606090985233542.9030753757808511,560,29356,321
Publisher’s Note: MDPI stays neutral with regard to jurisdictional claims in published maps and institutional affiliations.