Article

Analysis of Leakage in a Sustainable Water Pipeline Based on a Magnetic Flux Leakage Technique

1
Graduate Institute of Manufacturing Technology, National Taipei University of Technology, Taipei 10608, Taiwan
2
Institute of Mechanical and Electrical Engineering, National Taipei University of Technology, Taipei 10608, Taiwan
3
Material and Chemical Research Laboratories, Industrial Technology Research Institute, Hsinchu 310401, Taiwan
4
Department of Semiconductor and Electro-Optical Technology, Minghsin University of Science and Technology, Hsinchu 30401, Taiwan
*
Authors to whom correspondence should be addressed.
Sustainability 2022, 14(19), 11853; https://doi.org/10.3390/su141911853
Submission received: 4 August 2022 / Revised: 6 September 2022 / Accepted: 16 September 2022 / Published: 20 September 2022

Abstract

:
Pipelines are typically used to transport oil, natural gas, water, etc. It is one of the most effective methods for transferring fluids over long distances. However, long-term usage of these pipes without maintenance results in the formation of residues, which will pave the way for pipeline accidents and soil contamination. To ensure the safety and protection of resources, these sustainable pipelines need to be inspected to avoid losses. This work aims to investigate various internal defect leaks in the non-uniform thickness of sustainable water pipes that are joined with a pipe expander. The magnetic flux leakage technique was implemented to evaluate these defects by means of a flexible GMR sensor array. An inspection robot containing two units was fabricated with the aid of 3D printing. The power unit provides the necessary thrust to actuate the entire robot whereas the sensing unit is responsible for analyzing the leaks. The robot’s movement is predicted by the MPU6050 and ultrasonic distance sensors that are plotted as motion plots. The sensing unit consists of permanent magnets and a giant magnetoresistance (GMR) array to interrogate the flux leakage in the defect region. The flux leakage from the defects was stored with the help of an Arduino microcontroller, which controls the overall process. In addition, the spring suspension is provided to regulate the motion of the robot. The flux leakage from the defect region was plotted as waveform graphs. Thus, the results are effectively presented and compared. The calculated signal-to-noise ratio (SNR) of the magnetic flux leakages (MFLs) for 4.5 mm-thick pipe defects was 12 to 20.8 dB, and for 6.52 mm-thick pipe defects, it was 9.5 to 19 dB. In sum, the MFL technique provides a reliable method for the sustainable development of water supply to wide areas.

1. Introduction

According to daily life uses and research reports, pipelines play a major role in urban areas for the underground transmission of fluids and gases, such as water, petrochemical substances, natural gases, etc. These are all effectively transferred from one region to another region in a fast and safe manner. However, several factors serve as the root causes affecting pipeline transportation, such as environmental impacts, corrosion, collision, erosion, and the substances it carries inside the pipe. Without proper maintenance of the pipes, the abovementioned factors will result in the formation of leak holes, cracks, and other defects. These defects need to be identified early to avoid cataclysmic failure, including property loss, loss of habitat, etc. [1,2,3,4,5]. Moreover, when water is transported through a pipe, 20–50 percent of the water is wasted due to the failure of pipes. Other types of transportation pipes, such as for petrochemicals and gases, are very expensive, including their repair costs [6,7]. Therefore, pipeline inspection is the most important criterion to ensure the safety of the industry. The pipelines can be inspected by adopting various non-destructive techniques, such as eddy current, ultrasound, acoustic emission, and magnetic flux leakage (MFL) techniques [8,9,10]. Eddy current testing (ETC) is the method of NDT inspection; it can be performed on only conducting materials with the use of an electromagnetic source. The application of ETC is used for cracks, small-size flaws, and metal variation. However, this method has a drawback—a slow response—while using in-line inspection [11]. Ultrasonic inspection is a type of NDT inspection used to analyze flaws and material thickness followed by the principle of ultrasound wave reflection. It can be applied to various in-line pipe inspections, but it has difficulty coupling to the pipe wall during the fast movement of the pipeline inspection gauge (PIG) [11,12,13]. Acoustic emission is also a type of NDT-based inspection method, which involves permanently attaching one or more transducers to analyze the in-line inspection without associating with the PIG. It has some limitations, such as limited resolution, not compact in size, and can only detect an active change [14]. Among these techniques, MFL is considered a common, safe, and cost-effective method to inspect these pipelines in a reliable manner [15,16]. This method involves a magnetizing material that is used to magnetize the pipes, from where the magnetic flux leakage from the defect region is sensed by a sensor. The magnetization can be achieved in three different ways, namely, by excitation coil, a permanent magnet, and the composite magnetic flux method [17,18,19]. The flux leakage is detected with the help of Hall, coil, and magnetoresistance (MR) sensors, respectively [20,21,22]. From the group of MR sensors, giant magnetoresistance (GMR) has gained many advantages over the other sensors in terms of sensitivity, compactness, and cost [23,24,25]. In general, the pipeline inspection robot needs a constant driving force to move from one end to another while inspecting the pipes. This driving force could be either a motor force or a transmission substance force (PIG), such as oil, water, or gas. However, the use of transmission fluid as the thrust force has one drawback—it is hard to maintain a constant speed [26]. The robot also may encounter a few issues while moving into different pipe sizes, twists, and bends sections, which generates vibration and results in improper communication between the onboard sensor and monitoring device about the position of the robot in the pipeline [27,28]. Hence, considering the cost-effectiveness of the whole unit, an electric motor is used to accelerate the robot in most cases [29]. It provides for continuous and more accurate detection of anomalies when measuring surfaces by employing the MFL technique with a strong magnetic source, along with sensors.
The MFL technique is one of the non-destructive methods for measuring the wall thickness and detecting the flaws in pipes. This method is more reliable than the other methods in terms of precise measurements. It is one of the most important aspects of online pipeline inspection in different working environments. Numerous researchers have reported magnetic flux leakage from uniformed wall thicknesses of materials with a good-signal-noise ratio (SNR). Kikuchi et al. [30,31] reported the feasibility of the MFL technique for the evaluation of wall thinning of pipes under reinforcing plates to the nuclear power plans. Zhang et al. [15] experimentally studied the wall thickness of two different sizes of a gas pipeline with diameters of 400 mm to 600 mm through the MFL technique. A Hall sensor array was used to analyze the gas pipeline and feasible results were obtained. Pelkner et al. [32] analyzed the flex leakage from thin steel sheets with a thickness of 0.3 mm by using the MFL method. From the surface of the steel sheet, small-size defects were clearly measured with a good SNR. Piao et al. [33] experimentally analyzed the effect of speed involved in the analysis of magnetic flux on different thicknesses of the walls of steel pipes. It was conducted on 8 mm- to 15 mm-thick pipes with a 0 m/s to 8 m/s speed range. The results: when increasing the speed and thickness of the material, the magnetization of the pipe will decrease. Singh et al. [34] reported the influence of magnetic flux with respect to wall thickness measured in carbon steel plates at sizes of 5–12 mm. The study reveals that the MFL technique is effective in enhancing the detection of surface and subsurface defects with a good SNR. Most of the cases reported defects that were well measured, with a good SNR, by processing a signal and amplification [35,36,37]. Table 1 shows the comparison study of MFL performance on ferromagnetic material. In general, non-uniform wall thickness inevitably forms during the production and use of steel pipes. These pipes are used in different working environments for underground transportation of fluids and drill pipes. These types of pipes lead to different sensitivity toward defect detection. Therefore, it is necessary to have proper defect detection techniques that are non-destructive. MFL techniques are currently used for a wide range of defect detection on a single or multi-layer uniform thickness material, and signals are needed in the process to obtain better SNR values, in order to differentiate the defect position. To elaborate on the magnetic characterization of non-uniform thicknesses of a material along with the different types of defects on a steel pipe, an optimized magnetic flux developing unit in the hardware was used in this study.
In our previous research, we analyzed the flux leakage from various structural defects of a 6-inch water pipe of 7.2 mm uniform thickness. These defects were artificially made and the flux leakage was plotted with the aid of a flexible GMR sensor array [38]. The present work focused on investigating the flux leakages from the defects that were made in non-uniform thicknesses of pipes and the robot dynamic movement towards that defect detection as well. These two pipes were connected by means of a pipe expander (reducer) via welding. A permanent magnet was used to generate a local magnetic field during the inspection and a flexible GMR sensor array consisting of six sensors were employed in sensing the flux leakage caused by the defects in the localized magnetization region. Using an optimized flux developing unit in the hardware system, non-uniform thicknesses of pipe defects were clearly detected on the cylindrical surfaces with aid of a sensor system, specifically, a flexible GMR sensor array. Then, the waveform data were plotted, presented, and compared, with a good SNR, without requiring the processing of signals and amplification.
Table 1. Comparison study of defects with SNR.
Serial NumberDefect TypeDefect DepthWall ThicknessSNR (dB)Reference
1Surface hole2.54.838–12[22]
2Surface rectangular10156[33]
3Subsurface rectangular1.721211.6[34]
4Surface erosion16.39[35]
5Surface notch16.312[35]
6Subsurface hole26.37[35]
7Subsurface rectangular5.761211.13[39]
8Subsurface rectangular3.32125.64[39]
9Surface holes2–8101.5–13%[17]

2. Robot Configuration

The robot system has two major units: the first one is the power unit, and the second one is the sensing unit. The power unit consists of three lithium-ion (Li) batteries with a voltage capacity of 3.7 V, two stepper motors, XL6009 DC power amplifiers, and a driving board. The stepper motors are energized with the power obtained from two Li batteries whereas the third battery is used to actuate the MPU6050 sensor. In addition, the optical encoder was coupled with a rotating shaft of the motor to measure the distance of the robot’s movement. The sensing unit consists of six GMR sensors mounted on a flexible PCB board with an array spacing of 10 mm. In order to adapt the robot system to work in non-uniform sizes of sustainable water pipes, the robot wheels are engaged with spring supports and sliding rods [38]. Due to the inherent constraints that exist inside the pipes, robot movement and pipe size variations were analyzed through MPU6050 and ultrasonic distance sensors. In order to reduce the total weight of these two units, the robot chassis was made by using PLA material through 3D printing. It involves the fused deposition modeling (FDM) of the PLA material via layer-by-layer deposition [40]. Figure 1 shows the 3D solid modeling of the robot configuration for evaluation of the defects in the pipeline. Table 2 displays the structural parameters of the robot system.

3. Experimental Study

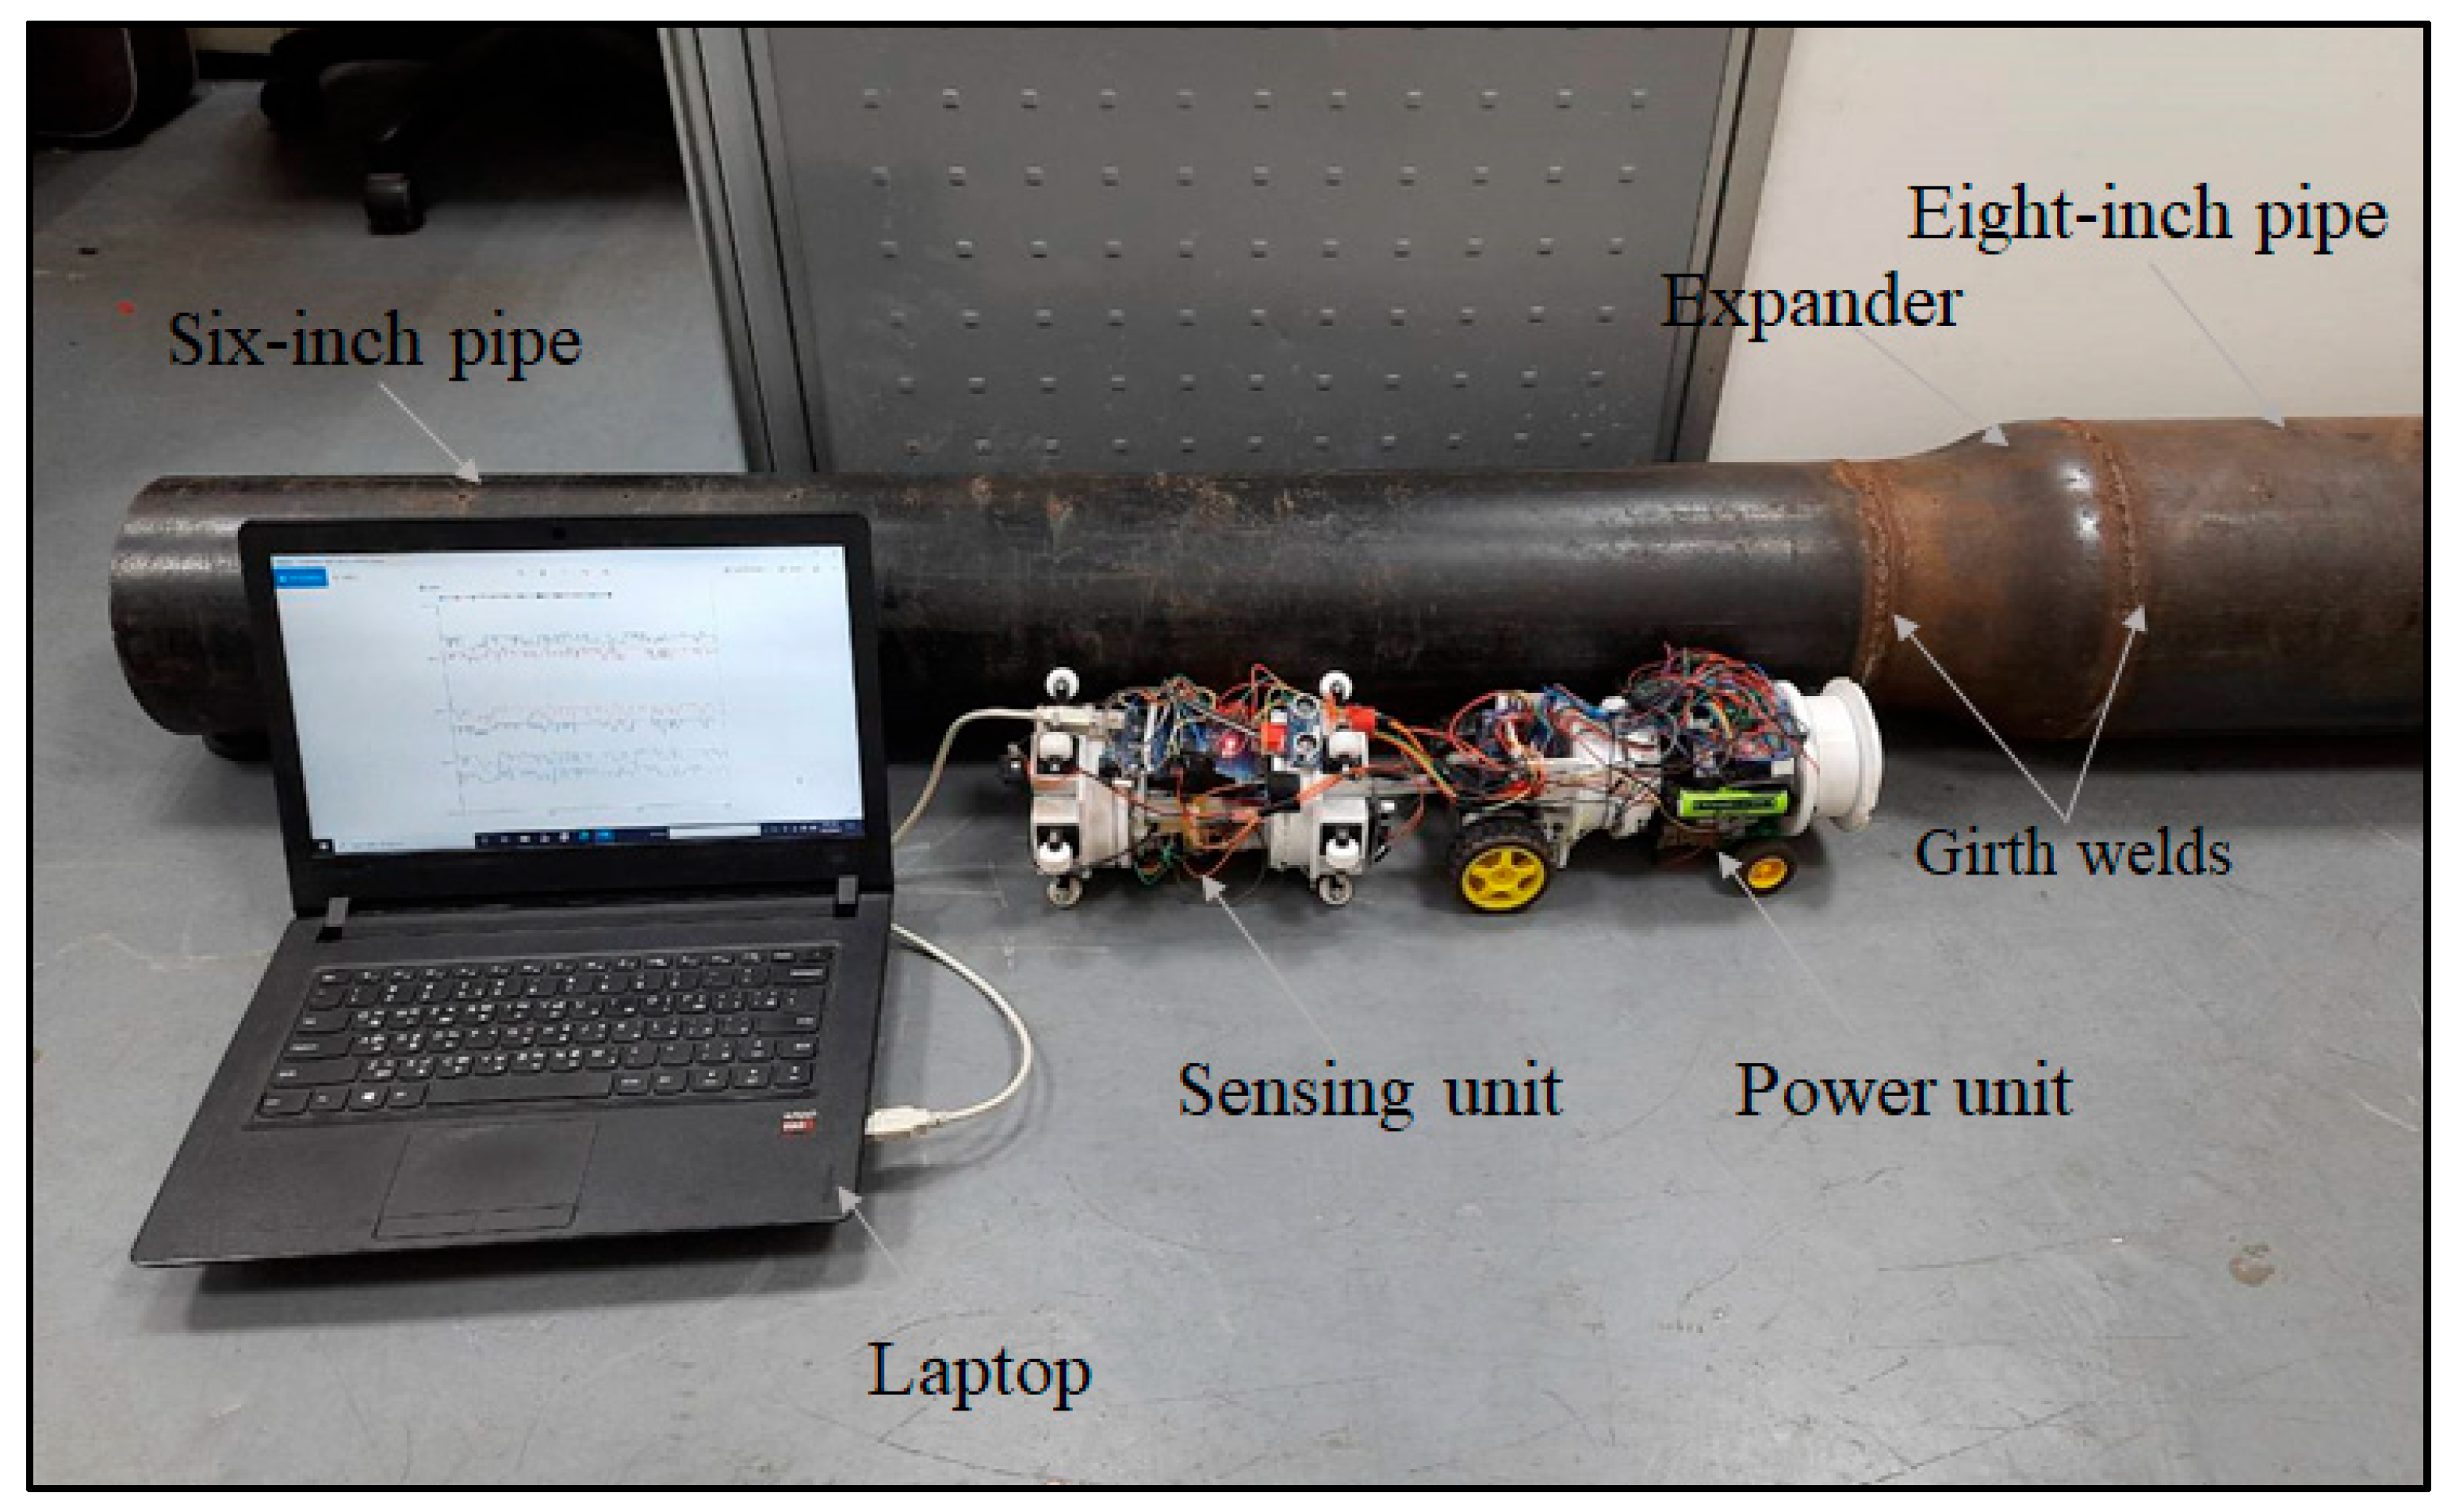
The proposed in-line inspection robot, which works on the MFL technique, is shown in Figure 2. After assembling the parts in the robot chassis, Arduino MEGA 2560 was used to control the entire framework. Sketch software was employed to program the Arduino MEGA 2560. As per the program coded, the Arduino will actuate the motor driver, thereby initiating the stepper motor, and the data acquisition was done through a microcontroller and stored in a micro SD card for plotting. The spring suspension along with sliding rods helps to avoid the robot’s misalignment during its movement through the pipe reducer. The robot movement in the 3D axis and its corresponding 2D plot were obtained from the data acquired using the MPU6050 and ultrasonic distance sensor, which was attached to the sensing unit. Three sets of artificial defects were introduced on 6-inch and 8-inch diameters, with a 4.5 mm and 6.52 mm thickness, along a straight line, respectively. The first set of defects deals with the different through-hole sizes in both water pipes, with diameters of 2 mm, 4 mm, and 6 mm. The second set of defects represents the various sizes of LMA (loss of metallic cross-sectional area), being 1 mm, 2 mm, and 4 mm in depth, and 2 mm in width. The last set defines the uneven size of the multi-hole defects. The power and sensing units were connected together to carry out the inspection process. Once the motor gets the power supply, the robot system will move toward defect detection in the axial direction of the pipe from the 6-inch to 8-inch pipe, and is controlled by an Arduino microcontroller. With the aid of N42 permanent magnets, a localized magnetic field was developed in the inspection region. Magnetic flux is generated and in the defect region, the flux starts to leak through the defect. This flux is sensed by the flexible GMR sensor array, which is mounted in the sensing unit. The rate of changes in MFL status was clearly observed by the GMR sensor array and plotted as waveform graphs. The flux leakage at the defect region on non-uniform thickness is depicted as the voltage variations in this graph. This variation will represent the defect’s location along with non-uniform pipe-size variations. Then, the robot motion was measured through an MPU6050 sensor and plotted as angular movement and linear acceleration graphs.

4. Results and Discussion

In this section, we discuss the result of the sensors system corresponding to the defect regions. Based on the MFL technique with permanent marginalization, the GMR sensor array provided strong evidence against the developed defects. According to previous research studies, in the simulation model of the MFL system, the GMR sensor lift-off distance was kept at 1 mm from the center of the GMR sensor to the measured pipe surfaces. The detection was carried out in the axial direction. In addition, the MPU6050 sensor analyzes the movement of the robot during the interrogation of the entire pipe section.

4.1. Analysis of the Different through-Hole Axial Sizes in the Non-Uniform Pipe

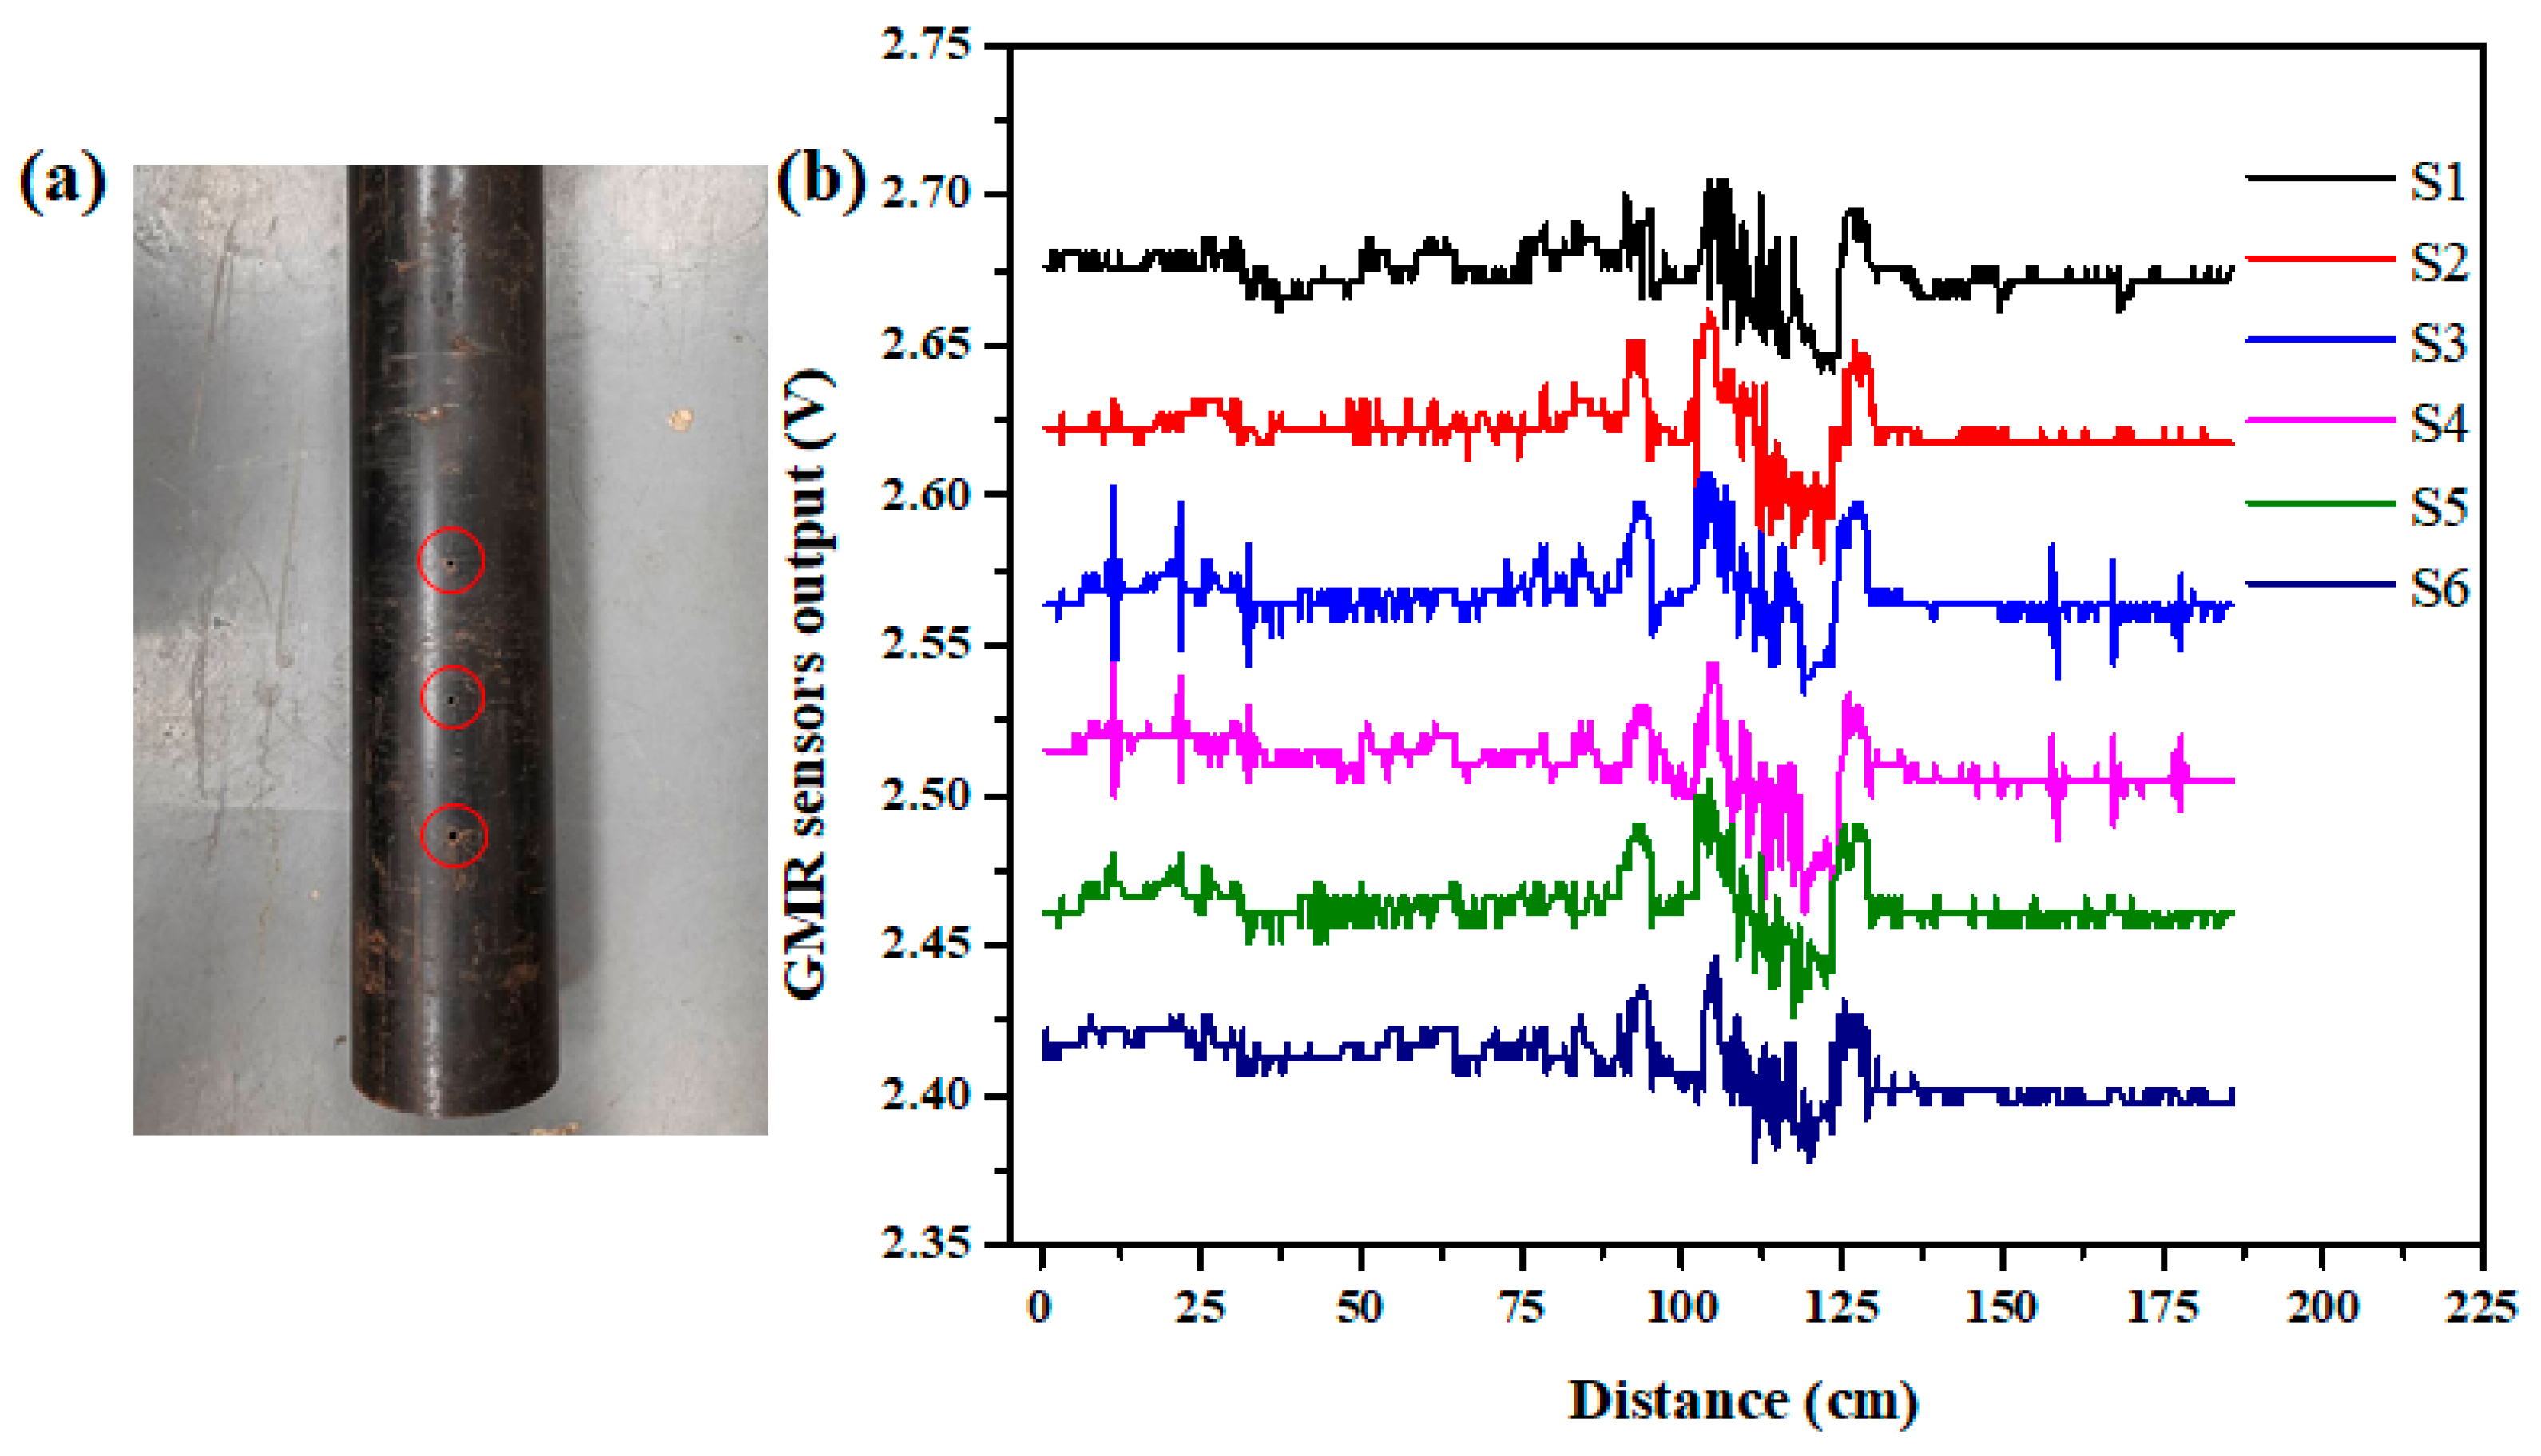
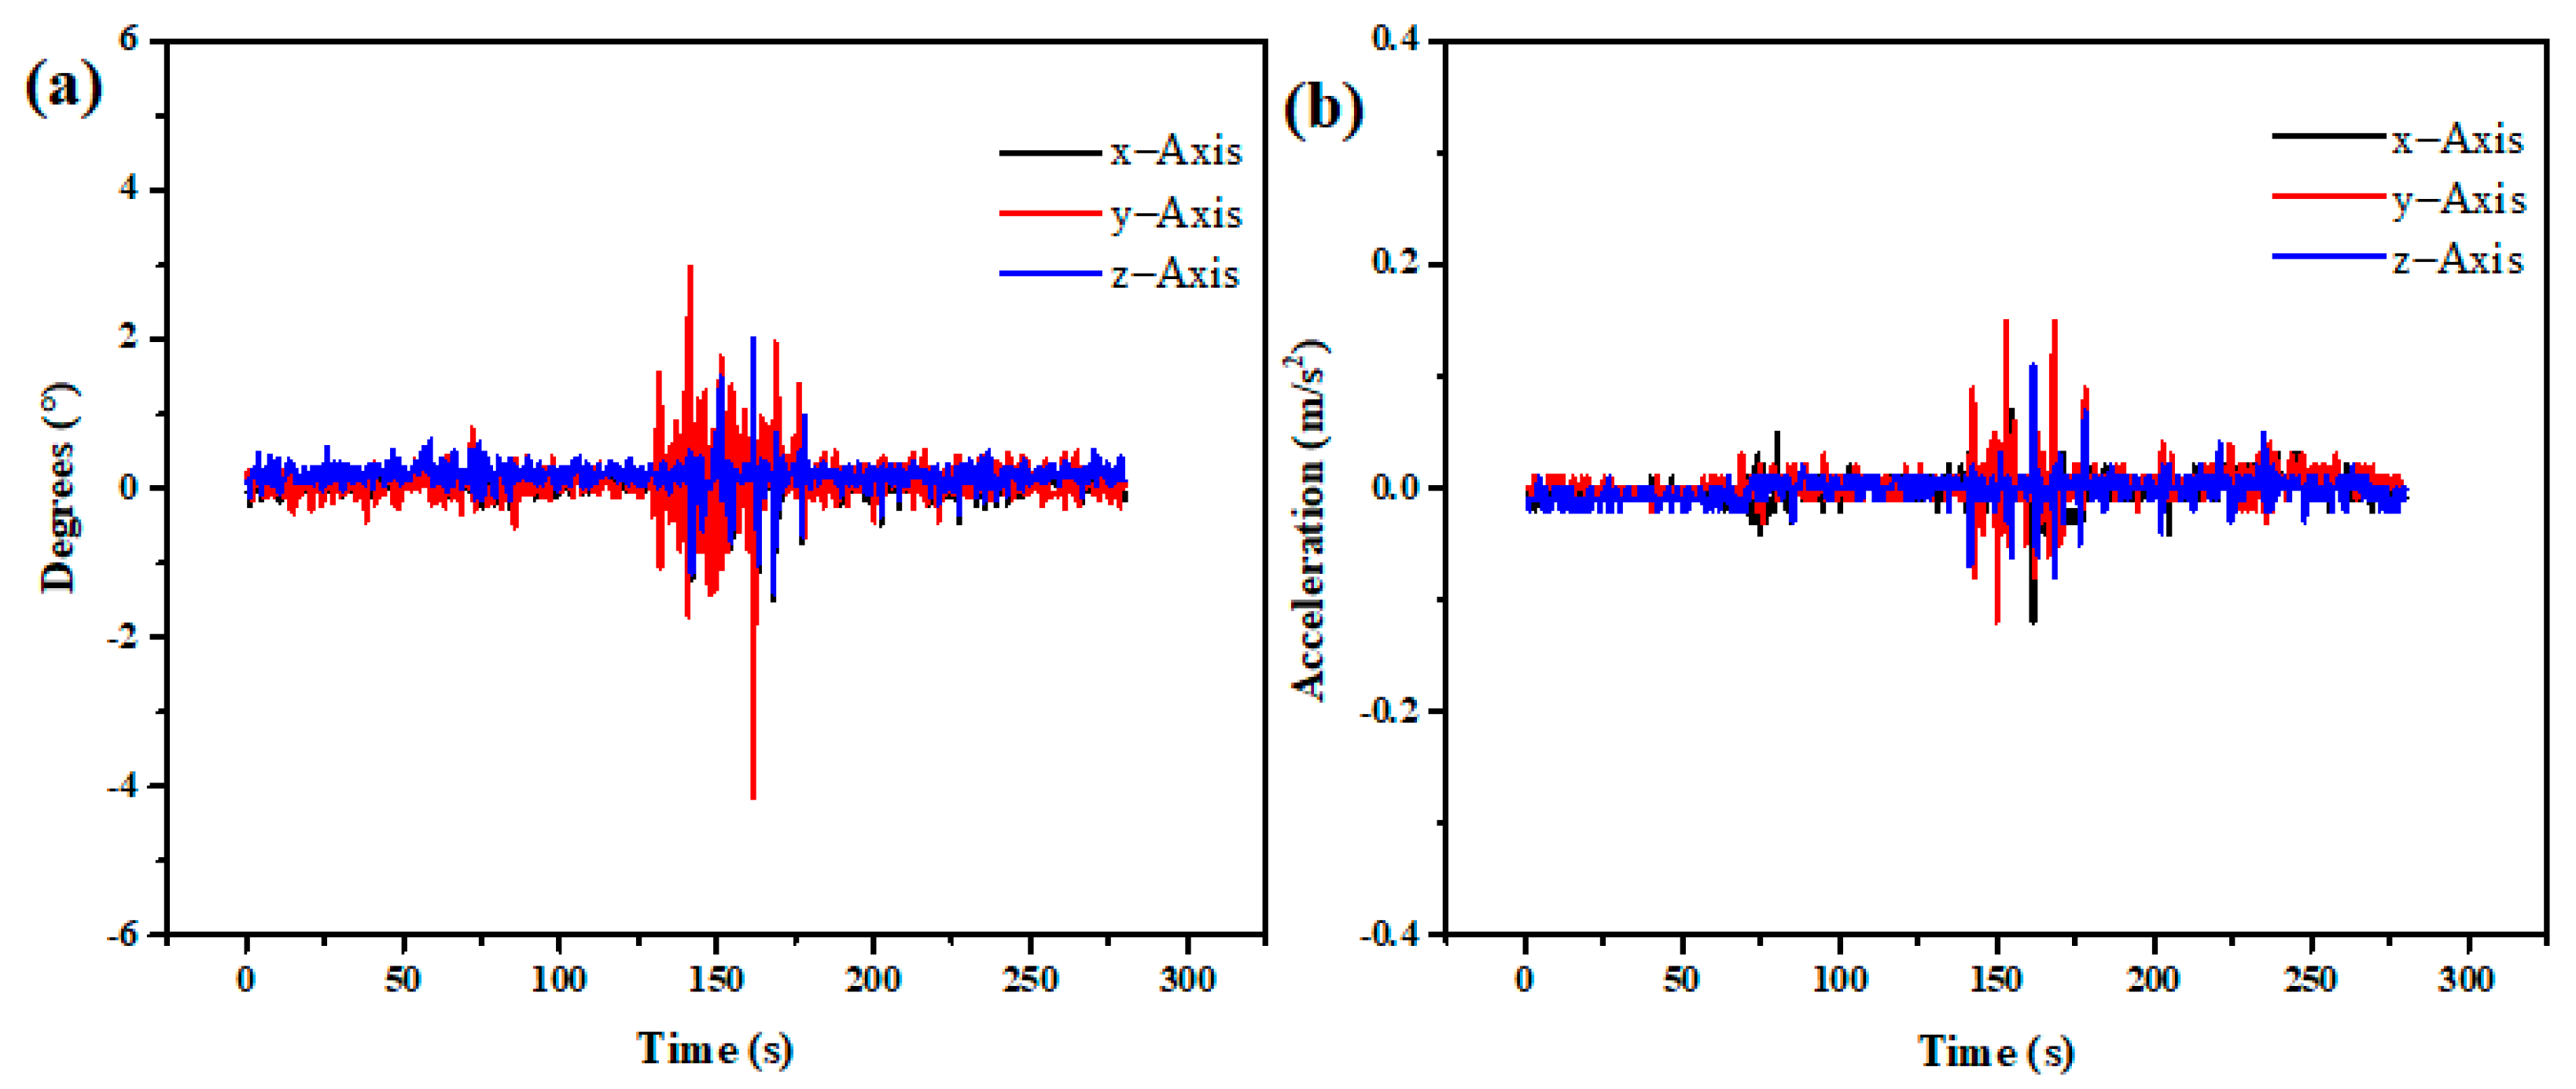
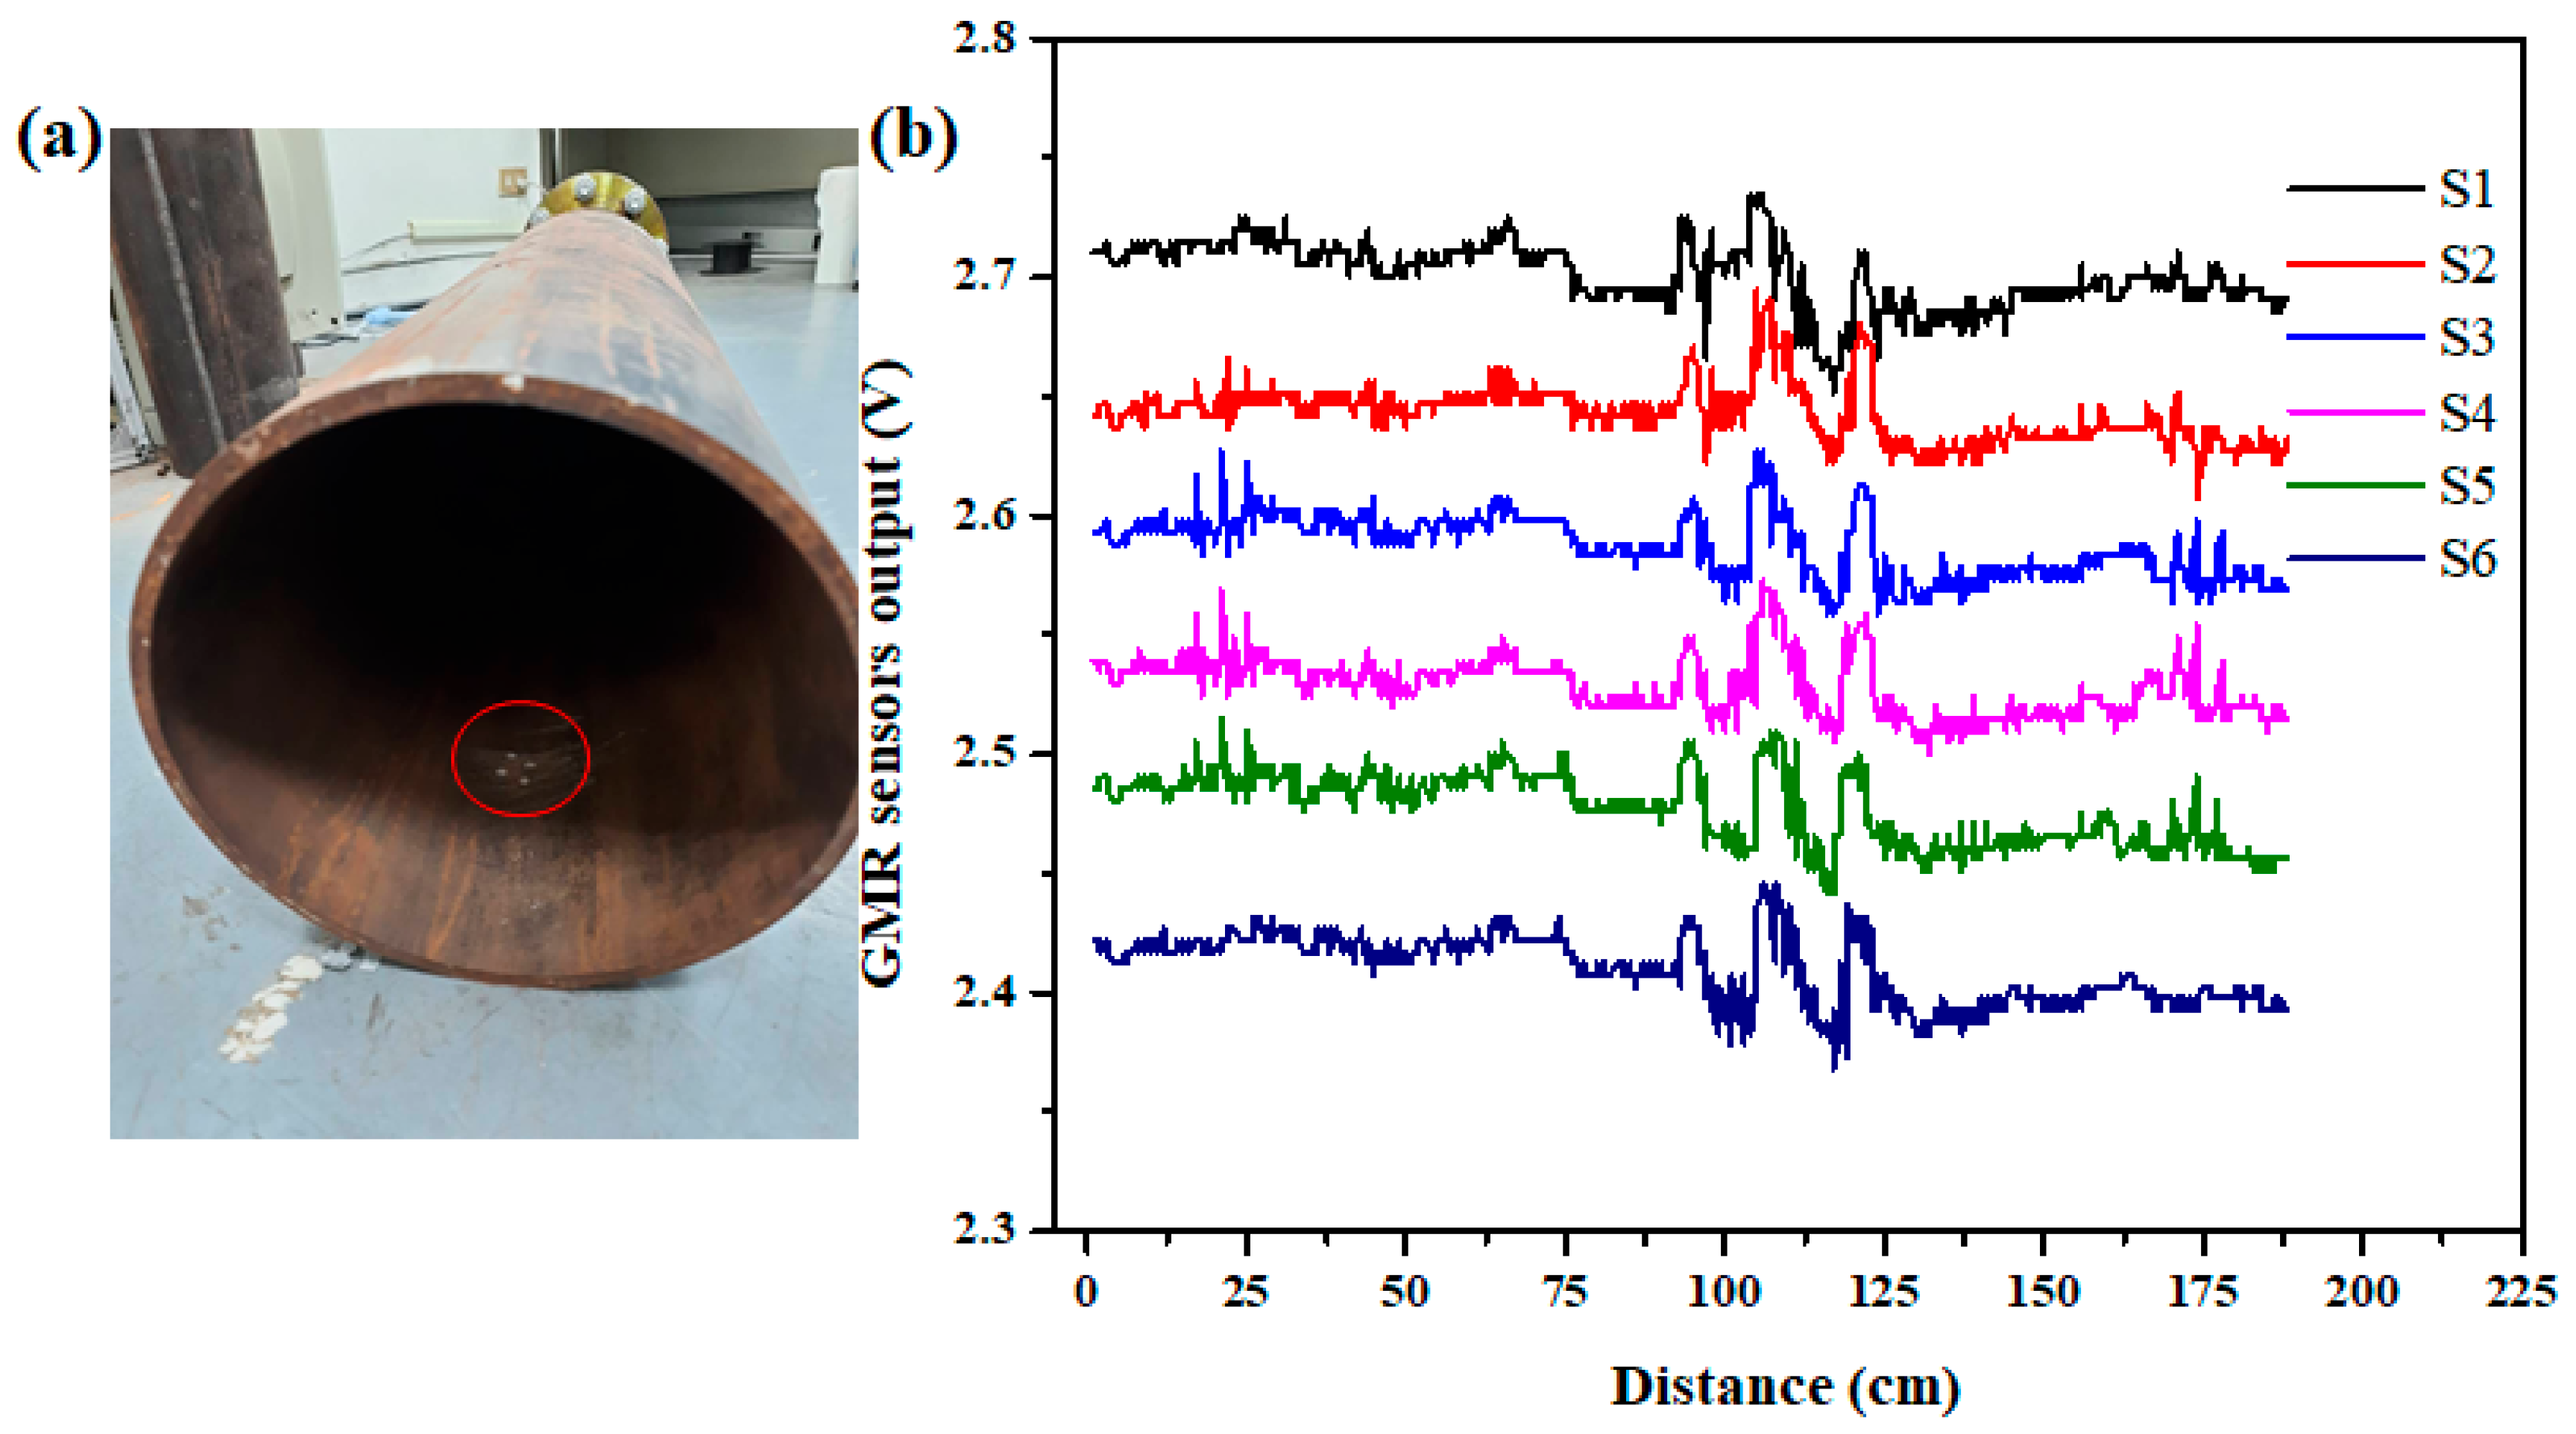
For the evaluation of the magnetic flux leakage (MFL) in non-uniform pipe sizes, holes were developed on two water pipes, and then joined together. Figure 3 shows the image of the artificial hole defects of 2 mm, 4 mm, and 6 mm in diameter on the pipe, and the GMR sensor array responses to the defects. The inter-hole distance is 10 cm. Figure 3a defines the three through-hole defects at the starting line of the 6-inch pipe, and a same-sized hole was developed at the end of the 8-inch pipe as well. Once the in-line inspection robot passed through the pipeline, the GMR sensor array started to interrogate flux leakage from the abnormal surfaces by the magnetization of the permanent magnets. This interrogation was conducted in an axial direction of a 190 cm non-uniform thickness steel pipe. Figure 3b displays the GMR sensor array responses corresponding to the internal pipe surface with defects. From this waveform graph, we observe many variations in output voltage form. The variations are from the defects region, internal girth weld, and inter between pipe joint section (pipe expander). In addition, due to the axial vibration of the robot, slight noise signals were employed by the GMR sensor array [41,42]. Among the six GMR sensors, the S3 and S4 sensors observed magnetic flux leakage from the defect regions at both the start and end of the pipeline. The remaining sensors of S1, S2, S5, and S6 were located some more distance from the defect region. Therefore, these sensors do not perform well as S3 and S4 sensors. From this graph, it is clear that the sensitivity of the GMR sensor, while the robot traverses the defective area of the 6-inch pipe, has slightly higher MFL signals than that of the 8-inch pipe. This is due to the influence of pipe thickness: the thickness of the 6-inch pipe was 4.5 mm, and that of the 8-inch pipe was 6.52 mm. According to the research study, when the size of the pipe thickness reduces, the corresponding magnetic flux range increases. Therefore, the magnetic flux reflection from a less thick material is high; in turn, when increasing the thickness of the material, magnetic flux reflection decreases due to the saturation of the material [15]. Further analyzing this waveform graph, voltage variations were clearly observed, gradually decreasing with respect to the size of holes from 6 mm to 2 mm diameter, measured axially. In addition, the MFL signal for the S3 sensor was calculated and compared, with a good signal-to-noise ratio, as shown in Table 3. For the analysis of the different sizes of the pipe section, the movement of the robot was followed by spring force and sliding rods [38]. In particular, it helps to avoid the robot’s misalignment during its movement through the pipe reducer. In order to analyze the robot movement with respect to all axes, a low-cost MPU6050 sensor was used [43]. It clearly analyzes the robot’s angular movements and linear acceleration; the resulting robot movement is plotted in Figure 4. Hence, the x-axis represents the forward acceleration (pitch), the y-axis represents the sideways acceleration (roll), and the z-axis represents the vertical acceleration (yaw).
When the robot moved initially, the raw data were acquired smoothly, with low noise signals. This noise signal was observed due to the axial vibration of the robot. Once the robot reaches the pipe joints section, owing to the girth weld along with the pipe expander, the robot observes more vibration due to the less effective contact of wheels to the pipe surfaces. As a result, the robot observed a slight disturbance in the middle of the pipe, which was confirmed by the MPU6050 sensor. From Figure 4a, we can see the angular movement of all three axes, in which, remarkably, at the center of the pipe section, the angular movement of the robot is high.
At the pipe expander section, the direction of the robot movement is towards the step-down, and later on, is a straight position. Figure 4b explains the linear acceleration of the robot movement during this study for 300 s. Initially, the x-axis and y-axis are in the same position and have zero acceleration, whereas the z-axis has 1 gravity (g); it was normalized because the projected earth gravity was removed from the raw data of the accelerometer for a comparative study. In the middle of the acceleration graph, we observed significant peaks, similar to the angular movement graph. These peaks characterize the robot’s movement in between the two pipe sections.
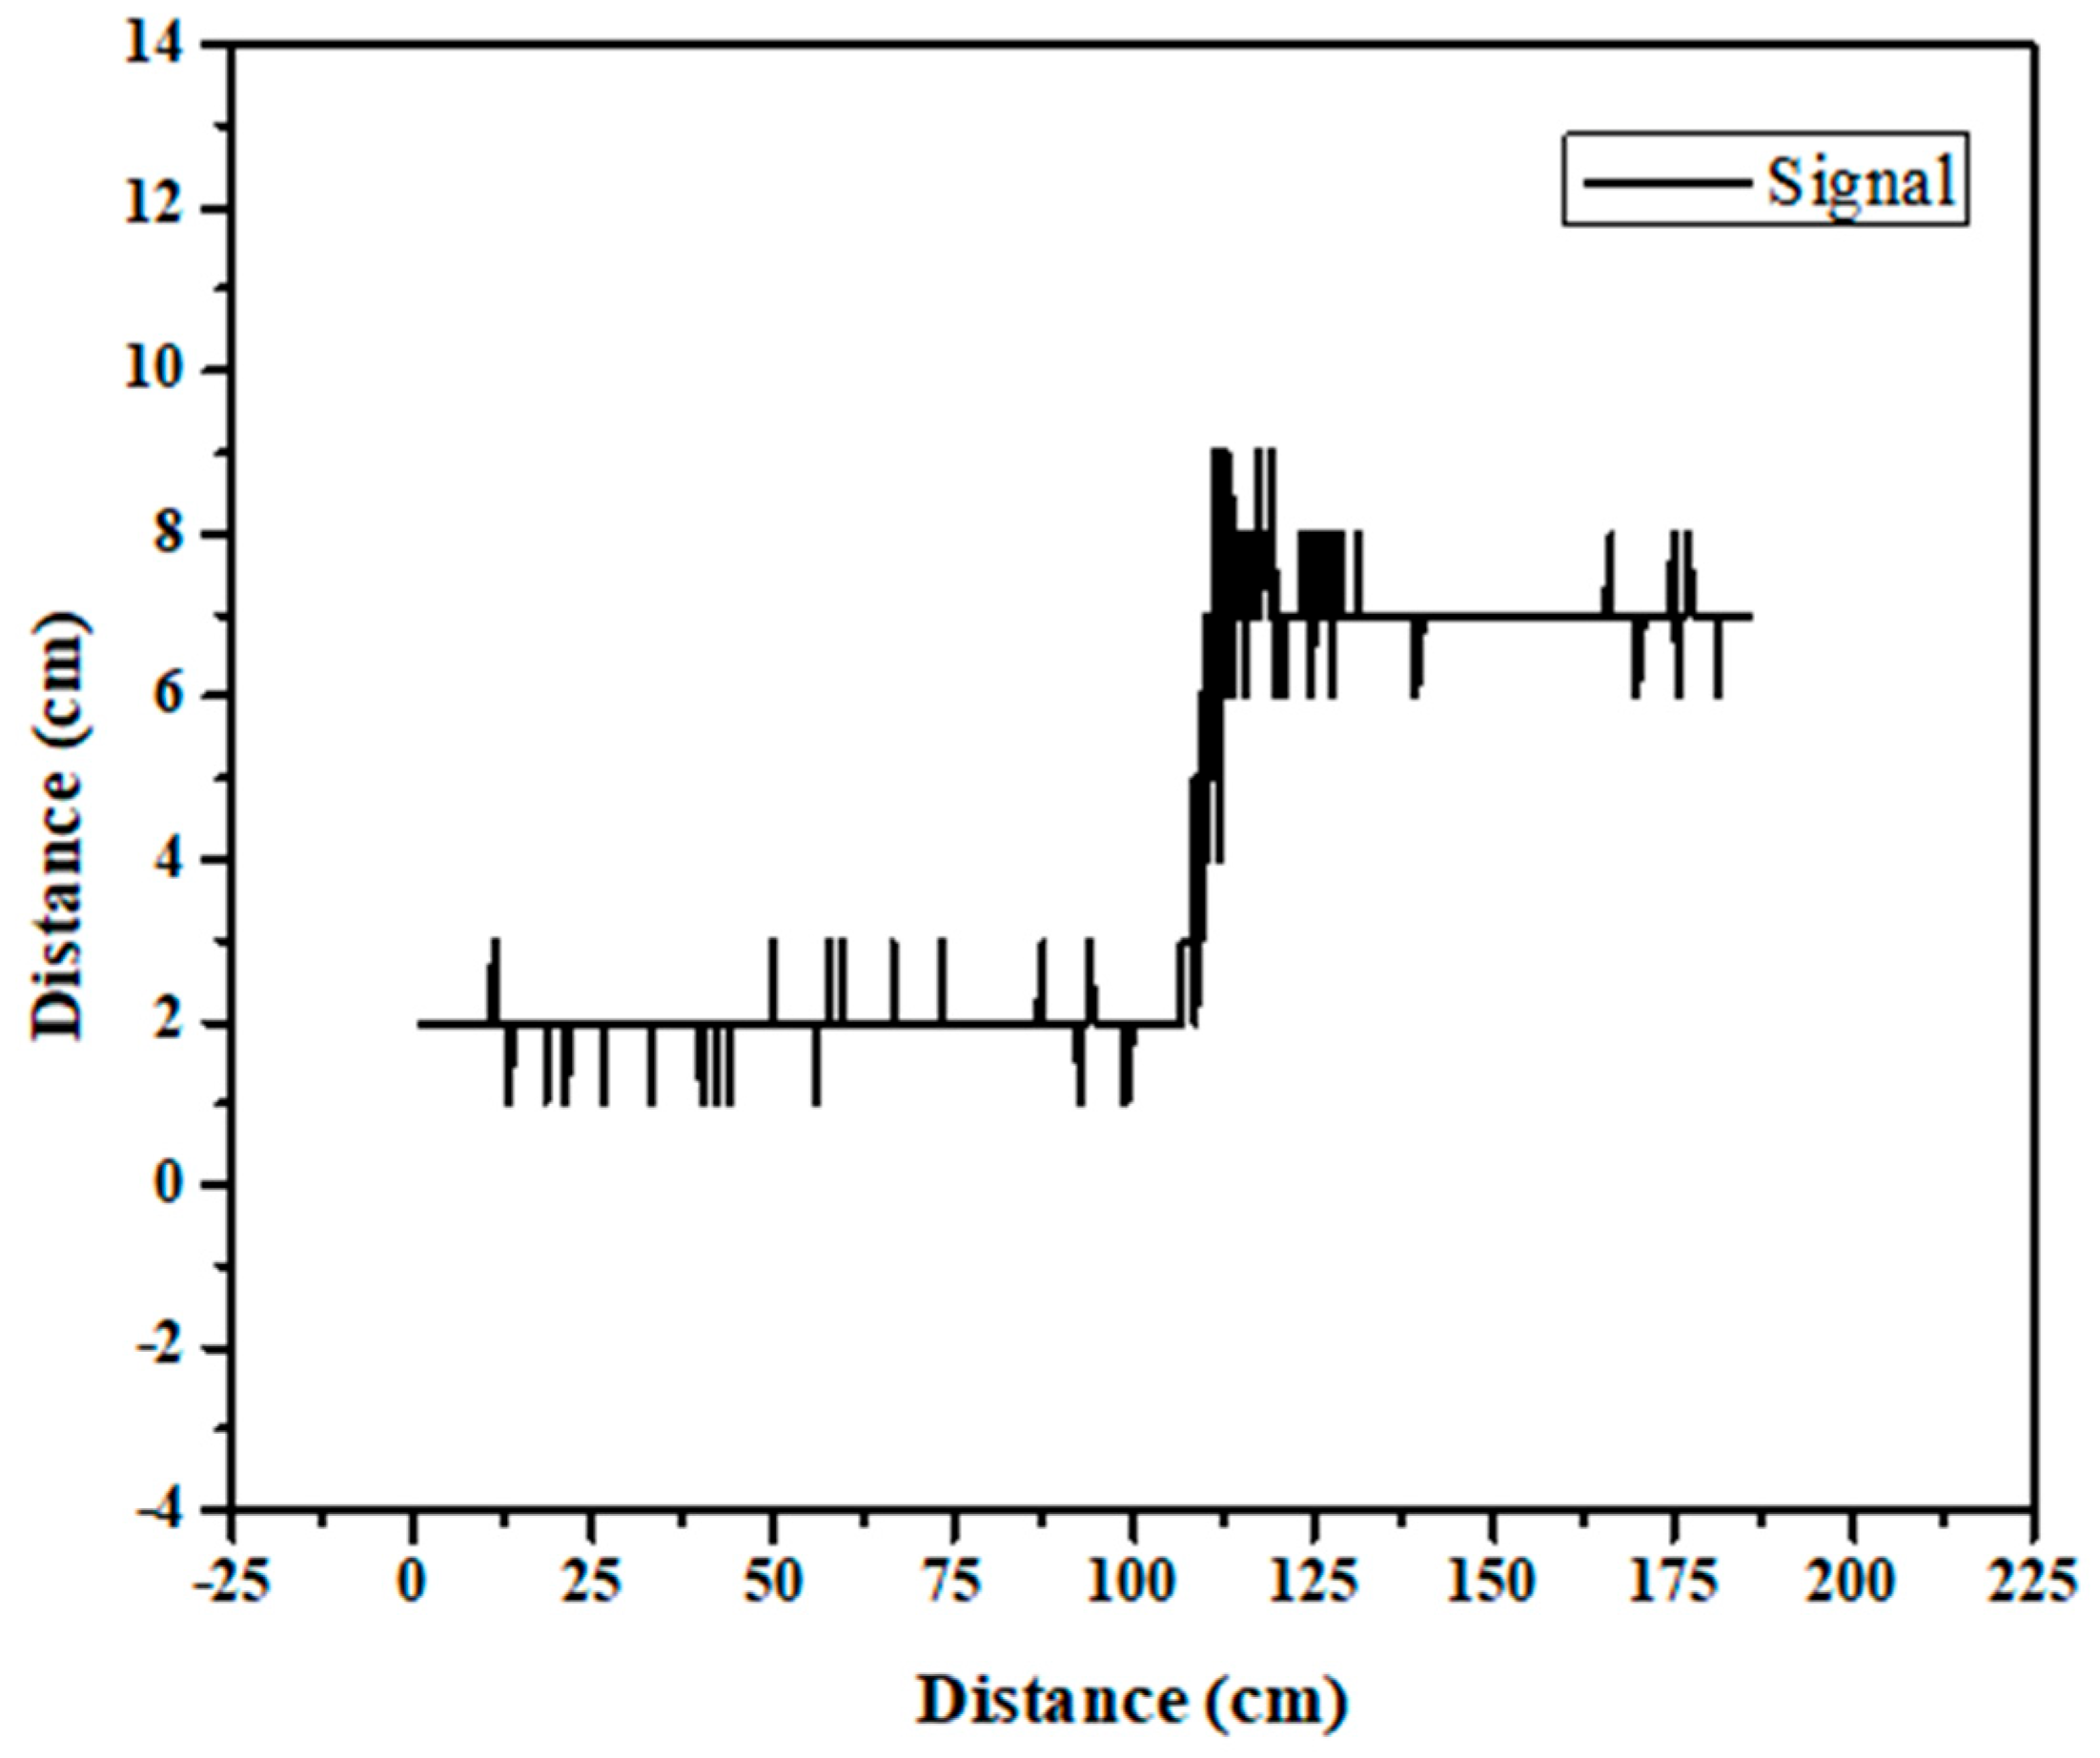
To further confirm the various pipe sizes that were analyzed in this study, an ultrasonic distance sensor was used to analyze the distance of the pipe from the sensor location on the top surface of the robot [44]. It was integrated with an Arduino microcontroller, which was used to acquire the raw data, which then were stored on a micro SD card. Figure 5 shows the ultrasonic distance sensor response to the pipe size variation. From this image, we can confirm the size of the pipe is varied. Initially, the average space between the robot is 2 cm, after reaching an axial distance of around 110 cm due to the influence of the pipe expander; the graph gradually increased with the high noise level. Later on, it reached the big pipe and achieved a stable position, with an average distance of 7 cm.

4.2. Analysis of LMA Defects in the Non-Uniform Pipe

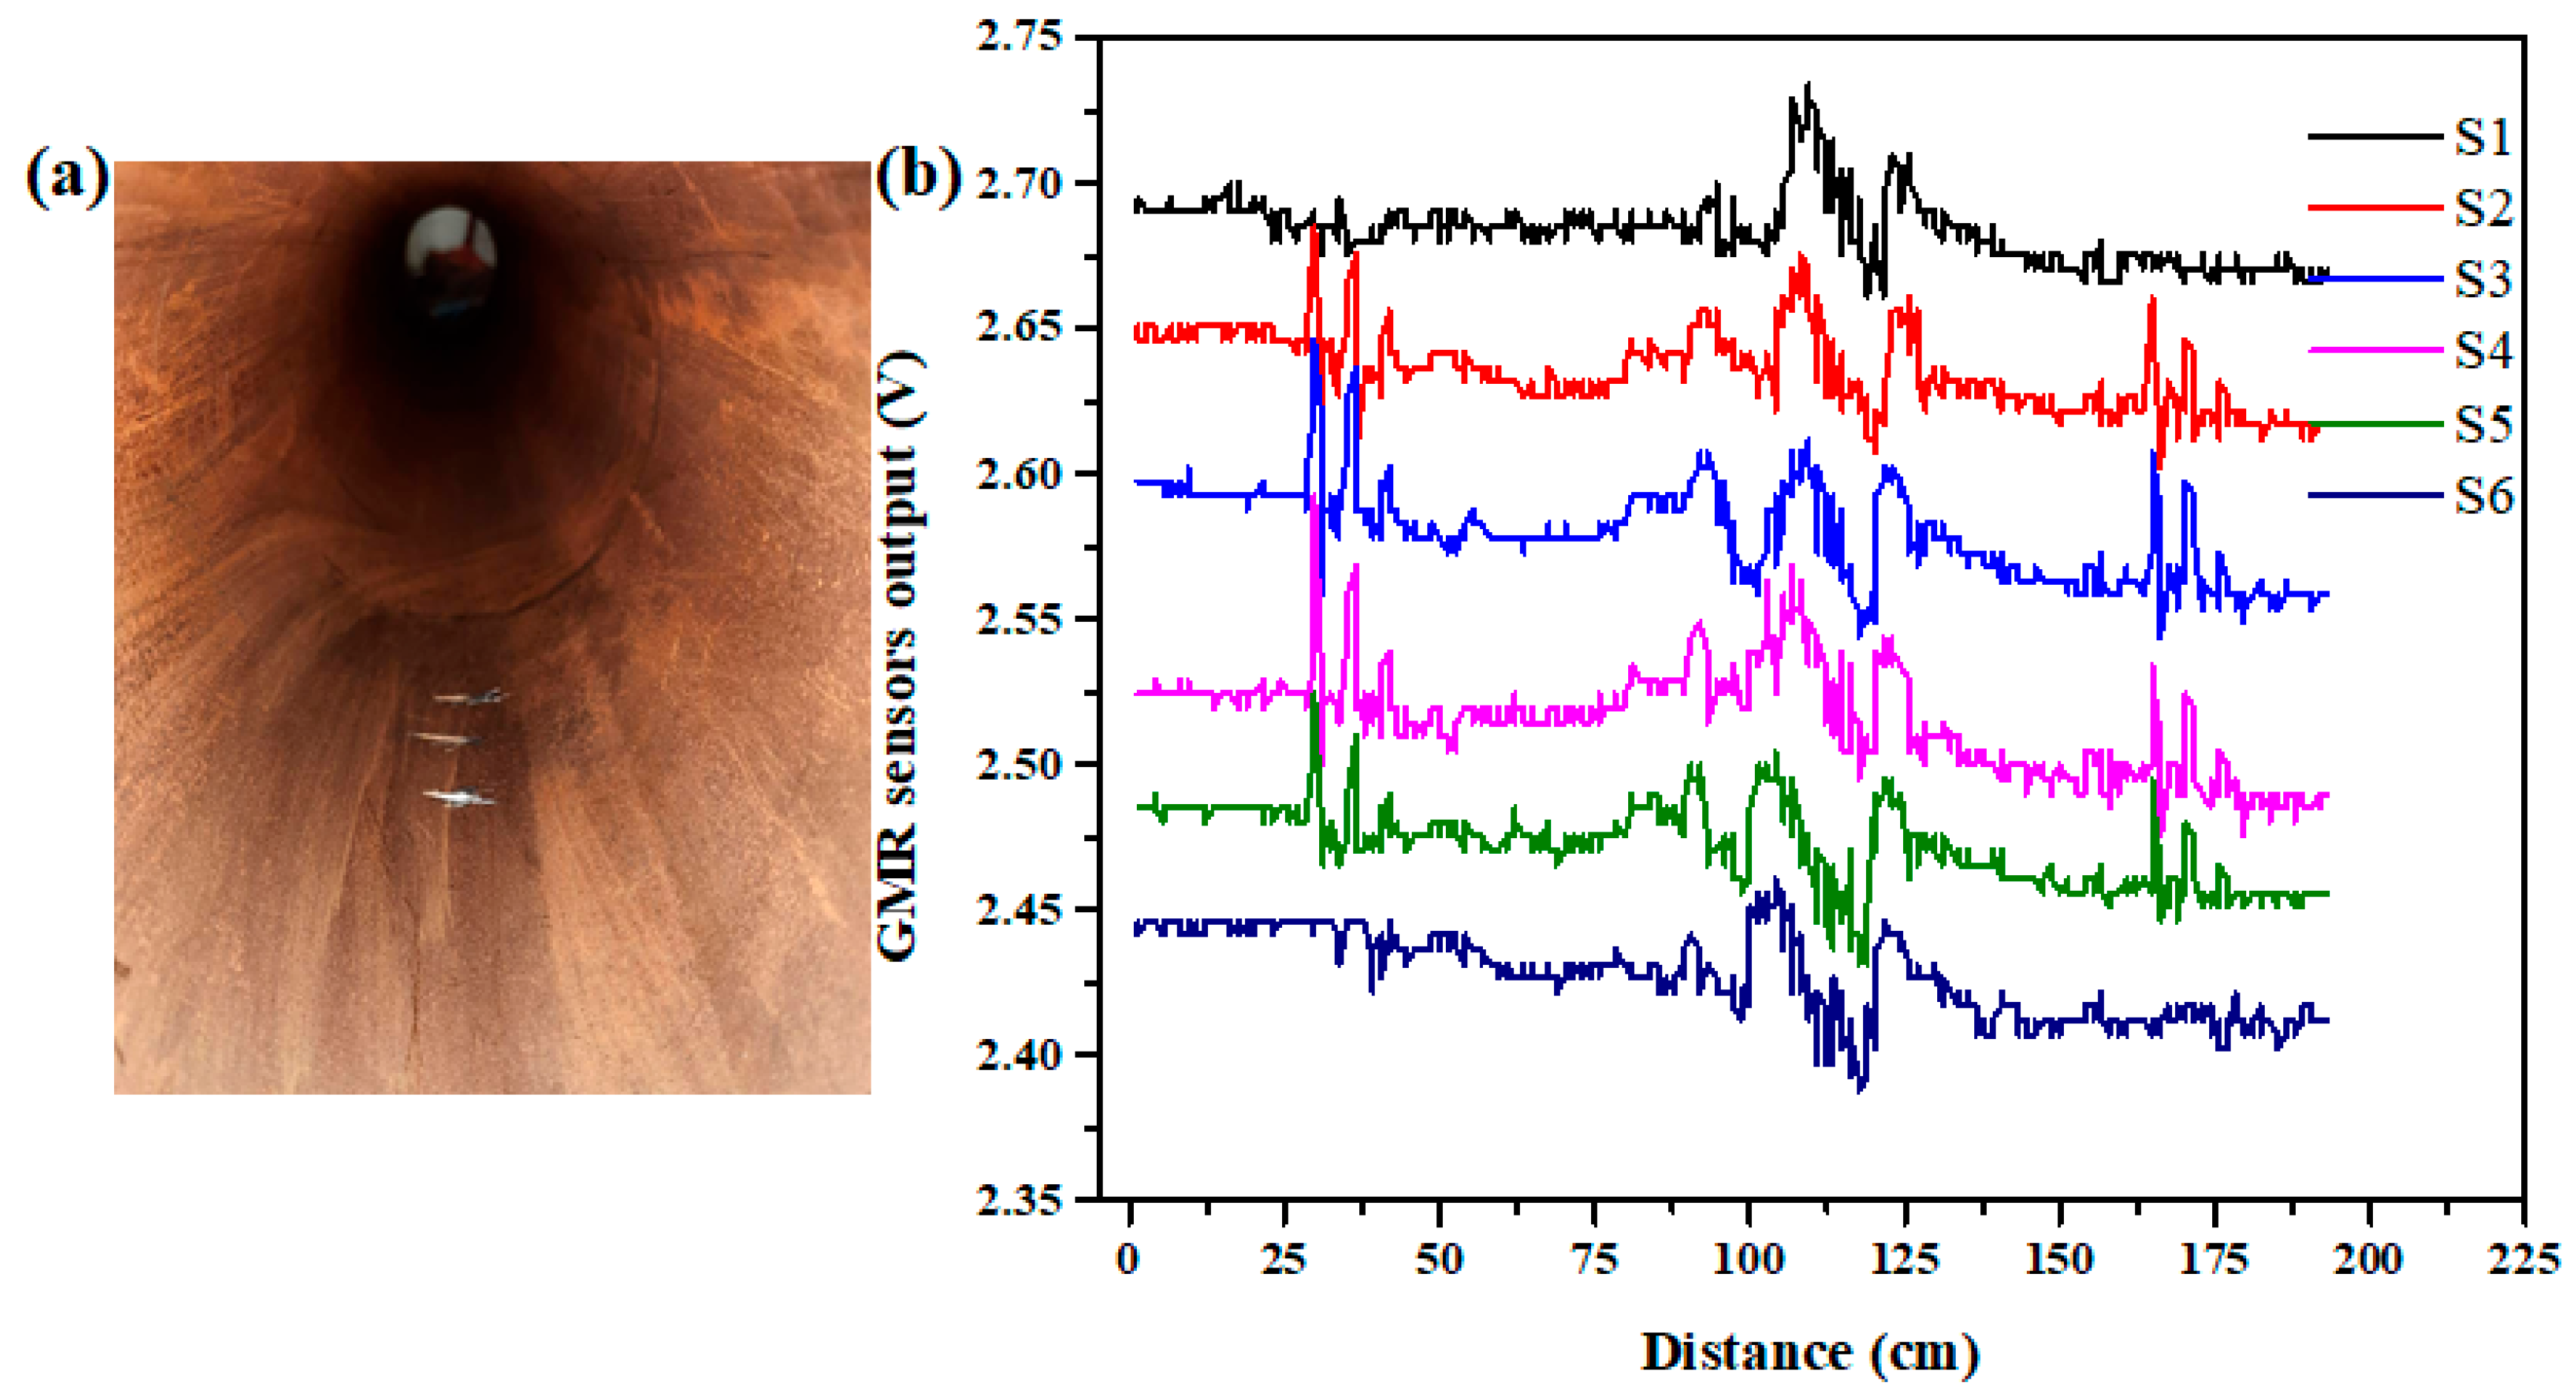
Based on the literature, the cause of the wall rupture influences the geometry of the cracks formed in the wall of the pipe, and it affects the aspects of overpressure and corrosion [2]. Figure 6 shows the artificial defects of LMA (loss of metallic cross-section area) and the GMR sensor array response to the LMA defects. To evaluate the flux leakage at different depths of an early stage of metal removal (crack), LMA defects were developed in both sizes of the pipeline by a mini hand engraver, based on a previous research study; however, the size of the LMA was reduced. The width was 2 mm and the depths of the cuts were 1 mm, 2 mm, and 4 mm, with an equal space distance of 3 cm, as shown in Figure 6a. Figure 6b explains the GMR sensor array response as a waveform graph to the three LMA defects at both pipes. Among the six GMR sensor signals, the S2, S3, S4, and S5 sensors performed well towards the defects. While the robot crosses the defects, the position of these four sensors might be closer to the defects, so these sensors performed well. In turn, the S1 and S6 sensors might be located some distance further from the defect region. Therefore, these two sensors do not perform well. Compared with the other two types of defect analysis data, the LMA type of defect was sensed by more sensors due to the defect area size. From this graph, output voltage variations were clearly measured with respect to the depth of the defects with the appropriate location. It is evident that the voltages gradually decreased based on the LMA defect depths. In particular, 6-inch pipe defects experienced the maximum flux leakage, which represents the influence of pipe thickness. This inspection was conducted axially, i.e., the sensors were crossing the defects in a perpendicular manner. As a result, MFL detection and the location of the defects were well established, as shown in Figure 6b. In addition, from this graph, we observed a strong shaking noise while crossing the girth welds at the two ends of the pipe joints, along with a pipe expander at around 90 cm to 125 cm axial distance. Then, the MFL signal of the S3 sensor for the abovementioned LMA defects was calculated and compared, with a good SNR, as shown in Table 3. In the LMA analysis, the movement and linear acceleration of the robot was observed, and the graph was similar to the through-hole analysis study.

4.3. Analysis of Uneven Multi Holes Defects in the Non-Uniform Pipe

Corrosion defects are a common type of defect in pipelines. It usually develops irregular holes of different sizes and is distributed on the internal surface of the pipeline over wide areas. It is developed by the chemical reaction between the pipe and the substances it carries [45]. Figure 7 shows the uneven multi-hole defects, which were artificially developed, and the GMR sensor array response to the defects. Figure 7a explains the uneven size of the multi-hole defects at the end of the pipeline. Figure 7b shows the GMR sensor responses corresponding to that defects; it can be inferred that sensors S2, S3, S4, and S5 have better sensitivity toward the multi-hole defects. Among these sensors, S3 and S4 sensors have a more notable sensitivity than the S2 and S5 sensors, which are located closer to the defect regions. Thus, the S1 and S6 sensors might be located a little further from the defects. Therefore, these two sensors do not perform as well as the other sensors. From this waveform graph, while crossing the 6-inch pipe with a 4.5 mm thickness, the flexible GMR sensor array experiences a slightly higher MFL reflection at the defects region when compared to the 8-inch pipe with a 6.52 mm thickness. This magnetic flux deviation is also in a similar range to the other two studies. Concludingly, the rate of flux deviation from the defect region in a 4.5 mm-thick pipe is higher than for the 6.52 mm-thick pipe. In addition, in the middle of the pipe, the GMR sensor observed strong noise reflection due to the mechanical vibration of the robot movement. Table 3 present the size parameters of the structural defects on two different pipe sizes, with the output value of the SNR. It summarizes the performance of the MFL technique with a GMR sensor for three sets of defects analyses, namely, the SNR values. Thus, the results of the SNR values of the 4.5 mm-thick pipe defects was better than for the 6.52 mm-thick pipe defects, which means that the sensors will experience a large magnetic flux reflection from a less thick metal than a thicker metal [15].
At every point of the junction, the pipeline inspection gauge observed velocity changes; as a result, a slight deviation was measured in the output graph [26]. Therefore, in this research, from all the analyses, we also observed a strong shaking noise along with jumps at around 90 cm to 125 cm in the axial distance. The static movement of the robot at the beginning and end of the pipeline inspection can be easily identified based on the acceleration and angular movement of the graph values, similar to the GMR sensor responses. When the robot reaches the pipe joint section, the sensors observed a change in angular movement and linear acceleration. As a result, significant peaks are reflected with respect to the robot movements through the pipe joint section.
Finally, based on the MFL technique with the aid of the GMR sensors, the analysis of these three sets of defects was well established in the sustainable water pipeline. Significantly, magnetic flux reflection from the axial hole, LMA defects, and uneven multi-hole analysis of the 4.5 mm-thick pipe was higher than the 6.52 mm-thick pipe magnetic flux reflection. Thus, the influence of the non-uniform thickness of the material along with defect reflection was clearly evaluated, as well as the robot motion.

5. Conclusions

In this paper, to evaluate the magnetic flux effect on non-uniform pipe thicknesses, different defect sizes were detected for the two different steel pipe thicknesses through the MFL technique with a flexible GMR sensor array. In addition, robot motion and pipe size variation were also analyzed with the use of the MPU6050 and ultrasonic distance sensors. Therefore, defects were artificially developed in both pipe sizes, such as different through-hole sizes, LMA, and uneven multi-holes. The entire pipe analysis space between the GMR sensor array and pipe surface was maintained at a 1 mm air gap. Using permanent magnets in the detection unit, continuous magnetization was achieved, more than for other magnetic techniques. As a result, the defects were clearly analyzed, with appropriate defect positions and a good SNR, without processing the signal. The SNR values of the MFL signals for the 4.5 mm-thick pipe defects were calculated from 12 to 20.8 dB, and for the 6.52 mm-thick pipe defects, from 9.5 to 19 dB. Finally, the 4.5 mm-thick pipe defects experienced a higher magnetic flux leakage than the 6.52 mm-thick pipe defects. Then, the motion of the robot during interrogation and the pipe size variation were clearly measured by the MPU6050 and the ultrasonic distance sensors. From the waveform and motion graphs, defects and robot motion were successfully indicated.

Author Contributions

Conceptualization, M.D. and H.C.; methodology, M.D. and C.-W.L.; software, M.D.; validation, M.D., P.C.-C., C.-W.L. and H.C.; resources, H.C.; data curation, P.C.-C., C.-W.L. and H.C.; writing—original draft preparation, M.D.; writing—review and editing, M.D., P.C.-C., C.-W.L. and H.C.; visualization, P.C.-C.; supervision, H.C. and C.-W.L.; project administration, H.C.; funding acquisition, H.C. All authors have read and agreed to the published version of the manuscript.

Funding

This research was supported by the Ministry of Science and Technology of Taiwan (Grant No. MOST 109-2637-E-027-009).

Institutional Review Board Statement

Not applicable.

Informed Consent Statement

Not applicable.

Data Availability Statement

The data that support the findings of this study are available on request from the corresponding author. The data are not publicly available due to privacy or ethical restrictions.

Acknowledgments

Thanks to all authors for their efforts in conducting this research.

Conflicts of Interest

The authors declare no conflict of interest.

References

  1. Yazdekhasti, S.; Piratla, K.R.; Sorber, J.; Atamturktur, S.; Khan, A.; Shukla, H. Sustainability analysis of a leakage-monitoring technique for water pipeline networks. J. Pipeline Syst. Eng. Pract. 2020, 11, 04019052. [Google Scholar] [CrossRef]
  2. Ali, S.; Hawwa, M.A.; Baroudi, U. Effect of Leak Geometry on Water Characteristics Inside Pipes. Sustainability 2022, 14, 5224. [Google Scholar] [CrossRef]
  3. Zhang, J.; Lian, Z.; Zhou, Z.; Song, Z.; Liu, M.; Yang, K. Leakage detection in a buried gas pipeline based on distributed optical fiber time-domain acoustic wave signal. Eng. Fail. Anal. 2022, 141, 106594. [Google Scholar] [CrossRef]
  4. Sekhavati, J.; Hashemabadi, S.H.; Soroush, M. Computational methods for pipeline leakage detection and localization: A review and comparative study. J. Loss Prev. Process Ind. 2022, 77, 104771. [Google Scholar] [CrossRef]
  5. Akram, M.R.; Can Zülfikar, A. Identification of Factors Influencing Sustainability of Buried Continuous Pipelines. Sustainability 2020, 12, 960. [Google Scholar] [CrossRef]
  6. Colombo, A.F.; Karney, B.W. Energy and costs of leaky pipes: Toward comprehensive picture. J. Water Resour. Plan. Manag.-ASCE 2002, 128, 441–450. [Google Scholar] [CrossRef]
  7. Zhu, J.; Collins, R.P.; Boxall, J.B.; Mills, R.S.; Dwyer-Joyce, R. Non-destructive in-situ condition assessment of plastic pipe using ultrasound. Procedia Eng. 2015, 119, 148–157. [Google Scholar] [CrossRef]
  8. Rifai, D.; Abdalla, A.N.; Razali, R.; Ali, K.; Faraj, M.A. An eddy current testing platform system for pipe defect inspection based on an optimized eddy current technique probe design. Sensors 2017, 17, 579. [Google Scholar] [CrossRef]
  9. Rodríguez-Olivares, N.A.; Cruz-Cruz, J.V.; Gómez-Hernández, A.; Hernández-Alvarado, R.; Nava-Balanzar, L.; Salgado-Jiménez, T.; Soto-Cajiga, J.A. Improvement of ultrasonic pulse generator for automatic pipeline inspection. Sensors 2018, 18, 2950. [Google Scholar] [CrossRef]
  10. Prakash, S.; Sharma, B.K.; Prakash, C.; Saini, S.; Sharma, A. Investigation of the Criticality of Flux Leakage of a Magnetizer Assembly of a MFL Tool for Oil and Gas Pipelines Inspection. In Advances in Production and Industrial Engineering; Springer: Singapore, 2021; pp. 323–333. [Google Scholar] [CrossRef]
  11. Ma, Q.; Tian, G.; Zeng, Y.; Li, R.; Song, H.; Wang, Z.; Gao, B.; Zeng, K. Pipeline in-line inspection method, instrumentation and data management. Sensors 2021, 21, 3862. [Google Scholar] [CrossRef]
  12. Coramik, M.; Ege, Y. Discontinuity inspection in pipelines: A comparison review. Measurement 2017, 111, 359–373. [Google Scholar] [CrossRef]
  13. Gupta, M.; Khan, M.A.; Butola, R.; Singari, R.M. Advances in applications of Non-Destructive Testing (NDT): A review. Adv. Mater. Process. Technol. 2021, 1–22. [Google Scholar] [CrossRef]
  14. Mostafapour, A.; Davoudi, S. Analysis of leakage in high pressure pipe using acoustic emission method. Appl. Acoust. 2013, 74, 335–342. [Google Scholar] [CrossRef]
  15. Zhang, Y.; Yan, G. Detection of gas pipe wall thickness based on electromagnetic flux leakage. Russ. J. Nondestr. Test. 2007, 43, 123–132. [Google Scholar] [CrossRef]
  16. Peng, X.; Anyaoha, U.; Liu, Z.; Tsukada, K. Analysis of magnetic-flux leakage (MFL) data for pipeline corrosion assessment. IEEE Trans. Magn. 2020, 56, 1–15. [Google Scholar] [CrossRef]
  17. Durai, M.; Lin, Z.-Q.; Lan, C.-W.; Chang, H.; Peng, C.-C. Study of Defects in the Petrochemical Storage Tank Floor using the Magnetic Flux Leakage (MFL) Technique. J. Fail. Anal. Prev. 2022, 22, 807–814. [Google Scholar] [CrossRef]
  18. Chen, L.; Que, P.-W.; Jin, T. A giant-magnetoresistance sensor for magnetic-flux-leakage nondestructive testing of a pipeline. Russ. J. Nondestr. Test. 2005, 41, 462–465. [Google Scholar] [CrossRef]
  19. Wu, D.; Liu, Z.; Wang, X.; Su, L. Composite magnetic flux leakage detection method for pipelines using alternating magnetic field excitation. NDTE Int. 2017, 91, 148–155. [Google Scholar] [CrossRef]
  20. Le, M.; Lee, J.; Jun, J.; Kim, J.; Moh, S.; Shin, K. Hall sensor array based validation of estimation of crack size in metals using magnetic dipole models. NDTE Int. 2013, 53, 18–25. [Google Scholar] [CrossRef]
  21. Gao, Y.; Tian, G.Y.; Li, K.; Ji, J.; Wang, P.; Wang, H. Multiple cracks detection and visualization using magnetic flux leakage and eddy current pulsed thermography. Sens. Actuators A 2015, 234, 269–281. [Google Scholar] [CrossRef]
  22. Li, Z.; Jarvis, R.; Nagy, P.B.; Dixon, S.; Cawley, P. Experimental and simulation methods to study the Magnetic Tomography Method (MTM) for pipe defect detection. NDTE Int. 2017, 92, 59–66. [Google Scholar] [CrossRef]
  23. Tehranchi, M.M.; Ranjbaran, M.; Eftekhari, H. Double core giant magneto-impedance sensors for the inspection of magnetic flux leakage from metal surface cracks. Sens. Actuators A 2011, 170, 55–61. [Google Scholar] [CrossRef]
  24. Park, J.; Park, J.; Song, S.; Kishore, M.; Kwon, S.; Kim, H. Enhanced detection of defects using GMR sensor based remote field eddy current technique. J. Magn. 2017, 22, 531–538. [Google Scholar] [CrossRef]
  25. Cubells-Beltrán, M.-D.; Reig, C.; Madrenas, J.; De Marcellis, A.; Santos, J.; Cardoso, S.; Freitas, P.P. Integration of GMR sensors with different technologies. Sensors 2016, 16, 939. [Google Scholar] [CrossRef]
  26. Botros, K.; Golshan, H. Field validation of a dynamic model for an MFL ILI tool in gas pipelines. In Proceedings of the International Pipeline Conference, Calgary, AB, Canada, 1 January 2010; pp. 325–336. [Google Scholar]
  27. Henry, R.; Chablat, D.; Porez, M.; Boyer, F.; Kanaan, D. Multi-objective design optimization of the leg mechanism for a piping inspection robot. In Proceedings of the International Design Engineering Technical Conferences and Computers and Information in Engineering Conference, Buffalo, NY, USA, 17 August 2014; p. V05AT08A001. [Google Scholar]
  28. Chablat, D.; Venkateswaran, S.; Boyer, F. Mechanical design optimization of a piping inspection robot. Procedia Cirp 2018, 70, 307–312. [Google Scholar] [CrossRef]
  29. Verma, A.; Kaiwart, A.; Dubey, N.D.; Naseer, F.; Pradhan, S. A review on various types of in-pipe inspection robot. Mater. Today Proc. 2022, 50, 1425–1434. [Google Scholar] [CrossRef]
  30. Kikuchi, H.; Sato, K.; Shimizu, I.; Kamada, Y.; Kobayashi, S. Feasibility study of application of MFL to monitoring of wall thinning under reinforcing plates in nuclear power plants. IEEE Trans. Magn. 2011, 47, 3963–3966. [Google Scholar] [CrossRef]
  31. Kikuchi, H.; Shimizu, I.; Ara, K.; Kamada, Y.; Kobayashi, S. Applicability of magnetic flux leakage method for wall thinning monitoring in nuclear power plants. In Electromagnetic Nondestructive Evaluation (XIV); IOS Press: Amsterdam, The Netherlands, 2011; Volume 35, pp. 275–281. [Google Scholar] [CrossRef]
  32. Pelkner, M.; Pohl, R.; Kreutzbruck, M.; Commandeur, C. Development of adapted GMR-probes for automated detection of hidden defects in thin steel sheets. AIP Conf. Proc. 2016, 1706, 020018. [Google Scholar] [CrossRef] [Green Version]
  33. Piao, G.; Guo, J.; Hu, T.; Leung, H. The effect of motion-induced eddy current on high-speed magnetic flux leakage (MFL) inspection for thick-wall steel pipe. Res. Nondestruct. Eval. 2020, 31, 48–67. [Google Scholar] [CrossRef]
  34. Singh, W.S.; Rao, B.; Mukhopadhyay, C.; Jayakumar, T. Finite element model-based approach for magnetic flux leakage testing of steel plates using 2D tandem GMR array sensors. Insight-Non-Destr. Test. Cond. Monit. 2014, 56, 683–690. [Google Scholar] [CrossRef]
  35. Singh, W.S.; Rao, B.P.; Mukhopadhyay, C.; Jayakumar, T. Detection of localized damage in water wall tubes of thermal power plants using GMR sensor array based magnetic flux leakage technique. J. Nondestruct Eval. 2015, 34, 1–7. [Google Scholar] [CrossRef]
  36. Ma, Y.; He, R.; Chen, J. A method for improving SNR of drill pipe leakage flux testing signals by means of magnetic concentrating effect. IEEE Trans. Magn. 2015, 51, 1–7. [Google Scholar] [CrossRef]
  37. Vértesy, G.; Gasparics, A.; Tomáš, I. Inspection of local wall thinning by different magnetic methods. J. Nondestruct. Eval. 2018, 37, 1–8. [Google Scholar] [CrossRef]
  38. Durai, M.; Lan, C.-W.; Chang, H. In-line detection of defects in steel pipes using flexible GMR sensor array. J. King Saud Univ. Sci. 2022, 34, 101761. [Google Scholar] [CrossRef]
  39. Singh, W.S.; Rao, B.; Sasi, B.; Vaidyanathan, S.; Jayakumar, T.; Raj, B. Giant Magneto-Resistive (GMR) Sensors for Non-Destructive Detection of Magnetic Flux Leakage from Sub-Surface Defects in Steels. In Proceedings of the International Conference on Sensors and Related Networks (SENNET-2009), VIT University, Vellore, India, 1 December 2009; Available online: https://www.researchgate.net/publication/258997959 (accessed on 15 September 2022).
  40. Tymrak, B.; Kreiger, M.; Pearce, J.M. Mechanical properties of components fabricated with open-source 3-D printers under realistic environmental conditions. Mater. Des. 2014, 58, 242–246. [Google Scholar] [CrossRef]
  41. Kreutzbruck, M.; Neubauer, A.; Pelkner, M.; Reimund, V. Adapted gmr array used in magnetic flux leakage inspection. In Proceedings of the 18th World Conference on Nondestructive Testing, Durban, South Africa, 16–20 April 2012; Available online: http://www.ndt.net/article/wcndt2012/papers/498_wcndtfinal00498.pdf (accessed on 15 September 2022).
  42. Liu, Z.; Ren, L. Shaking Noise Exploration and Elimination for Detecting Local Flaws of Steel Wire Ropes Based on Magnetic Flux Leakages. IEEE Trans. Ind. Electron. 2022. [Google Scholar] [CrossRef]
  43. Fedorov, D.; Ivoilov, A.Y.; Zhmud, V.; Trubin, V. Using of measuring system MPU6050 for the determination of the angular velocities and linear accelerations. Autom. Softw. Enginery 2015, 11, 75–80. [Google Scholar]
  44. Liu, Z.; Kang, Y.; Wu, X.; Yang, S. Study on local magnetization of magnetic flux leakage testing for storage tank floors. Insight 2003, 45, 328–331. [Google Scholar] [CrossRef]
  45. Meriem-Benziane, M.; Bou-Saïd, B.; Boudouani, N. The effect of crude oil in the pipeline corrosion by the naphthenic acid and the sulfur: A numerical approach. J. Pet. Sci. Eng. 2017, 158, 672–679. [Google Scholar] [CrossRef]
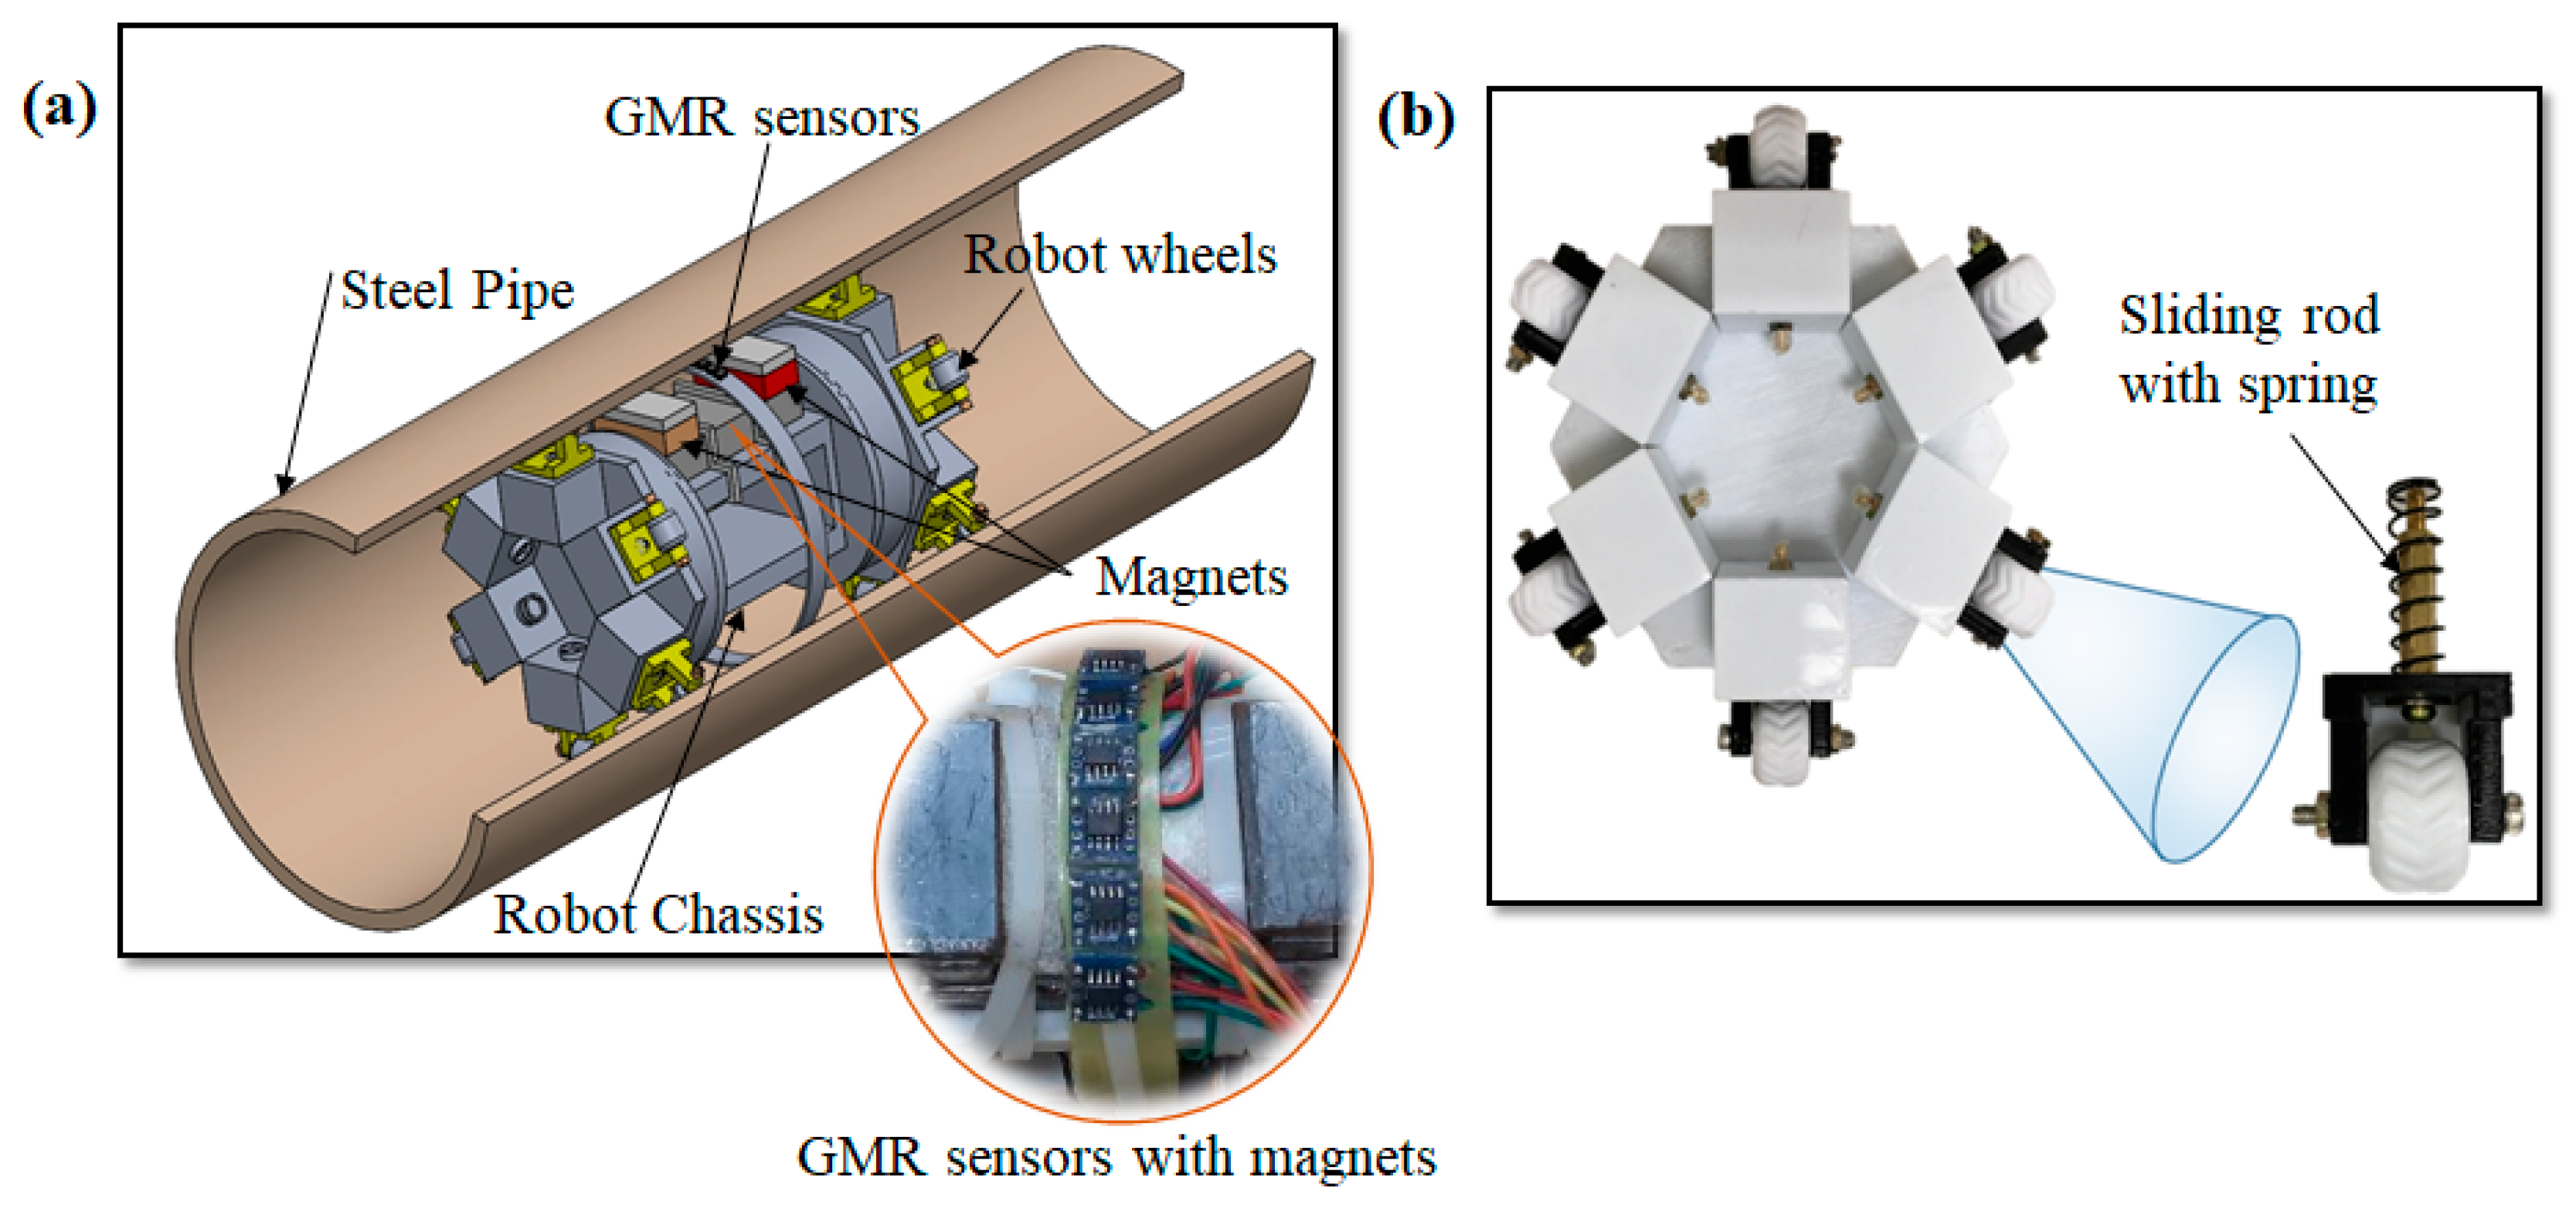
Figure 1. Robot configurations: (a) 3D solid modeling of the robot inspection in the pipe; (b) auxiliary wall pressure model of the robot wheel sets.
Sustainability 14 11853 g001
Figure 2. Proposed in-line inspection robot.
Sustainability 14 11853 g002
Figure 3. (a) Various sizes of the axial through-hole defects: 6, 4, and 2 mm in diameter; and (b) the GMR sensors’ response to the various sizes of the axial through-hole defects.
Sustainability 14 11853 g003
Figure 4. (a) Robot angular movement; and (b) linear acceleration.
Sustainability 14 11853 g004
Figure 5. Ultrasonic distance sensor response to the different pipe sizes.
Sustainability 14 11853 g005
Figure 6. (a) LMA defects; and (b) GMR sensor responses to the LMA defects.
Sustainability 14 11853 g006
Figure 7. (a) Uneven multi-hole defects; and (b) the GMR sensors’ responses to the uneven multi-hole defects.
Sustainability 14 11853 g007
Table 2. Structural parameters of the robot model.
SpecificationsValues
Length of the detection unit200 mm
Length of the power unit200 mm
Diameter of chassis130 mm
Chassis size85 × 65 mm
Full length of pipe1900 mm
Internal diameter of 6-inch pipe159.3 mm
Internal Diameter of 8-inch pipe206.0 mm
Detection wheels diameter13 mm
Number of supporting wheels
for detection unit
12
Alignment of supporting wheels60°
Length of spring30 mm
Spring diameter7 mm
Sliding rod length30 mm
Sliding rod diameter5 mm
Yoke size80 × 40 × 14 mm
Magnets size40 × 20 × 10 mm
Magnetic brushes40 × 20 × 5 mm
Lift of distance1 mm
Motor wheel diameter65 mm
Spacing between GMR sensors10 mm
Table 3. Size parameters of the pipe wall thickness and structural defects, with the SNR.
Defects TypeDefect Size (mm)SNR (dB)
4.5 mm-Thick Pipe6.52 mm-Thick Pipe
Different sizes of the through holes2 mm diameter12.19.5
4 mm diameter15.612.0
6 mm diameter16.913.9
Loss of metallic cross-section (LMA)1 mm depth12.09.5
2 mm depth19.016.9
4 mm depth20.819.0
Uneven multi holes6 mm diameter13.912.0
6 mm diameter16.913.9
6 mm diameter13.912.0
Publisher’s Note: MDPI stays neutral with regard to jurisdictional claims in published maps and institutional affiliations.