Article

Were the Higher Education Institutions Prepared for the Challenge of Online Learning? Students’ Satisfaction Survey in the Aftermath of the COVID-19 Pandemic Outbreak

Institute of Economics and Finance, Warsaw University of Life Sciences, 02-787 Warsaw, Poland
*
Author to whom correspondence should be addressed.
Sustainability 2022, 14(19), 11813; https://doi.org/10.3390/su141911813
Submission received: 18 August 2022 / Revised: 7 September 2022 / Accepted: 15 September 2022 / Published: 20 September 2022
(This article belongs to the Special Issue Economic and Social Consequences of the COVID-19 Pandemic)

Abstract

:
The main purpose of the paper is to evaluate the online teaching process at universities, and detect shortages and gaps in online learning in the aftermath of the COVID-19 pandemic outbreak. The research results are the initial steps leading to the development of a guide and online open access tools supporting academic teachers in the efficient use of an online didactic process, which will be used broadly. The specific objectives are to identify differences in the assessment of online learning among students from different EU countries, to identify differences between face-to-face and online learning among students from the countries surveyed, to assess the attractiveness of online teaching to students in selected EU countries, and to determine the assessment of the preparation of university teachers for online teaching in the countries surveyed. Using a purposive selection method, five EU countries, i.e., Bulgaria, Greece, Italy, Poland, and Sweden, were selected for the study. The study is based on questionnaires. The survey was conducted among 809 student respondents representing the five countries. The study was carried out in 2021 and the research period was 2020–2021 (before and after pandemic restrictions). It was found that students evaluate online courses much better in countries/universities with a long tradition in online teaching and usage of interactive platforms, than in those without them. Students generally evaluated in-person learning better than online learning, and their evaluation depended on their previous experience of online learning. The degree of preparation for the online courses is strongly correlated with the overall evaluation of these courses. The attractiveness of the online courses is strongly conditioned by the content of engaging, involving and stimulating elements. There is the need for the development of interactive tools and training for teachers, which will increase the attractiveness of online classes for students.

1. Introduction

1.1. The Importance of Education for Society

Education is obviously a boon to human life. It should not just be a concept of learning. Basically, it should provide values that are imparted to every student and naturally value-based education is very valid if we want to have good citizens [1]. Education not only gives us a platform to succeed, but also knowledge of social behavior [2], but also gives us knowledge of the world around us and turns it into something better. It develops our perspective on life and helps us build opinions and viewpoints on different things in life [3]. Education is a necessity for everyone living in the world, it teaches many things like manners, rules and regulations of life, etc. [4], brings us the confidence which helps us to get through all the difficulties that arise on the way to our goal, and as such, an educated person is more likely to have a happy life. Education also makes us better at communicating with others [5], and awakens the secret talents and skills of the person in question. These hidden talents and skills give us the ability to work and a completely safe future. This is education that helps us to reach new heights in our lives, helps people develop as individuals [6] and builds skills, e.g., social skills, problem-solving competences, decision-making skills and creative thinking competences. It introduces people to other cultures, religions and thought operations. Education also gives a springboard to the real world, offering a variety of courses on topics such as finances, life planning and personal development [7]. Education is a process, through which people can give value to others. It can be an activity that can take place in any organization, during which individuals are assisted by other people who may be older, authority figures or more experienced people [8]. The Didactic process can take place at home, in schools, colleges, universities, prisons and voluntary youth organizations [9]. There are two main approaches to values in education. Some define education as the inculcation or transmission of a set of values, which are often derived from social or religious rules or cultural ethics. Others see it as progressively leading to good behavior for oneself and one’s community [10].
Educational institutions should focus on imparting knowledge, skills and value-based education to students in order to benefit the youth, who are the future of society. The wealth of a country is judged by the number and proportion of resourceful people living in the country more than by material wealth [11]. Education promotes effective learning and provides the basis for continuous personal, social, moral and economic improvement. It is an investment in individual capability and responsibility for oneself and its product, and therefore represents a significant value to society [12,13,14,15].

1.2. COVID-19 Globally and in the Countries Studied

COVID-19 is designated an acute respiratory infectious disease that results from infection with SARS-CoV-2 virus [16]. It was first recognized and described in December 2019 in central China, in the city of Wuhan, Hubei province [17,18,19,20]. The disease has spread very rapidly beyond China’s borders to virtually all countries in the world. The World Health Organization (WHO) on 11 March 2020 described the series of COVID-19 cases occurring from December 2019 as a pandemic. At that time, 118,000 cases of infection were confirmed in 114 countries and 4291 lives were lost [21]. Globally, there were variations in the pace and course of the pandemic. By 29 July 2022, there were 571 million confirmed cases of infection worldwide and 6.4 million lives had been lost. Europe accounted for 240 million infections and 2 million deaths. The statistics for the countries studied are also worth presenting. The proportion of deaths due to COVID-19 in the total population since the beginning of the epidemic ranged from 0.18% in Sweden, 0.29% in Italy and Greece, 0.31% in Poland to 0.54% in Bulgaria. The scale of the pandemic varied in each country [22]. Therefore, restrictions were introduced in many countries and certain activities were officially prohibited. The pandemic had a major impact on the economy and social life. Scenarios of fighting with the epidemic varied from country to country [23].

1.3. The Impact of COVID-19 on Business and Social Life

The impact of the COVID-19 pandemic on the economy and social life is varied. In the case of the economy, this mostly depended on the type of activity. An important factor was the lack of personal contact. Three main channels of transmission of the pandemic on the economy can be distinguished. The first channel had a direct impact and meant a reduction in the consumption of goods and services. This was caused by lockdowns and the need to maintain social distancing by staying at home. The second channel has an indirect influence on the economy. It concerned shocks in the financial markets and their influence on the real economy. Household wealth was assumed to fall, while savings increased and consumption spending was further reduced. The third channel concerned supply-side disruptions. Constraints occurring halted or impeded production activities, negatively impacted supply chains, labor demand, and employment [24,25].
The collapse of supply chains had cascading effects on many activities. This was caused by a very high degree of interconnectedness and specialization of production activities [26,27]. In addition, circular flows were created in the pandemic. During the pandemic, demand for services requiring direct interaction, such as hotels, restaurants and retail, decreased significantly. On the other hand, demand increased for services that can be provided remotely or that do not require face-to-face relations, such as information and communication technology (ICT) [28]. The degree of change in demand varied according to the restrictions imposed by different governments [29]. For example, in Canada, short-run production of furniture, transport equipment, printing, petroleum, chemicals and plastics, non-metallic minerals, and computers, electronics and electricals declined during the pandemic. Growth was in food and beverage and paper production. In wholesale trade, the distribution of all virtually tangible products decreased. Retail sales also declined in all sectors, with the only exception being food and beverage sales [30]. In Korea, restrictions and limitations were not strong, but there were declines in all sectors, including food sales. Korea was an import and export-oriented country for goods and services, so the impact of the pandemic was high. The examples provided show that the economic consequences of the pandemic differed in each country [31]. In fact, all over the world, there were close correlations between the situation of passenger air transport and the rate of disease increase. The increase in disease caused the implementation of new restrictions and the reduction in travel [32,33,34].
The impact of the pandemic on social life is extensive and has far-reaching consequences. In addition to economic aspects, social and health aspects are also important [35]. Social aspects include: the inability to use many services; the annulment or postponement of large-scale sporting events; the avoidance and barring of national and international journeys and the cancellation of services; problems and disruptions in the celebration of cultural, religious and grand events [36]; the phenomenon of stress and depression among the population; the need to maintain social distance with peers and family members [37]; the inability to use the services of hotels, restaurants and places of worship [38]; the closure of all entertainment venues such as cinemas and theatres, gymnasiums, sports clubs, swimming pools [39]; the postponement of stationary examinations and the implementation of remote learning [40]. The health consequences for society were also key. These were mainly: high health and life risks as a result of contracting coronavirus; inability to access medical services; postponement of previously scheduled surgeries and procedures. The stated constraints necessitated spending a lot of time at home. Activities related to work and education were also moved home.

1.4. The Functioning of Higher Education during the Pandemia

Maintaining social distance has necessitated a change from classroom to online learning. Digital learning was the only alternative platform for continuing higher education at the time of COVID-19 [41]. Individual countries differed in methods. In Hong Kong, for example, mass lectures and events were cancelled in the first instance. Within two weeks, most university offices were closed, as well as libraries, study rooms, canteens and sports facilities [42]. The patterns were the same in most countries, only staggered differently due to the variation in the severity of the pandemic [43]. Student education was moved to a virtual environment. Classes were online and most of the conversations took place via chat rooms [44]. Researchers and students communicated on tiny screens with the use of webcams. Free webcams were provided for staff, but students used their own computers. Most had laptops, but some only used desktop computers without cameras [45]. COVID-19 forced teachers and students to participate in live streamed classes, which was not always properly prepared [46]. In the early stages, remote learning meant sharing PowerPoint files and streaming lectures. This way of teaching was ineffective as it did not involve interaction [47]. Online learning was an innovative social process that became a substitute for the usual ‘face-to-face’ classes. It was initially seen as a substitute process [48]. In the first stage of remote learning, it was observed that the most important problem was the lack of or insufficient infrastructure for online teaching. In addition, teachers were inexperienced in working this way, and this in turn affected the quality of education [49]. Teachers were trained very quickly, which solved some problems. In addition, courses for online classes in individual subjects had to be prepared very quickly [50].
In general, five obstacles to the digital evolution of higher education institutions can be identified. These are change (the need for change), speed of transformation and speed of implementation, technology (hardware and software provision), competence (of staff, lecturers and students) and funding (equipment, trainings etc.) [51]. E-learning, or online learning, is just one of several features of the digital evolution of higher education institutions. Online learning refers to the educational use of technological devices, accessories and the Internet [52]. Some researchers have called online education during COVID-19 emergency remote learning. This approach somehow undermines the quality and effectiveness of online learning [53]. Some point out the lack of a careful, detailed process in the design and development of online education. This provides a basis for dismissing contemporary online education during COVID-19 as effective online education, but rather as emergency education [54,55].
Reports and studies conducted in many countries around the world show that there was no single model for online teaching. Different platforms and resources of communication were used. For example, synchronous and asynchronous video lectures were used at different levels of education [56]. Real-time video conferencing was the most common, using such tools as Microsoft Teams, or Zoom, for example. This was followed by the use of asynchronous constructions such as sending presentations to listeners, video recording and written communication via forums and chat rooms [57]. The variety of ways and methods of teaching during the pandemic posed a problem for students and teachers. Some teachers with poor IT skills found it difficult to prepare and deliver online classes [58]. In the following months, these teachers developed their digital competences as they were forced to do so by the ongoing pandemic. Indeed, remote learning was extended for months afterwards [59]. It became a challenge for universities to ensure high quality teaching. In order to achieve this goal, universities had to counteract academic dishonesty [60] and promote good practices in terms of teaching, to gain satisfaction in student assessment, and provide access to necessary materials [61].

1.5. Justification, Aims and Structure of the Article

The theme of the paper is valid, important and up to date. Over the past two years, with the COVID-19 pandemic outbreak, schools and universities have experienced a sudden shift from the need to switch from classroom-based lessons to an online system. The rapidity of this change meant that teachers did not have time to prepare well for e-learning classes and were not well trained in the techniques and tools they could apply. It resulted in low quality lectures, boring exercises, and poor contact with the teacher. Of course, the results in this respect can vary from country to country and depend on the individual university. There are many factors that influence this phenomenon, such as the scale of the severity of the pandemic and the restrictions associated with it, the scale of university closures and abandonment of full-time classes (whether total abandonment or partial abandonment). In addition, previous experiences of countries in this regard are important. It is also necessary to bear in mind the specifics related to the characteristics of society, the ability to learn new skills, coping with stress, lifestyle and many other factors. In fact, it is impossible to study all factors. Many studies have already been made on the remote learning experience, however, those were most often single-country studies. It is less common to find studies on several countries sharing their experiences. In our study, we analyzed remote learning in five EU member states with a different degree of previous experiences in online learning. Europe was the most affected by the pandemic. In addition, the countries selected for analysis differ in many respects. Therefore, this type of comparison will be very interesting and may fill the research gap regarding the differences in the evaluation of distance education in higher education institutions in Europe during the pandemic. The research results are the initial steps leading to the development of a book guide and online open access tools supporting academic teachers in how to efficiently conduct the online didactic process.
The main purpose of the paper is to evaluate the online teaching process at universities, and detect shortages and gaps in online learning in the aftermath of the COVID-19 pandemic outbreak.
The specific objectives are:
  • To identify differences in the evaluation of online learning among students from different EU countries;
  • To identify differences between face-to-face and online learning among students from the countries surveyed in regard to the subject taught;
  • Assessing the attractiveness of online student activities in selected EU countries;
  • To determine the assessment of academic teachers’ preparation for online classes in the countries surveyed.
The paper formulates the following research questions:
  • What was the level of student satisfaction with online classes in different EU countries? It is important to compare and choose which countries were better in delivering;
  • What difficulties did students encounter when engaging in e-learning in the surveyed countries?
  • What were the most interesting and effective parts of e-learning activities in different EU countries? The chosen best practices could be transferred or spread out to other countries;
  • What would students do differently to increase the effectiveness of online classes, given the diversity of the countries surveyed?
  • What would be more motivating for students to learn online in selected EU countries?
The organization of the work is as follows: Section 1 provides an introduction to the topic. The importance of education for society and the course of the pandemic, both worldwide and in the countries studied, are presented. The impact of COVID-19 on various economic and social activities is shown, as well as the functioning of higher education during the pandemic. This section also includes the rationale and objectives of the article. Section 2 proposes the methods used to evaluate distance learning. In Section 3, the research findings were presented. In Section 4, the discussion is conducted to refer to other research results. Finally, Section 5 concludes this paper.

2. Materials and Methods

2.1. Data Collection, Processing, and Limitations

Five EU countries, i.e., Bulgaria, Greece, Italy, Poland, Sweden, were selected for the study by means of purposive sampling. Acronyms will be used in the research results: BG (Bulgaria); GR (Greece); IT (Italy); PL (Poland); SE (Sweden). A study is based on questionnaires (Appendix A). The surveys were carried out in autumn 2021. The questionnaire was made available to students in several educational institutions in the above-mentioned countries. Its completion was voluntary. The survey period covered the years 2020–2021. The adoption of such a period is substantively justified. In 2021, most countries coped better with the problems caused by the pandemic. The students had already used distance learning for two years, so they were able to assess this mode of knowledge transfer quite well. A certain limitation of the study is the focus on selected countries and students from a few universities. However, it is impossible to carry out research on the entire population or a very large number of students. The research carried out can be considered valuable as a result of the comparisons made in countries differing in the share of distance learning in education and experiences with it.
The questionnaire interviews were carried out as part of the co-founded by Erasmus+ Programme of the European Union project entitled “iSURVIVE-Digital Roadmap for designing online interactive content”. The project comes to help the lecturers of Higher Education institutions to transform their online courses via the use of interactive learning, gamification, and learning 2.0, which will motivate both lecturers and students to follow the online courses and further establish e-learning as a high-quality educative method and not just a forced solution. The project products will support teachers in converting their lectures to being online and will provide assistance in the form of a didactic guide with MOOC (Massive Open Online Course) training dedicated to teachers wishing to include e-learning methods to their classroom.
The questions in the questionnaire cover the following five areas (the full list of questions is available in Appendix A):
  • The level of student satisfaction by the online activities;
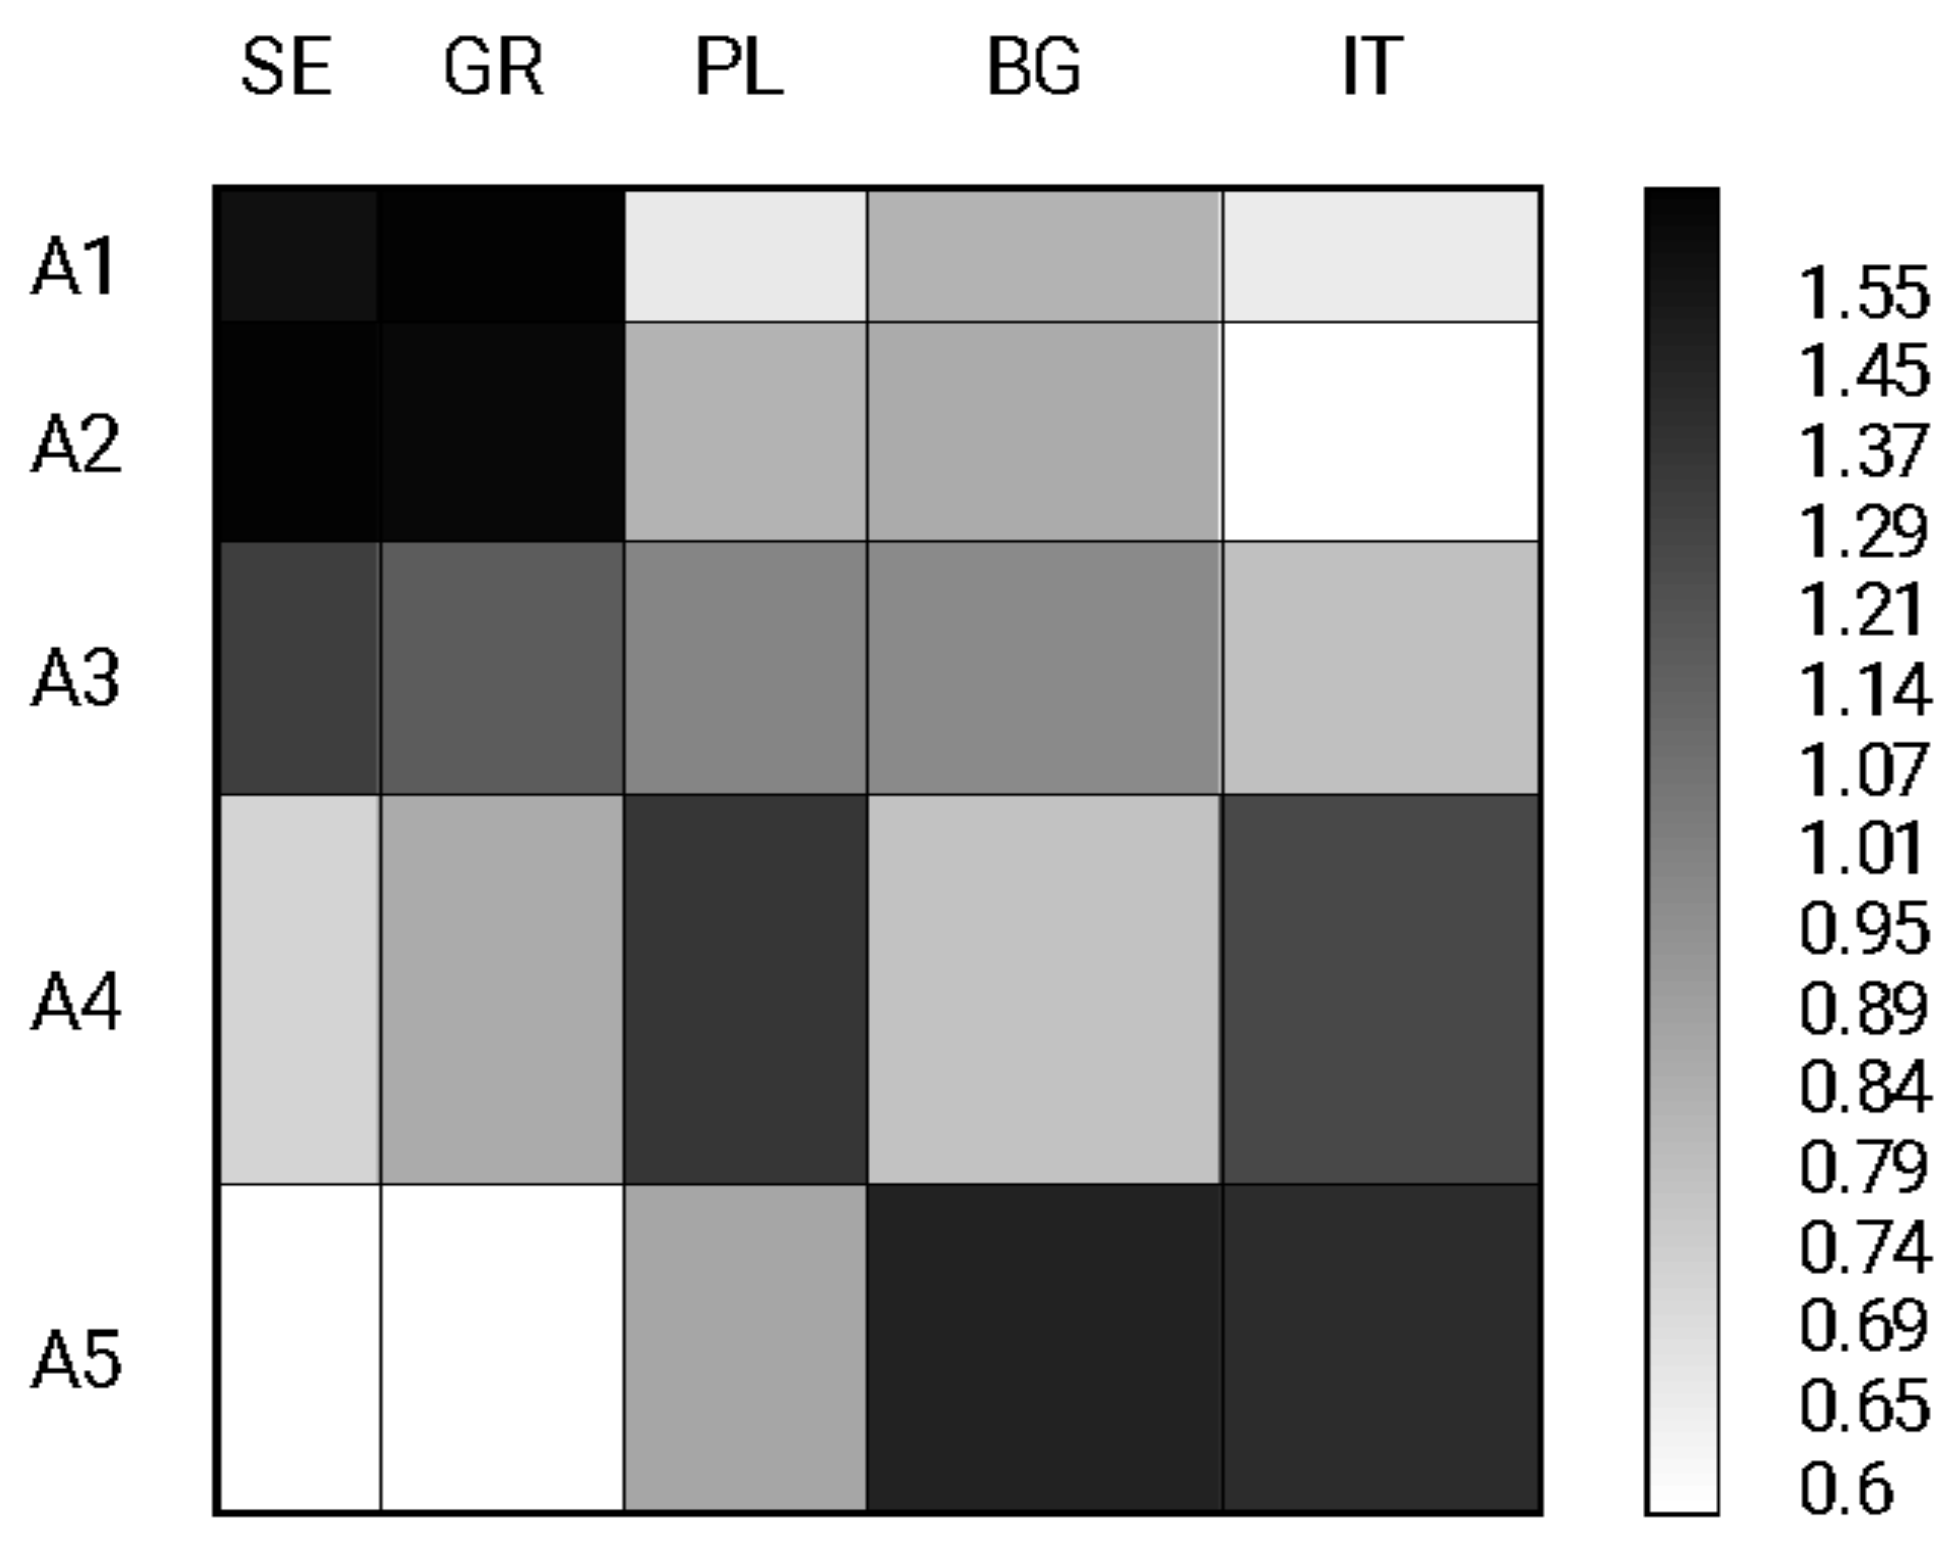
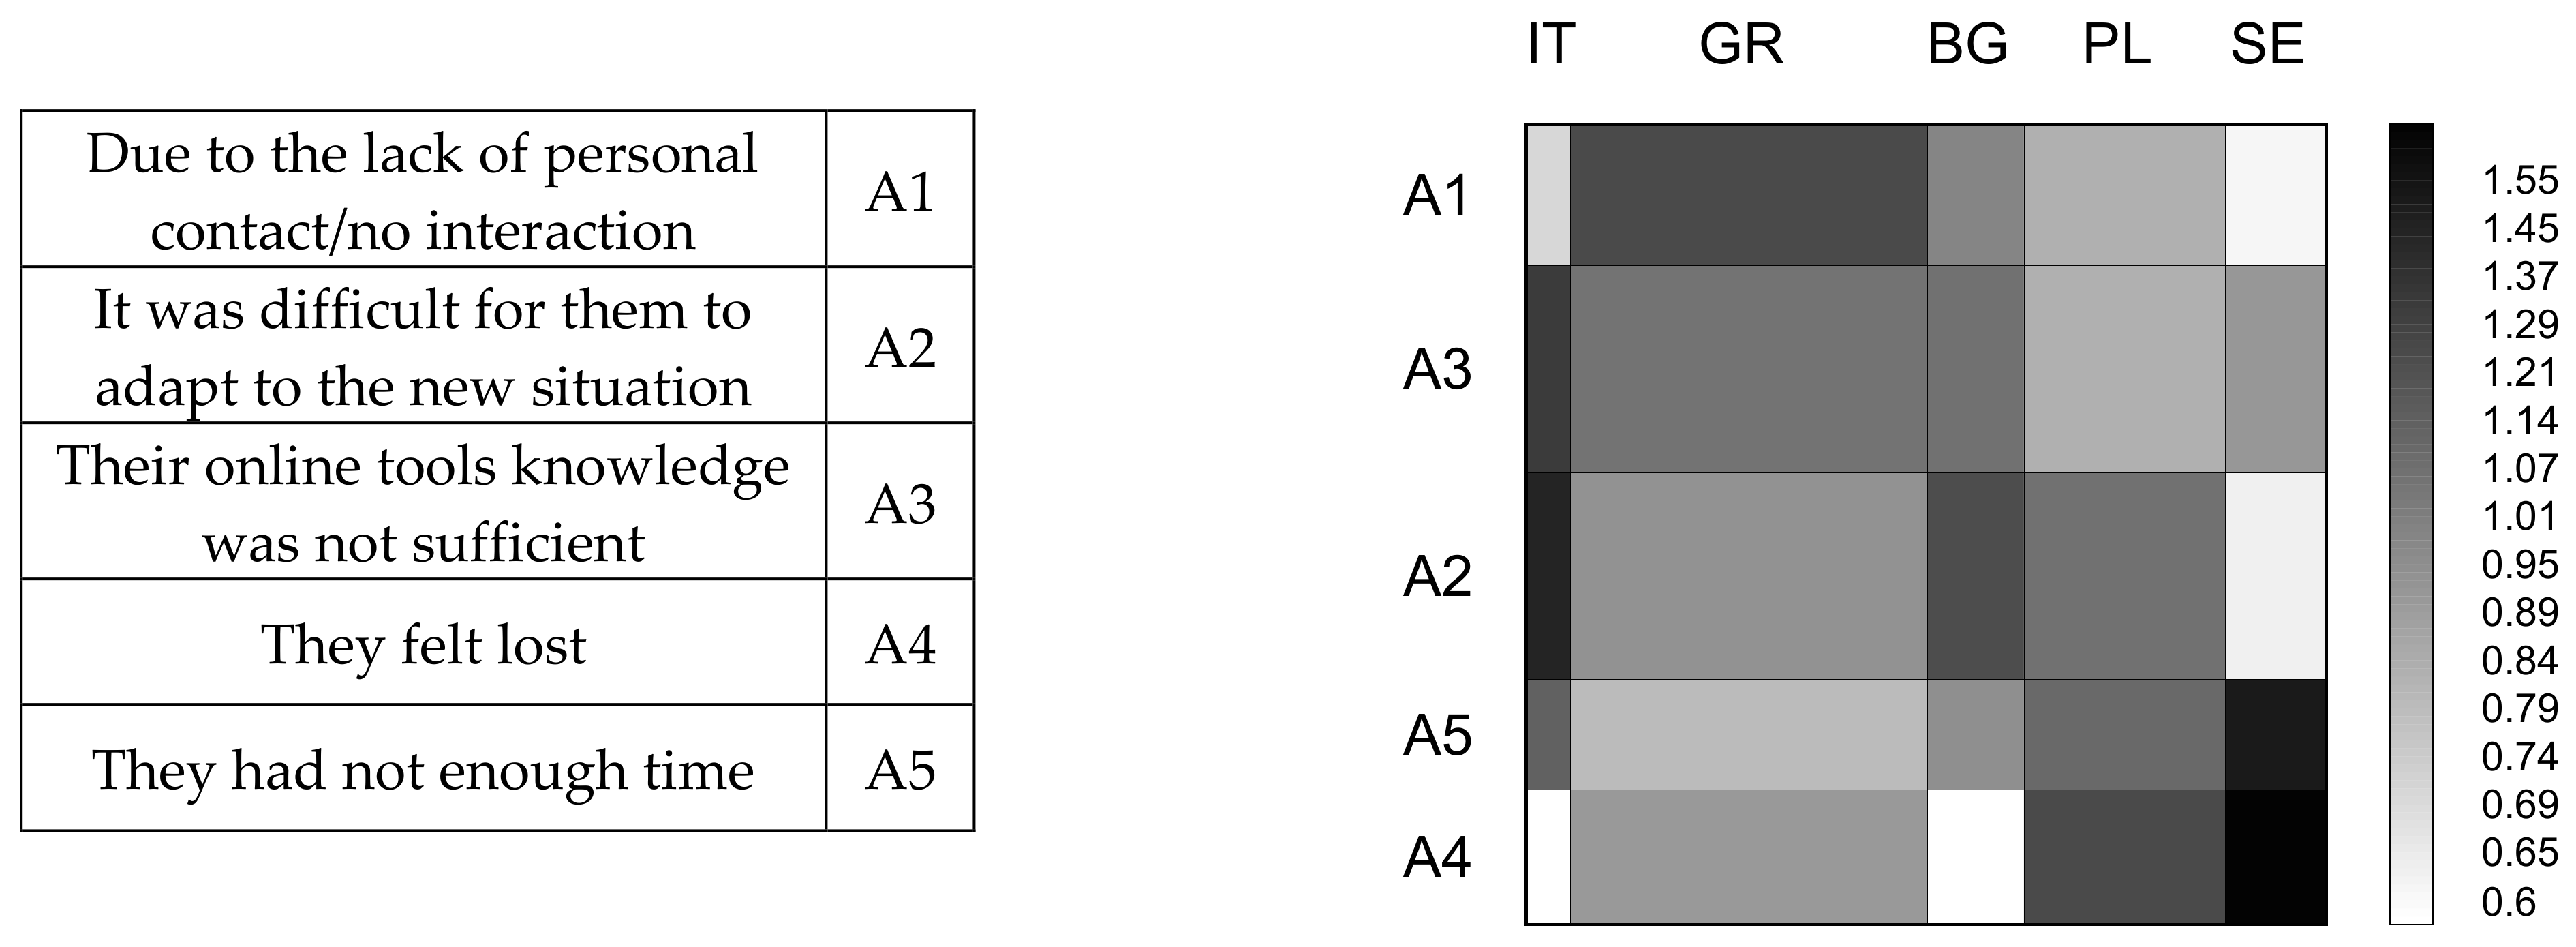
  • The difficulties that students have faced when being involved in e-learning;
  • The most interesting and effective parts of the e-learning activities;
  • What students would do differently in order to increase effectiveness;
  • What would be more motivating for the students.
In addition to the presented sources of numerical data, the literature used was in the form of books, articles in scientific and popular science journals, reports, and articles in portals dealing with online learning.
The study is the result of the authors’ previous research on higher education. More recently, the authors’ field of interest has been the impact of COVID-19 on the situation in various sectors of the economy and aspects of society. These two areas are closely linked, as without efficient education it was not possible for higher education to function smoothly during the pandemic. In addition, the lack of up-to-date research studies on the relationship between differences in distance learning in the diverse EU countries and different subject of teaching was highlighted.

2.2. Participants

The survey was conducted among 809 student respondents representing five countries, respectively, 216 questionnaires from Bulgaria, 195 from Italy, 149 from Greece, 149 from Poland and 100 from Sweden. As the question about age was optional we do not share these results in the article. Furthermore, we do not have information about gender as it was not crucial in terms of the research and project problem.
According to student responses, the majority of them experienced both: traditional and online classes, except Italy, where 76.41% of students had only online meetings with the teacher or e-learning (Table 1).
Most of the students surveyed (60%) do not agree with the statement that they had experience with online classes prior to the pandemic. Only, on average, less than 30% of students admitted to having experience of previous online classes. The lowest number of students to indicate that they agreed or fully agreed with the above statement was in Poland (11.41%) and Greece (20.81%). On the other hand, students from Italy had the biggest experience in online classes (as many as 54.36% indicated agree or fully agree).
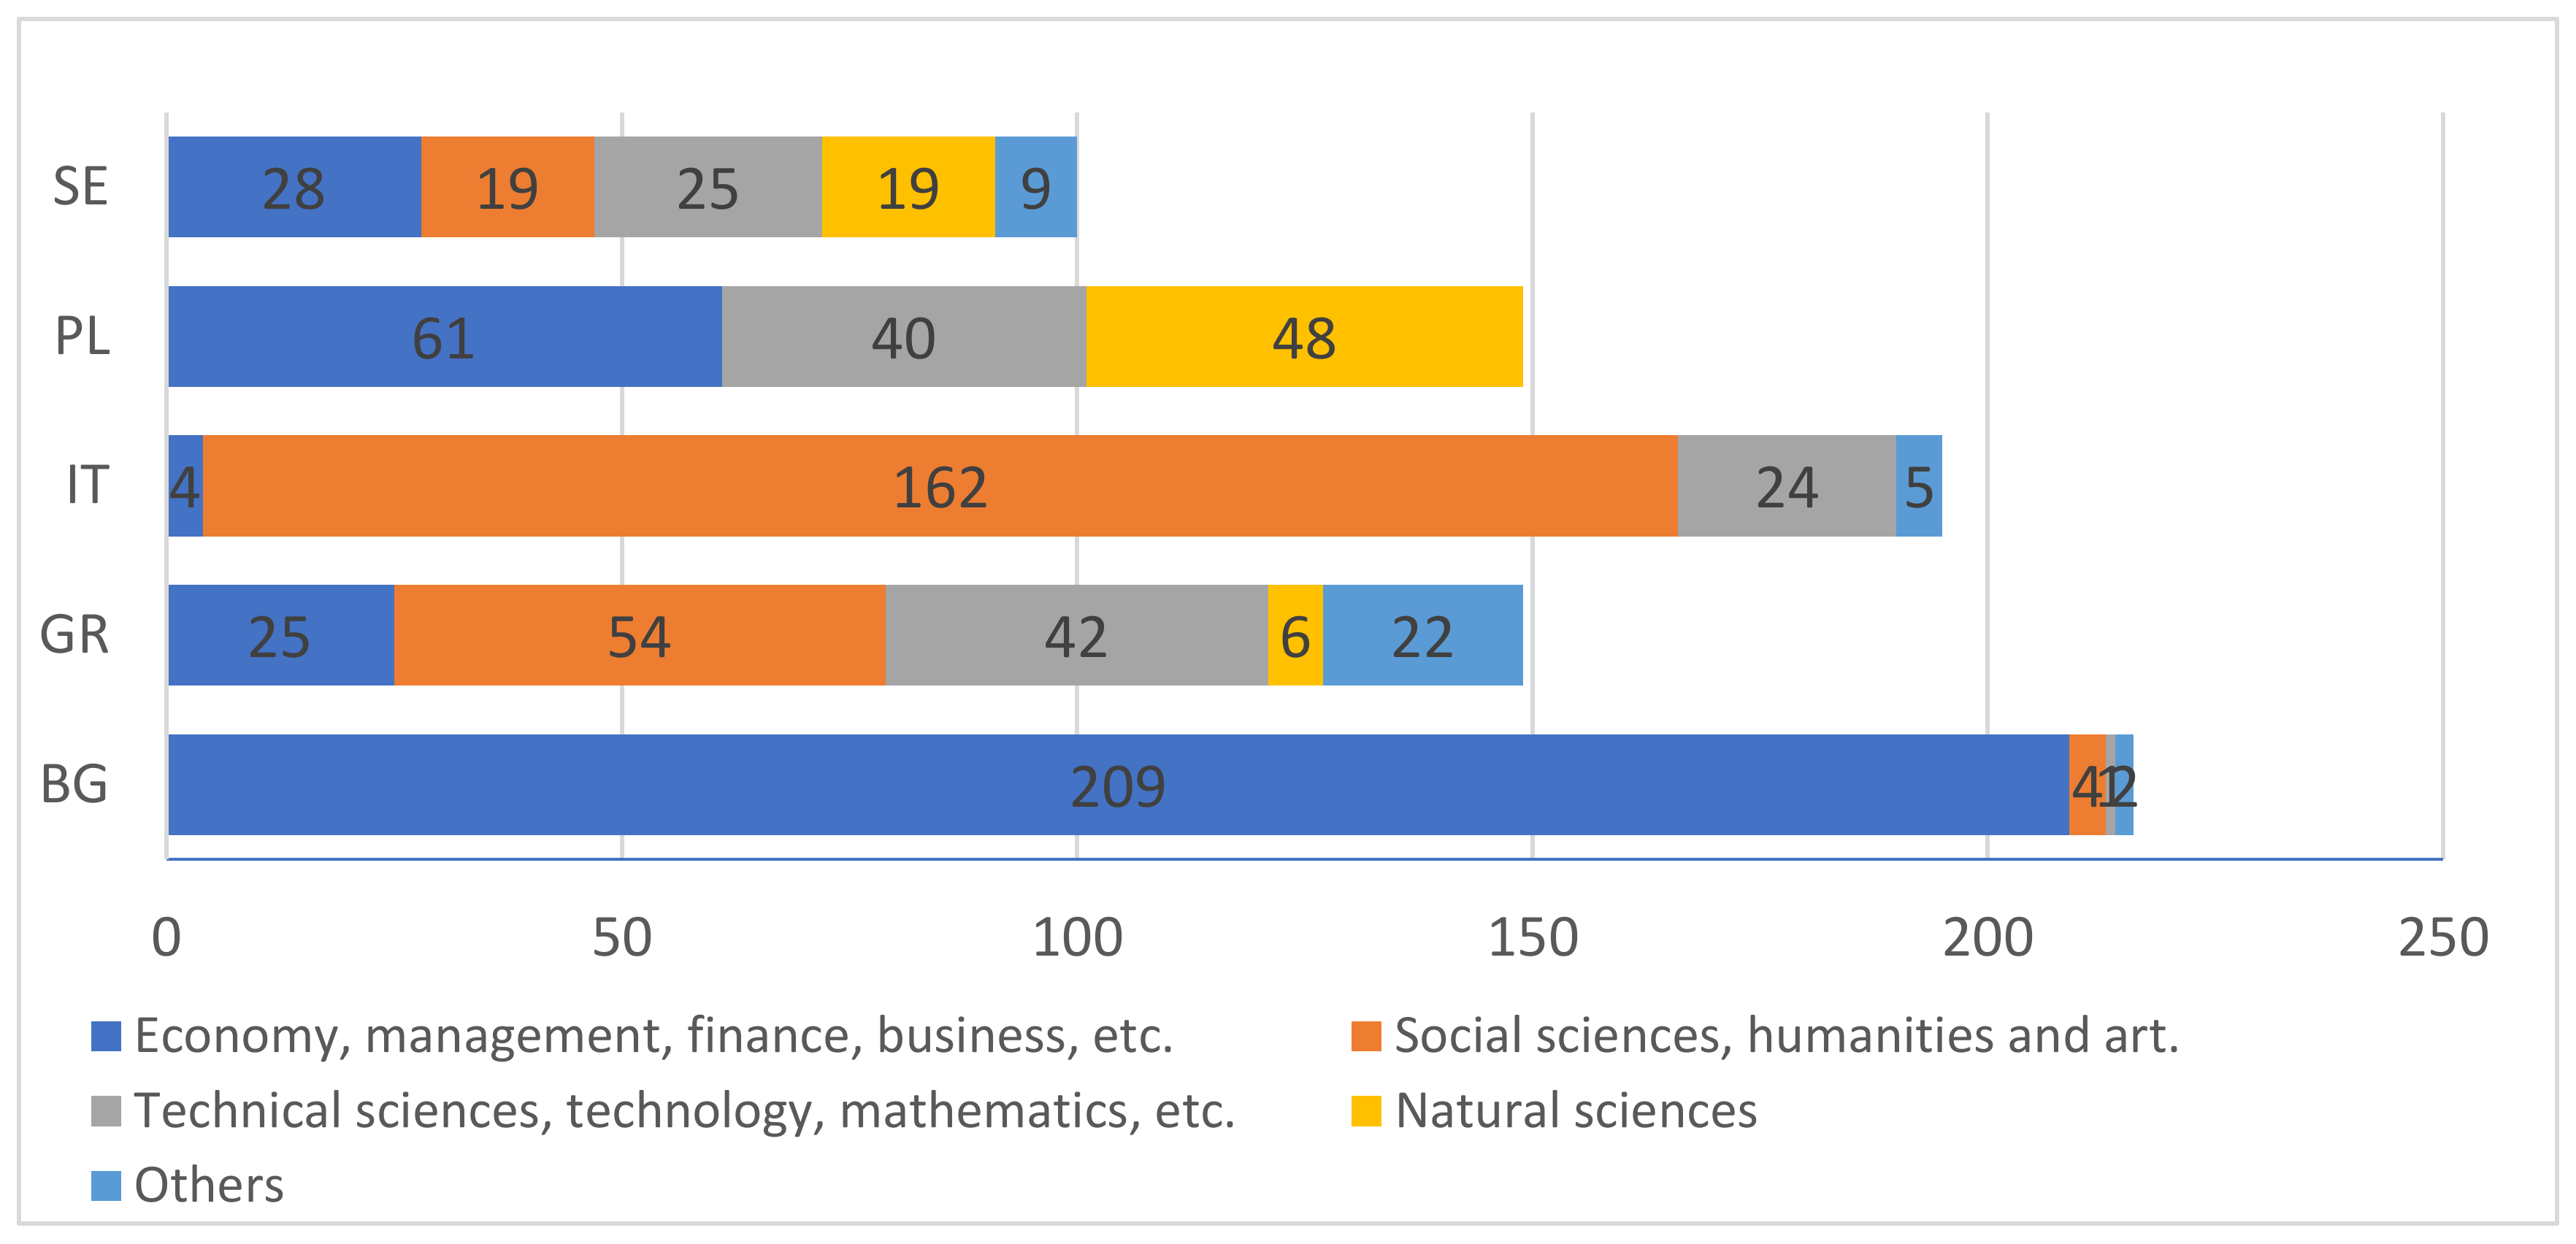
The students who participated in the study represented a variety of disciplines (Figure 1). The most common thematic area of the study was economy, management, finances and business (Bulgaria, Poland, Sweden) or social sciences, humanities and art (Italy, Greece).

2.3. Applied Methods

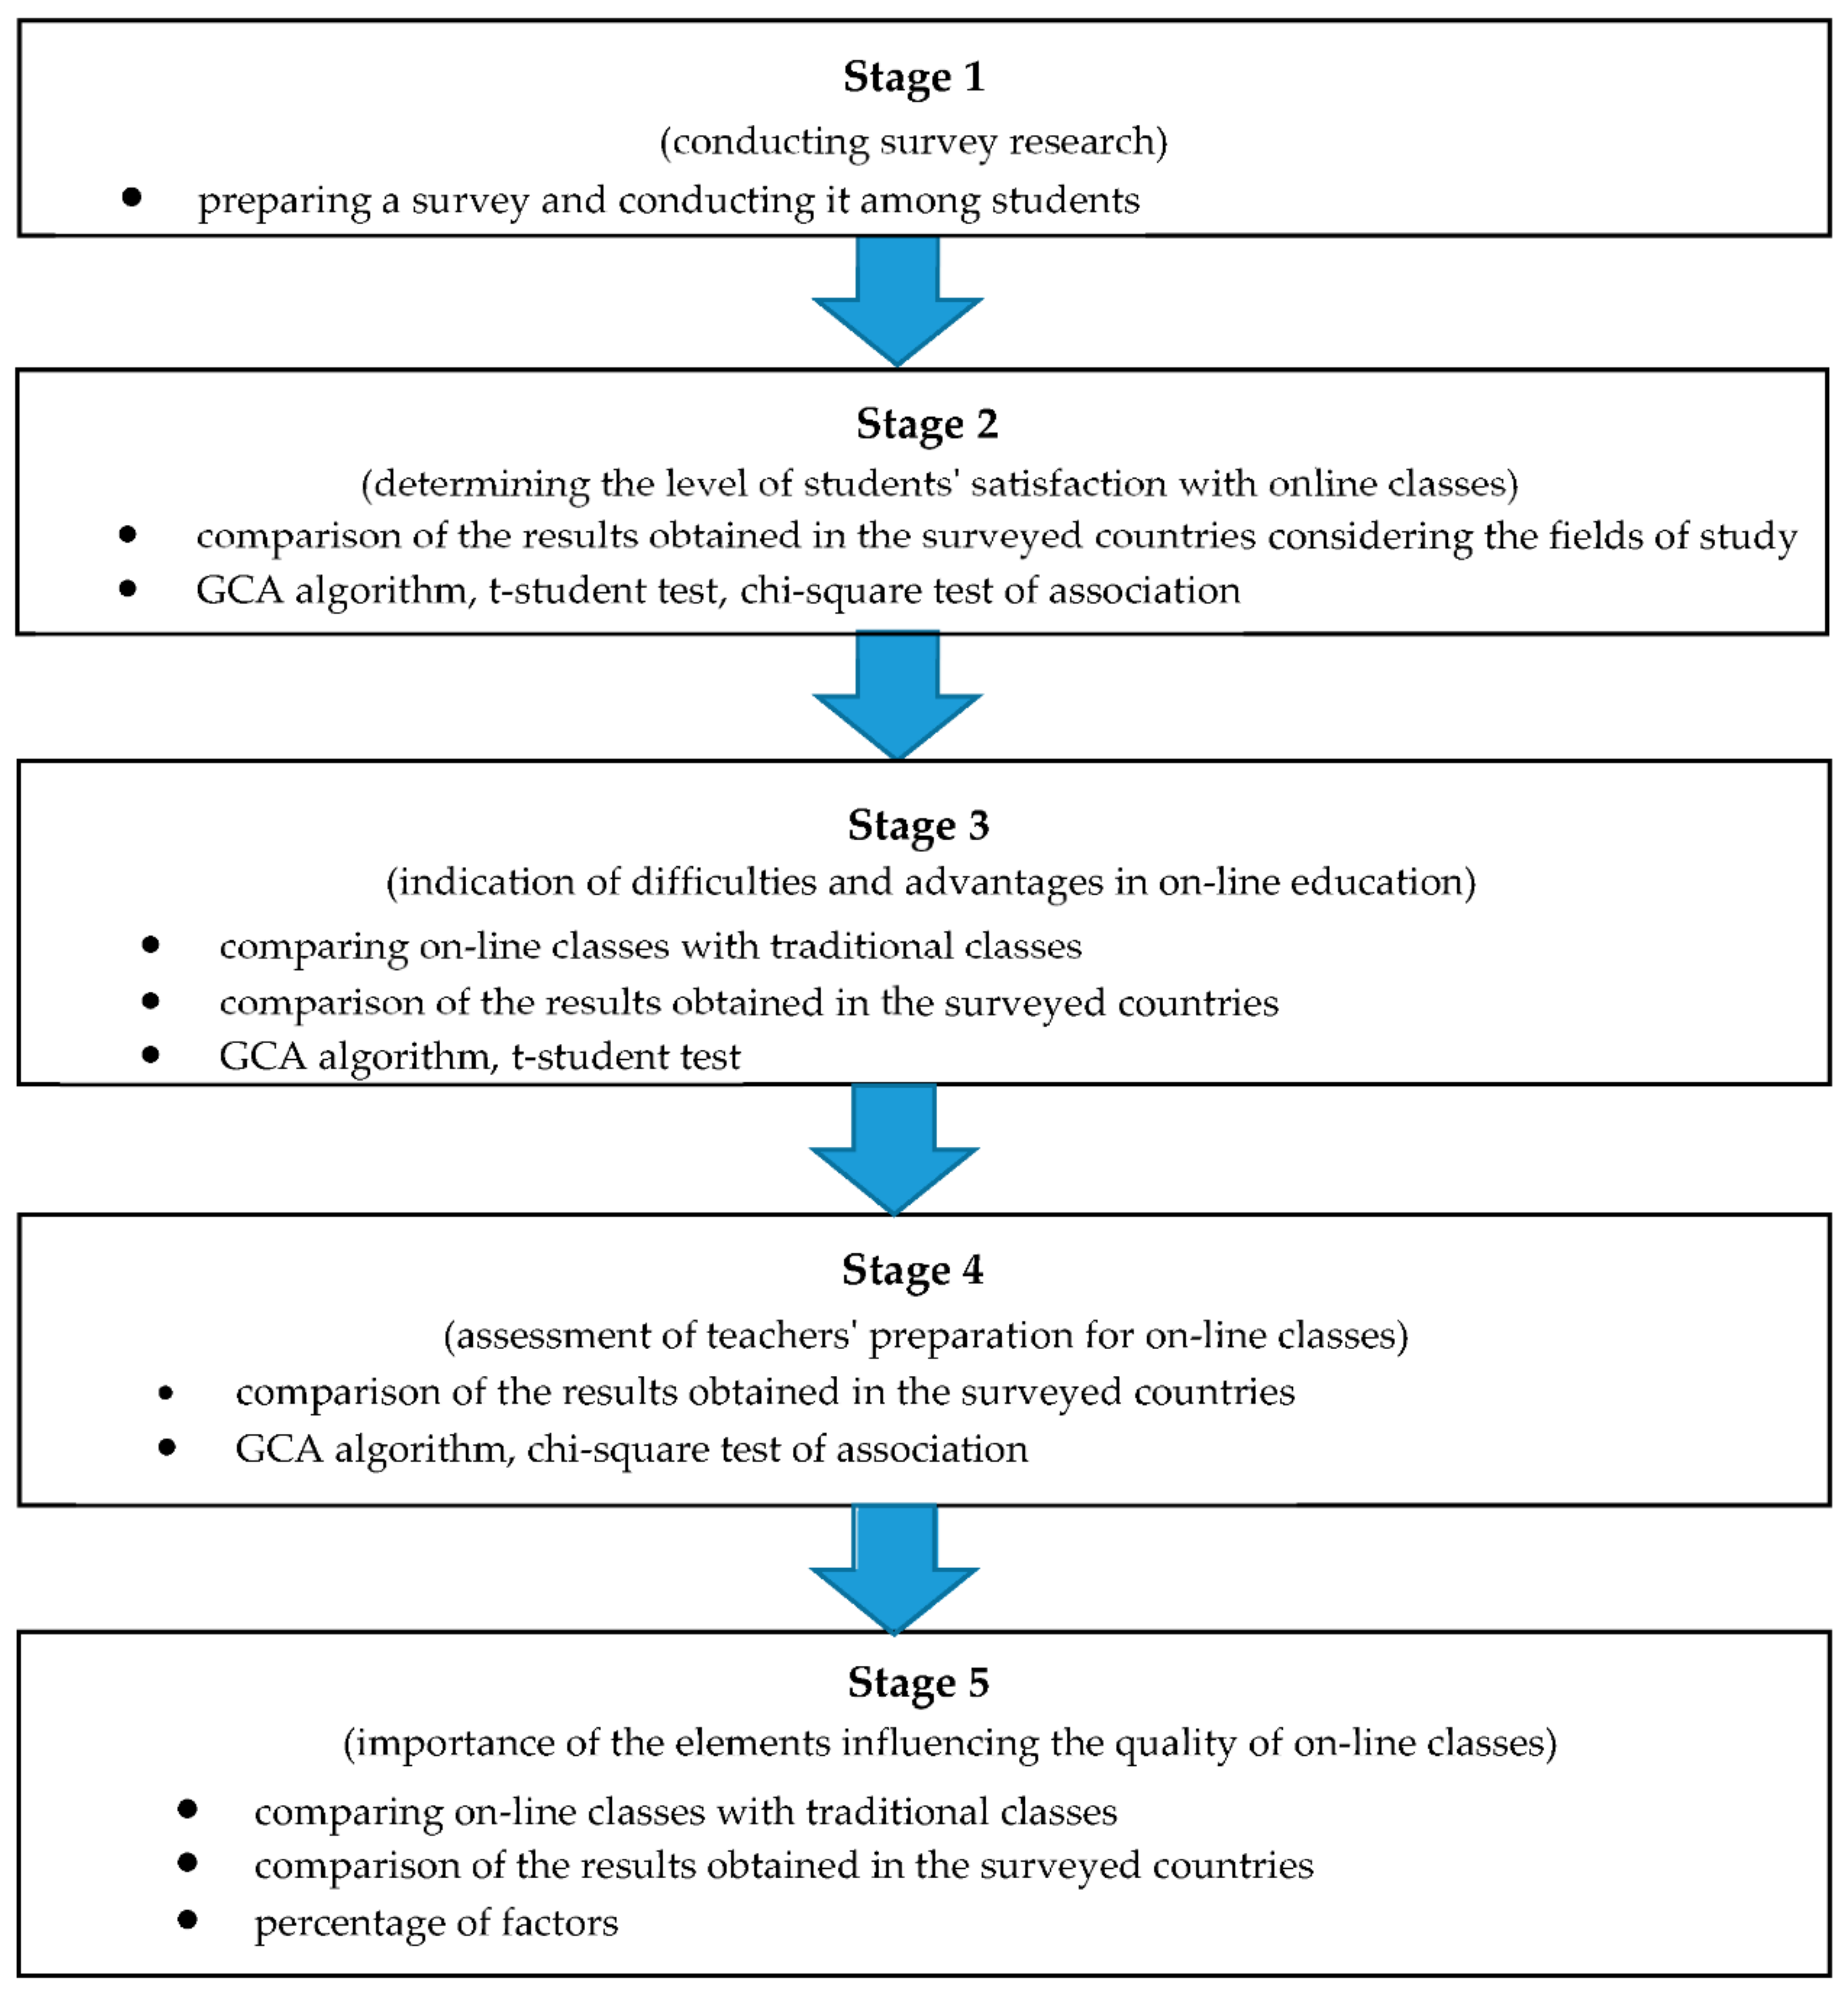
The research was fractionated into stages. Figure 2 shows a scheme of the conducted research.
In the first stage, a questionnaire was prepared. Then a questionnaire survey was conducted among students. Online questionnaires were used. In the second stage of the research, the level of students’ satisfaction with online classes was determined. The obtained result was used to determine the starting position in the perception of online education in the surveyed countries. On this basis, it was possible to perform further tests and confront the obtained results with the initial assessment. Three basic methods were used, such as GCA (Grade Correspondence Analysis), Student’s t-test for two populations for inequality of means and Chi-square test of association. Those methods are described more detailed at the end of this section.
The third stage of the research presented the difficulties and advantages for distance learning in each country. For this purpose, a comparison was made between online classes and traditional classes. As a result, regularities were obtained and the advantages or disadvantages of remote learning in relation to on-site learning were determined. In addition, the results were contrasted in several countries. Again, the GCA (Grade Correspondence Analysis) method and the Student’s t-test for two populations for non-equality of means were used.
The fourth stage of the research concerned the evaluation of teachers’ preparation for online classes. Here, the results differed among the countries and fields of study, which was contrasted with previous evaluations of classroom satisfaction. The GCA method was used.
The fifth stage was concerned with gathering students’ opinions on the elements that influence the quality of online classes compared to face-to-face classes. The percentage results on the importance of each factor were presented.
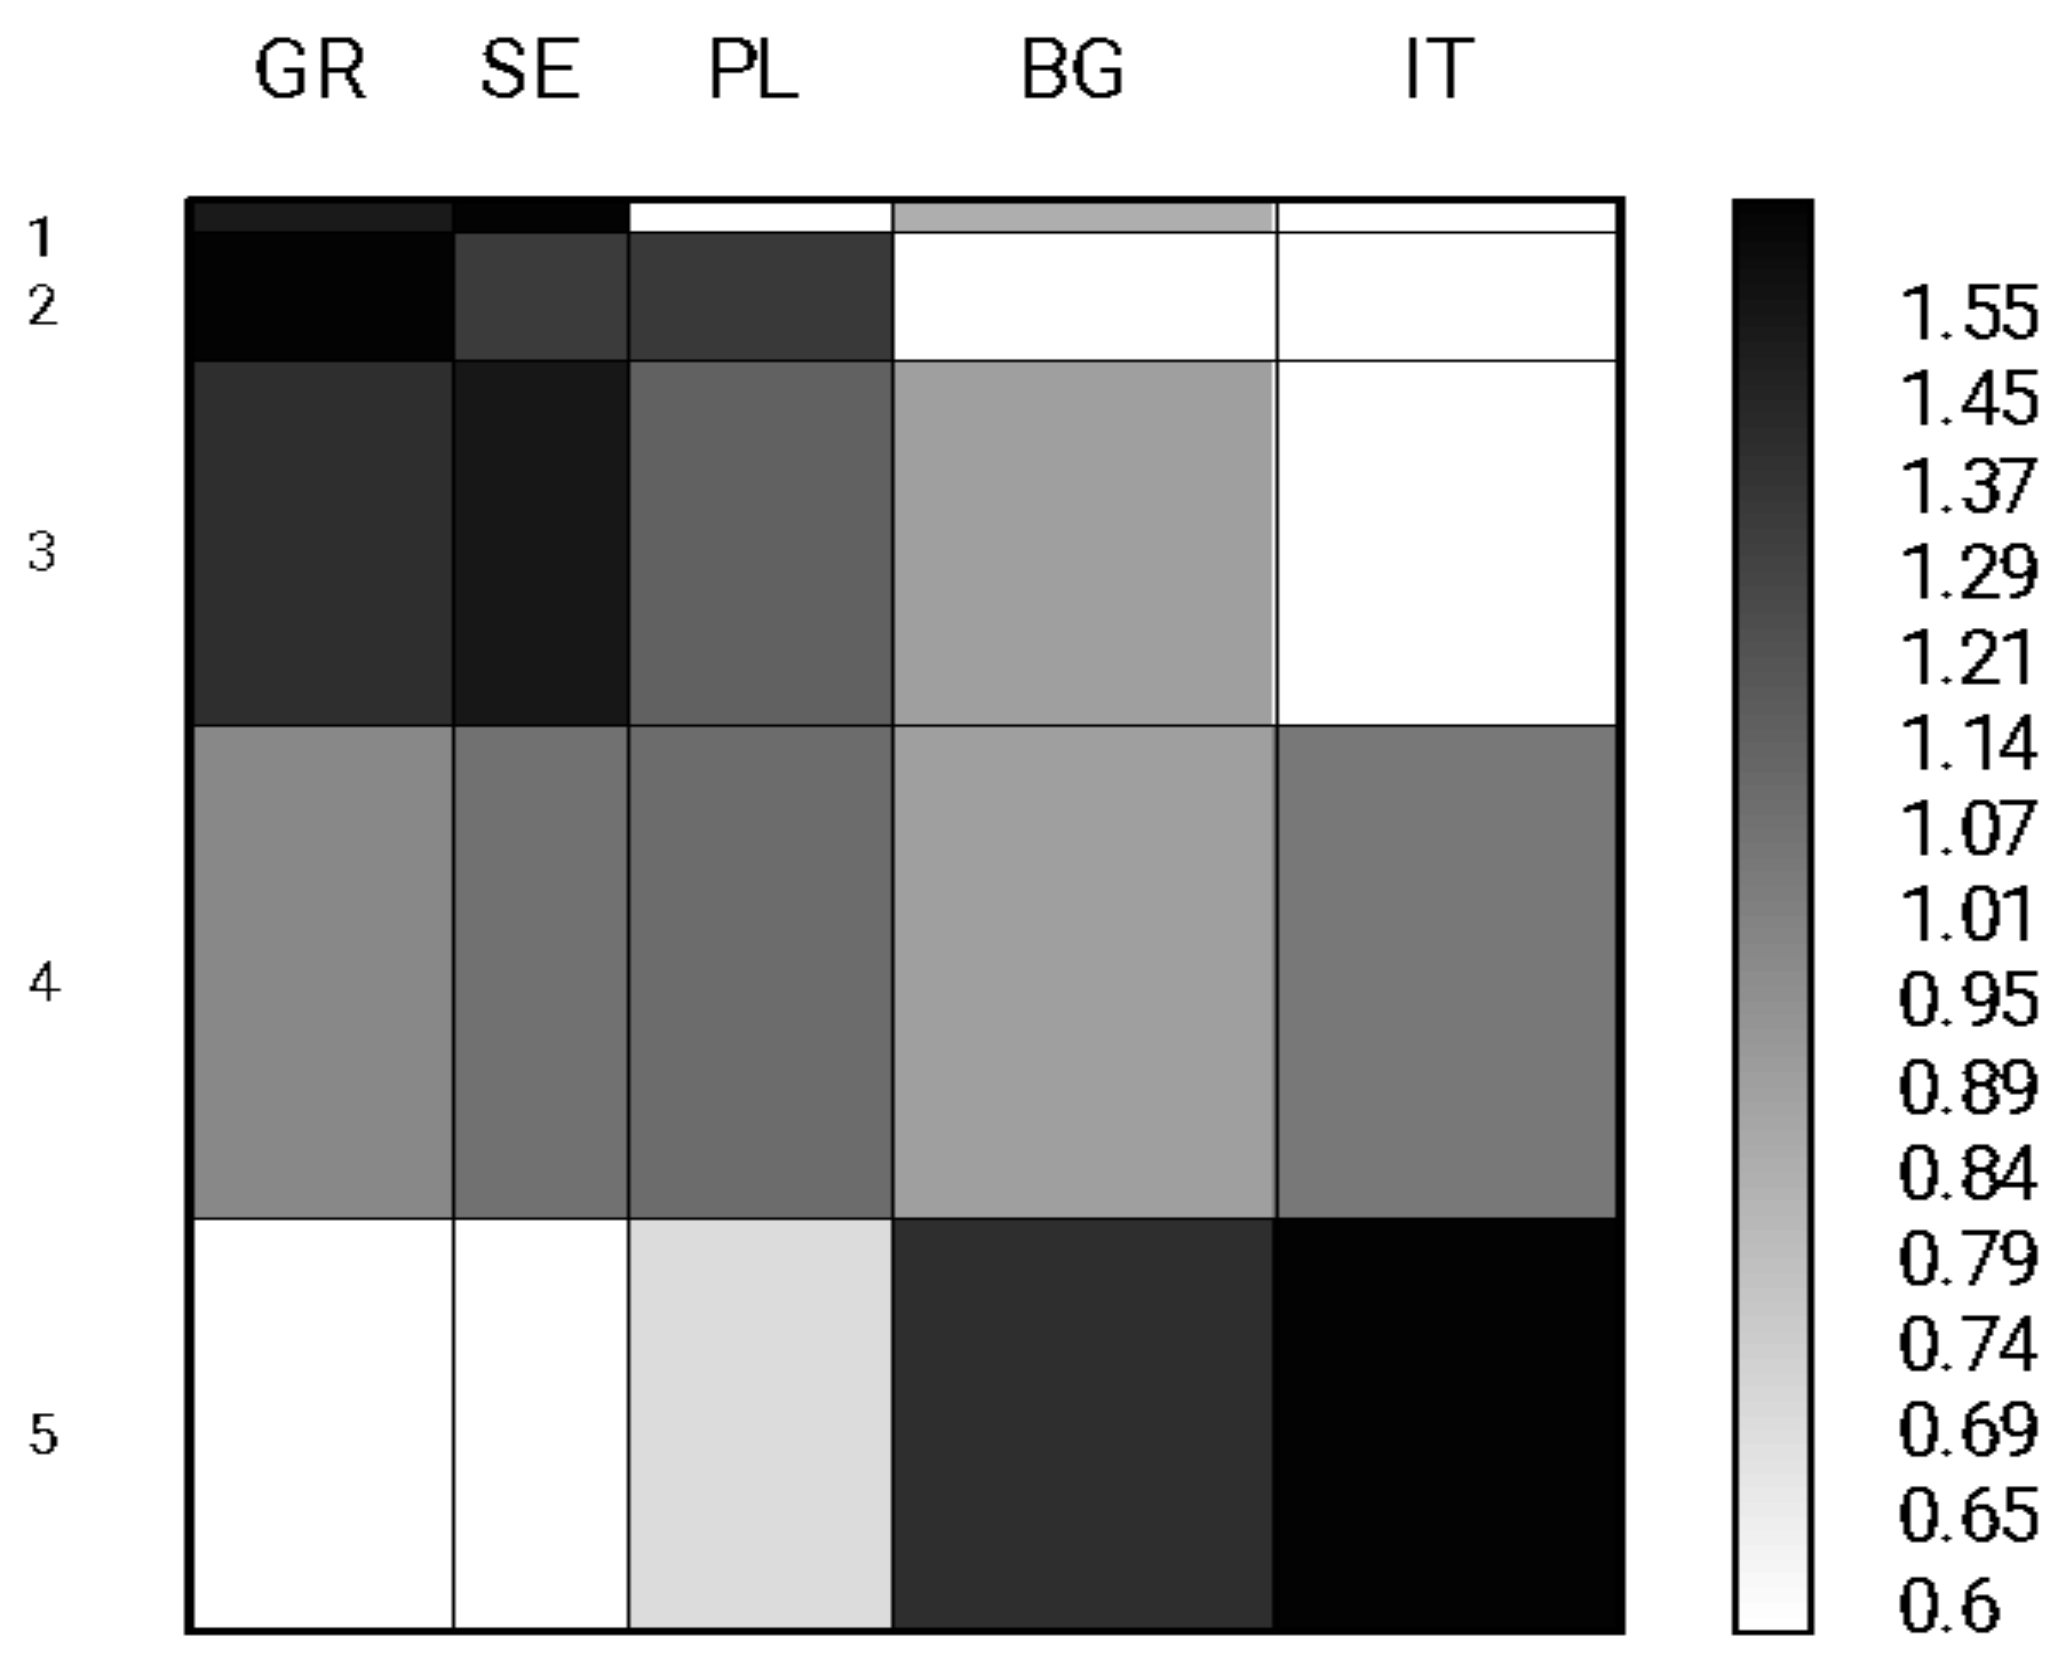
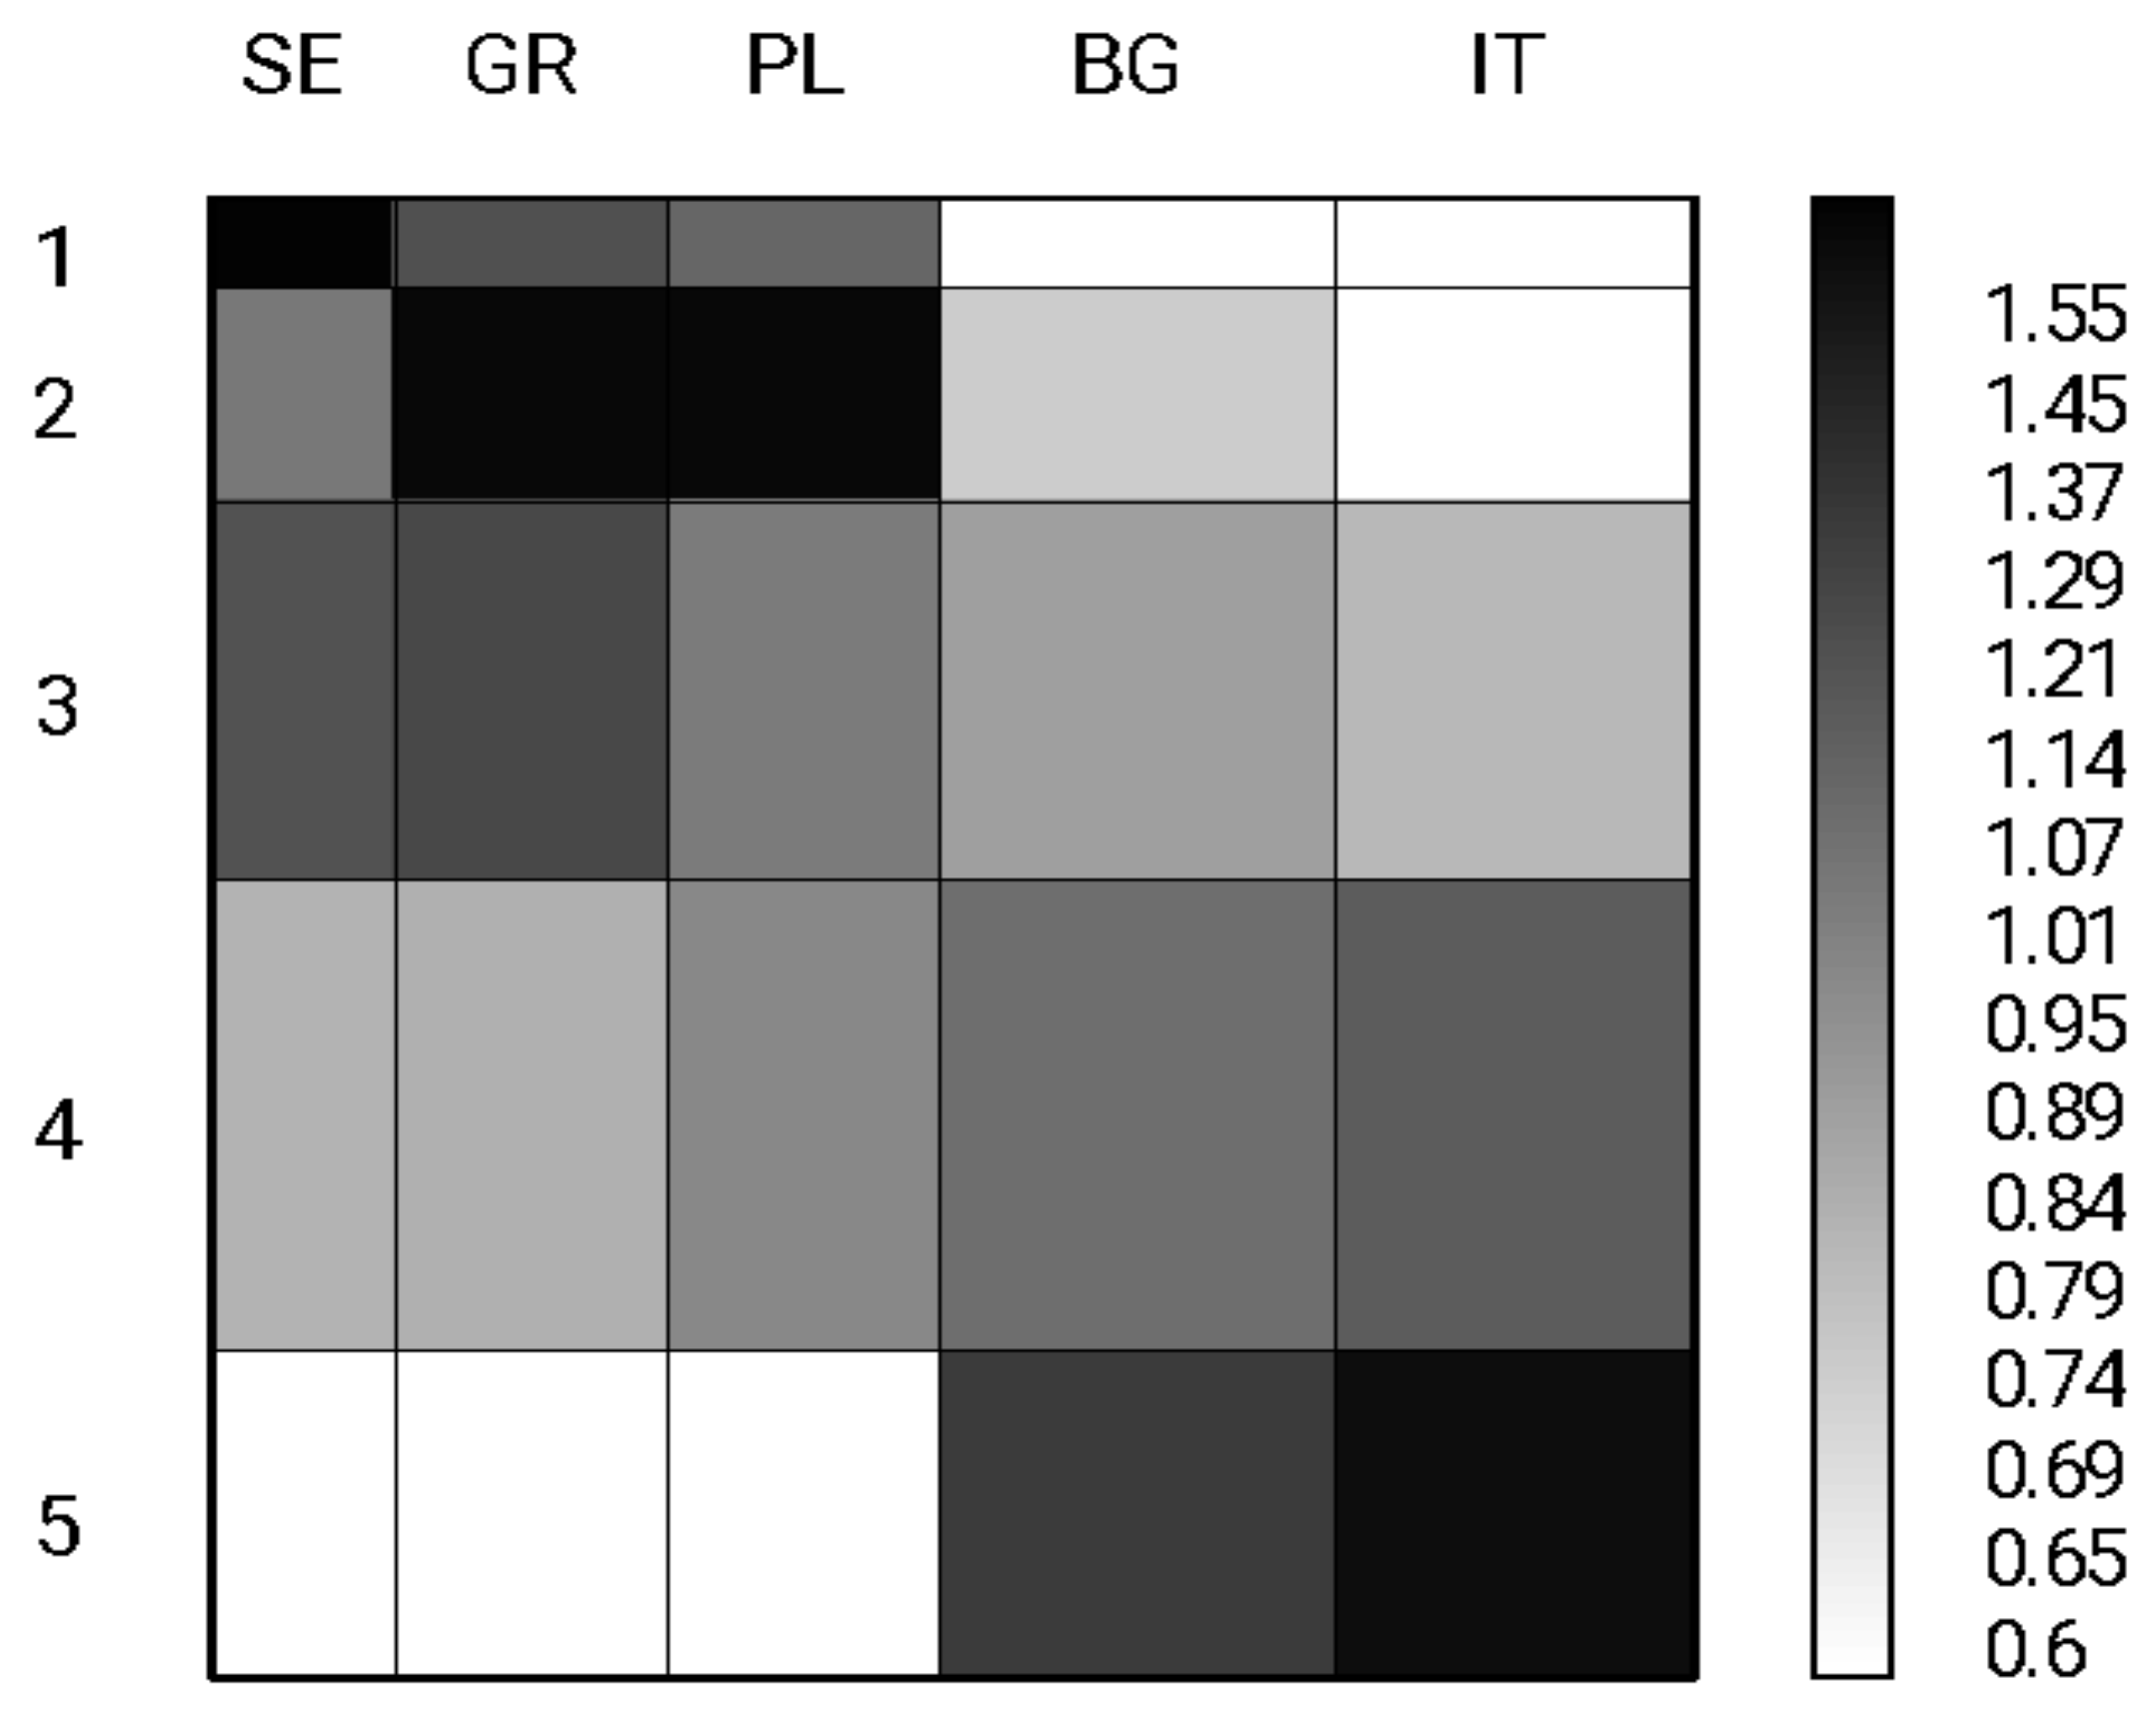
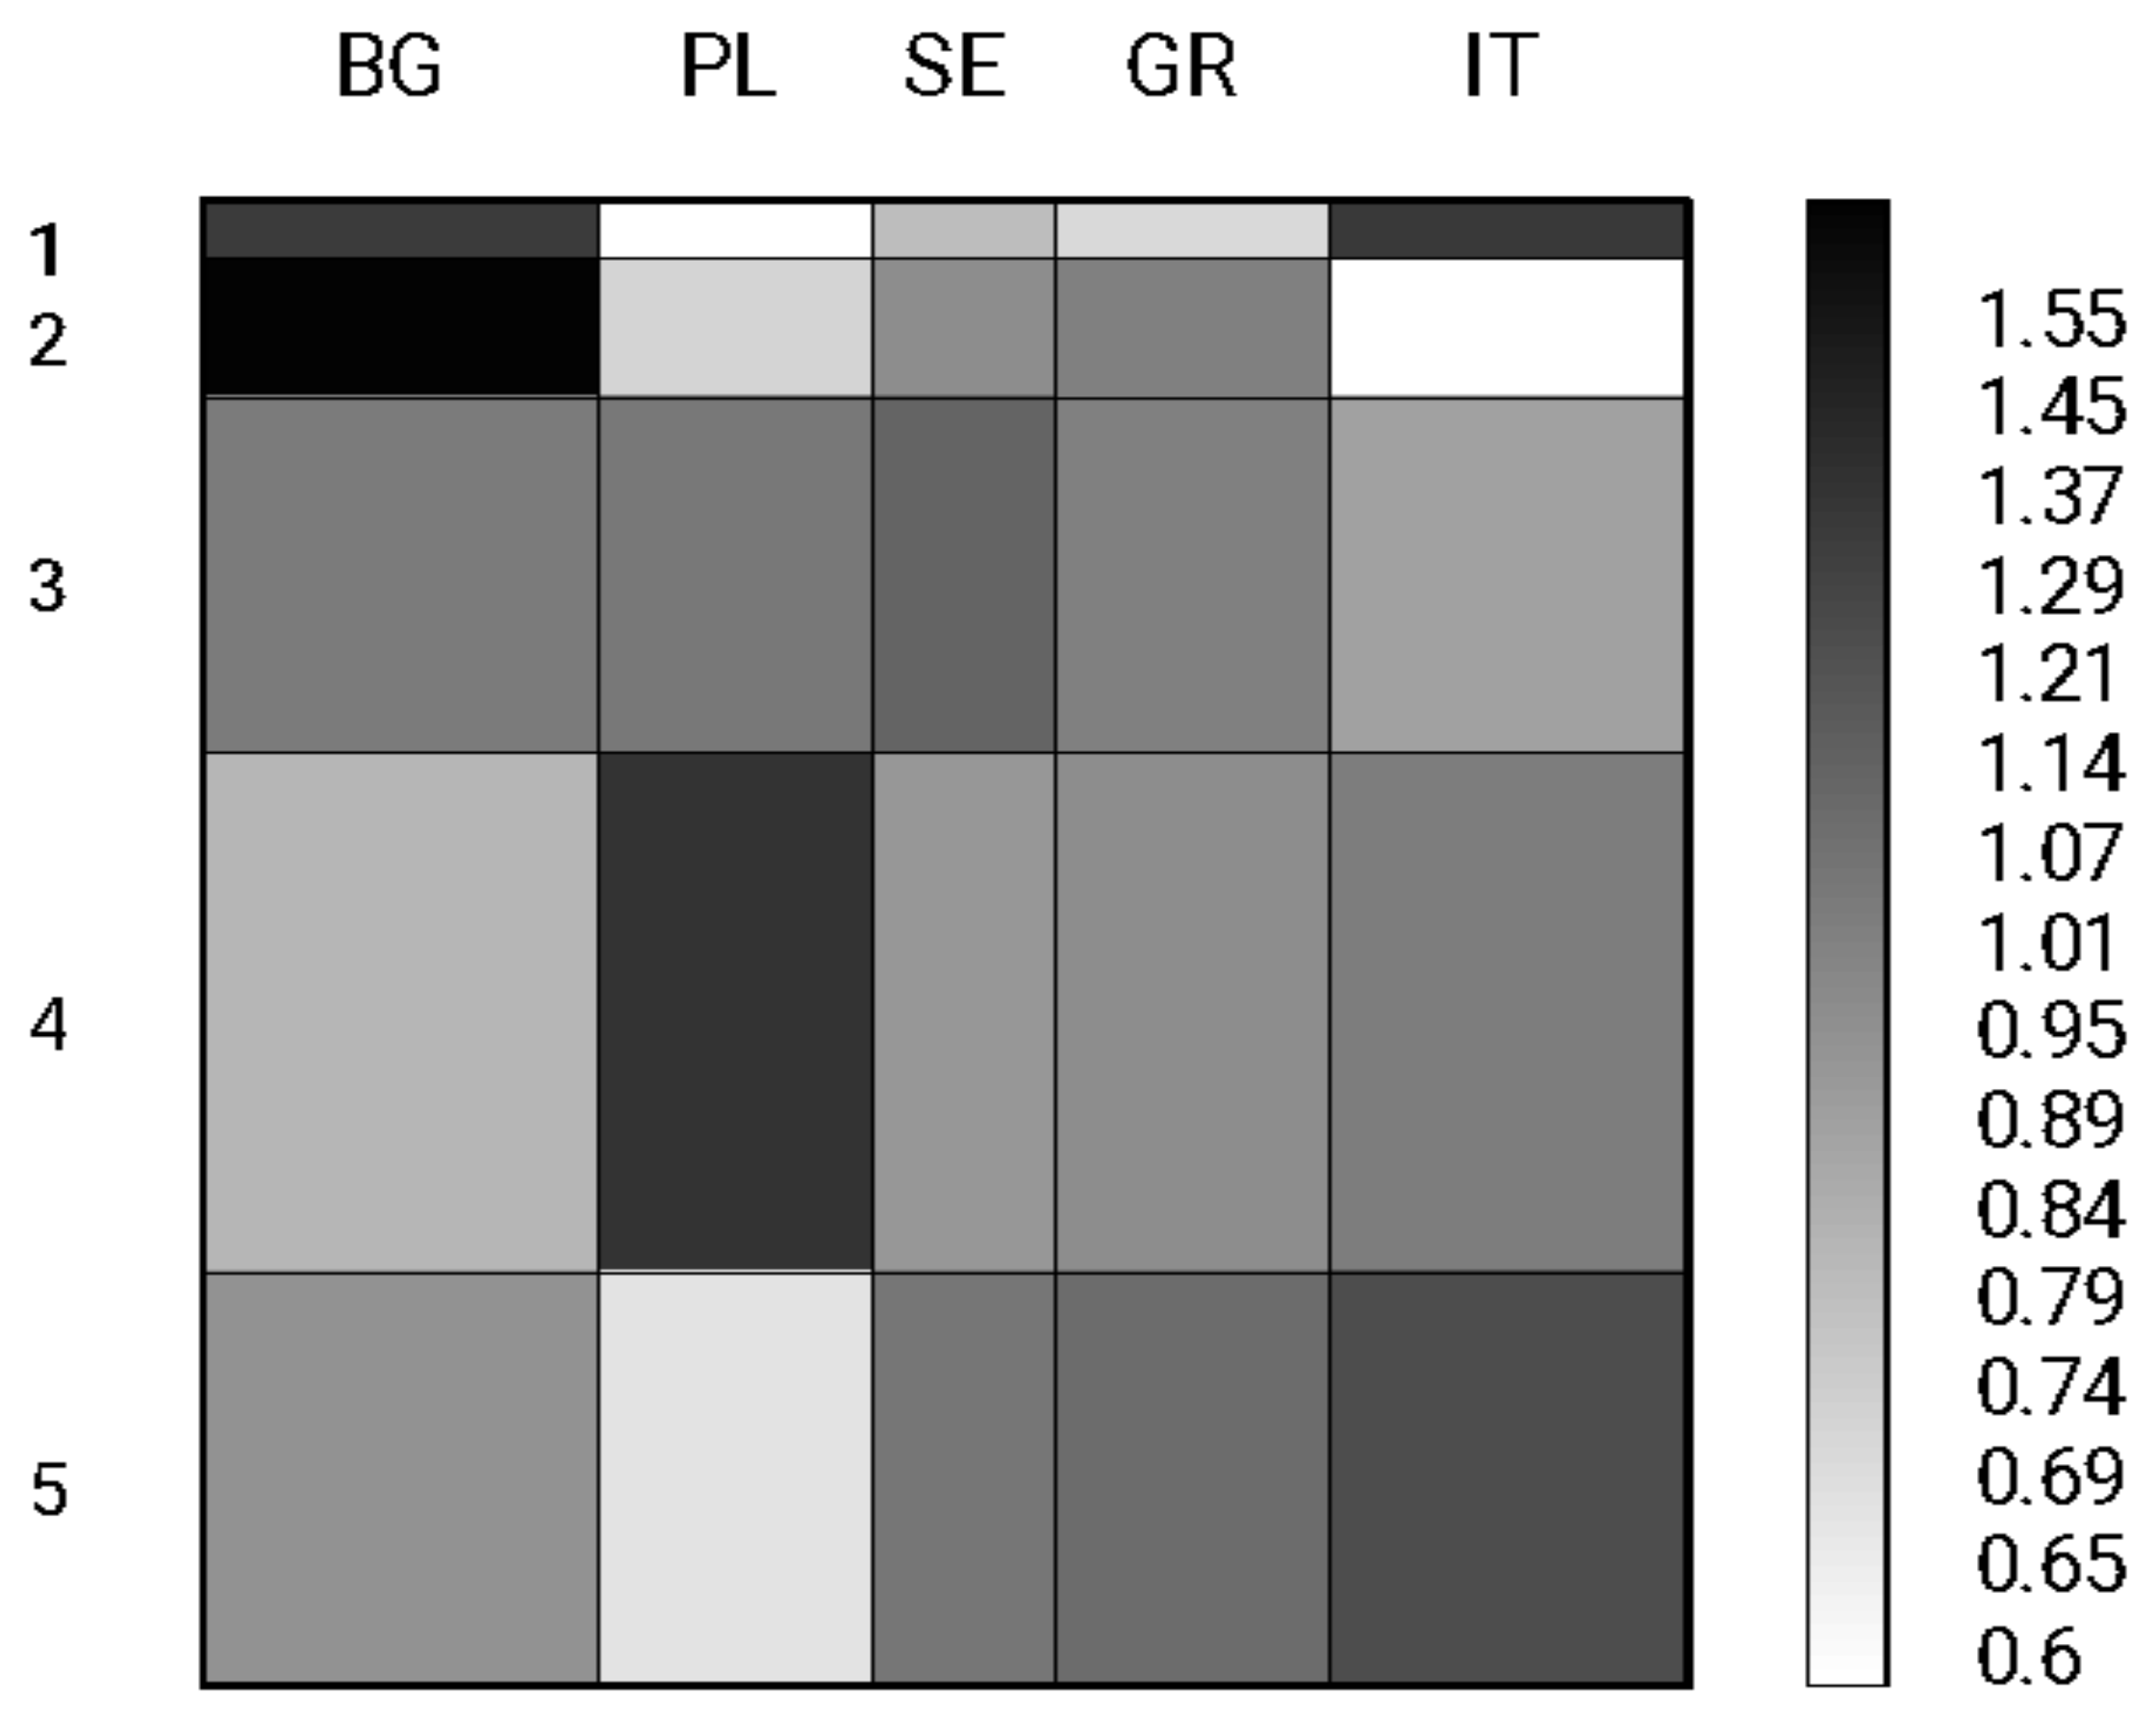
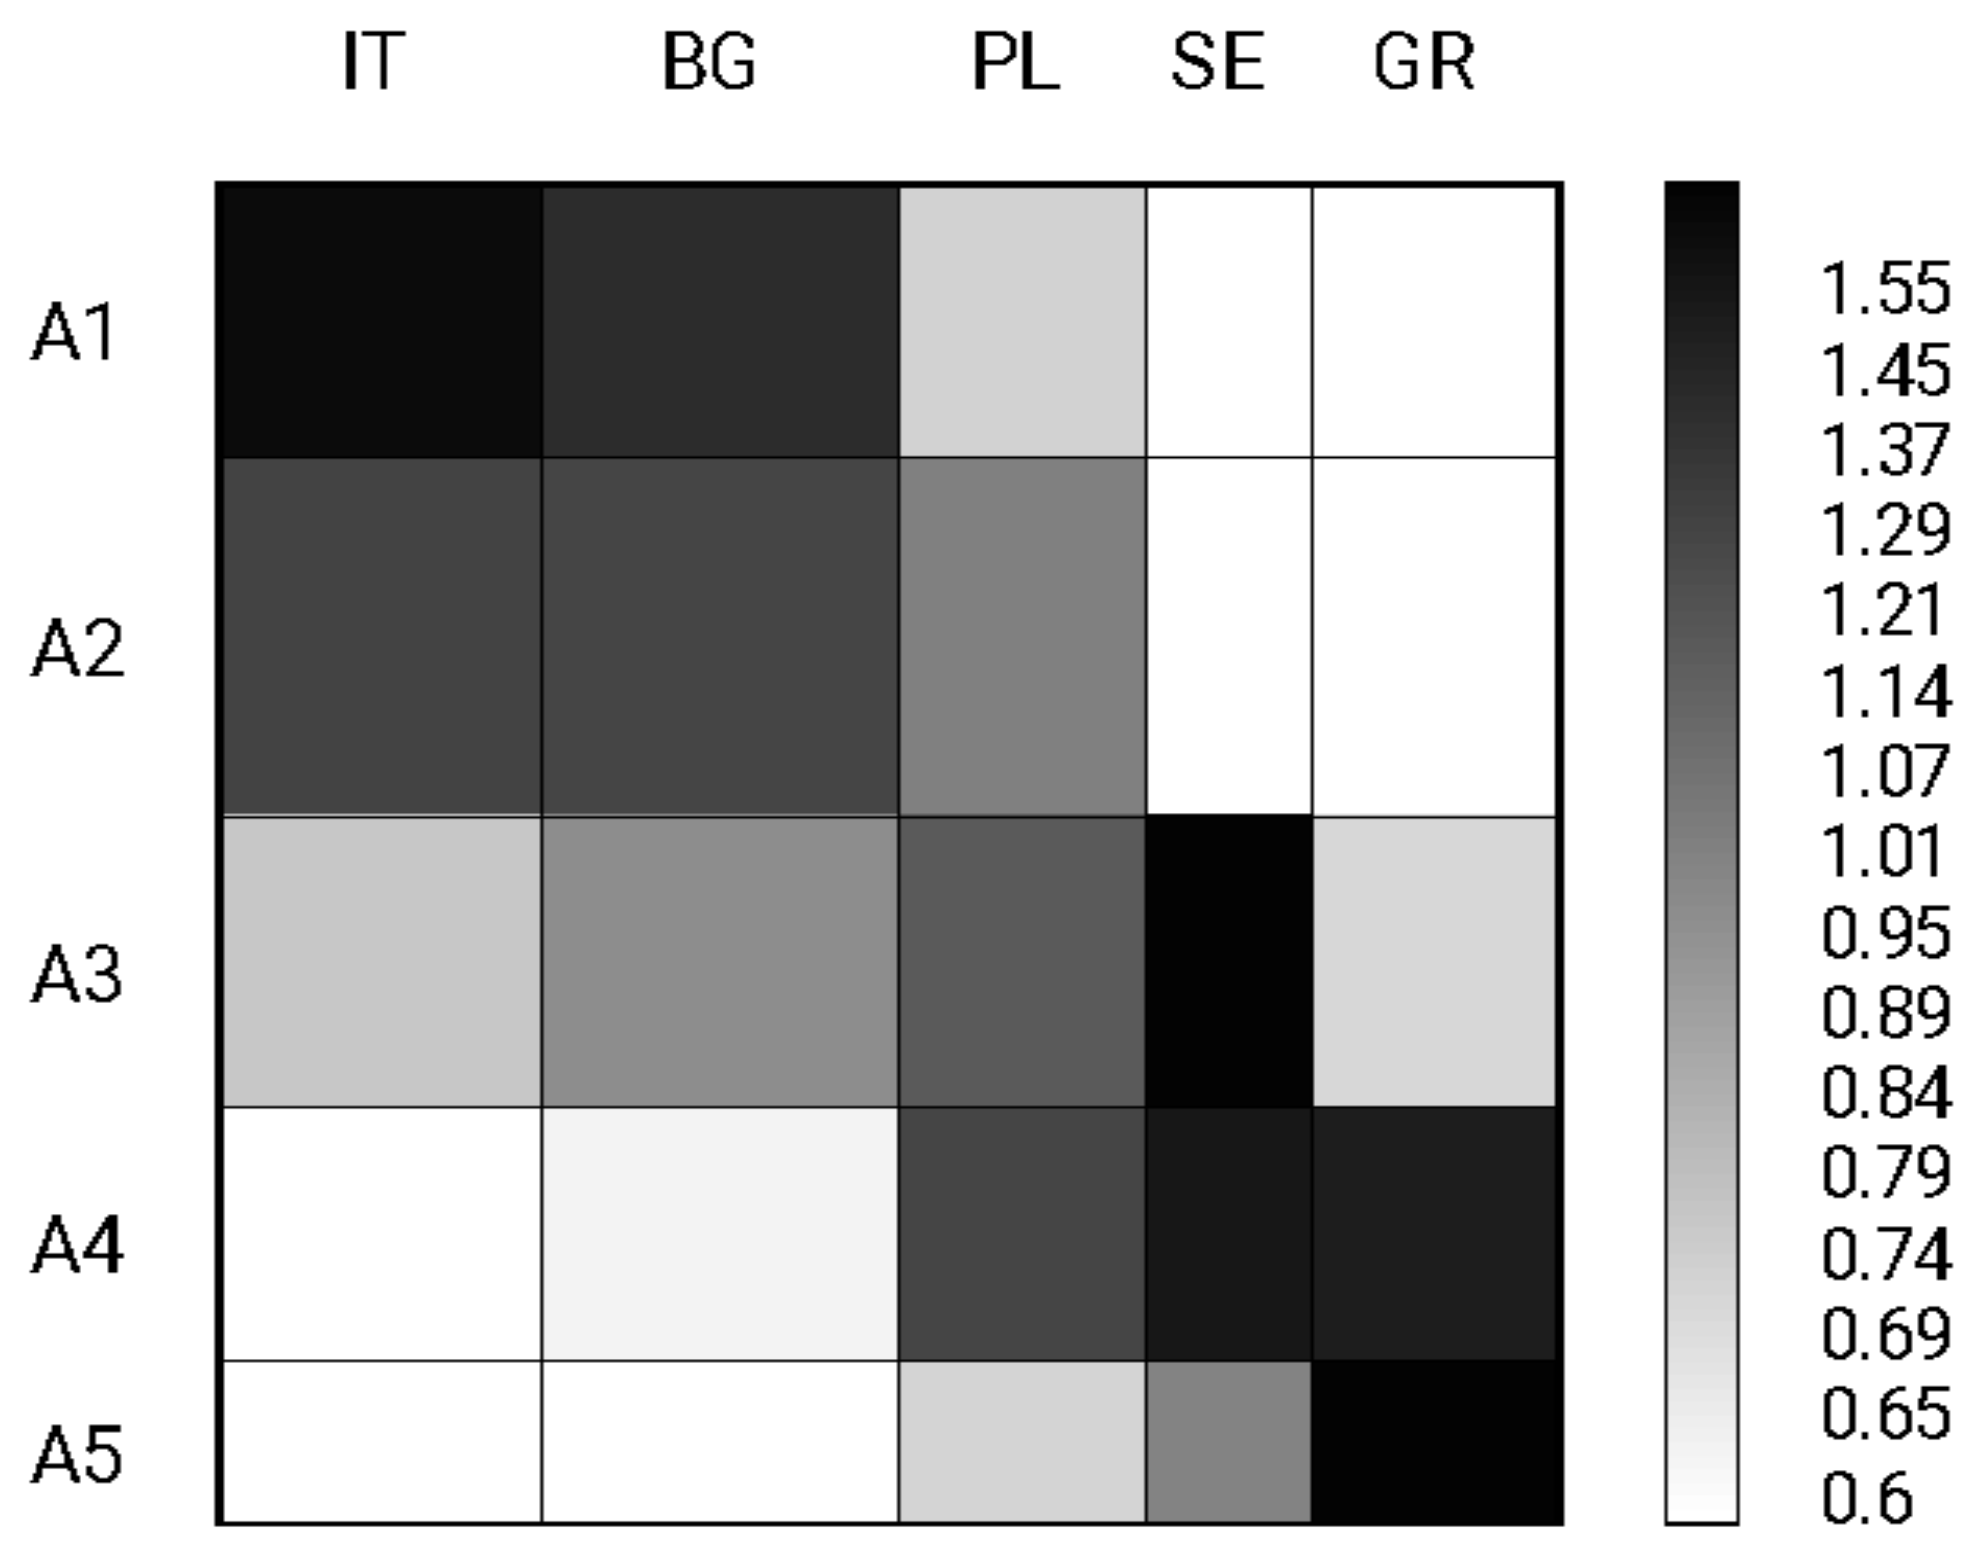
GCA was the sum of the multivariate data analysis techniques, which can be used to graphically show the dynamics of phenomena or polarities between objects in the shape of overrepresentation maps. The so-called overrepresentation maps, which illustrate each underrepresentation and overrepresentation of compositions describing a given subject by contrasting them with average results of these compositions, are of special significance. The GCA algorithm (called grid-based clustering algorithm) also permits the creation of groups, but it makes them in a way which allows the generation of objects that are specified by the greatest possible polarity among themselves. The clusters are formed as an effect of combining objects, which ensure such polarization, and for this objective, some of the independence index, Ro or Tau, is being optimized. Overrepresentation is the relation of the component compositions to the average quantity. As an average, we mean the ratio of the sum of the values. After determining the average quantities, we can count the so-called “overrepresentation indicators”. This indicator shows how far the observed quantity disagrees from that which would be awaited given the ideal proportion of the distribution. For a perfect representation, the index will take the value one. The determined overrepresentation coefficients permit illustration the “map of overrepresentation”. With appropriate quantities of the indexes, different shades of grey are coded (the overrepresentation map for the ratable distribution would be evenly grey without any shades). This map is a square with flankes equal to one. In this case, the rows are types of the answer, on the other hand the columns are countries. Colors present overrepresentation (extreme black) and underrepresentation (extreme white). This map has rows and columns to diversify heights and widths:
-
height is specified by the percentage share of particular answer variant in all answers;
-
width of the columns is the number of answers in a particular country.
The main question in GDA is studying the heterogeneity of rows and columns and the aspiration to organize them in the data matrix to achieve the maximum difference among the outermost rows and columns. The goal is made by the GCA (called Grade Correspondence Analysis) algorithm. This algorithm changes the columns and rows of the data matrix to optimize a certain dependency coefficient. Only the columns are changed as the rows are in an unchanged order. This dependency indicator is the Kendall’s tau or rho-Spearman correlation coefficient and relies especially on the dissimilarity index “ar”. Basing on these indexes, clusters are made to maximize the difference between them.
We used grade data analysis to see multidimensional differences, such as different groups from different countries on one graph to visualize the differences.
These groups are formed as an effect of joining objects that guarantee such differences, and for this aim a certain independence indicator, Ro or Tau, is optimized [62].
In the literature are many proposals for the building of structure dissimilarity indexes. Distances are frequently used for this goal, e.g., Minkowski metric [63].
d x , y = i = 1 n x i y i p ) 1 p
If we have two configuration: x and y, where:
x i 0                   i = 1 n x i = 1                   y i 0                           i = 1 n y i = 1    
this measure for sure meets two cases:
  • The distance betwixt objects with the similarly structure is equivalent to “0”, so: d(x, x) = 0
  • The length betwixt the Y object and the X object is the similarly as between X and Y and it is not smaller than “0”, that is: d(x, y) ≥ 0
n k > j > i 1 d x , x i j , ε d x , x i k , ε
One can have little doubt as to the correctness of the execution of the third requirement by the dissimilarity indicator:
3.
The length measure changes appropriately to the “transfer sensitivity” accepted in the concentration indexes, where the increase in the quantity of the dissimilarity indicator at a fixed transfer quantity is larger the “richer” object is that was transferred.
x = ( x 1 , ,   x i , ,   x j , , x k , ,   x n )  
x i j , ε = ( x 1 , ,   x i ε , ,   x j + ε , , x k , ,   x n )  
x i k , ε = ( x 1 , ,   x i ε , ,   x j , , x k + ε , ,   x n )  
The structure of the dissimilarity indicator of structures meeting the requirement 3 can then depend on the concentration indicator (Gini coefficient) and the Lorentz curve [64].
In the case of the Lorentz curve, the difference of the Y structure to the X construction can be shown as a broken line connecting some points, which in this case, have the coordinates next to the cumulative structures, and the size of the difference of the Y structure to the X construction is, also by analogy—now with the Gini coefficient—is the size “ar”.
a r y : x = a r C y : x = 1 2 0 1 C y : x t d t
where: C y : x : 0 , 1 0 , 1 belongs to the cluster of continuous functions.
Visualization of the structures was conducted with the utilization of overrepresentation maps. Overrepresentation is the ratio of the component construction to the average quantity. The algorithm changes the columns and rows of the data matrix to maximize some of the dependency ratio.
The second method of testing is the Student’s t-test for two populations. With these tests we verify the hypothesis of equality of average values in the two populations, i.e., we hypothesize [65]:
H 0 :   μ 1 = μ 2
against one of the alternative hypotheses:
H 1 :         1 .     μ 1 μ 2 ;       2 .   μ 1 > μ 2 ;       3 .   μ 1 < μ 2
Depending on the type and abundance of data we have, we choose the appropriate type of test—for unrelated variables or for related variables.
We assume normality of the distributions and homogeneity of the variances within the groups. To determine the test statistic, we first determine the following: the mean value among the subjects, the size of the two groups, the variance in the tested groups:
t = x ¯ 1 x ¯ 2 n 1 S 1 2 + n 1 S 2 2 n 1 + n 2 2 1 n 1 + 1 n 2
The third method utilized for calculation is chi-square test of independence (called chi-square test of association), to identify whether two categorical variables are connected. The chi-square test of independence calculation focusses on the observed frequencies, which are the numbers of perceptions in each combined cluster. Null hypothesis is verified: variable 1 and variable 2 are not connected in the population, contrary to the optional hypothesis that variable 1 and variable 2 are connected in the population (the ratio of variable 1 are not identical and there are different quantities of variable 2). Test statistics were calculated according to the following formula [66]:
χ 2 = i , j ( O i , j E ^ i , j ) 2 E ^ i , j
where: O is the observed frequency and E is the expected frequency.
One would reject the null hypothesis, if the calculated χ 2 test statistic is higher than the critical χ 2 value based on the degrees of freedom and α level.
Descriptive, graphic and tabular methods were also used to show some of the findings.

3. Results

3.1. Level of Student Satisfaction with Online Activities

In the first stage of the research, a questionnaire was prepared. Then a questionnaire survey was conducted among students. Online questionnaires were used. In the second stage of the study, students’ satisfaction with online classes was determined. Students asked about the satisfaction from online classes rated this type of learning with grades from one to five, where five was the highest grade. The highest mean value of rates was in Italy (4.3436), then in Bulgaria (4.0278). The lowest notes were in Greece (mean value 3.1946) and in Sweden (3.2900) (Table 2). Based on the results of the test for inequality of the means presented in Table 2, we can conclude that the mean value of rates for Italy is statistically significantly higher than the mean value for other countries. Moreover, the mean value of rates for Bulgaria is statistically significantly higher than for Greece, Poland and Sweden, but the mean values of rates from Sweden and Greece do not statistically differ.
Among all the fields of study, students of social sciences and economics assessed the highest their satisfaction from online activities (Table 3). The lowest notes were in Technical sciences (mean value 3.4393) and in Natural sciences (3.4931).
To visualize the distribution of individual ratings we can use the overrepresentation maps using the GradeStat software (Figure 3). It shows the high of the row is the lowest for grade one, which means that there were less responses indicating one, and the highest row is for grade four, which means that it was the most common response from all responses for all studied countries. The width of the column indicates the total number of responses in each country (the widest column belongs to Bulgaria, the narrowest to Sweden). The dark color denotes the highest share of a given rating in all ratings compared to the average of all surveyed countries, which means that students in Greece students most often chose one out of all countries (overrepresentation), and students in Italy most often chose five. The white color means underrepresentation, so we can see that in Italy the least chosen was one, while in Sweden and Greece the rare grade was five in comparison to the all rates from all the surveyed countries.
Taking into account the countries and the fields of study, the chi-square test of independence (Table 4) proved that they have an impact on the students’ assessment. There is a significant difference between the country and the type of response on the satisfaction from online classes provided. There was the lower but still significant dependence between the field of study and type of response, which indicates that there are also other factors determining the response specific for the country or university, but there was not such dependency whether students had previous experiences in e-learning or not.
Where:
  • Q1: How do you rate the courses of online classes during pandemic?—rate on a scale of 1 to 5 where 1 is not satisfied at all and 5 really satisfied
  • Q2: During online lectures, I take an active part in lectures; I am involved and listen carefully-rate on a scale of 1 to 5 where 1 is “I completely disagree” and 5 is “I fully agree”.
  • Q3: During face-to-face lectures, I take an active part in lectures; I am involved and listen carefully-rate on a scale of 1 to 5 where 1 is “I completely disagree” and 5 is “I fully agree”.
  • Q2–Q3: Differences between responses on the questions Q2 and Q3
  • Q4: Please, evaluate the following statements: Online classes were attractive for students.
  • Q5: Please, evaluate the following statements: Teachers were not prepared for the online classes.
It is interesting that the students who rated the classes as being worse, did not listen less carefully than the students who rated the classes as being better (like students of technical sciences who were not worse listeners).

3.2. Difficulties and Advantages in Online Learning

The next stage of the study addressed the difficulties and advantages for distance learning in each country. Students were asked about their assessment of activity during traditional (face to face classes) and online classes. Table 5 shows how statistically different the answers were to the question about the activity of students during online classes between countries. It turned out that apart from the pairs Greece–Sweden, Greece–Poland and Sweden–Poland, all other average scores differ statistically significantly. The assessment of online activity by students in Italy is statistically higher than in other countries.
In Table 6 the results of the inequality test of the means shows that students of social sciences were active and the most involved according to their opinion (mean value 3.80), while the most passive during the online classes were students of technical sciences and others (3.12 and 3.02, respectively).
A more detailed picture of the distribution of answers to this question concerning students’ activity during online classes is presented in the overrepresentation map (Figure 4). It can be noticed that the most frequent answers were between three and five. The fewest answers were with a grade of one. Out of all countries, the highest share of very good (five score) grades for online classes was in Italy and Bulgaria. In the remaining countries, the five rating was relatively rarely given. Relatively, the highest number of very low ratings (one) was given in Sweden.
In order to accurately assess the activity of students during online classes, they were also asked about the assessment of activity during traditional, face to face classes. Student activity during face to face classes was rated higher (all-country average 3.744) than activity during online classes (mean 3.410). This means that there is potential for improvement in activating students during online classes.
Figure 5 depicts the distribution of answers to this question concerning students’ activity during face-to-face classes. We observe that there are no clear regularities, as it was in the case of online classes. The only exception is Bulgaria, where the average assessment of student activity in traditional classes is statistically lower than in other countries.
In general, the assessment of students’ activity during online classes is lower than during traditional face to face classes. Nevertheless, not all countries had such a noticeable pattern of regularities. In Poland, Greece and Sweden, the activity of students during online classes is statistically lower than during face to face classes (Table 7). These differences range from 0.5503 to 0.7200 points. On the other hand, in the case of Bulgaria, the situation is the opposite—the evaluation of online classes is statistically higher by an average of 0.2176. In the case of Italy, the differences in the assessment of this aspect of the classes are not statistically significant.
The surveyed students admitted that they were quite well prepared for online classes. A total of 57.13% of students from all countries chose to either agree or fully agree. The degree of preparation for online classes is strongly correlated with the overall rating of online classes (and the assessment of student involvement in these classes). The best preparation for online classes is declared by students in Italy and Bulgaria, where 76.92% and 69.44% of the respondents agree or fully agree, respectively. In Greece, such responses were declared by 42.28% of respondents, and in Sweden by 46.00%.
Another aspect of online classes studied was their attractiveness to students. Table 8 shows the results of these studies. They show that students assessed the online classes best in Italy, where the share of “agree” or “fully agree” answers amounted to 71.79%. Italy’s first place is no surprise given the extensive experience of the Italian public university in conducting online classes. The online classes were also assessed positively by students in Poland (61.07%) and Bulgaria (59.26).
The map of overrepresentation clearly shows that Italy, Bulgaria and Poland stand out positively against the background of other countries (Figure 6). On the other side are Sweden and Greece, where the responses “disagree” and “completely disagree” prevail (together 46.00% and 43.62%, respectively). This is quite a high share, taking into account the fact that on average in all countries such responses were 29.06%.

3.3. Teachers Preparation for Online Classes

The fourth stage of the study concerned the assessment of the teachers’ preparation for online classes. Another question concerned the assessment of the teachers’ lack of preparation for conducting online classes. Among all countries, Greece stands out, where as many as 63.09% of respondents agree or fully agree with this statement. In the case of Italy and Bulgaria, only around 16% of students indicated that this statement is correct. It can be concluded that the attractiveness of online classes largely depends on the appropriate preparation of the teachers. The overrepresentation map (Figure 7) clearly indicates that the share of responses, in which students disagree or completely disagree (42.85%), is greater than those in which students agree or fully agree (33.92%). At the same time, extreme answers (completely disagree, fully agree) prevail in Italy and Greece.
Students who believed that teachers were not adequately prepared for classes indicated not only that teachers encountered difficulties in adapting to the new pandemic situation but also that teachers did not know the tools used in online teaching well (Figure 8). Students of economy and sociology rated this response the highest (mean value of the rate was over 2.5), which means they agreed that their lecturers were not prepared. It is surprising taking into account that on the same survey they also rated high their satisfaction from their online classes.
The row’s height is the lowest for answer A5, which means that there were the least responses indicating that teachers’ unpreparedness for online classes was due to the fact that they did not have enough time (Figure 8). The highest row is for answer A2, which means that difficulties in adapting to the new pandemic situation were the most common response from all responses for all studied countries. The width of the column indicates the total number of responses in each country. The widest column belongs to Greece, the narrowest to Italy. The dark color in the SE column denotes the highest share of an answer A4 compared to the average of all surveyed countries, which means that students in Sweden most often chose A4 (“They felt lost”) out of all countries (overrepresentation), while on the other hand, students from Italy chose this answer (A4) the least often.

3.4. Elements Affecting the Quality of Online Activities

The fifth stage involved gathering students’ opinions on the elements that affect the quality of online classes compared to face-to-face classes. Among the main elements that make difference in the quality of online and face-to-face classes students point out the issues of socializing, the flexibility of distance learning, more student/teacher feedback and more detailed explanation of difficult issues (Table 9). As the results show students are fully aware of the main pros and cons of online and face-to-face classes and find advantages in both types of classes. Additionally, over half of Italian students indicated the value of the flexibility in distance learning. Italians are the group most experienced in online classes among the respondents. Online education was provided there in all types of universities. On the other hand, students from other countries with the predominant classroom form emphasize the value of socializing in a face-to-face form.

4. Discussion

E-learning in many Universities around the world was not much developed and popular before the pandemic. According to Pham and Ho [67], in Vietnam in 2016, only 2% of university students were involved in remote learning. According to Ruiz-Alonso-Bartol et al. [68], in the same year in the US, 31.6% of students had taken at least one online course. According to Hebert et al. [69], the problem affected not only students but also lecturers. Based on a study in four public regional universities in the southern USA, it was found that only 43% had taught online courses before the pandemic. In our study, we obtained similar results with regard to students’ university origin. In most countries, there was a small percent of students who had previously had online classes. The exception was Italy, with a very high proportion of such students. The proportion of students and teachers who had previously taken online classes may be related to a country’s level of development, but also to a number of other factors, such as society’s readiness for change.
Even before the pandemic, there was quite a lot of research on student satisfaction with online classes. For example, Blake [70], Levy et al. [71] and Stickler and Hampel [72] pointed out the importance of the lecturer’s commitment and positive attitude. The effectiveness of a new technology and online course depends largely on the skills of the lecturer and their ability to create a comfortable learning environment. Sarwar et al. [73], based on a study on dental students in Pakistan, found that first-year students in particular were not satisfied with this method of learning, which may be due to poor interaction with teachers. Ali et al. [74] also stated in his study in Pakistan that students rated online learning as unproductive. According to Pastor [75], dissatisfaction was also reported by the majority of students in the Philippines, with connectivity problems being the main reason. Thus, these were technological barriers. In economically developed countries, such problems should be limited. Baber [76], based on a study of students in South Korea and India, found that the following factors had a positive impact on student satisfaction: student motivation; classroom interaction; instructor knowledge and facilitation; course structure. These results were the same in both countries. Similar relationships were pointed out by Xu et al. [77] using China as an example. In our study, we obtained inconclusive results. The highest satisfaction was in Italy. In a study by Rossettini et al. [78], students’ satisfaction with online learning was also confirmed to be high and, interestingly, it was higher than in the case of face-to-face classes. In a study by Szopinski and Bachnik [79], differences in student satisfaction depending on nationality were confirmed. Students from Poland, Ukraine and Belarus were studied. The level of satisfaction was higher among Polish students. In Angelov’s [80] study of Bulgaria, it was found that students rated online classes as much as traditional lectures in auditoriums. In our study, the ratings of Bulgarian students were also very high. Giannoulas et al. [81] conducted a study among Greek students. They found a low evaluation of student satisfaction with online classes, which was mainly due to technical problems. Interestingly, despite the negative ratings, students were interested in remote learning in the future. In our study, Greek students were the least happy with remote learning. Warfvinge et al. [82] found low satisfaction with remote learning among Swedish students. Above all, less feedback from lecturers was a problem. In our study, Swedish students also showed low evaluation rate of online learning.
Ghasem and Ghannam [83], based on a study in the United Arab Emirates, found that students in online classes reported difficulty in concentrating during online lessons with limited student–instructor interactions. In general, there is no unanimity across countries regarding satisfaction with classes. For example, Tuaycharoen [84], based on a study of Thai students, found very high levels of satisfaction with online classes with a mean score of 4.54 on a 5-point Likert Scale. In our study in Italy, we obtained a score of 4.34. Shalatska et al. [85] found that, for a good evaluation, students depended on a personalized approach to the learning process, easily accessible and quick feedback and interactive methods. Qi and Liu [86], based on massive open online courses (MOOCs), identified the criteria that are most important in evaluating online courses. These were instructor, course content, course evaluation, online platform, and course timeliness. Again, attention is drawn to the aspect related to the lecturer and their key role. Agyeiwaah et al. [87] in their study highlighted the attributes of remote learning. These were: transparency and reliability; stimulation and appeal; and usability and innovation. Khan et al. [88] found that ICT knowledge was one of the most important factors affecting the quality of online classes. In our study, students also indicated this problem.
According to Puljak et al. [89], although students were mostly adaptable to e-learning, they felt that e-learning could not replace traditional classes. Stanistreet et al. [90] claim that there was little readiness to suddenly switch to remote education on both sides—students and lecturers. Rony and Awal [91] pointed out the lack of instruction for lecturers in the early stages of the pandemic. Ramos-Pla et al. [92] found that difficulties were the lack of time to adapt teaching practice to the knowledge gained, as well as the complexity of conducting online evaluations. In our study, students also highlighted those aspects on the side of the lecturers. It can be concluded that each side saw problems and had concerns. Once again, the importance of human interactions that may have been responsible for the perception and evaluation of distance learning needs to be emphasized. Such relationships have been highlighted in many studies, such as Cidral et al. [93], Joo et al. [94]. Schleicher [95] states that in online learning more autonomy, self-regulation and remote learning skills are required from students in order to learn effectively. Keržič et al. [96] did one of the few comprehensive studies on online learning. They examined students’ evaluation of online learning in a sample of 10,092 university students from 10 countries on four continents during the first pandemic wave. They found that the main determinants of e-learning advantage were service quality and overall system quality. Less, but still important, were online interactions with other students and teachers and students’ computer skills. The results confirm previous findings. Students see a large role of the system and the way lecturers provide services for a high evaluation of the quality of education. In our study, we found similar results, with students additionally noting the flexibility of distance learning. Aristovnik et al. [97], based on the same database as Keržič et al. [96], presented results from a sample of 31,212 students from 133 countries. The data were collected as part of CovidSocLab [98]. More than 1,000 responses were collected in 10 countries (Poland, Mexico, Turkey, Italy, India, Chile, Ecuador, Portugal, Bangladesh, Slovenia); between 500 and 1000 responses in seven countries (Romania, Pakistan, Croatia, Indonesia, Hungary, Brazil, Ghana); between 200 and 500 answers were collected in 19 nations; a total of 2911 answers were collected in 41 nations with between 10 and 200 answers; and a total of 130 answers were collected in 56 nations with less than 10 answers. In particular, responses from the former group may influence the final result. Poland and Italy were in this group. Student satisfaction with videoconferencing was rated positively by 54.9% of respondents, with recorded videos by 43.6%. Aspects related to the timely response of the teaching staff were rated positively by 46.1% of respondents, and the support of the teaching staff by 48.4%. In our study, apart from Italy, we also obtained quite low scores for the evaluation of online classes. The aspects given were also identified as being key to improving the quality of online teaching. Crawford et al. [99], based on a study in 20 countries, found that the adaptation of universities to the pandemic situation varied, from social isolation tactics on campus to rapid remodelling of curricula to achieve fully online learning. In the European Commission survey, the majority of universities agreed that they had a scheme to increase digital ability (75%) and explore new methods of teaching (92%) outside the crisis [100]. This is why digital and online education does not appear mainly as a contingency experiment during COVID-19. The pandemic has produced a new group of students who were previously not fully interested in online learning [101]. Therefore, universities are interested in expanding their online programs may also initiate additional online courses. Adequate IT support and teacher training must be provided to ensure quality online education. New specialists such as course designers, multimedia specialists and support staff, production specialists may need to be recruited. Their task will be to design and create online materials and provide support [102].

5. Conclusions and Recommendations

5.1. Conclusions

From our study point of view it was important that students got used to online classes after some time and then, after returning to face-to-face classes, they had time for reflection and a different perspective on e-learning. Therefore the questionnaire, which they filled in, was just after the pandemic and was referring to the situation during and after it. The conducted research allows for a few generalizations.
  • Students evaluate online courses much better in countries/universities with a long tradition in online teaching and usage of interactive platforms, than in those without them. In these countries, the students’ grades for online courses are the same or even lower than the grades for face-to-face courses.
  • Students generally rated in-person learning better than online learning, and their rating depended slightly on their previous experience of online learning. The most satisfied students were from the economic and social sciences, while the least satisfied were from the technical sciences. It may be associated with higher requirements of students of technical sciences and the fact that their classes require specialized software usually available only in university computer rooms. The solution is to connect remotely with computer laboratory stations.
  • The degree of preparation for online classes is strongly correlated with the overall evaluation of these classes. Among the main problems of such classes, socialization issues, too little flexibility, insufficient feedback from teachers (students) were mentioned.
  • The survey shows that the attractiveness of the online courses is strongly conditioned by the content of engaging, involving and stimulating elements. Students also largely evaluate teachers conducting online classes through the interactive content of courses.
  • Students who believed that teachers were not adequately prepared for online classes indicated not only that teachers encountered difficulties in adapting to the new pandemic situation, but also that teachers did not know the tools used in online teaching fluently.
  • There is the need for the development of interactive tools and training for teachers, which will increase the attractiveness of online classes for students.
  • Many common aspects related to the assessment of online learning have been identified. Nevertheless, it is difficult to develop a single model for all countries. There were countries that did better in the pandemic with remote learning, and there were also countries with arising problems. It is crucial to know the technical, economic and, above all, social conditions of such education and do the transfer of the best practice from the more experienced countries to those facing more difficulties.

5.2. Recommendations

The research showed an evaluation of the online learning process at universities in several EU countries during the pandemic. We encountered only one example of research on a group of countries. The results were interesting, but contained many diverse countries. Research on a group of countries from the same continent or economic group would be valuable. Another study could cover the group of all EU countries, it would then be possible to draw conclusions about distance learning in the EU, but our pilot study on chosen countries shows diversity, which is also related to technological development. Certainly, the pandemic is a new situation and online education will not just be an emergency education, as elearning will become more common in countries where it has been limited in scope. It would therefore be worthwhile to find out the regularities, evaluations and expectations of students across the EU, to compensate the disproportions.
A limitation of conducting such research is the lack of up-to-date and detailed data available. Such data need to be obtained through the collaboration of researchers from universities in EU countries. A possible direction for further research is to link remote education to knowledge and grades obtained in the period before and during the pandemic. Measurable aspects of the pandemic would be worth investigating. Similarly, the research could involve all EU countries. This type of research could be a research gap to be filled.

Author Contributions

Conceptualization, L.O., T.R., K.C., G.K. and M.H.; Data curation, L.O., K.C., G.K. and M.H.; Formal analysis, L.O., K.C., G.K. and M.H.; Funding acquisition, L.O., T.R. and K.C.; Investigation, L.O. and T.R.; Methodology, L.O., T.R., K.C., G.K. and M.H.; Project administration, L.O. and T.R.; Resources, L.O., T.R., K.C., G.K. and M.H.; Software, L.O., T.R., K.C., G.K. and M.H.; Supervision, L.O. and T.R.; Validation, L.O., T.R., K.C., G.K. and M.H.; Visualization, L.O., T.R., K.C., G.K. and M.H.; Writing—original draft, L.O., T.R., K.C., G.K., M.H. and A.P.; Writing—review & editing, L.O., T.R., K.C., G.K., M.H. and A.P. All authors have read and agreed to the published version of the manuscript.

Funding

This work was supported by Erasmus + Programme of the European Union, project nr 2020-1-PL01-KA226-HE-095331: Digital Roadmap for designing online interactive content.

Institutional Review Board Statement

Not applicable.

Informed Consent Statement

Not applicable.

Data Availability Statement

Not applicable.

Acknowledgments

All the authors would like to thank project participants from partner organizations of countries involved (CRES, Dimitra, ITPIO, Uninettuno, UNWE) for their valuable input in preparing the survey and collecting responses.

Conflicts of Interest

The authors declare no conflict of interest.

Appendix A

No.QuestionAnswer Choices/Rate Scales (the Higher the Better)
1.As a student:
(a)
I have only online classes at this University.
(b)
I already had traditional and online classes.
2.Thematic area of my studies (scientific disciplines):
(a)
Technical sciences, technology, mathematics, etc.
(b)
Social sciences, humanities and art.
(c)
Economy, management, finance, business, etc.
(d)
Natural sciences.
(e)
Others.
3.Country of my study:
(a)
Poland
(b)
Greece
(c)
Sweden
(d)
Italy
(e)
Bulgaria
(f)
other
4.How do you rate the courses of online classes during pandemic?a-1/b-2/c-3/d-4/e-5
5.During online lectures, I take an active part in lectures; I am involved and listen carefully:a-1/b-2/c-3/d-4/e-5
6.During stationary lectures, I take an active part in lectures; I am involved and listen carefully:a-1/b-2/c-3/d-4/e-5
7.Please, evaluate the following statements:
(1)
I feel well prepared for online learning.
(2)
Online classes were attractive for students.
(3)
The online classes contained elements engaging students, activating them.
(4)
The use of new digital teaching methods motivates me to learn.
(5)
Teachers were not prepared to the online classes.
(6)
On-line classes were boring and without interactive content.
(7)
I feel there is a lack of interactive courses on my Faculty/University or didactic platforms.
(a)
Strongly disagree
(b)
Disagree
(c)
Neutral
(d)
Agree
(e)
Strongly Agree
8.Which are the most interesting and effective parts of the activities during your online classes?
(a)
films/recorded lectures
(b)
live meetings with lecturer
(c)
quiz
(d)
interactive tasks
(e)
gamification elements
(f)
competitions/contest/rivalry
(g)
activating elements, causing concentration
(h)
didactic games
(i)
other-empty field
9.Which activities you would like to have as a new or to keep during your online classes (multiple choice):
(a)
films/recorded lectures
(b)
live meetings with lecturer
(c)
quiz
(d)
interactive tasks
(e)
gamification elements
(f)
competitions/contest/rivalry
(g)
activating elements, causing concentration
(h)
didactic games
(i)
other-empty field
10.What should be done differently in order to increase effectiveness of learning. Which activity from the following could increase effectiveness of online learning the most:
(a)
some interactive animations
(b)
more quizzes
(c)
recorded lectures
(d)
didactic games
(e)
user-friendly graphics
(f)
interesting design
(g)
more self-learning
11.What would be more motivating for you as the student. Which activity from the following could be the most motivating in learning (multiple answers possible):
(a)
interesting design of the course
(b)
interactive content
(c)
gamification elements
(d)
quizzes
(e)
competition/rivalry
(f)
more self-learning
12.Do you prefer real-time lessons or blocks that you work by yourself at any time:
(a)
real-time classes
(b)
e-learning - blocks/paths to work by myself
13.If you had mixed classes, what percentage of classes to work by yourself would you prefer?10%; 30%; 50%; 70%; 90%

References

  1. Bhardwaj, A. Importance of education in human life: A holistic approach. Int. J. Sci. Conscious. 2016, 2, 23–28. [Google Scholar]
  2. Van, V.H. Social responsibility of students: The role and importance of education. J. Nat. Remedies 2020, 21, 241–254. [Google Scholar]
  3. Van Luong, P.; Van, V.H. Protecting the Environment with Human Health: The Role of Education. Ann. Rom. Soc. Cell Biol. 2021, 25, 559–569. [Google Scholar]
  4. Dangnguyen, L. The role of teachers in assessing educational quality: An experimental study. Rev. Line Política Gestão Educ. 2022, 26, e022022. [Google Scholar] [CrossRef]
  5. Enciso, O.L.U.; Enciso, D.S.U.; Daza, M.D.P.V. Critical thinking and its importance in education: Some reflections. Rastros Rostros 2017, 19, 78–88. [Google Scholar]
  6. Smith, W.C.; Fraser, P.; Chykina, V.; Ikoma, S.; Levitan, J.; Liu, J.; Mahfouz, J. Global citizenship and the importance of education in a globally integrated world. Glob. Soc. Educ. 2017, 15, 648–665. [Google Scholar] [CrossRef]
  7. Bhardwaj, B.R. Impact of education and training on performance of women entrepreneurs: A study in emerging market context. J. Entrep. Emerg. Econ. 2014, 6, 38–52. [Google Scholar] [CrossRef]
  8. Galvão, A.; Marques, C.; Ferreira, J.J. The role of entrepreneurship education and training programmes in advancing entrepreneurial skills and new ventures. Eur. J. Train. Dev. 2020, 44, 595–614. [Google Scholar] [CrossRef]
  9. Berends, M. The continuing evolution of school choice in America. In The Wiley Handbook of Educational Policy; John Wiley & Sons: Hoboken, NJ, USA, 2018; pp. 97–118. [Google Scholar]
  10. Berkowitz, M.W. What works in values education. Int. J. Educ. Res. 2011, 50, 153–158. [Google Scholar] [CrossRef]
  11. Lipset, S.M. Values, education, and entrepreneurship. In Promise of Development; Routledge: London, UK, 2018; pp. 39–75. [Google Scholar]
  12. Hess, D.J.; Maki, A. Climate change belief, sustainability education, and political values: Assessing the need for higher-education curriculum reform. J. Clean. Prod. 2019, 228, 1157–1166. [Google Scholar] [CrossRef]
  13. Majid, S.; Liming, Z.; Tong, S.; Raihana, S. Importance of soft skills for education and career success. Int. J. Cross-Discip. Subj. Educ. 2012, 2, 1037–1042. [Google Scholar] [CrossRef]
  14. Rokicki, T.; Perkowska, A.; Klepacki, B.; Szczepaniuk, H.; Szczepaniuk, E.K.; Bereziński, S.; Ziółkowska, P. The importance of higher education in the EU countries in achieving the objectives of the circular economy in the energy sector. Energies 2020, 13, 4407. [Google Scholar] [CrossRef]
  15. Hassan, M.S.; Hassan, O. Higher Education and Creation of Jobs in Bangladesh. Eur. J. Teach. Educ. 2020, 2, 92–100. [Google Scholar] [CrossRef]
  16. World Health Organization. WHO Coronavirus Disease (COVID-19) Dashboard. Available online: https://www.who.int/health-topics/coronavirus#tab=tab_1 (accessed on 29 July 2022).
  17. Chen, N.; Zhou, M.; Dong, X.; Qu, J.; Gong, F.; Han, Y.; Yu, T. Epidemiological and clinical characteristics of 99 cases of 2019 novel coronavirus pneumonia in Wuhan, China: A descriptive study. Lancet 2020, 395, 507–513. [Google Scholar] [CrossRef] [Green Version]
  18. Huang, C.; Wang, Y.; Li, X.; Ren, L.; Zhao, J.; Hu, Y.; Cheng, Z. Clinical features of patients infected with 2019 novel coronavirus in Wuhan, China. Lancet 2020, 395, 497–506. [Google Scholar] [CrossRef]
  19. Lu, H.; Stratton, C.W.; Tang, Y.W. Outbreak of pneumonia of unknown etiology in Wuhan, China: The mystery and the miracle. J. Med. Virol. 2020, 92, 401. [Google Scholar] [CrossRef]
  20. Lu, H.; Stratton, C.W.; Tang, Y.W. The Wuhan SARS-CoV-2—What’s next for China. J. Med. Virol. 2020, 92, 546–547. [Google Scholar] [CrossRef]
  21. World Health Organization. WHO Director-General’s Opening Remarks at the Media Briefing on COVID-19–11 March 2020. Available online: https://www.who.int/dg/speeches/detail/who-director-general-s-opening-remarks-at-the-media-briefing-on-COVID-19---11-march-2020 (accessed on 29 July 2022).
  22. World Health Organization. WHO Coronavirus Disease (COVID-19) Dashboard. 2020. Available online: https://COVID19.who.int/ (accessed on 29 July 2022).
  23. Jarynowski, A.; Wójta-Kempa, M.; Płatek, D.; Czopek, K. Attempt to understand public health relevant social dimensions of COVID-19 outbreak in Poland. SSRN 2020, 4, 7–44. [Google Scholar]
  24. Carlsson-Szlezak, P.; Reeves, M.; Swartz, P. Understanding the economic shock of coronavirus. Harv. Bus. Rev. 2020, 27, 4–5. [Google Scholar]
  25. Carlsson-Szlezak, P.; Reeves, M.; Swartz, P. What coronavirus could mean for the global economy. Harv. Bus. Rev. 2020, 3, 1–10. [Google Scholar]
  26. Gourinchas, P.O. Flattening the pandemic and recession curves. In Mitigating the COVID Economic Crisis: Act Fast and Do Whatever; CEPR Press: London, UK, 2020; Volume 31, pp. 57–62. [Google Scholar]
  27. Rokicki, T.; Bórawski, P.; Bełdycka-Bórawska, A.; Żak, A.; Koszela, G. Development of Electromobility in European Union Countries under COVID-19 Conditions. Energies 2022, 15, 9. [Google Scholar] [CrossRef]
  28. Baldwin, R. Keeping the lights on: Economic medicine for a medical shock. VoxEU. 13 March 2020. Available online: https://cepr.org/voxeu/columns/keeping-lights-economic-medicine-medical-shock (accessed on 29 July 2022).
  29. Abay, K.A.; Tafere, K.; Woldemichael, A. Winners and Losers from COVID-19: Global Evidence from Google Search; World Bank Policy Research Working Paper No. 9268; Elsevier: Amsterdam, The Netherlands, 2020. [Google Scholar]
  30. Slade, M.E. Many losers and a few winners: The impact of COVID-19 on Canadian industries and regions. Can. J. Econ. Rev. Can. D’économique 2022, 55, 282–307. [Google Scholar] [CrossRef]
  31. He, Y.; Wang, Y. Macroeconomic Effects of COVID-19 Pandemic: Fresh Evidence from Korea. Sustainability 2022, 14, 5100. [Google Scholar] [CrossRef]
  32. Li, S.; Zhou, Y.; Kundu, T.; Sheu, J.B. Spatiotemporal variation of the worldwide air transportation network induced by COVID-19 pandemic in 2020. Transp. Policy 2021, 111, 168–184. [Google Scholar] [CrossRef]
  33. Sun, X.; Wandelt, S.; Zhang, A. Ghostbusters: Hunting abnormal Flights in Europe during COVID-19. Transp. Policy 2020, 127, 203–217. [Google Scholar] [CrossRef] [PubMed]
  34. Sun, X.; Wandelt, S.; Zhang, A. Aviation under COVID-19 Pandemic: Status Quo and How to Proceed Further? SSRN 2022. [Google Scholar] [CrossRef]
  35. Haleem, A.; Javaid, M.; Vaishya, R. Effects of COVID-19 pandemic in daily life. Curr. Med. Res. Pract. 2020, 10, 78. [Google Scholar] [CrossRef]
  36. Sulkowski, L.; Ignatowski, G. Impact of COVID-19 pandemic on organization of religious behaviour in different Christian denominations in Poland. Religions 2020, 11, 254. [Google Scholar] [CrossRef]
  37. Hussain, M.W.; Mirza, T.; Hassan, M.M. Impact of COVID-19 pandemic on the human behavior. Int. J. Educ. Manag. Eng. 2020, 10, 35–61. [Google Scholar] [CrossRef]
  38. Škare, M.; Soriano, D.R.; Porada-Rochoń, M. Impact of COVID-19 on the travel and tourism industry. Technol. Forecast. Soc. Change 2021, 163, 120469. [Google Scholar] [CrossRef]
  39. Grix, J.; Brannagan, P.M.; Grimes, H.; Neville, R. The impact of COVID-19 on sport. Int. J. Sport Policy Politics 2021, 13, 1–12. [Google Scholar] [CrossRef]
  40. Tadesse, S.; Muluye, W. The impact of COVID-19 pandemic on education system in developing countries: A review. Open J. Soc. Sci. 2020, 8, 159–170. [Google Scholar] [CrossRef]
  41. Dubey, P.; Pandey, D. Distance learning in higher education during pandemic: Challenges and opportunities. Int. J. Indian Psychol 2020, 8, 43–46. [Google Scholar]
  42. Jung, J.; Horta, H.; Postiglione, G.A. Living in uncertainty: The COVID-19 pandemic and higher education in Hong Kong. Stud. High. Educ. 2021, 46, 107–120. [Google Scholar] [CrossRef]
  43. Corell-Almuzara, A.; López-Belmonte, J.; Marín-Marín, J.-A.; Moreno-Guerrero, A.-J. COVID-19 in the Field of Education: State of the Art. Sustainability 2021, 13, 5452. [Google Scholar] [CrossRef]
  44. König, J.; Jäger-Biela, D.J.; Glutsch, N. Adapting to online teaching during COVID-19 school closure: Teacher education and teacher competence effects among early career teachers in Germany. Eur. J. Teach. Educ. 2020, 43, 608–622. [Google Scholar] [CrossRef]
  45. Khan, R.; Bashir, A.; Basu, B.L.; Uddin, M.E. Emergency online instruction at higher education in bangladesh during COVID-19: Challenges and suggestions. J. Asia TEFL 2020, 17, 1497–1506. [Google Scholar] [CrossRef]
  46. Xiong, W.; Jiang, J.; Mok, K.H. Hong Kong university students’ online learning experiences under the COVID-19 pandemic. In Proceedings of the 3rd NCCU-Lingnan International Research Seminar, Tapei, Taiwan, 4 December 2020. [Google Scholar]
  47. Dalipi, F.; Jokela, P.; Kastrati, Z.; Kurti, A.; Elm, P. Going digital as a result of COVID-19: Insights from students’ and teachers’ impressions in a Swedish university. Int. J. Educ. Res. Open 2022, 3, 100136. [Google Scholar] [CrossRef]
  48. Adedoyin, O.B.; Soykan, E. COVID-19 pandemic and online learning: The challenges and opportunities. Interact. Learn. Environ. 2020, 1–13. [Google Scholar] [CrossRef]
  49. Zhang, W.; Wang, Y.; Yang, L.; Wang, C. Suspending classes without stopping learning: China’s education emergency management policy in the COVID-19 outbreak. J. Risk Financ. Manag. 2020, 13, 55. [Google Scholar] [CrossRef]
  50. Bao, W. COVID-19 and online teaching in higher education: A case study of Peking University. Hum. Behav. Emerg. Technol. 2020, 2, 113–115. [Google Scholar] [CrossRef]
  51. Sáiz-Manzanares, M.C.; Marticorena-Sánchez, R.; Arnáiz-González, Á.; Díez-Pastor, J.F.; Rodríguez-Arribas, S. Blended learning: An experience with infographics and virtual laboratories using Self-regulated learning. In Proceedings of the 13th International Technology, Education and Development Conference, Valencia, Spain, 11–13 March 2019; pp. 11–13. [Google Scholar]
  52. Means, B.; Toyama, Y.; Murphy, R.; Bakia, M.; Jones, K. Evaluation of Evidence-Based Practices in Online Learning: A Meta-Analysis and Review of Online Learning Studies. Available online: https://www2.ed.gov/rschstat/eval/tech/evidence-based-practices/finalreport.pdf (accessed on 29 July 2022).
  53. Hodges, C.B.; Moore, S.; Lockee, B.B.; Trust, T.; Bond, M.A. The Difference between Emergency Remote Teaching and Online Learning. 2020. Available online: http://hdl.handle.net/10919/104648 (accessed on 29 July 2022).
  54. Bozkurt, A.; Sharma, R.C. Emergency remote teaching in a time of global crisis due to CoronaVirus pandemic. Asian J. Distance Educ. 2020, 15, i–vi. [Google Scholar]
  55. Vlachopoulos, D. COVID-19: Threat or Opportunity for Online Education? COVID-19: Threat or Opportunity for Online Education? High. Learn. Res. Commun. 2020, 10, 2. [Google Scholar] [CrossRef]
  56. Young, S.; Nichols, H.; Cartwright, A. Does lecture format matter? Exploring student preferences in higher education. J. Perspect. Appl. Acad. Pract. 2020, 8. [Google Scholar] [CrossRef]
  57. Aristovnik, A.; Keržič, D.; Ravšelj, D.; Tomaževič, N.; Umek, L. Impacts of the COVID-19 pandemic on life of higher education students: A global perspective. Sustainability 2020, 12, 8438. [Google Scholar] [CrossRef]
  58. Marek, M.W.; Chew, C.S.; Wu, W.C.V. Teacher experiences in converting classes to distance learning in the COVID-19 pandemic. Int. J. Distance Educ. Technol. 2021, 19, 89–109. [Google Scholar] [CrossRef]
  59. Kerres, M. Against all odds: Education in Germany coping with COVID-19. Postdigit. Sci. Educ. 2020, 2, 690–694. [Google Scholar] [CrossRef]
  60. Gamage, K.A.; Pradeep, R.R.; Najdanovic-Visak, V.; Gunawardhana, N. Academic standards and quality assurance: The impact of COVID-19 on university degree programs. Sustainability 2020, 12, 10032. [Google Scholar] [CrossRef]
  61. Appolloni, A.; Colasanti, N.; Fantauzzi, C.; Fiorani, G.; Frondizi, R. Distance learning as a resilience strategy during COVID-19: An analysis of the Italian context. Sustainability 2021, 13, 1388. [Google Scholar] [CrossRef]
  62. Nistor, F.; Popa, C.C. The Role of Transport in Economic Development. “Mircea Cel Batran” Nav. Acad. Sci. Bull. 2014, XVII, 25–26. [Google Scholar]
  63. Rossi, G.C.; Testa, M. Euclidean versus Minkowski short distance. Phys. Rev. D 2018, 98, 054028. [Google Scholar] [CrossRef]
  64. Gutiérrez-Braojos, C.; Daniela, L.; Montejo-Gámez, J.; Aliaga, F. Developing and Comparing Indices to Evaluate Community Knowledge Building in an Educational Research Course. Sustainability 2022, 14, 10603. [Google Scholar] [CrossRef]
  65. Snedecor, G.W.; Cochran, W.G. Statistical Methods, 8th ed.; Iowa State University Press: Ames, IA, USA, 1989; pp. 24–28. [Google Scholar]
  66. Chi-Square Test of Independence. In The Concise Encyclopedia of Statistics; Springer: New York, NY, USA, 2008. [CrossRef]
  67. Pham, H.H.; Ho, T.T.H. Toward a ‘new normal’ with e-learning in Vietnamese higher education during the post COVID-19 pandemic. High. Educ. Res. Dev. 2020, 39, 1327–1331. [Google Scholar] [CrossRef]
  68. Ruiz-Alonso-Bartol, A.; Querrien, D.; Dykstra, S.; Fernández-Mira, P.; Sánchez-Gutiérrez, C. Transitioning to emergency online teaching: The experience of Spanish language learners in a US university. System 2022, 104, 102684. [Google Scholar] [CrossRef]
  69. Hebert, E.; Wood, R.; Jeon, K.; Reena, I. Faculty Making the Emergency Online Transition During the COVID-19 Pandemic: Effects of Prior Online Teaching Experience and Strategies Used to Learn to Teach Online. High. Learn. Res. Commun. 2022, 12, 4. [Google Scholar] [CrossRef]
  70. Blake, R. Best practices in online learning: Is it for everyone. In Hybrid Language Teaching and Learning: Exploring Theoretical, Pedagogical and Curricular Issues; Rubio, F., Thoms, J.J., Bourns, S.K., Eds.; Thomson Heinle: Boston, MA, USA, 2013; pp. 10–26. [Google Scholar]
  71. Levy, M.; Wang, Y.; Chen, N.S. Developing the skills and techniques for online language teaching: A focus on the process. Int. J. Innov. Lang. Learn. Teach. 2009, 3, 17–34. [Google Scholar] [CrossRef]
  72. Stickler, U.; Hampel, R. Transforming teaching: New skills for online language learning spaces. In Developing Online Language Teaching; Palgrave Macmillan: London, UK, 2015; pp. 63–77. [Google Scholar]
  73. Sarwar, H.; Akhtar, H.; Naeem, M.M.; Khan, J.A.; Waraich, K.; Shabbir, S.; Khurshid, Z. Self-reported effectiveness of e-Learning classes during COVID-19 pandemic: A nation-wide survey of Pakistani undergraduate dentistry students. Eur. J. Dent. 2020, 14, S34–S43. [Google Scholar] [CrossRef]
  74. Ali, S.T.; Wajid, H.; Baig, S.N.; Baig, Q.A. Impact on Pakistani students’ education and life pattern during COVID-19 pandemic. Merit Res. J. Med. Med. Sci. 2020, 8, 660–664. [Google Scholar]
  75. Pastor, C.K.L. Sentiment analysis on synchronous online delivery of instruction due to extreme community quarantine in the Philippines caused by COVID-19 pandemic. Asian J. Multidiscip. Stud. 2020, 3, 1–6. [Google Scholar]
  76. Baber, H. Determinants of students’ perceived learning outcome and satisfaction in online learning during the pandemic of COVID-19. J. Educ. E-Learn. Res. 2020, 7, 285–292. [Google Scholar] [CrossRef]
  77. Xu, B.; Chen, N.S.; Chen, G. Effects of teacher role on student engagement in WeChat-Based online discussion learning. Comput. Educ. 2020, 157, 103956. [Google Scholar] [CrossRef]
  78. Rossettini, G.; Geri, T.; Turolla, A.; Viceconti, A.; Scumà, C.; Mirandola, M.; Palese, A. Online teaching in physiotherapy education during COVID-19 pandemic in Italy: A retrospective case-control study on students’ satisfaction and performance. BMC Med. Educ. 2021, 21, 456. [Google Scholar] [CrossRef]
  79. Szopiński, T.; Bachnik, K. Student evaluation of online learning during the COVID-19 pandemic. Technol. Forecast. Soc. Change 2022, 174, 121203. [Google Scholar] [CrossRef]
  80. Angelova, M. Students’ Attitudes to the Online University Course of Management in the Context of COVID-19. Int. J. Technol. Educ. Sci. 2020, 4, 283–292. [Google Scholar] [CrossRef]
  81. Giannoulas, A.; Stampoltzis, A.; Kounenou, K.; Kalamatianos, A. How Greek Students Experienced Online Education during COVID-19 Pandemic in Order to Adjust to a Post-Lockdown Period. Electron. J. E-Learn. 2021, 19, 222–232. [Google Scholar] [CrossRef]
  82. Warfvinge, P.; Löfgreen, J.; Andersson, K.; Roxå, T.; Åkerman, C. The rapid transition from campus to online teaching–how are students’ perception of learning experiences affected? Eur. J. Eng. Educ. 2022, 47, 211–229. [Google Scholar] [CrossRef]
  83. Ghasem, N.; Ghannam, M. Challenges, benefits & drawbacks of chemical engineering on-line teaching during COVID-19 pandemic. Educ. Chem. Eng. 2021, 36, 107–114. [Google Scholar]
  84. Tuaycharoen, N. University-Wide Online Learning during COVID-19: From Policy to Practice. International Association of Online Engineering. Available online: https://www.learntechlib.org/p/218925/ (accessed on 29 July 2022).
  85. Shalatska, H.; Zotova-Sadylo, O.; Makarenko, O.; Dzevytska, L. Implementation of E-assessment in Higher Education. CEUR Workshop Proc. 2020, 2732, 1172–1186. [Google Scholar]
  86. Qi, C.; Liu, S. Evaluating on-line courses via reviews mining. IEEE Access 2021, 9, 35439–35451. [Google Scholar] [CrossRef]
  87. Agyeiwaah, E.; Baiden, F.B.; Gamor, E.; Hsu, F.C. Determining the attributes that influence students’ online learning satisfaction during COVID-19 pandemic. J. Hosp. Leis. Sport Tour. Educ. 2022, 30, 100364. [Google Scholar] [CrossRef]
  88. Khan, M.A.; Kamal, T.; Illiyan, A.; Asif, M. School students’ perception and challenges towards online classes during COVID-19 pandemic in India: An econometric analysis. Sustainability 2021, 13, 4786. [Google Scholar] [CrossRef]
  89. Puljak, L.; Civljak, M.; Haramina, A.; Malisa, S.; Cavic, D.; Klinec, D.; Miksic, S. Attitudes and concerns of health sciences students in Croatia regarding complete switch to e-learning during COVID-19 pandemic: A survey. BMC Med. Educ. 2020, 20, 416. [Google Scholar] [CrossRef]
  90. Stanistreet, P.; Elfert, M.; Atchoarena, D. Education in the age of COVID-19: Understanding the consequences. Int. Rev. Educ. 2020, 66, 627–633. [Google Scholar] [CrossRef]
  91. Rony, H.A.Z.; Awal, S.T. University teachers’ training on online teaching-learning using online platform during COVID-19: A case study. Bangladesh Educ. J. 2019, 18, 57–64. [Google Scholar]
  92. Ramos-Pla, A.; del Arco, I.; Flores Alarcia, Ò. University Professor Training in Times of COVID-19: Analysis of Training Programs and Perception of Impact on Teaching Practices. Educ. Sci. 2021, 11, 684. [Google Scholar] [CrossRef]
  93. Cidral, W.A.; Oliveira, T.; Di Felice, M.; Aparicio, M. E-learning success determinants: Brazilian empirical study. Comput. Educ. 2018, 122, 273–290. [Google Scholar] [CrossRef]
  94. Joo, Y.J.; Lim, K.Y.; Kim, E.K. Online university students’ satisfaction and persistence: Examining perceived level of presence, usefulness and ease of use as predictors in a structural model. Comput. Educ. 2011, 57, 1654–1664. [Google Scholar] [CrossRef]
  95. Schleicher, A. The Impact of COVID-19 on Education: Insights from “Education at a Glance 2020”. OECD Publishing. Available online: https://www.oecd.org/education/the-impact-of-covid-19-on-education-insights-education-at-a-glance-2020.pdf (accessed on 29 July 2022).
  96. Keržič, D.; Alex, J.K.; Pamela Balbontín Alvarado, R.; Bezerra, D.D.S.; Cheraghi, M.; Dobrowolska, B.; Aristovnik, A. Academic student satisfaction and perceived performance in the e-learning environment during the COVID-19 pandemic: Evidence across ten countries. PLoS ONE 2021, 16, e0258807. [Google Scholar] [CrossRef]
  97. Aristovnik, A.; Keržič, D.; Ravšelj, D.; Tomaževič, N.; Umek, L. Impacts of the COVID-19 Pandemic on Life of Higher Education Students: Global Survey Dataset from the First Wave. Data Brief 2021, 39, 107659. [Google Scholar] [CrossRef] [PubMed]
  98. CovidSocLab. A Global Student Survey. 2020. Available online: http://www.covidsoclab.org/ (accessed on 29 July 2022).
  99. Crawford, J.; Butler-Henderson, K.; Rudolph, J.; Malkawi, B.; Glowatz, M.; Burton, R.; Lam, S. COVID-19: 20 countries’ higher education intra-period digital pedagogy responses. J. Appl. Learn. Teach. 2020, 3, 1–20. [Google Scholar]
  100. Gaebel, M.; Zhang, T.; Stoeber, H.; Morrisroe, A. Digitally Enhanced Learning and Teaching in European HEIs. European University Association. Available online: https://eua.eu/downloads/publications/digihe%20new%20version.pdf (accessed on 29 July 2022).
  101. Capranos, D.; Dyers, L.; Magda, A.J. Voice of the Online Learner 2021: Amplifying Student Voices in Extraordinary Times. Louisville: Wiley Education Services. Available online: https://edservices.wiley.com/wp-content/uploads/2021/09/202108-VOL-reportWES-digital-FINAL-Revised.pdf (accessed on 29 July 2022).
  102. Ortagus, J. What We Know about the Cost and Quality of Online Education. The Third Way. 2 September 2020. Available online: https://www.thirdway.org/report/what-we-know-aboutthe-cost-and-quality-of-online-education (accessed on 29 July 2022).
Figure 1. Fields of study (number of responses).
Sustainability 14 11813 g001
Figure 2. Diagram of the conducted research.
Sustainability 14 11813 g002
Figure 3. Overrepresentation map of the rates for online courses (from one to five, where five reflects the highest note).
Sustainability 14 11813 g003
Figure 4. Overrepresentation map of the ratings for taking an active part in online classes (from one to five, where five reflects the highest note).
Sustainability 14 11813 g004
Figure 5. Overrepresentation map of the rates for taking an active part in face to face classes (from one to five, where five reflects the highest note).
Sustainability 14 11813 g005
Figure 6. Overrepresentation map of assessment of the online classes attractiveness for students (from A1 to A5, where A5 means fully agree).
Sustainability 14 11813 g006
Figure 7. Overrepresentation map of assessment of teachers’ preparations to the online classes (from A1 to A5, where A5 means fully agree with statement that teachers were not prepared for online classes).
Sustainability 14 11813 g007
Figure 8. Overrepresentation map of the responses among students who agreed with the statement that teachers were not prepared to conduct online classes (multiple choice question).
Sustainability 14 11813 g008
Table 1. Traditional and online classes in studied countries—number of responses.
Students’ AnswersNumber of Responses
BGGRITPLSETotal
I experienced both traditional and online classes2081294614784505
I have only online classes at this University820149216304
Total216149195149100809
Table 2. The results of the test for inequality of the means of rates of the online courses for countries.
Mean Value4.02783.19464.34363.63093.2900
Mean ValueCountryBGGRITPLSE
4.0278BGX><>>
3.1946GR<X<<=
4.3436IT>>X>>
3.6309PL<><X>
3.2900SE<=<<X
Table 3. The results of the test for inequality of the means of rates of the online courses for disciplines.
Mean Value3.84093.49313.63154.01673.4393
Mean ValueDisciplineEconomyNaturalOthersSocialTechnical
3.8409EconomyX>=<>
3.4931Natural<X=<=
3.6315Others==X<=
4.0167Social>>>X>
3.4393Technical<==<X
Table 4. The values for Chi-square test of independence for chosen responses.
SpecificationCountryType of Study
StatisticChi sqpChi sqp
Q1169.930.000053.210.0000
Q2106.290.000044.100.0002
Q340.520.000733.500.0063
Q2–Q3163.660.000085.260.0000
Q4115.070.000030.500.0156
Q5197.830.000050.230.0000
Table 5. The results of the test for inequality of the means of taking an active part in online classes by countries.
Mean Value3.75463.09403.97953.19463.0300
Mean ValueCountryBGGRITPLSE
3.7546BGX><>>
3.0940GR<X<==
3.9795IT>>X>>
3.1946PL<=<X=
3.0300SE<=<=X
Table 6. The results of the test for inequality of the means of taking an active part in online classes by disciplines.
Mean Value3.48923.41093.02633.80333.1287
Mean ValueDysciplineEconomyNaturalOthersSocialTechnical
3.4892EconomyX==<>
3.4109Natural=X=<>
3.0263Others<=X<=
3.8033Social>>>X>
3.1287Technical<<=<X
Table 7. The results of the test for inequality of the means between the assessment of active participation in face to face and online classes.
CountryOnline Classes, Mean ValueConcussion from the TestFace to Face Classes,
Mean Value
Difference
BG3.7546>3.53700.2176
GR3.0940<3.7919−0.6980
IT3.9795=3.89740.0821
PL3.1946<3.7450−0.5503
SE3.0300<3.7500−0.7200
Table 8. Attractiveness of the online classes for students.
Specification Share of Responses in the Sample
BGGRITENSE
Completely disagreeA18.33%16.78%6.67%6.71%16.00%
DisagreeA213.89%26.85%6.67%13.42%30.00%
NeutralA318.52%22.15%14.87%18.79%25.00%
AgreeA422.69%24.83%36.92%39.60%21.00%
Fully AgreeA536.57%9.40%34.87%21.48%8.00%
Total100%100%100%100%100%
Table 9. Please list the three main elements that make a difference in the quality of online and face-to-face classes (multiple choice question).
Specification Share of Responses in the Sample
BGGRITPLSE
the value of socializingA166.67%70.47%44.62%59.73%73.00%
flexibility of distance learningA252.31%38.26%64.62%52.35%42.00%
more student/teacher feedback on face-to-face classesA346.76%63.09%40.51%55.03%45.00%
more detailed explanation of difficult issuesA436.11%48.32%32.82%38.26%46.00%
better ability to test the knowledgeA524.54%31.54%21.03%24.16%46.00%
greater individualization of teachingA624.07%33.56%24.62%30.87%25.00%
no difference in qualityA721.30%4.70%21.03%13.42%8.00%
Total216149195149100
Publisher’s Note: MDPI stays neutral with regard to jurisdictional claims in published maps and institutional affiliations.

