Article

Nexus between Cyclical Innovation in Green Technologies and CO2 Emissions in Nordic Countries: Consent toward Environmental Sustainability

by
Nihal Ahmed
1,
Franklin Ore Areche
2,
Dante Daniel Cruz Nieto
3,
Ricardo Fernando Cosio Borda
4,
Berenice Cajavilca Gonzales
4,
Piotr Senkus
5,*,
Paweł Siemiński
6 and
Adam Skrzypek
7
1
College of Economics & Management, Northwest Agricultural & Forestry University, Xianyang 712100, China
2
Professional School of Agroindustrial Engineering, National University of Huancavelica, Huancavelica 09001, Peru
3
School of Agricultural Engineering, José Faustino Sánchez Carrión National University, Huacho 15137, Peru
4
Faculty of Management Sciences, Universidad Privada del Norte, Lima 15314, Peru
5
Institute of Social Sciences, SWPS University of Social Sciences and Humanities, 03-815 Warsaw, Poland
6
Department of Economics and Economic Polity in Agribusiness, Poznań University of Life Sciences, Wojska Polskiego 28, 60-637 Poznań, Poland
7
Institute of Journalism and Management, Faculty of Social Sciences, The John Paul II Catholic University of Lublin, 20-950 Lublin, Poland
*
Author to whom correspondence should be addressed.
Sustainability 2022, 14(18), 11768; https://doi.org/10.3390/su141811768
Submission received: 9 August 2022 / Revised: 14 September 2022 / Accepted: 15 September 2022 / Published: 19 September 2022
(This article belongs to the Special Issue Green Technology and Sustainable Development)

Abstract

:
Several economies have acknowledged that environmental degradation poses a serious danger to worldwide sustainable production and consumption. Policy makers concur that the increased use and production of carbon-intensive technologies has intensified the detrimental consequences of carbon dioxide emissions. In response, a number of nations have reacted by enacting stringent regulations and encouraging green technology innovations across corporate and governmental organizations. Evidence that already exists suggests that research and development is a cyclical process; nevertheless, the non-linear influence of shocks in research and development and innovation in green technologies on CO2 emissions in the Nordic nations has not been well investigated. Using panel data from 1995 to 2019, this research explores the asymmetric link between innovation in green technologies and CO2 emissions. The cointegration link between the chosen variables was validated using the Westerlund cointegration test and the Johansen–Fisher panel cointegration test. The findings of both tests confirm the presence of cointegration association between dependent and independent variables. The outcomes of CS-ARDL revealed that negative shocks in creating green technologies contribute to carbon dioxide emissions during recessions. Second, the findings supported the notion that innovation in green technology may reduce carbon dioxide emissions during times of economic expansion. Thirdly, the GDP increases the CO2 emissions, but the usage of renewable energy decreases CO2 emissions. In addition, the robustness analysis validated the consistency and precision of the existing findings. In summary, the findings suggest that the link between advances in environmentally friendly technologies and levels of carbon dioxide emissions were inversely proportional.

1. Introduction

Environmental indicators, a shift in weather patterns, and a rise in temperature all indicate a worsening global environment. Policymakers, governments, and international leaders have actively collaborated to create technologies and green solutions for a sustainable future in response to these environmental challenges. Environmentalists and economists feel that climate challenges globally have expanded exponentially owing to the increasing foreign direct investment between rich and developing nations, particularly during the last few decades [1]. These worldwide economic exchanges have reduced poverty, enhanced infrastructure development, provided employment, and enhanced social life in less-developed and developing nations. However, such improvement has been at the expense of industrialized and emerging nations’ high energy consumption [2]. For instance, the Nordic nations have seen rapid economic improvement in recent decades owing to the rise of global commerce.
According to a recent assessment by the OECD [3], growing environmental challenges must be tackled expeditiously to preserve natural resources and human lives for a greener future. Numerous renewable energy sources, including hydropower, wind power, geothermal energy, and forest biomass, are abundant in the Nordic nations [4]. Each nation strives to maximize the use of locally accessible renewable resources. Due to the use of hydropower in Norway and Sweden, as well as the efficient use of biomass in combined heat and power plants in Finland and Sweden, high and widespread levels of renewable energy have been achieved. Denmark has the most significant proportion of wind energy in the world, whereas Iceland has abundant geothermal energy. Even when renewable energy sources are not the least expensive alternative in the near term, national policies have promoted their usage [4]. The modern cross-border electricity market in the Nordic nations encourages the increased use of renewable energy, since changes in regional output are often offset by hydropower production [4]. Figure 1 provide details about CO2 emission in the region.
Consistent with the preceding, technical innovation has had a significant impact on economic growth by facilitating sustainable development and green innovation [3]. To combat environmental pollution, governments utilize various market-based instruments (for example, permission of emission and green taxes) and non-market measures (such as stringent regulations, research, and sponsoring green technology) [5]. In particular, sustainable green technologies (SGT) may contribute to green manufacturing and energy efficiency [6]. Numerous nations support research in renewables and innovation in green technologies and green energy as rules are being implemented to safeguard patent rights connected to SGT [7]. Governments and other organizations have contributed significant monies to academics, public sectors, and social entrepreneurs for sustainable green technologies related to patent creation. Innovation efforts in the renewable energy industry attract foreign expertise, improve public energy research and development, and extend energy knowledge stockpiles [
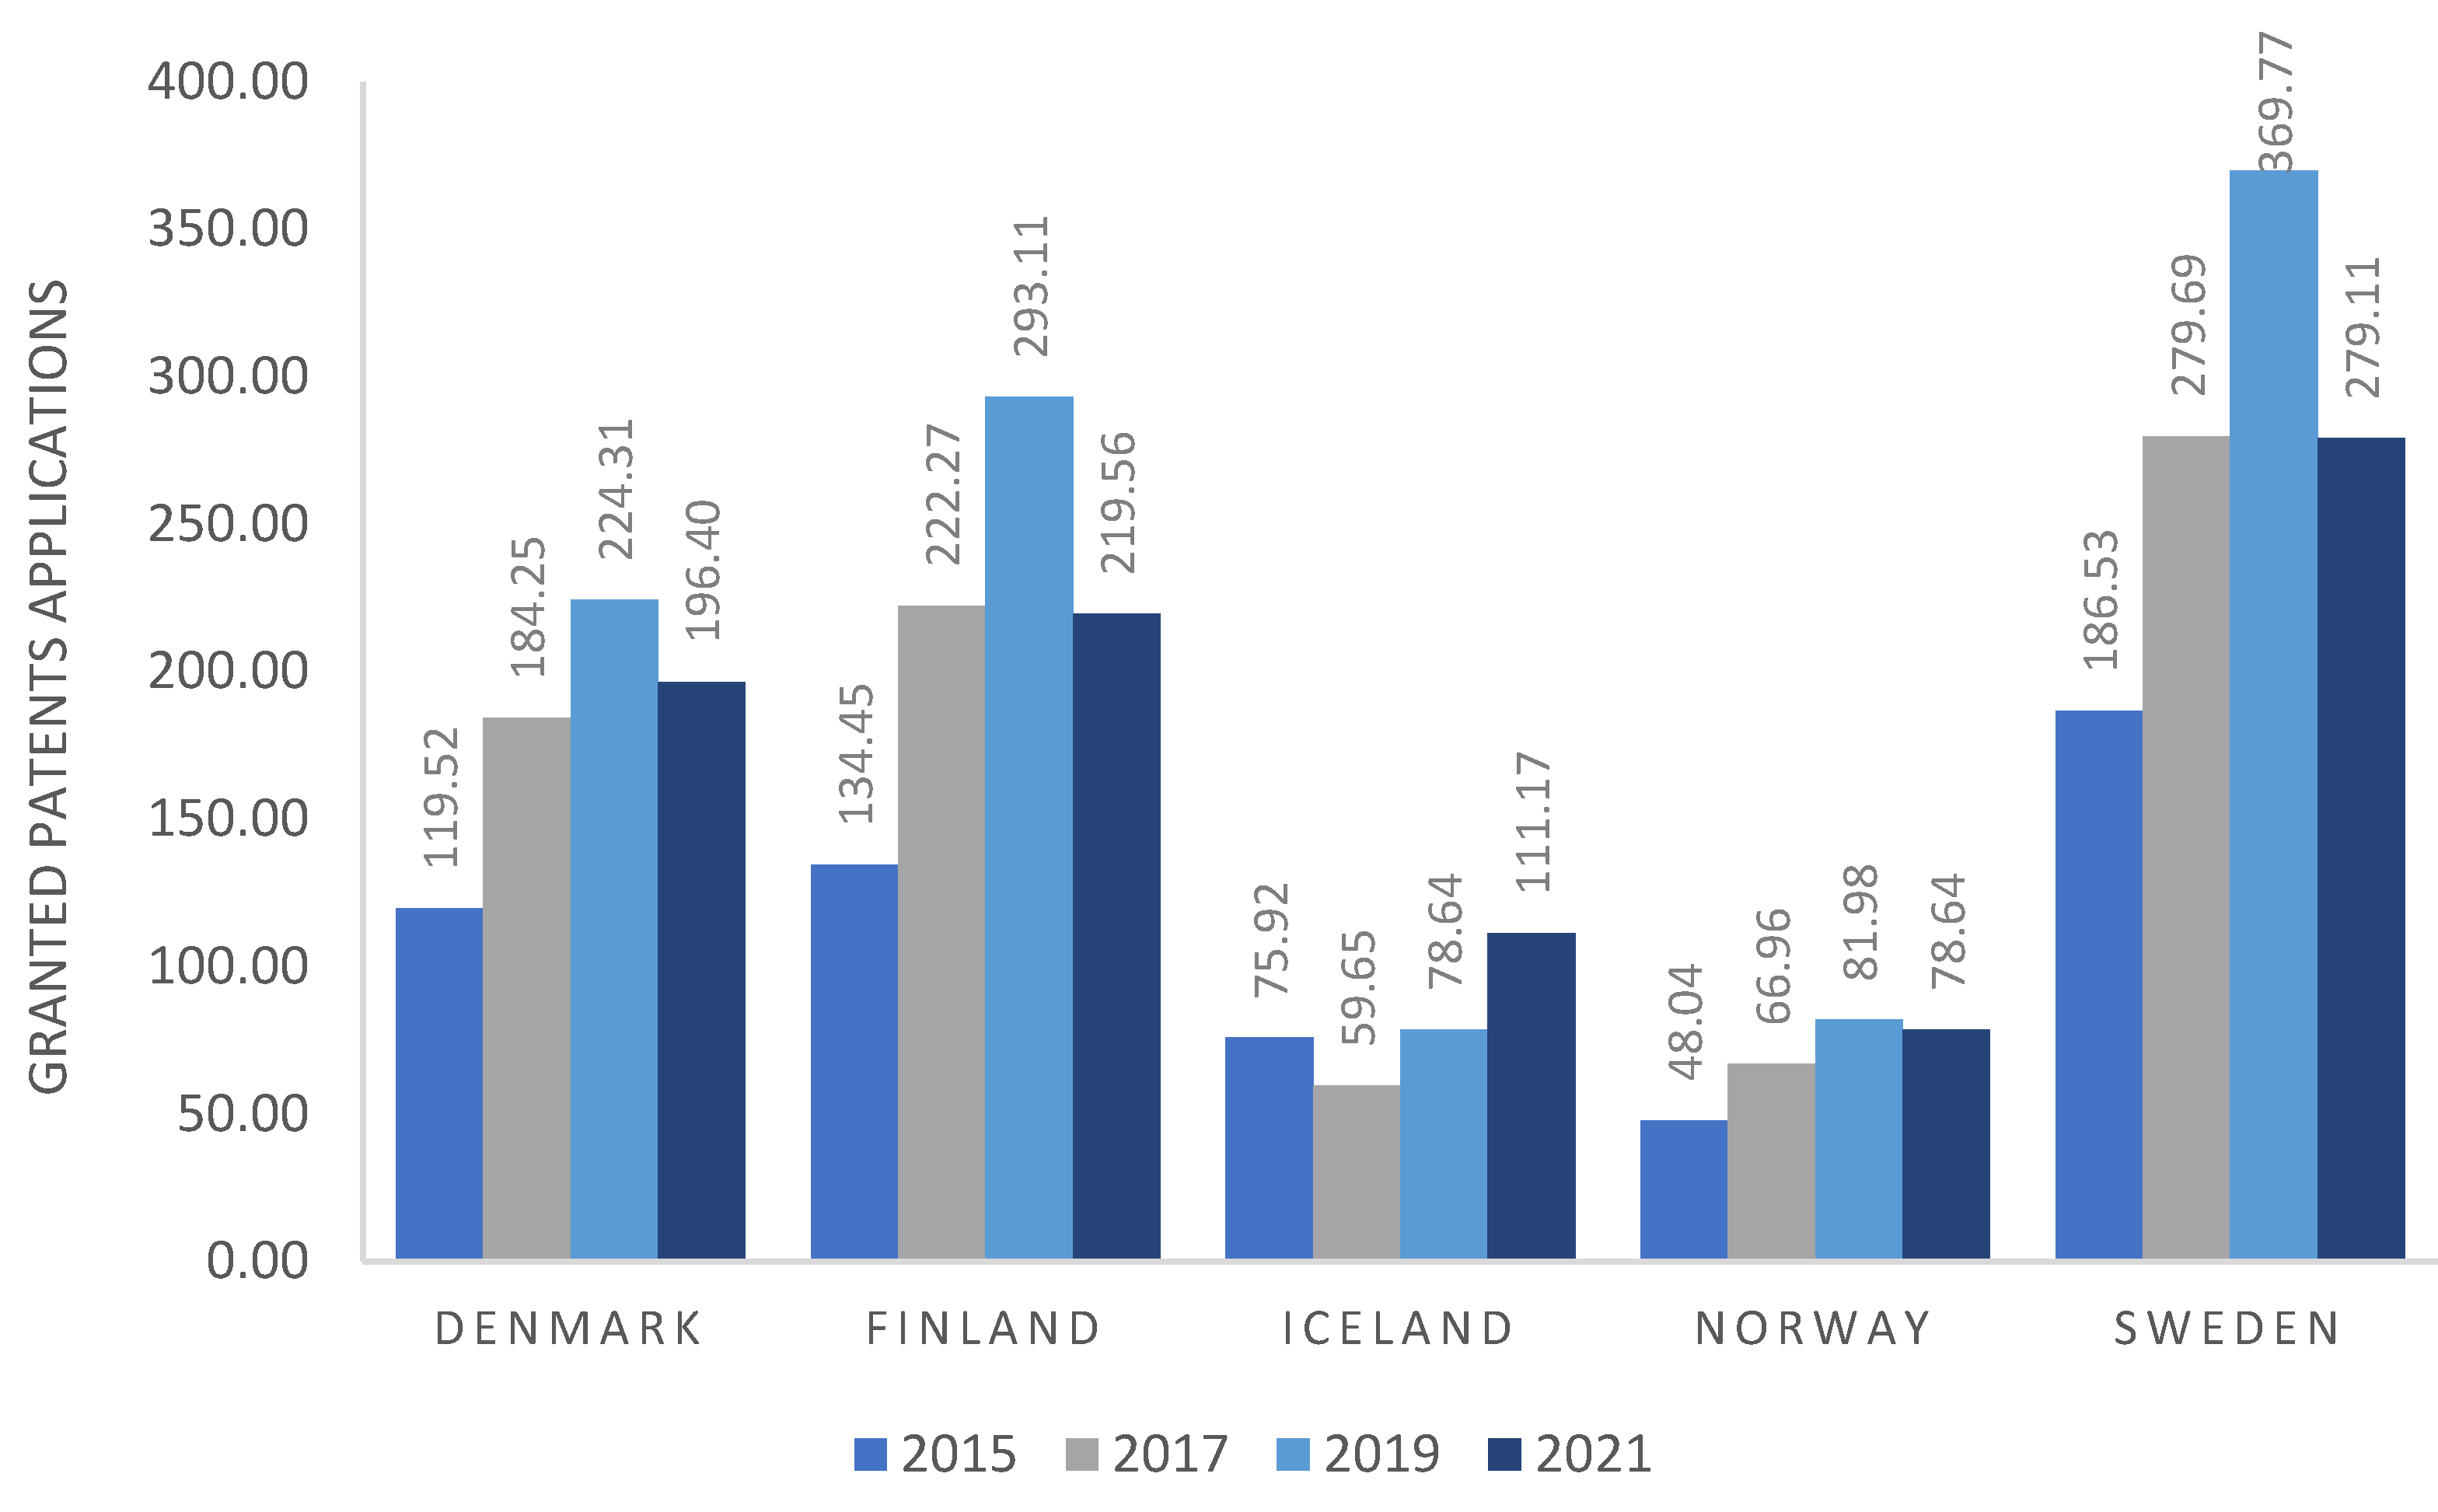
8]. The time period 1995–2019 saw a total of 12,141 European green patents originating from the Nordic nations. This report’s perspective indicates a significant increase trend in green patenting in Nordic countries. It also demonstrates that various Nordic nations contribute differently to green patenting in Europe: Denmark (37%) and Sweden (35%) account for the biggest proportion of patents applied for at the European level, followed by Finland (20%) and Norway (9%) [8]. Figure 2 provides details about the patents granted to Nordic countries per million population.
National policies in the Nordic countries have aggressively encouraged R&D expenditures in renewable energy sources and energy-saving devices. Developing local markets for green technology enables new enterprises to generate new green employment and provides a foundation for exports that are likely to increase as other areas seek solutions to the global climate crisis [7]. The Nordic nations have decided to support the dissemination of the best possible climate-friendly practices. Their governments want to boost green technology by encouraging public-sector buyers to act as role models and contribute to market development by choosing low-carbon solutions in sectors such as transportation, buildings, and food services. At the same time, the Nordic countries and their shared financing institutions, such as the Nordic Environment Finance Corporation (NEFCO) and the Nordic Development Fund (NDF), continue to identify and support the implementation of climate-friendly renewable energy and energy-saving schemes in developing countries, both regionally (NEFCO) and beyond (NDF).
In the context of technological innovation, “green technology innovation” is a subset of “technological innovation”, which is the umbrella term for managerial and technical innovation geared toward environmental protection. In the process of innovation, there are certain innovations that, despite the fact that they can significantly improve productivity, do not take into account the external effects that the innovation will have on the environment. For instance, technological innovation is simply about increasing the output in industries that require a lot of energy. As a direct consequence of this, a wide variety of sectors adhere to the green concept and devote an increasing amount of attention to issues of economic growth and environmental protection [9,10]. Green technology is defined as technology that adheres to the ecological principle and the law of ecological economy, takes into account the conservation of resources and energy during the process of innovation, prevents, eliminates, or significantly reduces the pollution and damage caused to the ecological environment during the process of innovation, and ensures that technological innovation has the smallest possible negative impact on the environment. The goals of green technology innovation are to: accomplish long-term sustainable development; provide economic, environmental, and social advantages; conserve resources and energy; and eliminate or significantly decrease environmental pollution and deterioration [11,12].
This study’s primary purpose is to examine the cyclical features of positive and negative shocks in IGT over times of economic boom and downturn. Additionally, the research intends to assess the influence of the aforementioned shocks on carbon dioxide emissions. The aim of green growth is principally the same as that of sustainable development—to achieve balanced, resource-efficient growth that does not degrade the environment. This work contributes to the literature in three key ways. First, there are relatively few studies that describe how positive and negative shocks in IGT influence CO2 in various economic cycles. Second, previous research has mostly used the Environmental Kuznets Curve hypothesis to assess the relationship between macroeconomic factors and CO2. The current research, as an alternative, provides a unique empirical and conceptual model to evaluate the link between alternative shocks in IGT and carbon dioxide during economic expansions and contractions. Thirdly, this work offers empirical support for the IERT–CO2 nexus, a hypothesis presented by [13]. This study selects Nordic countries for the research due to several reasons. The Nordic nations have collectively committed to achieving significant reductions in carbon emissions and improvements in energy efficiency by the year 2050 in order to meet their climate targets. The Nordic countries are routinely ranked among the world’s leaders in terms of innovation and are home to some of the top research institutions. This puts the area in an advantageous position to offer new solutions and policy guidance to address the possibilities and difficulties of achieving the Nordic countries’ climate targets. To achieve the aforementioned goals, extensive green transition and innovation in green technologies in all areas of the Nordic societies and economies is needed. Moreover, green economic growth, sustainability, and competitiveness is needed both in the public and private sector.
The remaining sections of this article are as follows: Section 2 discusses the literature review. Data sources and the econometrics methodology are discussed in Section 3. Empirical results and discussion make up Section 4. The policy recommendation is discussed in Section 5, and the conclusions is discussed in the final section.

2. Literature Review

Concerns voiced by stakeholders and the general public, together with harsh government rules and trade restrictions based on environmental issues, are common drivers of innovation in green technologies. IGT enhances performance, reputation in the market, economic efficiency, and competitive advantage. IGT has no effect on company performance, and it has been a top focus for researchers and policymakers [14]. In consequence, some research on the relationship between environmental pollution, green innovation and energy, and organic resources has developed in recent years [15]. IGT is typically defined as any innovation that contributes to the Sustainable Development Goals by reducing the adverse effects of production techniques on the environment, strengthening natural resilience to environmental issues, or developing more dependable and effective methods for using natural resources. As stated before, certain Nordic nations have reaped substantial benefits from advancements in environmentally related technology, goods, and services. These efforts have aided Nordic governments in addressing shared global concerns, such as biodiversity loss, climate change, and depletion of natural resources. In addition to the aforementioned macroeconomic benefits, IGT helps private-sector businesses to cut manufacturing costs, increase growth, and improve their market reputation [16].

2.1. A Theoretical Perspective

Recently, Ahmad and Zheng [13] created a theoretical framework and concluded that positive shocks (boom times) in IERT are hypothesized to encourage businesses to develop new green goods and technologies that lower overall industrial emissions, whereas negative shocks in IGT increase pollution. Due to a lack of IGT-required resources, green research and development investment of entrepreneurs is negative during economic downturns. Entrepreneurs are not incentivized to invent new green technology and rely on outdated technologies for which they pay Goods and Services Tax (GST), which raises industrial pollution. Additionally, the depreciation expenses associated with green R&D expenditures represent an added financial burden. If entrepreneurs lack IGT resources, it becomes tough to recoup depreciation expenses from the ultimate output. Ahmad and Zheng [13] elaborated that entrepreneurs may encounter this circumstance during an economic recession, characterized by a decline in industrial production and aggregate demand. If inadequate capital is available, companies may hold their IGT investments until the economy rebounds. Firms also embrace less eco-friendly technology to compete on pricing, since dirty technologies are less expensive than green ones. This might lead to an increase in CO2 during economic downturns.
In IGT, Ahmad and Zheng [13] outlined the environmental effects of boom times and concluded that IGT progresses during times of economic expansion, since real green capital is less than intended green R&D investment. During times of economic expansion, the total demand for goods/items increases, prompting businesses to increase their capacity of production to match the total market demand. Excess resources are available for firms to commit to the required green capital R&D investment. Entrepreneurs seek IGT as a result of increased investment in green R&D during times of economic expansion. Utilizing these innovative IGTs decreases industrial pollution. However, if the actual amount spent on green R&D exceeds the targeted amount, it is expected that emission levels will rise. This circumstance persists and generates a dynamic interaction between carbon dioxide and IGT [13].

2.2. Previous Studies

Various countries, econometric approaches, and variables have been used to examine the link between technological innovation and CO2 emissions. Carrión-Flores and Innes [17] conducted a study in the United States and used the GMM estimator to examine the relationship between air pollution and environmental innovation. The results show that there was a back-and-forth relationship between the two factors. Lee, Min [18] used the LSPL to examine the relationship between green research and development investment, financial performance, and carbon dioxide in Japan. Green R&D expenditures were shown to have an inverse association with CO2 emissions, according to the findings. Environmental improvements may have had an impact on CO2 emissions between 2000 and 2013, based on provincial statistics from China [19]. The SGMM estimator demonstrated that environmental innovations had a negative correlation with CO2. Long, Chen [20] conducted a study to examine the role of environmental innovation and environmental performance and used an industry-level method to look at Korean-owned companies working in China. Environmental performance was shown to be more positively correlated with technological innovation than economic success. Yii and Geetha [21] used the VECM technique to calculate the influence of technological advancement on CO2 emissions in Malaysia from 1971 to 2015. According to the calculations, there is a link between technological advancement and contamination of the environment. Shahbaz, Nasir [22] conducted a study to investigate how foreign direct investment (FDI), energy innovation, and financial growth in France intertwined. The author found a significant link between energy innovation and carbon dioxide.
Yu and Du [23] used the MR technique to study the relationship between technological innovation and CO2 emissions in China. According to the authors, technological advancement resulted in a reduction in CO2 emissions. The SLM model was used by Hao, Wu [24] to investigate the association between FDI and carbon dioxide emissions in China from 1998 to 2016. We may conclude from the data that technological progress reduced CO2. Researchers included technological innovation as an explanatory factor in this research, which is unusual. Technological developments are critical to lowering CO2 emissions and enhancing long-term economic growth [25]. Environmental quality in China has improved from 1990 to 2018 due to green innovation, renewable energy production, and hydroelectric generation, according to Xiaosan, Qingquan [26].
Su and Moaniba [27] used the GMM estimator to examine how technological innovation responds to changes in environmental conditions over a period of 35 years. According to the researchers, technological advancements improved environmental quality. The PRM approach was used by Santra [28] to examine the relationship between green technology innovations and CO2 emissions in the BRICS region from 2005 to 2014. For the first time, the authors were able to objectively show the positive effect of green technology innovation on CO2 emissions and energy consumption in the manufacturing sector. Fernández, López [29] saw a negative correlation between research and development investment and carbon dioxide emissions in the US, China, and the EU when using the OLS approach.
Few studies have examined the non-linear aspects of the nexus between innovation in green technologies and CO2 for different populations in the contemporary situation. Ahmad, Khan [30] investigated how innovation shocks predicted environmental quality by employing FMOLS in OECD-member countries. Positive shocks to innovation, according to the author, improve environmental quality, whereas negative shocks have the opposite effect. A similar pattern was identified in emerging countries by Weimin, Chishti [31]. The authors used the FMOLS method to examine data spanning the years 1990–2016.
Using one of the most comprehensive data sets, Bildirici and Ersin [32] analyzed the connection between U.S. CO2 emissions and GDP growth from 1800 to 2014. The author draws the conclusion that the examined variables, which range from GDP to CO2 emissions, exhibit asymmetry in both their long- and short-term relationships. Bildirici and Ersin [33] introduced a newly suggested non-linear method for analyzing the environmental Kuznets curve (EKC) in the United States and the United Kingdom by dissecting the intricate and non-linear relationships between CO2 emissions, economic growth, and gasoline costs. The research hints to obvious discrepancies from the predicted form of the EKC curve and argues for the need to use more complicated empirical approaches to assess the EKC due to the unexpected complexity of the emissions–economic development association.
Lisi, Zhu [34] investigated the influence of two dimensions of green supply chain learning on green innovation, including green product and process innovation and the moderating role of green technology turbulence. The moderating effect of green technology turbulence on the link between green supplier learning and green product innovation is insignificant. Lin and Ma [35] explored the impact of the urban innovation environment on the effect of green technological innovations on CO2 emissions. The authors conclude that green technological innovations have an insignificant impact on CO2 emission mitigation. However, green technology innovations can reduce CO2 emissions indirectly through upgrading industrial structures. Moreover, when the urban innovation environment is considered, government fiscal expenditure cannot significantly impact the marginal effect of green technologies. Meirun, Mihardjo [36], using time series data from 1990 to 2018 and the cutting-edge bootstrap autoregressive-distributed lag (BARDL) method, found that green technology innovation positively correlated with GDP growth and negatively correlated with carbon emissions in both the short term and long term.
To conclude, many econometric approaches have been used to examine the linear link between environmental innovation and CO2. There are, however, a few caveats in the current research. As a starting point, most authors have constructed linear models to assess the link between CO2 and environmental or technical innovation, which significantly underestimates the importance of shocks and asymmetries. Second, previous non-linear frameworks have concentrated on the connection between CO2 and technological innovation rather than IGT [31]. Several nations and regions, including the United States and members of the BRICS and G6/G7 groups, the OECD, and Europe, have gone through repeated phases of contraction, as well as growth, in recent years. Overestimating the importance of business cycles in economic models may lead to erroneous, inconsistent, and misleading outcomes [13]. However, there is little empirical data in the existing literature to show how distinct economic cycles alter the IGT–CO2 nexus.

3. Materials and Methods

3.1. Data Sources

The objective of the research is to investigate the importance of innovation in green and sustainable technology to sustain a green economy and reduce carbon dioxide emissions in Nordic countries. To achieve this objective, data are obtained from the Nordic statistics database [37], OECD database [38], and World Bank [39], and the variables selected are carbon dioxide emissions (CO2), innovation in green technology (IGT), renewable energy consumption (RE), foreign direct investment FDI, trade openness (TO), and gross domestic product (GDP), which were converted to logarithmic form for analysis. CO2 is measured in metric tons, IGT is the total number of green patents, RE is measured in kilo tons of oil equivalent, GDP is measured as per capita constant 2010 USD, and FDI is the balance of payment value (constant 2010 USD). TO is represented in percentage. The panel data range from 1995 to 2019 for Nordic countries. Table 1 provides the descriptive statistics of the selected variables.
Table 1 shows the basic characteristics of the study variables. For the Nordic countries, the highest level of CO2, FDI, GDP, IGT, REC, and TO were 4870.39, 4.3435 × 10¹¹, 1.751 × 10¹³, 8789.33, 15.35, and 0.7531, respectively. The minimum level of CO2, FDI, GDP, IGT, REC, and TO were 252.91, −1.94 × 10¹⁰, 4.9045 × 10¹¹, 108.018, 0.40545, and 0.13685, respectively. The average level of CO2, FDI, GDP, IGT, REC, and TO were 1082.68, 5.5845 × 10¹⁰, 3.2725 × 10¹², 2111.62, 6.36, and 0.4114, respectively.

3.2. Theoretical Framework

The following equation may be used to depict the relationship between capital and labor, following Weimin, Chishti [31].
Y i t = A i t K i t α   where   α > 0
where Y i t represents the supply side of the economy or final output, K i t is the capital input, Ait represents scale factor, and i and t represent country and time horizon, respectively.
It has been suggested that businesses become involved in innovative activities in order to improve the effectiveness of their end products [40]. In accordance with [31], the following production function now includes innovation activities (INN).
Y i t = A i t K i t α I N N i t β   where   α , β > 0
Depending on its nature and purpose, innovation may be classified as either general innovation (GINN) or innovation in sustainable and green technologies (IGT), as illustrated in the following expression:
R i t = G I N N i t + I G T i t
Further, it is expected that corporations seek IGT because of stringent environmental regulations, as represented by the following mathematical expression:
Y i t = A i t K i t α I G T i t β
It takes a significant amount of time, in addition to enough financial and material resources, in order to develop new environmentally friendly technologies or improve current ones. Companies allot economic resources in the form of green research and development (GR&D) expenses, since they are aware that the IGT process might take a long time. As shown by the following calculation, the Green R&D investments are assumed to be the whole expenses and investments in IGT.
G R & D i t = Y i t ζ i t K i t
where ζ i t is the depreciation rate of IGT, and Y i t and K i t indicate the capital inputs and final surplus output devoted to IGT. Due to the many existing economic situations, GR&Dit may be found in one of these three predicaments:
G R & D i t > Y i t   if   ζ i t K i t < Y i t
G R & D i t = 0   if   ζ i t K i t < Y i t
G R & D i t < Y i t   if   ζ i t K i t > Y i t
where Equations (6) to (8) represent the excess, balance, and deficiency of Green R&D encountered by businesses, respectively. The creation and implementation of new environmentally friendly technology are dependent on the supply and sharing of Green R&D [7,41,42], as shown by the following functional form:
I G T i t = f ( G R & D i t )
As previously stated, economic activity and production generate CO2. According to [43], the relationship between the supply side economic function and CO2 may be expressed as follows:
C O 2 , i t = f ( Y i t )
By putting Y i t = A i t K i t α I G T i t β into C O 2 , i t = f ( Y i t ) , the equation for pollution that is obtained is as follows:
C O 2 , i t = A i t K i t α L i t β I G T i t γ
As part of the entire output of research and development, research and development in green technologies is a significant source of IGT. Assuming that research and development is procyclical, fluctuations in Green R&D would mirror the dynamics of total R&D throughout recessions and expansions. This hypothesis suggests that GR&D would increase during economic expansions and decline during recessions [30]. During economic booms, government expenditure, the gross domestic product, exports, and buying power all expand. Such an increase increases the income and profitability of businesses by encouraging the production of inexpensive excess items. This condition enhances the funding available for GR&D. In the boom phase, a company has more available resources ( G R & D i t > Y i t ) for GR&D to develop current green technology. The use of modern IGT in manufacturing helps cut CO2 emissions. This reasoning implies that IGT receives positive shocks as a consequence of greater investment in research and development ( G R & D i t > Y i t ). The positive shock to IGT, brought on by increasing spending on GR&D during boom times, increases CO2 consumption.
In contrast, economies often shrink and decline during recessions—government expenditure, the gross domestic product, exports, and buying power all decrease. Recessions have a negative impact on the profitability and revenues of businesses owing to decreased output. Due to restricted resources ( G R & D i t < Y i t ) and financial limitations, businesses postpone IGT until the economy rebounds [30]. As the likelihood of producing new or current IGT diminishes, businesses make do with the current, less environmentally friendly and inefficient IGT. In addition, there is an increase in costs associated with the depreciation and the relaxation of limits on the use of dirty technologies to boost production, consumption, and economic development [13]. Using polluting technologies, businesses save money and reduce product prices, yet there is a rise in CO2. Specifically, CO2 levels may rise if the IGT suffers negative shocks owing to a lack of GR&D funding ( G R & D i t < Y i t ) to build new or existing IGT during recessions.
Following [31], the following equation can be used to add IGT shocks to the CO2 function:
χ = { β + i f   Δ I G T i t > 0 β i f   Δ I G T i t < 0
In Equation (12), “+” and “−” stand for “booms” and “recessions”, respectively. Positive shocks in IGT are marked by an increase in IGT activities caused by high GR&D ( G R & D i t > Y i t ) during boom periods. On the other hand, negative shocks in IGT are caused by a drop in GR&D ( G R & D i t < Y i t ), which is a bad change in IGT (recession).
The irregular and cyclic motions of IGT are explained by Equation (13).
C O 2 , i t = A i t K i t α ( I ( Δ I G T i t > 0 ) Δ I G T i t ) β + ( I ( Δ I G T i t < 0 ) Δ I G T i t ) β
( I ( Δ I G T i t > 0 ) Δ I G T i t ) and ( I ( Δ I G T i t < 0 ) Δ I G T i t ) show the identity function.
I ( Δ I G T i t > 0 ) = { 1   i f   Δ I G T i t > 0 0   i f   Δ I G T i t < 0
I ( Δ I G T i t < 0 ) = { 0   i f   Δ I G T i t > 0 1   i f   Δ I G T i t < 0
According to Ahmad and Zheng [13], the two distinct IGT shocks (negative and positive) may be expressed as follows:
C O 2 , i t = A i t K i t α L i t β ( I G T i t ) β + ( I G T i t ) β
Equation (16) shows, as shown above, that both negative and positive shocks are important CO2 functions.
The literature shows that all capital goods or products are carbon-intensive [44]. There are two types of capital goods: with energy ( E B C i t ) and without energy ( N E B C i t ). When the second type is used in production, CO2 is made, as shown in Equation (17):
K i t = E B C i t + N E B C i t
The equation for pollution may be written as:
C O 2 , i t = A i t E B C i t α ( I G T i t ) β + ( I G T i t ) β
Prior empirical research has included energy use as a significant effect of CO2. Nonetheless, [45] argued that the energy usage element in the pollution function might provide erroneous findings due to systematic instability in the coefficient. Therefore, the REC was substituted for ( E B C i t ) in Equation (18), as illustrated below:
C O 2 , i t = A i t R E C i t α ( I G T i t ) β + ( I G T i t ) β
In line with previous research (e.g., [46,47]), in order to achieve the complete pollution function, this study additionally included gross domestic product (GDP) and foreign direct investment (FDI) as extra CO2e components in the pollution function.
C O 2 , i t = A i t R E C i t α ( I G T i t ) β + ( I G T i t ) β G D P i t ρ   F D I i t η   T O i t ς
where α , β + , β , ρ , η , and ς are the exponents.
Past research has used the following techniques to evaluate the non-linear association between the selected variables:
Method 1: The estimation method is based on non-linear modeling. The issue of cross-sectional dependency cannot be remedied by using this approach.
Method 2: After converting the dataset into a non-linear format, linear modeling is used to estimate the data. This framework enables the use of several linear modeling tools, including the cross-sectionally autoregressive distributed lag model (CS-ARDL), to examine the non-linearity between variables when cross-sectional dependency is present. The accurate and robust estimate of asymmetrical models has been proposed by several recent works, including [13,40]. To investigate the cyclical link between IGT and CO2, this research used the same methodology.
According to [40], alternate shocks to IGTs (negative and positive) can be expressed as.
I G T i t + = j = 1 t Δ I G T i t + = j = 1 t max ( Δ I G T i t ,   0 )
I G T i t = j = 1 t Δ I G T i t = j = 1 t min ( Δ I G T i t ,   0 )

3.3. Econometric Steps

Our investigation begins with findings of the outcomes of the cross-sectional dependence test. This research begins by examining cross-sectional dependencies. Cross-sectional dependence is an essential statistic for understanding geographic effects, unknown mutual shocks, and the existence of social networks. This is achieved by using Pearson’s CD (cross-sectional dependence) test. The null hypothesis stated that there is no cross-sectional dependency, but there is a cross-sectional dependence in the alternative hypotheses.
To allow for a more pragmatic approach, which permits pooling when individual heterogeneity is sufficiently modest, this study employs the slope homogeneity test (SHT), applicable under simultaneous temporal and intersectional dependency. The null hypothesis concludes that the slope is homogeneous.
After performing the above-mentioned preliminary analyses, we employed a cross-sectionally augmented Dickey–Fuller test (CADFT) to estimate whether the variables are stationary. For reliable results, even when cross-sectional effects are present. It is common for CADFT to be preferred over the standard unit root test [48]. To circumvent the problems associated with CSD, a factor-modeling technique was introduced by Pesaran [49] in which cross-sectional averages are substituted by unknown common factors. The study employs the Westerlund [50] test and the Johansen–Fisher panel cointegration test for cointegration analysis. The cointegration test that was developed by Westerlund [50] is intended to test the null hypothesis of no cointegration. It is done by inferring whether the error correction term in a conditional error correction model is equal to zero. This allows the tests to circumvent the issue of common factor restriction. A conclusion that the null hypothesis of no error correction does not hold may thus also be interpreted as a conclusion that the null hypothesis of no cointegration does not hold. The common factor limits are relaxed, and structural dynamics are used in this test, which takes panel CSD into account [51].
The Johansen–Fisher method developed by Maddala and Wu [52] is a multivariate cointegration approach which is a panel variant of the Johansen cointegration test. This approach is intuitively captivating, efficient, and adaptable.
Finally, to test the short-run and long-run relationship, the study employed the Chudik and Pesaran [53] CS-ARDL test, which is preferred over AMG and PMG approaches because it can deal with mixed integration order, heterogeneous slope coefficient, and unobserved common variables [54]. The CS-ARDL model follows the following form:
y i t = a i l = 1 P y λ 1 , y i , t 1 + l = 0 P x β l , i x i , t 1 + l = 0 P φ φ i , l Z ¯ i , t 1 + ε i t
where Z ¯ t 1 is the lagged cross-sectional averages [ Z ¯ i , t 1 = ( y ¯ i , t 1 , x ¯ i , t 1 ) ] . The long-run coefficient of mean group estimates are:
θ ^ C S A R D L ,       i = l = 0 p x β ^ l , i 1 l = 0 p y λ ^ l , i , θ ^ M G = 1 N i = 1 N θ ^ i
where θ ^ i denotes individual estimations of each cross-section. The error correction form of the CS-ARDL method is:
Δ y i t = i [ Δ y i , t 1 θ ^ i x i , t ] α i + l = 1 p y 1 λ l , Δ l y i , t 1 + l = 0 p x β l , i Δ l x i , t 1 + l = 0 P φ φ i , l Δ l z ¯ i , t 1 + u i t
where i denotes error correction speed of adjustment.

4. Results and Discussion

The first step of the empirical investigation is to test the correlation among the variables. Table 2 provides the correlation among the variables.
The second step is to check the dataset for the cross-sectional dependence. For this purpose, the study employs the CSD test provided in Table 3. The values of CDLM and LMadj show that the alternative CSD hypothesis was accepted. Cross-border trade, business cycles, regime upheavals, pandemic illnesses, and globalization all contribute to the emergence of CSD. Economic shocks in one Nordic member nation would have an impact on the other Nordic countries, according to the CSD test findings, which support inter-group reliance. In addition, the SHT findings brought to light the problem of slope coefficient uniformity. First-generation econometric approaches such as CADFT, WLCT, and CS-ARDL may be used because of the CSD and SHT test results.
The results of the CADFT are provided in Table 4, and the findings reveal that, all the variables are stationary at least at first difference.
The findings of the Westerlund cointegration test and Johansen–Fisher panel cointegration test are provided in Table 5 and Table 6, respectively.
While taking into consideration the presence of endogenous regressors, heterogeneous breaks, and serial correlation, all panel cointegration test statistics were significant at the 1% level. This indicates that the null hypothesis of no cointegration was rejected as a result of these findings. The results of the Westerlund cointegration test and Johansen–Fisher panel cointegration test demonstrated that at least one variable provides a cointegration relationship.
The findings of the CS-ARDL estimator are shown below in Table 7. First, the findings suggest that positive shocks in IGT disrupted CO2 in the Nordic countries during boom times. This study suggests that economic conditions or policies that enhance IGT activities contribute to CO2 reduction. These factors include both direct and indirect economic factors. The fact that most socioeconomic variables, including employment, company revenues, GDP, public and private investment, industrial output, trade, and consumer income, grow during boom times is one hypothesis that may help to explain this phenomenon. Due to this economic scenario, governments are encouraged to impose stringent environmental regulations. In response to environmental legislation and efforts, businesses often direct resources (environmental research and development expenditures) toward the development of clean technologies. As a direct consequence of this, brand-new environmentally friendly patents and licenses are developed for the commercial use of IGT [13,31]. During times of increased output, the emission of carbon dioxide (CO2) is lowered because of the use of IGT [40]. In the current scenario, while the Nordic nations have achieved significant progress in global trade, technical innovation, and per capita income, there is still a significant amount of room for improvement. However, the quality of the environment (that is, the land, air, and water resources) has been deteriorating at a pace that has never been seen before, owing to a number of variables. These factors include fast industrialization, increased economic growth, and increased aggregate demand. As a response, governments and corporations have committed significant resources to the development of IGT projects across a variety of domains, including solar and wind power.
Second, recent research found that negative shocks to IGT contributed to an increase in CO2 in the Nordic economies during recession periods. It is possible that economic indices (such as employment, firm revenues, GDP, public and private investment, industrial production, trade, and consumer income) worsen during times of economic recession. This is one hypothesis that is plausible. When faced with such circumstances, governments often react by easing restrictions placed on the environment in an effort to increase output and consumption. Businesses are primarily concerned with reducing their production costs, which often leads to the adoption of less desirable technology. During an economic downturn, the rate of industrial CO2 production rises due to the lack of research and industrial implementation of IGT, as well as the continued use of technologies that produce harmful levels of pollution.
Third, the findings demonstrate that there was a correlation between an increase in foreign direct investment (FDI) and a reduction in CO2 emissions in the Nordic economies. These data lend credence to the adoption of the pollution halo hypothesis by indicating that the transfer of environmentally friendly technology from other countries to the Nordic nations has a mitigating effect on CO2. The benefits of technology spillovers caused by foreign direct investment may help increase IGT, which in turn makes it easier to create environmentally friendly technologies and reduces carbon dioxide emissions. In addition, international businesses that participate in FDI often construct value chains in the areas of service delivery, knowledge transfer, manufacturing, procurement, and research and development. This value chain connects local businesses across a variety of levels, including forward, backward, and vertical. Technology spillover may be increased thanks to the vertical integration of technology, which makes it possible for local firms to learn sophisticated ideas, green management, and green technology and to imitate them [55]. In spite of this, the results of this study lend credence to the conclusions of previously published research on China [56], Belt and Road Initiative nations [57], and Azerbaijan [58].
Fourth, the findings demonstrate that an increase in TO led to an increase in CO2 in Nordic economies. This statistic lends credence to the hypothesis that CO2 emissions in the Nordic economies are mostly determined by both exports and imports. The proliferation of international commerce has led to an increase in the demand for energy at the company level in both developed countries and developing economies. Due to this rise in industrial and domestic energy consumption, there has been an accompanying rise in the amount of pollutants released into the environment. Experts also view business and trade policy as variables responsible for CO2 [44]. For example, expansionary commercial policy encourages economic expansion, international commerce, industrialization, and domestic production by providing tax breaks to businesses. A low export tax has an immediate and direct impact on the commerce and manufacturing sectors, encouraging those industries to increase output at lower costs. On the worldwide market, a decrease in the price of goods might potentially boost the amount of demand for the product. The concentration of CO2 in the atmosphere rises if producers respond to rising demand with the help of fossil fuels by using less expensive and less environmentally friendly technology. Therefore, it is reasonable to predict that decreasing taxes on exports improves economic development, industrial production, and exports, but that this also results in a rise in environmental pollution [44]. This result validates earlier studies for developing countries [59], Morocco and Tunisia [60], Sri Lanka [61], South Africa [62], 98 countries [63], OECD states [30], the BRICS group [13], and the US [64].
Fifth, the findings demonstrate that the utilization of renewable energy sources had an effect on CO2 in the economies of the Nordic countries, where a one percent increase in the utilization of renewable energy reduced CO2. This finding suggests that continuing to make use of renewable energy sources leads to reduced dependence on the use of fossil fuels, which in turn results in a lower level of carbon dioxide. This finding is consistent with findings from previous research for OECD economies [30] (Ahmad et al., 2019), EU nations [65], China [66], BRICS economies [67], Turkey [68], 17 OECD nations [69], Canada [70], and the G7 [71].
Last but not least, the findings demonstrate that a rise in GDP had a multiplicative effect on the rate of CO2 in Nordic nations. Based on these findings, it seems that the GDP growth obtained by the Nordic group has come at the expense of increased environmental pollution. During the course of the previous three decades, they have gone through various episodes of recession. The use of dirty technologies at the industrial level has been pushed by governments, who have also repeatedly loosened environmental laws throughout the same time periods. This approach to policy is largely to blame for the high levels of CO2 in the atmosphere. This result corroborates findings from earlier research carried out for developing countries [31], OECD states [1], China [26], Asian economies [43], BRICS nations [57], and 17 OECD nations [69].
The findings from the sensitivity analysis, including variance inflation factor, the Jarque–Bera normality test, Breusch–Pagan–Godfrey heteroscedasticity, the Breusch–Godfrey serial correlation LM test, and, finally, the Ramsey reset test are provided in Table 8. First, the results of the variance inflation factor (VIF) test reveal that the mean value of the VIF was 1.29, which was less than the acceptable threshold of 5 (see [72]). The findings suggest the existence of a moderate degree of multicollinearity among GDP, FDI, IGT P, IGT N, RE, TO, and CO2 levels. In the second step of the process, a test called the Ramsey reset test was carried out to confirm that the model is in appropriate functional form and the model did not include any missing variables. When conducting OLS regressions, one common source of model specification bias is the absence of relevant variables in the analysis. When variables are left out of the analysis, it is possible that fluctuations in the dependent variable are incorrectly accredited to the chosen variables. This circumstance has the potential to result in higher regressor errors, as well as skewed estimations of the coefficient values of the regressors. Therefore, it is essential to examine the model to see whether any variables have been missed out.
In the third step of the process, a Breusch–Godfrey serial correlation LM test was carried out in order to determine whether or not the estimated model had an issue with serial correlation. According to Table 8, the R2 and the p-value of the t-statistic both supported the acceptance of null hypothesis (absence of serial correlation).
In the fourth step, the study employs the Breusch–Pagan–Godfrey heteroscedasticity test to investigate the presence of heteroscedasticity. The p-value of the f-statistics confirms the acceptance of the null hypothesis of the absence of heteroscedasticity. Last but not least, the skewness and kurtosis were analyzed using the Jarque–Bera normality test in order to establish whether or not they were compatible with a normal distribution. The study accepts the null hypothesis, indicating that the data are normally distributed. In general, the sensitivity analysis provided support for the hypothesis that the dataset followed a normal distribution.

5. Policy Implications

In conclusion, the findings of this study highlight some policy implications. First, there is a need to develop environmentally conscious and socially responsible business practices as a means of mitigating the negative consequences of trade openness on the environment. Companies that utilize carbon-intensive energy sources in their manufacturing processes should be subject to stringent restrictions, fines, and increased export taxes from the Nordic countries. These measures should be put into effect. In the new environmentally friendly economic strategy, governments should also provide prizes and incentives (such as a reduced export tax) for businesses and investors who are focused on IGT.
A couple of this study’s limitations could actually serve as opportunities for new lines of inquiry in further research. Initially, a single equation modeling strategy was used in order to investigate the impact that both positive and negative shocks had on the interaction between IGT and CO2. It is anticipated that a simultaneous equation modeling technique would bring forth new insights into the immediate and causal relationship that exists between IGT shocks and CO2. Second, the research investigated whether or not there was a correlation between IGT shocks and CO2 levels exclusively for the Nordic nations. In further research, the existing model might be put to the test in relation to additional nations and groupings, such as the economies in transition, the nations of the European Union, the economies of South and East Asia, the G20, the African states, the OECD countries, and the BRICS nations. The level of CO2 was employed as the dependent variable in this investigation. Future research may include carbon dioxide extracted from different industries, such as transportation, electricity production, the manufacturing industry, and commercial and residential, which account for 27%, 25%, 24%, and 13% of the total carbon dioxide emissions, respectively, and they can also be examined individually. Moreover, further research may get around this constraint by looking at additional pollutants, such as carbon monoxide, nitrogen oxides, and sulfur dioxide.

6. Conclusions

Using panel data from the Nordic countries spanning from 1995 to 2019, this research investigated the asymmetrical and cyclical relationships that exist between IGT and CO2. The following is a compilation of the findings from several estimators: To begin, the WCLT was able to give evidence for the cointegration connection that existed between the variables under consideration. Second, the CS-ARDL demonstrated that negative shocks in IGT led to an increase in CO2 during the years of economic contraction, while positive shocks in IGT resulted in a decrease in CO2 during the periods of economic expansion. In addition to this, the estimations showed that GDP contributed to an increase in CO2, while REC contributed to a decrease in CO2 in the Nordic group. The current results suggest that policymakers should consider the following consequences. First, the findings should urge policymakers to examine cyclical and asymmetrical changes in IGT as an essential part of future policies on IGT and economic growth. This is because the results show that these fluctuations have a significant impact on IGT. During times of economic expansion, governments or authorities that have initiated and institutionalized certain Green R&D projects and policies should anticipate receiving optimum returns on their investments. In order to improve the amount of domestic IGT produced, the government should make it easier for ongoing research and development to take place in a variety of commercial and governmental institutions and broaden its scope. In order to accomplish this goal, governments are able to lend a hand to businesses and startup founders by assisting them in acquiring the necessary material and monetary resources via a variety of different routes. These routes include basic research organizations, academic institutions, commercial labs, industry research and development, and public sector institutions. Additionally, during times of economic expansion, initiatives managed by either public or private entities need to be eligible for funding in the form of research and development. IGT may be strengthened by governments by encouraging financial institutions and other non-profit financing organizations to provide entrepreneurs and green innovation businesses with interest-free loans and funding schemes. This can be accomplished by mobilizing financial institutions.
Second, the most recent calculations demonstrated that falling IGT levels during economic downturns are a significant factor in elevated CO2 levels. The findings of this study indicate that governments should take active initiatives to increase IGT during times of economic contraction. IGT companies have a difficult time luring investment, financing, and capital in freshly growing markets, since the infrastructure in these countries is either lacking or nonexistent, and there are no appropriate systems for risk assessment of IGT initiatives. The creation and implementation of risk assessment frameworks should be formed by policymakers using subject matter experts, academics, scientists, and practitioners as members. The provision of low-interest loans to businesses and projects associated with IGT should also be supported by commercial banks in conjunction with governmental agencies. In the same vein, governments need to provide tax breaks and financial assistance to organizations that are supportive of IGT activities at times of economic downturn. The provision of such institutional assistance would boost investor trust in IGT companies, hence lowering overall innovation costs and allowing for the uninterrupted development of IGT programs, even during economic downturns.
Third, the data presented here emphasize the need to formulate specific strategies to boost RE, FDI, and GDP. In this light, decision makers in government agencies are urged to adopt the following actions: (i) The price of carbon should be kept as low as possible in order to encourage significant levels of trade in emissions; (ii) Feed-in tariffs should be increased by governments in order to boost the proportion of energy output that comes from solar and biomass sources; (iii) More regulation and control should be implemented by governments in order to reduce emissions from power plants; (iv) It is important for governments to provide renewable energy technology, machines, and equipment with interest-free loans and other forms of financial assistance; and (v) It is the responsibility of governments to assist private businesses in establishing renewable energy generation.

Author Contributions

Conceptualization, N.A. and P.S. (Piotr Senkus) and F.O.A.; methodology, D.D.C.N., P.S. (Paweł Siemiński) and N.A.; software, F.O.A., D.D.C.N., B.C.G. and P.S. (Paweł Siemiński) and A.S.; validation, R.F.C.B., N.A., D.D.C.N., B.C.G., P.S. (Paweł Siemiński), A.S., P.S. (Piotr Senkus) and F.O.A.; formal analysis, N.A. and P.S. (Piotr Senkus); investigation, P.S. (Paweł Siemiński) and N.A.; resources, P.S. (Paweł Siemiński) and R.F.C.B.; data curation, R.F.C.B. and N.A.; writing—original draft preparation, N.A., F.O.A., D.D.C.N., B.C.G., P.S. (Paweł Siemiński), A.S. and R.F.C.B.; writing—review and editing, R.F.C.B., P.S. (Paweł Siemiński) and P.S. (Piotr Senkus); visualization, F.O.A., D.D.C.N., B.C.G., P.S. (Paweł Siemiński) and A.S.; supervision, P.S. (Piotr Senkus), A.S. and N.A.; project administration, P.S. (Piotr Senkus) and N.A.; funding acquisition, P.S. (Piotr Senkus). All authors have read and agreed to the published version of the manuscript.

Funding

This research received no external funding.

Data Availability Statement

Data are openly accessed and freely available to everyone.

Conflicts of Interest

The authors declare no conflict of interest.

References

  1. Ahmad, M.; Khattak, S.I.; Khan, S.; Rahman, Z.U. Do aggregate domestic consumption spending & technological innovation affect industrialization in South Africa? An application of linear & non-linear ARDL models. J. Appl. Econ. 2020, 23, 44–65. [Google Scholar]
  2. Squalli, J. Electricity consumption and economic growth: Bounds and causality analyses of OPEC members. Energy Econ. 2007, 29, 1192–1205. [Google Scholar] [CrossRef]
  3. OECD. The Economic Consequences of Climate Change. 2015. Available online: https://www.oecd.org/env/the-economic-consequences-of-climate-change-9789264235410-en.htm (accessed on 12 July 2022).
  4. Bird, T. Nordic Action on Climate Change; Council of Ministers: Brussels, Belgium, 2017. [CrossRef]
  5. Nikzad, R.; Sedigh, G. Greenhouse gas emissions and green technologies in Canada. Environ. Dev. 2017, 24, 99–108. [Google Scholar] [CrossRef]
  6. Franceschini, S.; Pansera, M. Beyond unsustainable eco-innovation: The role of narratives in the evolution of the lighting sector. Technol. Forecast. Soc. Chang. 2015, 92, 69–83. [Google Scholar] [CrossRef]
  7. Khattak, S.I.; Ahmad, M.; ul Haq, Z.; Shaofu, G.; Hang, J. On the goals of sustainable production and the conditions of environmental sustainability: Does cyclical inno-vation in green and sustainable technologies determine carbon dioxide emissions in G-7 economies. Sustain. Prod. Consum. 2022, 29, 406–420. [Google Scholar] [CrossRef]
  8. Tanner, A.; Faria, L.; Moro, M.A.; Iversen, E.; Østergaard, C.R.; Park, E.K. Regional Distribution of Green Growth Patents in Four Nordic Countries: Denmark, Finland, Norway and Sweden; Technical University of Denmark: Copenhagen, Denmark, 2019; p. 108. Available online: https://core.ac.uk/download/pdf/189892041.pdf (accessed on 12 July 2022).
  9. Gorelick, J.; Walmsley, N. The greening of municipal infrastructure investments: Technical assistance, instruments, and city champions. Green Financ. 2020, 2, 114–134. [Google Scholar] [CrossRef]
  10. Novik, N.; Bashinova, S.; Kunshina, N.; Sukharev, A. Digital learning environment in modern conditions. In Proceedings of the 2020 International Scientific Conference on Innovative Approaches to the Application of Digital Technologies in Education, SLET 2020, Stavropol, Russia, 12–13 November 2020. [Google Scholar]
  11. Bi, G.-B.; Song, W.; Zhou, P.; Liang, L. Does environmental regulation affect energy efficiency in China’s thermal power generation? Empirical evidence from a slacks-based DEA model. Energy Policy 2014, 66, 537–546. [Google Scholar] [CrossRef]
  12. Cai, X.; Zhu, B.; Zhang, H.; Li, L.; Xie, M. Can direct environmental regulation promote green technology innovation in heavily polluting industries? Evidence from Chinese listed companies. Sci. Total Environ. 2020, 746, 140810. [Google Scholar] [CrossRef]
  13. Ahmad, M.; Zheng, J. Do innovation in environmental-related technologies cyclically and asymmetrically affect environmental sustainability in BRICS nations? Technol. Soc. 2021, 67, 101746. [Google Scholar] [CrossRef]
  14. Cainelli, G.; Mazzanti, M.; Zoboli, R. Environmental innovations, complementarity and local/global cooperation: Evidence from North-East Italian industry. Int. J. Technol. Policy Manag. 2011, 11, 328. [Google Scholar] [CrossRef]
  15. Omole, D.O.; Ndambuki, J.M. Sustainable Living in Africa: Case of Water, Sanitation, Air Pollution and Energy. Sustainability 2014, 6, 5187–5202. [Google Scholar] [CrossRef]
  16. Hosseini, S.M.P.; Azizi, A. Big Data Approach to Firm Level Innovation in Manufacturing: Industrial Economics; Springer Nature: Berlin/Heidelberg, Germany, 2020; Available online: https://link.springer.com/978-981-15-6300-3 (accessed on 12 July 2022).
  17. Ahmed, N.; Hamid, Z.; Mahboob, F.; Rehman, K.U.; Ali, M.S.e.; Senkus, P.; Wysokińska-Senkus, A.; Siemiński, P.; Skrzypek, A. Causal Linkage among Agricultural Insurance, Air Pollution, and Agricultural Green Total Factor Productivity in United States: Pairwise Granger Causality Approach. Agriculture 2022, 12, 1320. [Google Scholar] [CrossRef]
  18. Ahmed, N.; Areche, F.O.; Sheikh, A.A.; Lahiani, A. Green Finance and Green Energy Nexus in ASEAN Countries: A Bootstrap Panel Causality Test. Energies 2022, 15, 5068. [Google Scholar] [CrossRef]
  19. Zhang, Y.-J.; Peng, Y.-L.; Ma, C.-Q.; Shen, B. Can environmental innovation facilitate carbon emissions reduction? Evidence from China. Energy Policy 2017, 100, 18–28. [Google Scholar] [CrossRef]
  20. Ahmed, N.; Sheikh, A.A.; Hamid, Z.; Senkus, P.; Borda, R.C.; Wysokińska-Senkus, A.; Glabiszewski, W. Exploring the Causal Relationship among Green Taxes, Energy Intensity, and Energy Consumption in Nordic Countries: Dumitrescu and Hurlin Causality Approach. Energies 2022, 15, 5199. [Google Scholar] [CrossRef]
  21. Ahmed, N.; Sheikh, A.A.; Mahboob, F.; Ali, M.S.e.; Jasińska, E.; Jasiński, M.; Leonowicz, Z.; Burgio, A. Energy Diversification: A Friend or Foe to Economic Growth in Nordic Countries? A Novel Energy Diversification Approach. Energies 2022, 15, 5422. [Google Scholar] [CrossRef]
  22. Shahbaz, M.; Nasir, M.A.; Roubaud, D. Environmental degradation in France: The effects of FDI, financial development, and energy innovations. Energy Econ. 2018, 74, 843–857. [Google Scholar] [CrossRef]
  23. Yu, Y.; Du, Y. Impact of technological innovation on CO2 emissions and emissions trend prediction on ‘New Normal’ economy in China. Atmos. Pollut. Res. 2018, 10, 152–161. [Google Scholar] [CrossRef]
  24. Hao, Y.; Wu, Y.; Wu, H.; Ren, S. How do FDI and technical innovation affect environmental quality? Evidence from China. Environ. Sci. Pollut. Res. 2019, 27, 7835–7850. [Google Scholar] [CrossRef]
  25. Zameer, H.; Yasmeen, H.; Zafar, M.W.; Waheed, A.; Sinha, A. Analyzing the association between innovation, economic growth, and environment: Divulging the importance of FDI and trade openness in India. Environ. Sci. Pollut. Res. 2020, 27, 29539–29553. [Google Scholar] [CrossRef]
  26. Xiaosan, Z.; Qingquan, J.; Iqbal, K.S.; Manzoor, A.; Ur, R.Z. Achieving sustainability and energy efficiency goals: Assessing the impact of hydroelectric and renewable elec-tricity generation on carbon dioxide emission in China. Energy Policy 2021, 155, 112332. [Google Scholar] [CrossRef]
  27. Su, H.-N.; Moaniba, I.M. Does innovation respond to climate change? Empirical evidence from patents and greenhouse gas emissions. Technol. Forecast. Soc. Chang. 2017, 122, 49–62. [Google Scholar] [CrossRef]
  28. Santra, S. The effect of technological innovation on production-based energy and CO2 emission productivity: Evidence from BRICS countries. Afr. J. Sci. Technol. Innov. Dev. 2017, 9, 503–512. [Google Scholar] [CrossRef]
  29. Fernández, Y.F.; López, M.F.; Blanco, B.O. Innovation for sustainability: The impact of R&D spending on CO2 emissions. J. Clean. Prod. 2018, 172, 3459–3467. [Google Scholar] [CrossRef]
  30. Ahmad, M.; Khan, Z.; Rahman, Z.U.; Khattak, S.I.; Khan, Z.U. Can innovation shocks determine CO2 emissions (CO2e) in the OECD economies? A new perspective. Econ. Innov. New Technol. 2019, 30, 89–109. [Google Scholar] [CrossRef]
  31. Weimin, Z.; Chishti, M.Z.; Rehman, A.; Ahmad, M. A pathway toward future sustainability: Assessing the influence of innovation shocks on CO2 emissions in de-veloping economies. Environ. Dev. Sustain. 2022, 24, 4786–4809. [Google Scholar] [CrossRef]
  32. Bildirici, M.; Ersin, Ö. Economic growth and CO2 emissions: An investigation with smooth transition autoregressive dis-tributed lag models for the 1800–2014 period in the USA. Environ. Sci. Pollut. Res. 2018, 25, 200–219. [Google Scholar] [CrossRef]
  33. Bildirici, M.; Ersin, Ö. Markov-switching vector autoregressive neural networks and sensitivity analysis of environment, economic growth and petrol prices. Environ. Sci. Pollut. Res. 2018, 25, 31630–31655. [Google Scholar] [CrossRef]
  34. Lisi, W.; Zhu, R.; Yuan, C. Embracing green innovation via green supply chain learning: The moderating role of green tech-nology turbulence. Sustain. Dev. 2020, 28, 155–168. [Google Scholar] [CrossRef]
  35. Lin, B.; Ma, R. Green technology innovations, urban innovation environment and CO2 emission reduction in China: Fresh evidence from a partially linear functional-coefficient panel model. Technol. Forecast. Soc. Chang. 2021, 176, 121434. [Google Scholar] [CrossRef]
  36. Meirun, T.; Mihardjo, L.W.; Haseeb, M.; Khan, S.A.R.; Jermsittiparsert, K. The dynamics effect of green technology innovation on economic growth and CO2 emission in Singapore: New evidence from bootstrap ARDL approach. Environ. Sci. Pollut. Res. 2020, 28, 4184–4194. [Google Scholar] [CrossRef] [PubMed]
  37. Nordic Statistics. Nordic Statistics Database. 2020. Available online: https://www.nordicstatistics.org/ (accessed on 12 July 2022).
  38. Patents on Environment Technologies. 2019. Available online: https://www.oecd-ilibrary.org/environment/patents-on-environment-technologies/indicator/english_fff120f8-en (accessed on 12 July 2022).
  39. World Bank. WDI [World Development Indicators]. Available online: https://databank.worldbank.org/source/world-development-indicators# (accessed on 2 December 2020).
  40. Xin, D.; Ahmad, M.; Lei, H.; Iqbal Khattak, S. Do innovation in environmental-related technologies asymmetrically affect carbon dioxide emissions in the United States? Technol. Soc. 2021, 67, 101761. [Google Scholar] [CrossRef]
  41. Khattak, S.I.; Ahmad, M. The cyclical impact of innovation in green and sustainable technologies on carbon dioxide emissions in OECD economies. Environ. Sci. Pollut. Res. 2022, 29, 33809–33825. [Google Scholar] [CrossRef] [PubMed]
  42. Khattak, S.I.; Ahmad, M. The cyclical impact of green and sustainable technology research on carbon dioxide emissions in BRICS economies. Environ. Sci. Pollut. Res. 2021, 29, 22687–22707. [Google Scholar] [CrossRef]
  43. Qingquan, J.; Khattak, S.I.; Ahmad, M.; Ping, L. A new approach to environmental sustainability: Assessing the impact of monetary policy on CO 2 emissions in Asian economies. Sustain. Dev. 2020, 28, 1331–1346. [Google Scholar] [CrossRef]
  44. Jiang, Q.; Khattak, S.I.; Ahmad, M.; Lin, P. Mitigation pathways to sustainable production and consumption: Examining the impact of commercial policy on carbon dioxide emissions in Australia. Sustain. Prod. Consum. 2020, 25, 390–403. [Google Scholar] [CrossRef]
  45. Jaforullah, M.; King, A. The econometric consequences of an energy consumption variable in a model of CO2 emissions. Energy Econ. 2017, 63, 84–91. [Google Scholar] [CrossRef]
  46. Charfeddine, L.; Khediri, K.B. Financial development and environmental quality in UAE: Cointegration with structural breaks. Renew. Sustain. Energy Rev. 2016, 55, 1322–1335. [Google Scholar] [CrossRef]
  47. Michieka, N.; Fletcher, J.; Burnett, J. An empirical analysis of the role of China’s exports on CO2 emissions. Appl. Energy 2013, 104, 258–267. [Google Scholar] [CrossRef]
  48. Isiksal, A.Z. Testing the effect of sustainable energy and military expenses on environmental degradation: Evidence from the states with the highest military expenses. Environ. Sci. Pollut. Res. 2021, 28, 20487–20498. [Google Scholar] [CrossRef]
  49. Pesaran, M.H. Estimation and Inference in Large Heterogeneous Panels with a Multifactor Error Structure. Econometrica 2006, 74, 967–1012. [Google Scholar] [CrossRef]
  50. Westerlund, J. Testing for error correction in panel data. Oxf. Bull. Econ. Stat. 2007, 69, 709–748. [Google Scholar] [CrossRef]
  51. Alsamara, M.; Mrabet, Z.; Saleh, A.S.; Anwar, S. The environmental Kuznets curve relationship: A case study of the Gulf Cooperation Council region. Environ. Sci. Pollut. Res. 2018, 25, 33183–33195. [Google Scholar] [CrossRef] [PubMed]
  52. Maddala, G.S.; Wu, S. A comparative study of unit root tests with panel data and a new simple test. Oxf. Bull. Econ. Stat. 1999, 61, 631–652. [Google Scholar] [CrossRef]
  53. Chudik, A.; Pesaran, M.H. Common correlated effects estimation of heterogeneous dynamic panel data models with weakly exogenous regressors. J. Econ. 2015, 188, 393–420. [Google Scholar] [CrossRef]
  54. Ding, Q.; Khattak, S.I.; Ahmad, M. Towards sustainable production and consumption: Assessing the impact of energy productivity and eco-innovation on consumption-based carbon dioxide emissions (CCO2) in G-7 nations. Sustain. Prod. Consum. 2020, 27, 254–268. [Google Scholar] [CrossRef]
  55. Kshirsagar, P.R.; Manoharan, H.; Selvarajan, S.; Althubiti, S.A.; Alenezi, F.; Srivastava, G.; Lin, J.C.-W. A Radical Safety Measure for Identifying Environmental Changes Using Machine Learning Algorithms. Electronics 2022, 11, 1950. [Google Scholar] [CrossRef]
  56. Chen, Z.; Paudel, K.P.; Zheng, R. Pollution halo or pollution haven: Assessing the role of foreign direct investment on energy conservation and emission reduction. J. Environ. Plan. Manag. 2021, 65, 311–336. [Google Scholar] [CrossRef]
  57. Khan, A.; Hussain, J.; Bano, S.; Chenggang, Y. The repercussions of foreign direct investment, renewable energy and health expenditure on environmental decay? An econometric analysis of B&RI countries. J. Environ. Plan. Manag. 2019, 63, 1965–1986. [Google Scholar] [CrossRef]
  58. Mukhtarov, S.; Aliyev, S.; Mikayilov, J.I.; Ismayilov, A.; Rzayev, A. The FDI-CO2 nexus from the sustainable development perspective: The case of Azerbaijan. Int. J. Sustain. Dev. World Ecol. 2020, 28, 246–254. [Google Scholar] [CrossRef]
  59. Van Tran, N. The environmental effects of trade openness in developing countries: Conflict or cooperation? Environ. Sci-Ence Pollut. Res. 2020, 27, 19783–19797. [Google Scholar] [CrossRef] [PubMed]
  60. Hakimi, A.; Hamdi, H. Trade liberalization, FDI inflows, environmental quality and economic growth: A comparative analysis between Tunisia and Morocco. Renew. Sustain. Energy Rev. 2016, 58, 1445–1456. [Google Scholar] [CrossRef]
  61. Naranpanawa, A. Does trade openness promote carbon emissions? Empirical evidence from Sri Lanka. Empir. Econ. Lett. 2011, 10, 973–986. [Google Scholar]
  62. Aydin, M.; Turan, Y.E. The influence of financial openness, trade openness, and energy intensity on ecological footprint: Revis-iting the environmental Kuznets curve hypothesis for BRICS countries. Environ. Sci. Pollut. Res. 2020, 27, 43233–43245. [Google Scholar] [CrossRef] [PubMed]
  63. Le, T.-H.; Chang, Y.; Park, D. Trade openness and environmental quality: International evidence. Energy Policy 2016, 92, 45–55. [Google Scholar] [CrossRef]
  64. Ibrahim, R.L.; Ajide, K.B. Nonrenewable and renewable energy consumption, trade openness, and environmental quality in G-7 countries: The conditional role of technological progress. Environ. Sci. Pollut. Res. 2021, 28, 45212–45229. [Google Scholar] [CrossRef] [PubMed]
  65. Radmehr, R.; Henneberry, S.R.; Shayanmehr, S. Renewable Energy Consumption, CO2 Emissions, and Economic Growth Nexus: A Simultaneity Spatial Modeling Analysis of EU Countries. Struct. Chang. Econ. Dyn. 2021, 57, 13–27. [Google Scholar] [CrossRef]
  66. Chen, Y.; Wang, Z.; Zhong, Z. CO2 emissions, economic growth, renewable and non-renewable energy production and foreign trade in China. Renew. Energy 2019, 131, 208–216. [Google Scholar] [CrossRef]
  67. Dong, K.; Sun, R.; Hochman, G. Do natural gas and renewable energy consumption lead to less CO2 emission? Empirical evidence from a panel of BRICS countries. Energy 2017, 141, 1466–1478. [Google Scholar] [CrossRef]
  68. Pata, U.K. Renewable energy consumption, urbanization, financial development, income and CO2 emissions in Turkey: Testing EKC hypothesis with structural breaks. J. Clean. Prod. 2018, 187, 770–779. [Google Scholar] [CrossRef]
  69. Bilgili, F.; Koçak, E.; Bulut, Ü. The dynamic impact of renewable energy consumption on CO2 emissions: A revisited Envi-ronmental Kuznets Curve approach. Renew. Sustain. Energy Rev. 2016, 54, 838–845. [Google Scholar] [CrossRef]
  70. Saidi, K.; Omri, A. Reducing CO2 emissions in OECD countries: Do renewable and nuclear energy matter? Prog. Nuclear Energy 2020, 126, 103425. [Google Scholar] [CrossRef]
  71. Sadorsky, P. Renewable energy consumption, CO2 emissions and oil prices in the G7 countries. Energy Econ. 2009, 31, 456–462. [Google Scholar] [CrossRef]
  72. Gujarati, D.N.; Porter, D.C. Basic Econometrics; McGraw-Hill Irwin: New York, NY, USA, 2009; Available online: http://www.uop.edu.pk/ocontents/gujarati_book.pdf (accessed on 12 July 2022).
Figure 1. Carbon dioxide emissions (thousand tons per million population).
Sustainability 14 11768 g001
Figure 2. Granted patents application (per million population).
Sustainability 14 11768 g002
Table 1. Descriptive statistics of the variables.
StatisticsMeanMedianMaximumMinimumStd. Dev.SkewnessKurtosisObservations
CO21082.689455.007554870.39375252.918351403.580351.66944.31885120
FDI5.5845 × 10102.686 × 10104.3435 × 1011−1.94 × 10107.769 × 10101.99587.35165120
GDP3.2725 × 10122.057 × 10121.751 × 10134.9045 × 10113.4425 × 10121.96696.72945120
IGT2111.626999.65958789.3315108.0182378.889051.156853.1042120
RE6.363954.9104515.35440.405454.4880.71912.1114120
TO0.41140.42670.75310.136850.15470.039951.95925120
Source: Author(s) depiction.
Table 2. Unconditional correlations among the variables.
SeriesCO2IGTFDITORECGDP
CO21
IGT−0.6651
FDI−0.7110.2011
TO0.5420.2090.1321
RE−0.540.2150.2710.4421
GDP0.5710.2350.1240.40.3481
Note: Author(s) depictions.
Table 3. Cross-sectional dependence (CSD) tests.
TestStatisticsp-Value
CSDtest
CDLM6.8432 a<0.01
LMadj21.69986 a<0.01
SHT
Δ ˜ 11.65801 a<0.01
Δ ˜ adjusted13.4498 a<0.01
Notice: a shows 1% significance level.
Table 4. CADF test results.
At LevelAt First Difference
VariableT-BarZ [T-Bar]T-BarZ [T-Bar]
CO2−2.476−1.063−3.992−5.378
IGT−1.9710.371−2.983−2.507
FDI−2.441−0.964−3.584−4.217
TO−2.208−0.303−3.383−3.645
RE−2.0390.179−3.569−4.175
GDP−2.432−0.940−3.142−2.958
Source: Author(s) depiction.
Table 5. Westerlund cointegration test.
StatisticsGtGaPtPa
Value−9.09−10.75−13.33−9.23
Z-value−28.73−1.81−3.61−4.06
p-value<0.01<0.05<0.01<0.01
Source: Author(s) depiction.
Table 6. Johansen–Fisher panel cointegration test.
-Trace Statistic TestMax Eigenvalue Test
At most 11301.1 b578.9 b
At most 21211.3 b451.7 b
At most 3898.2 b321.3 b
At most 4579.4 b189.4 b
At most 5381.3 b118.2 b
At most 6112.2 b79.2 b
Note: AIC, SIC criteria are used for optimal lag length selection. b represents statistical significance at 5%. Source: Authors’ calculation.
Table 7. CS-ARDL estimation results.
Short-Run CoefficientsLong-Run Coefficients
VariablesCoefficientT-StatisticCoefficientT-Statistic
CO2,t−1−0.036 **−7.128
IGT_P−0.212 **−2.759−0.269 **−3.126
IGT_N0.078 **2.8630.148 ***5.824
FDI−0.022 ***−2.074−0.188 **−8.061
TO0.253 **4.2280.343 **4.935
RE−0.124 **−9.088−0.289 **−2.172
GDP0.118 ***8.1720.255 ***4.59
ECM (−1)−0.88 ***−14.62
Note: **, *** depicts statistical significance at 5%, and 1%, respectively. Source: Author(s) depiction.
Table 8. Sensitivity analysis (diagnostic tests).
Variance Inflation Factor (VIF)
VariableVIF1/VIF
CO2 (−1)1.201.04
IGT_P1.131.11
IGT_N1.251.00
FDI1.221.03
GDP1.310.95
RE1.360.93
TO1.560.81
Mean VIF1.29
Jarque–Bera normality test
Jarque–Bera Statistics0.09 (−1.08)
Breusch–Pagan–Godfrey heteroscedasticity test
F-statisticObs∗ R-squaredScaled explained SS
1.00 (−0.58)6.38 (−0.51)3.24 (−0.92)
Breusch–Godfrey serial correlation LM test
F-statisticObs∗ R-squared
1.60 (−0.30)4.10 (0.18)
Ramsey Reset Test
t-statisticF-statisticLikelihood ratio
0.90 (−0.48)0.73 (−0.48)1.00 (−0.39)
Note: respective p-values are depicted in parenthesis. Source: Author(s) depiction.
Publisher’s Note: MDPI stays neutral with regard to jurisdictional claims in published maps and institutional affiliations.

