1. Introduction
In China, government-controlled power generation companies own more than half of the total installed capacity; the investment and operation of grid companies are also totally dominated by the government [
1,
2,
3]. Thus, electricity prices have long been fixed and strictly controlled [
4]. Unique electricity supply and pricing systems bring an opportunity to adjust electricity prices through policy intervention, eventually maintaining smooth economic development and a stable overall price level. At present, adjusting electricity prices has become an essential means for China to guide industrial restructuring and promote economic growth. For example, the China Development and Reform Commission introduced a differential electricity price policy in 2004. This policy was requested to raise electricity prices for backward production capacity. With this policy shock, the rapid expansion of production capacity in related industries has been curbed. Another example is the phased reduction in enterprise electricity cost policy in 2020. To hedge the negative trend of the economy after the COVID-19 outbreak, the government proposed a policy that reduced the electricity price of commerce and industry by 5%, except for energy-intensive industries. These examples support the fact that the electricity price policy has already been thoroughly integrated into the macro-control regime of China. Correspondingly, comparing the economic responses to different policies will help in understanding the mechanism where electricity price policy plays a role and where the current price policy could be optimized.
Given such significance, the Chinese electricity price policy or pricing system has drawn considerable attention. Zhao et al. [
5] investigated the electricity price reforms. They found that the reform in 1996 promoted power generation corporations who were more responsive to electricity demand, but the later reform in 2013 did not play the same role. Song and Cui [
6] indicated there is a high economic cost for intervening in the electricity market, as it would force the government to pay expensive subsidies to keep the price of electricity at relatively low levels. Employing a complex network, Wang et al. [
7] demonstrated that using electricity bidding pricing would directly decrease the electricity price; thus, the electricity industry will significantly reduce its impact on other related industries. Though there are many studies focusing on the Chinese electricity price policy [
8,
9,
10,
11,
12], few studies have simulated its actual economic outcome. It exposes a knowledge gap: How does the policy of adjusting electricity prices affect the economic system? Do the electricity price-cutting policy shocks promote national economic prosperity or hinder it?
To fill in this knowledge gap, this study investigated the actual economic consequences of electricity price-cutting policies, taking Zhejiang province as the case study. Our main reason for choosing Zhejiang province is its representativeness. Zhejiang has relatively developed industries and is a coastal province with frequent import and export trade, which creates an excellent realistic policy environment for simulation. In other words, with an economic system closely linked to electricity prices, Zhejiang province will respond to electricity price policy shocks more obviously than most other provinces. Moreover, Zhejiang province has implemented three large-scale electricity price-reduction policies in recent years. These policies have effectively reduced the cost of energy use in the industrial sector and promoted economic development and post-epidemic economic recovery in Zhejiang Province; meanwhile, these policies have also adjusted the industrial structure and trade situation to a certain extent. In 2021, the proportion of the added value of secondary industry in Zhejiang Province in terms of GDP increased by 0.6% compared with 2018, while the proportion of that of tertiary industry dropped by 0.1% in the same period, which might be partly attributed to the targeted electricity price policy. However, the accurate impact of such policies has not been clearly assessed. The evaluation of these implemented policies can help enrich the understanding of the impact of electricity price policy and provide inspiration for electricity price policy adjustments. The methodological approach taken in this study was a provincial CGE model incorporating the operating characteristics of the Zhejiang electric system. We obtained some novel findings based on the simulation of the responses to three kinds of policy shocks, decreasing the general industrial electricity price, temporary (phased) electricity price cutting, and targeted price reduction for large industries. Firstly, reducing electricity prices was effective in promoting the economy; secondly, the specific arrangements of electricity price-cutting policy (such as covered industries and durations) were the primary source of different economic stimulus effects; thirdly, the electricity price-cutting policies had spillover effects among various sectors. Correspondingly, even if the price-cutting policy scope was only available to a few industries, other industries’ demand, output, and income also positively responded to policy shocks.
The main contributions of this paper are as follows: (1) This paper conducted pioneering research in assessing the effect of electricity price-reduction policy, thereby filling the current knowledge blanks. This is crucial for understanding and clarifying the role of the Chinese unique electricity price policy. (2) A combination of a case study and a CGE model was used in this research, ensuring the reliability of the results. Constructing the separate electricity sectors provided an effective measure for evaluating the economic responses to electricity price-cutting policies. (3) In addition to the simulation results, we further estimated the multiplier effects of different policy scenarios. Then, an optimized electricity price-reduction policy was developed based on multiplier effects. In the subsequent simulation, the optimized policy scenario showed the most considerable effects on economic growth. Some targeted policy recommendations are thereby summarized for improving the efficiency of the electricity price policy.
The framework of the paper is constructed as follows. The third part introduces the methodology, which includes building the basic CGE model, SAM table, the embedded electricity sector, and cross-subsidy. The main empirical and simulation results are listed in
Section 4. The fifth part investigates price-cutting policy optimization. Finally, the conclusions are drawn in
Section 6.
2. Literature Review
This paper aims at understanding the potential effects of electricity price adjustments in Zhejiang province by employing a CGE model. There are two kinds of literature that are reviewed in this paper, namely studies on the impact of electricity price and studies on CGE model estimation.
Electricity is an important energy input in the production sector and is also one of the essential goods for the public. Hence, electricity price always plays a vital role in driving the macro-economy [
13,
14,
15]. Considerable studies have already provided evidence that economic growth is closely linked to electricity prices. Akkemik [
16] investigated Turkish electricity sector reforms, suggesting that changes in electricity prices are reflected in production costs in other economic segments. The dynamics of electricity prices also affect households. By assessing the potential effects of time-of-use pricing on households and the broader economy, Matar [
17] found that changes in electricity prices might influence household energy consumption behavior and the income of electricity-related departments. Lin and Chen [
18] concentrated on the effect of electricity price on innovation in renewable energy technologies. The results of this study showed that electricity price could even drive technical development and innovation. In general, the determinant role of electricity price on the macroeconomy has been revealed from different perspectives [
19,
20,
21,
22]. Such a close relationship makes it possible to affect economic growth by adjusting the electricity prices. More recently, Norouzi et al. [
23] highlighted the impact of COVID-19 on the selling price of electricity in Spain; another paper indicated that environmental taxes are a tool for the optimal allocation of resources to increase social welfare, which could provide similar effects to the electricity price effects [
24]. Li et al. [
25] further suggested that adjustments in electricity price affect labor demand in manufacturing enterprises. All the above literature sufficiently illustrates the rationality for estimating the effect of electricity price adjustments on the macro economy.
From another perspective, CGE models have been widely employed in various areas of policy effect evaluation. For instance, first, Whalley [
26] constructed thirteen major trade areas by establishing a multi-regional CGE model and conducted related research on issues such as tariff reductions, trade barriers, and trade wars in trade areas. Some followers then estimated the effects of trade liberalization and trade protection policies by constructing a CGE model [
27,
28]. Also applying a CGE model, another paper further simulated the influence of tax reform [
29]. By refining the energy sector into six sectors, natural gas, gas, crude oil, oil, coal, and electricity, it is possible to discuss the impact of natural gas price changes on the economic system [
30]. Similarly, after splitting the energy sector, Dong et al. [
31] analyzed the relationship between the shock of international oil prices and the change in the RMB exchange rate. Overall, the CGE model has demonstrated strong strengths in policy evaluation. [
32,
33,
34,
35,
36] The above papers all illustrate that CGE estimation can be made more relevant to real production, since it constructs a series of nonlinear equations. Furthermore, a CGE model can avoid the deviation of ignoring the indirect effects and diffraction effects of electricity price changes in the metering model. Thus, this paper eventually applied this model as the main research method.
3. Methodology
3.1. CGE Model Construction
The computable general equilibrium (CGE) model digitally sets economic entities and describes the operating conditions of the economic system as a whole. It has been proven to be a valuable tool for simulating the economic impact of policy changes [
37,
38,
39,
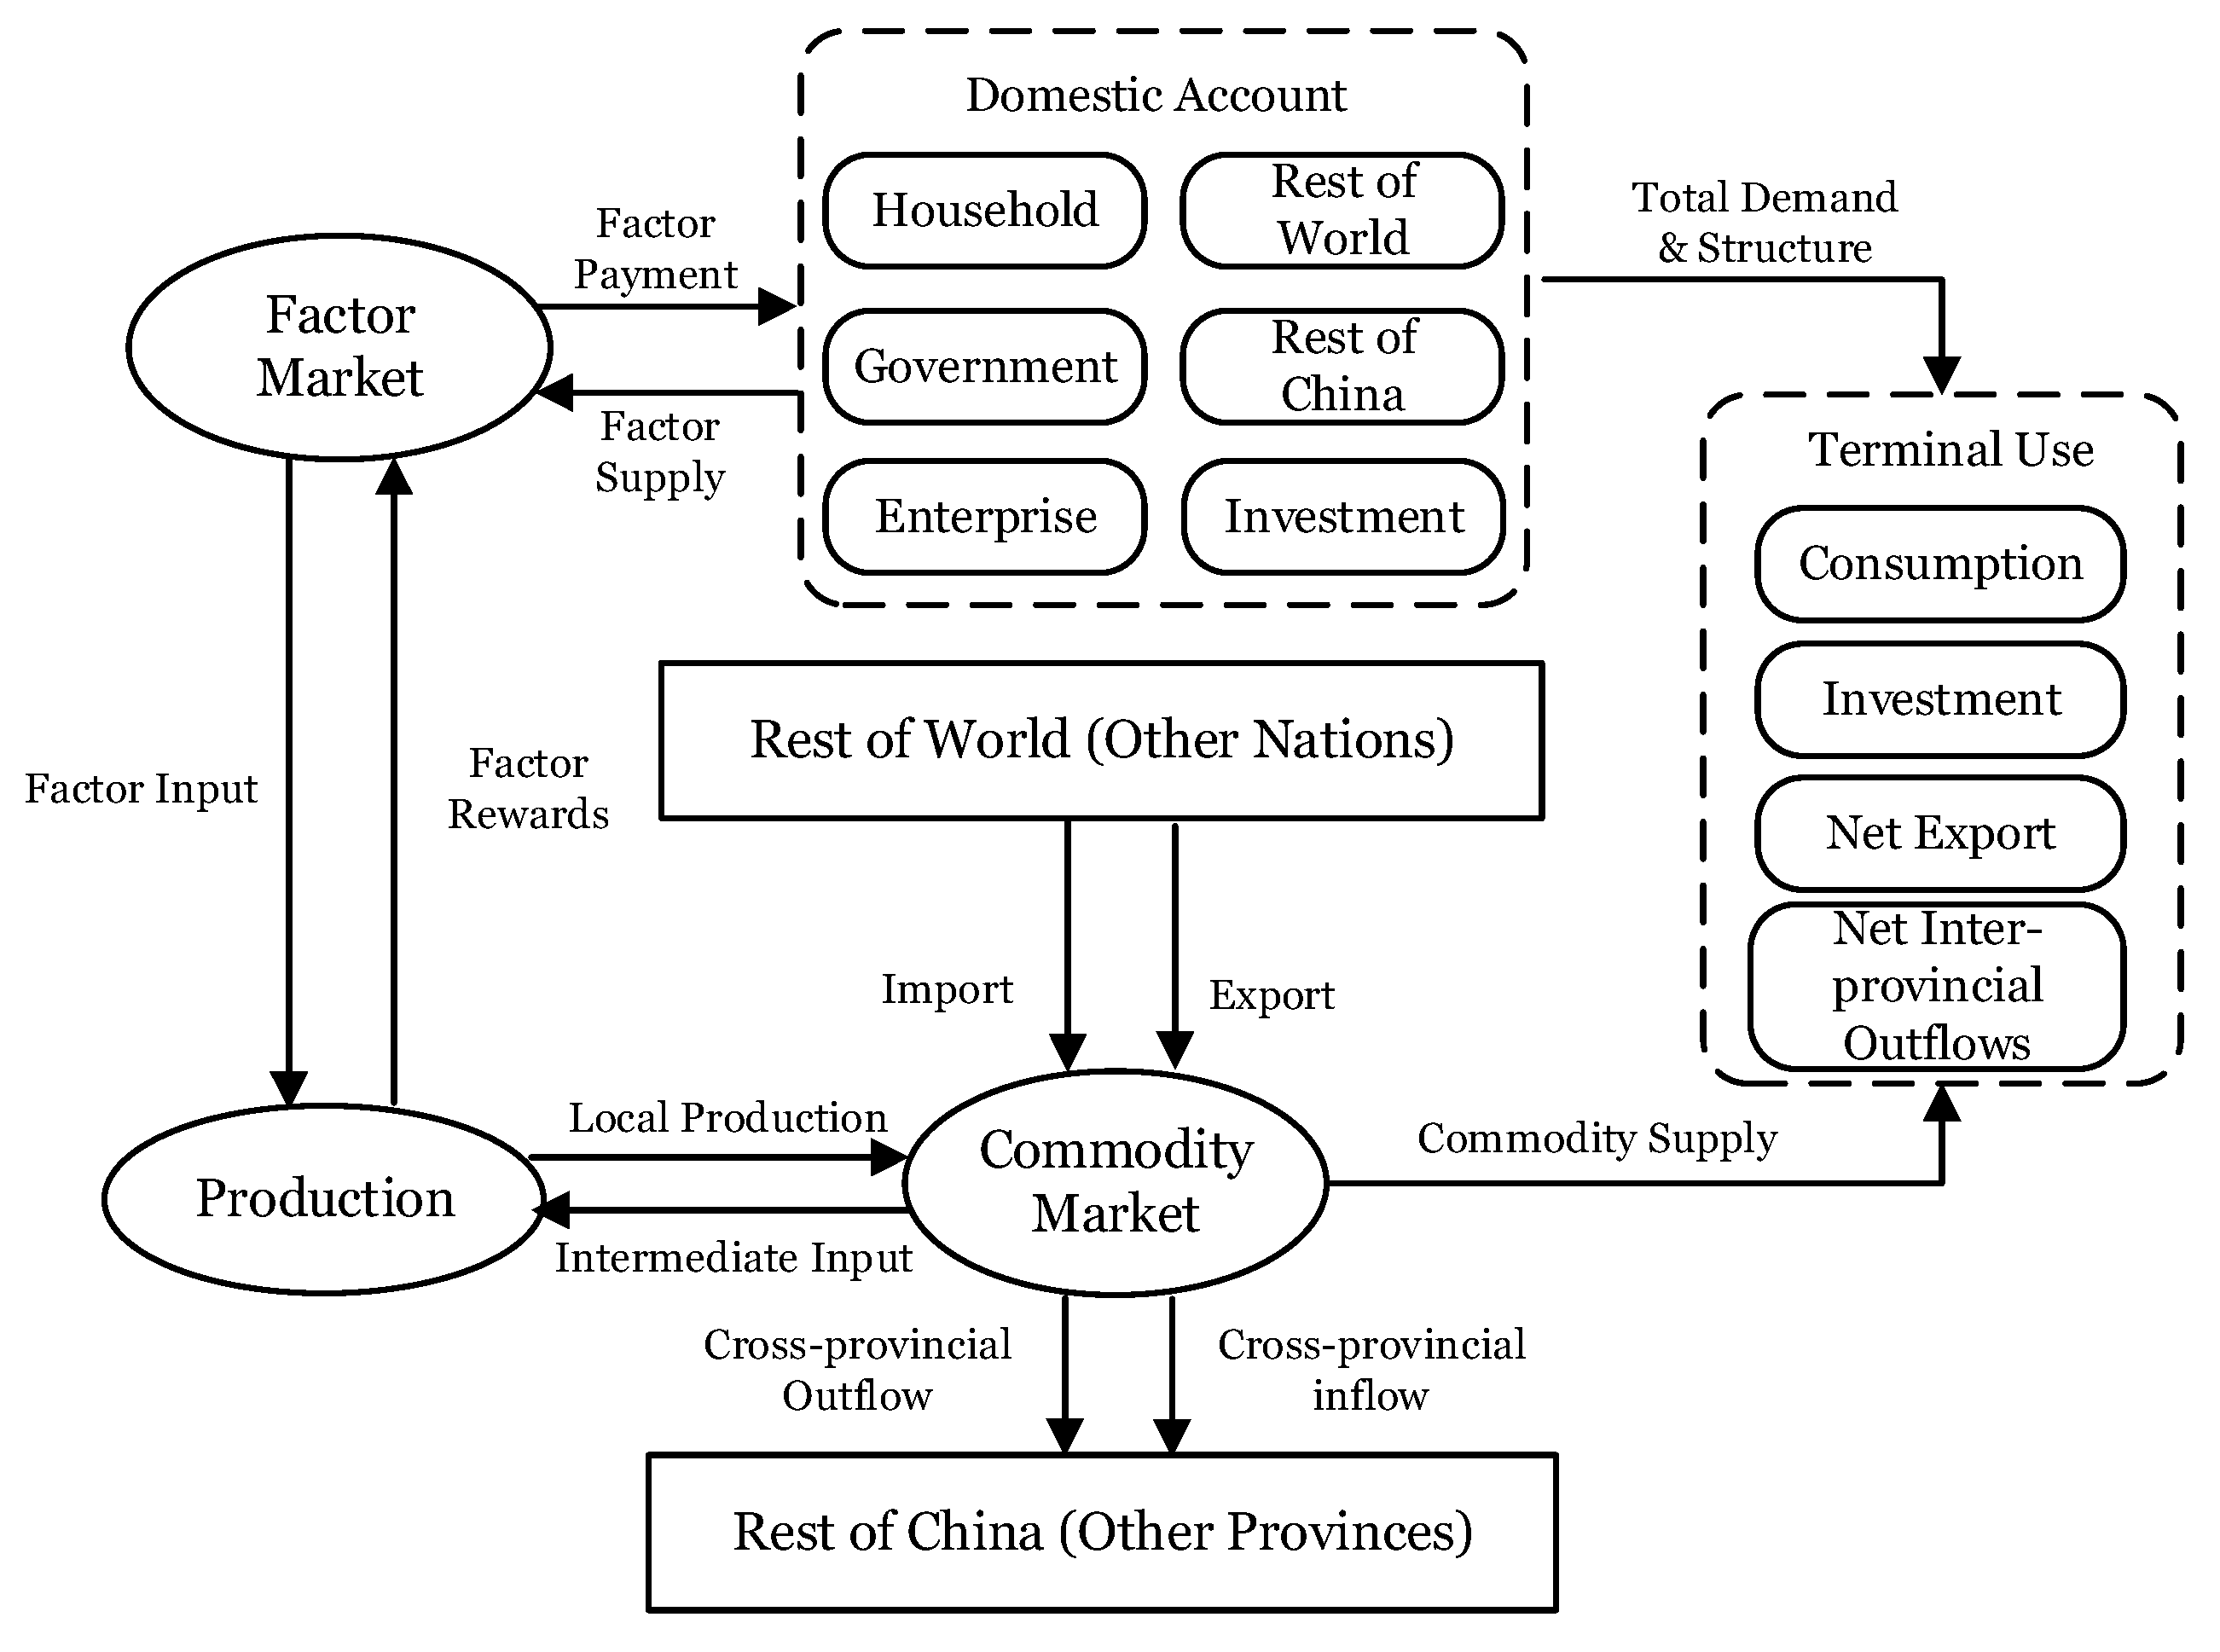
40]. Raw material and terminal product prices are always closely correlated, and the entire economic system could be shocked after an external intervention on a particular production material price. The policy of adjusting electricity price is precisely equivalent to intervening in the balance of the production factor market. Correspondingly, it is not rigorous to investigate the macroeconomic effects of price-cutting policy based on a partial equilibrium discussion; building an equilibrium model that synchronously accommodates multiple departments and markets is more appropriate. We therefore introduce the CGE model to this study. The CGE model is based on the Walras General Equilibrium and consists of a set of equations. These equations describe the behavior of each economic agent, as well as their technical, income, and institutional constraints. To efficiently capture the economic responses of Zhejiang province, the standardized model needs to be improved. Combining the characteristics of the provincial economy, we eventually constructed a provincial CGE model, as shown in
Figure 1.
Figure 1 displays the interrelationships among the various departments in Zhejiang province. The Production module contains the entities of commodity production. It purchases intermediate inputs from the Commodity Market module. It obtains factor inputs from the Factor Market module, while its output flows into the Commodity Market module and its factor rewards allocate to the Factor Market module. For the Commodity Market module, more than connecting with the Production process, it interflows with the market in the Rest of China module (other domestic provinces) and Rest of World module (foreign countries) through inter-provincial and import-export trades, respectively. Thus, the output of the Commodity Market module ultimately supplies four kinds of demand: local consumption, local investment, net export, and net inter-provincial outflows. Capital and labor are the essential production factor inputs included in this model; the Factor Market module obtains these factors from various entities in the domestic accounts and then invests in the Production process. The Domestic Accounts module has several sub-accounts, Household, Government, Enterprises, Rest of world (foreign countries), and Rest of China (domestic accounts outside the province). Various payments exist between these sub-accounts, and they all satisfy the principle of balance between income and expenditure. Commodity demand in each sub-account constitutes the total demand. Incorporating the demand structure, the terminal use demand can be formed, thereby linking to the Commodity Market module. The interaction of multiple modules enables the CGE model to complete the macro-closure. The
Appendix A context explicitly introduces some of the modules.
3.2. Social Accounting Matrix (SAM)
Constructing a CGE model needs consistent and complete base-year data including production, income, and consumption. The social accounting matrix (SAM table) contains the relationship between the original income and the final expenditure, which has become the fundamental data basis of the CGE model. Citing from Huang et al. [
41] and Wu and Lin [
33], this paper adopted a top-down method to compile the SAM table, including eight accounts for Commodities, Factors, Residents, Enterprises, Governments, Rest of World, Rest of China, and Investment.
The input-output table (IO table) is the foundation of the commodity and activity accounts of the SAM table. China’s input-output table is compiled once every five years, as is that for most provinces. The latest input-output table of Zhejiang Province was compiled in 2020 for 2017, which contains 42 departments. To effectively analyze the economic response to price changes in the power sector, we further split it from the primary production departments before introducing the IO table. Specifically, the power generation, transmission and distribution, and heating sectors were divided from the production and supply of the electricity and heat industry. This paper did not split out other production sectors since electricity price adjustment policies mainly affect power grid companies.
In addition to the IO table, the data of income, foreign investment, the balance of payments in the statistical yearbook, and final accounts data in the fiscal yearbook are also the basic data sources of the SAM table.
Table 1 displays the detailed data sources used in this research. It should be noted that the SAM table is for the year 2017, thus all the CGE estimation assumed the 2017 levels as the baseline.
Based on the original data, the total income or total expenditure of each account can be obtained. It should be noted that each account in the SAM table needs to maintain a debit balance, that is, the sum of each row must be equal to the sum of each column. According to this feature, the remaining items (such as corporate capital gains, corporate taxes and fees, inter-provincial foreign exchange transfers, resident savings, corporate savings, government savings, and inter-provincial net savings) can be calculated based on the total income or total expenditure of each account and other items already in the SAM table. Using the cross-entropy method of Robinson et al. [
42] to calibrate the data, we constructed the macro-social accounting matrix (see
Table A1).
3.3. Electricity Sector and Cross-Subsidy Design
Following the actual characteristics of Chinese electricity prices, we needed to construct a detailed design for the electricity sector and introduce cross-subsidy settings. The power grid is a natural monopoly in China, and its prices are subject to government supervision. The Chinese electricity price consists of three parts: “on-grid electricity price + transmission and distribution price (including line loss) + government funds and additional”. Specifically, the on-grid electricity price is equivalent to the sold price of power plants; the transmission and distribution price is used to compensate the power transmission cost of the grid company; and cross-subsidy is reflected in the terminal sales price of power grid companies, which can be calculated as “Sales electricity price minus feed-in electricity price and government funds”. Thus, estimating the power supply cost should be the first step to introducing cross-subsidy into the setting of the model. Citing Wu and Lin [
31], we decomposed the unit power supply cost into three parts: electricity cost, capacity cost, and line loss, as shown in Equation (A3).
where
represents the overall power supply cost;
is the power purchase cost, which is equivalent to the average on-grid price;
represents the capacity cost, which the transmission and distribution cost is also included in; and
represents the line loss cost, where the calculation process follows the formula:
where
is the line loss rate. The capacity cost is calculated based on the total installed capacity and the purchase and sale price, as described below:
where
represents electricity sales revenue;
and
are the electricity purchase cost and line loss cost, respectively; and
is the installed capacity.
Cross-subsidy is often the deviation between the value of the input and the actual amount in the CGE model. The calculation method is Equation (4), where
and
indicate the actual and value measured electricity consumption, respectively.
is the cross-subsidy correction parameter.
Due to the difference between the national and Zhejiang provincial power supply costs, we adjusted the cross-subsidy correction coefficient according to the correction deviation result in the input-output table of Zhejiang province. Moreover, we needed to modify the structure of the CGE model, thereby incorporating the changes in electricity prices, which is the basis of determining the macro-economic outcome of reducing electricity prices. The electricity price after price-cutting can be described by Equation (5).
where
represents the actual electricity price; thus
is the electricity price after cross-subsidy and
is the adjustment range of the electricity price.
As mentioned above, this paper used the base data from 2017. For the electricity sector, most data are sourced from National Energy Board, such as on-grid electricity price, sales electricity price, and line loss. We obtained the installed capacity and power consumption data from the “2018 China Electric Power Yearbook”. Based on the above data, we eventually estimated the power supply cost and cross-subsidy ratio as shown in
Table A2.
3.4. Policy Scenario Setting
In the context of decreasing the general industrial and commercial electricity prices in China, Zhejiang Province has adjusted electricity prices several times in recent years. For the first round of price-cutting policy, the general industrial and commercial electricity price was reduced by 10% in 2018, which was latterly extended to 2019. Thus, compared to 2017, electricity prices were reduced by a total of 19% in 2019. Subsequently, in 2020, the National Development and Reform Commission further required that the general industrial and commercial electricity prices settle at 95% of the original to-home electricity price level. This policy is temporary and aims to hedge the negative economic impact of the COVID-19 outbreak. This became the second round of electricity price reduction. There are expanding peak–valley differences in the Zhejiang power grid. To efficiently solve this problem by a better price-signal mechanism, the Zhejiang Provincial Development and Reform Commission issued a policy to reduce the electricity price of large industries. This was the third round of price-cutting policy. Specifically, this policy requires implementing new transmission and distribution electricity prices and sales prices from 1 January 2021. The average sales price of large industries is expected to drop by 5.2 cents per kilowatt-hour from 2019.
Table 2 summarizes the electricity prices after the three rounds of adjustments.
In summary, three electricity price-cutting policies were introduced in Zhejiang province after 2017 (see
Table 3). Firstly, a policy of reducing the general industrial and commercial electricity prices by 10% for two consecutive years, i.e., 2018 and 2019, was introduced; the second policy scenario cut electricity prices by 5% in all industries except energy-intensive industries, which was a temporary policy for responding to COVID-19; and thirdly, a policy of decreasing the average sales price of large industrial enterprises by 5.2 cents/kWh compared to 2019 levels was introduced.
4. Policy Shocks and Economic Responses
Since decreasing electricity prices reduces electricity expenditure on the user side, the revenue of the grid is affected. It is crucial to set the cost-sharing mechanism of the electricity price-reduction policy in simulating the policy scenarios. The cost of price cutting should be shared between the government and grid companies in a particular proportion. This section assumes that 40% of the cost is undertaken by the government, while other costs are attributed to power grid companies, similar to previous research [
43].
4.1. Reducing General Industrial and Commercial Electricity Prices
Generally speaking, general industrial and commercial electricity prices are available to both light industry and tertiary industry. In accordance with this, we simulated the economic response facing the electricity price-cutting policy in 2018 and 2019.
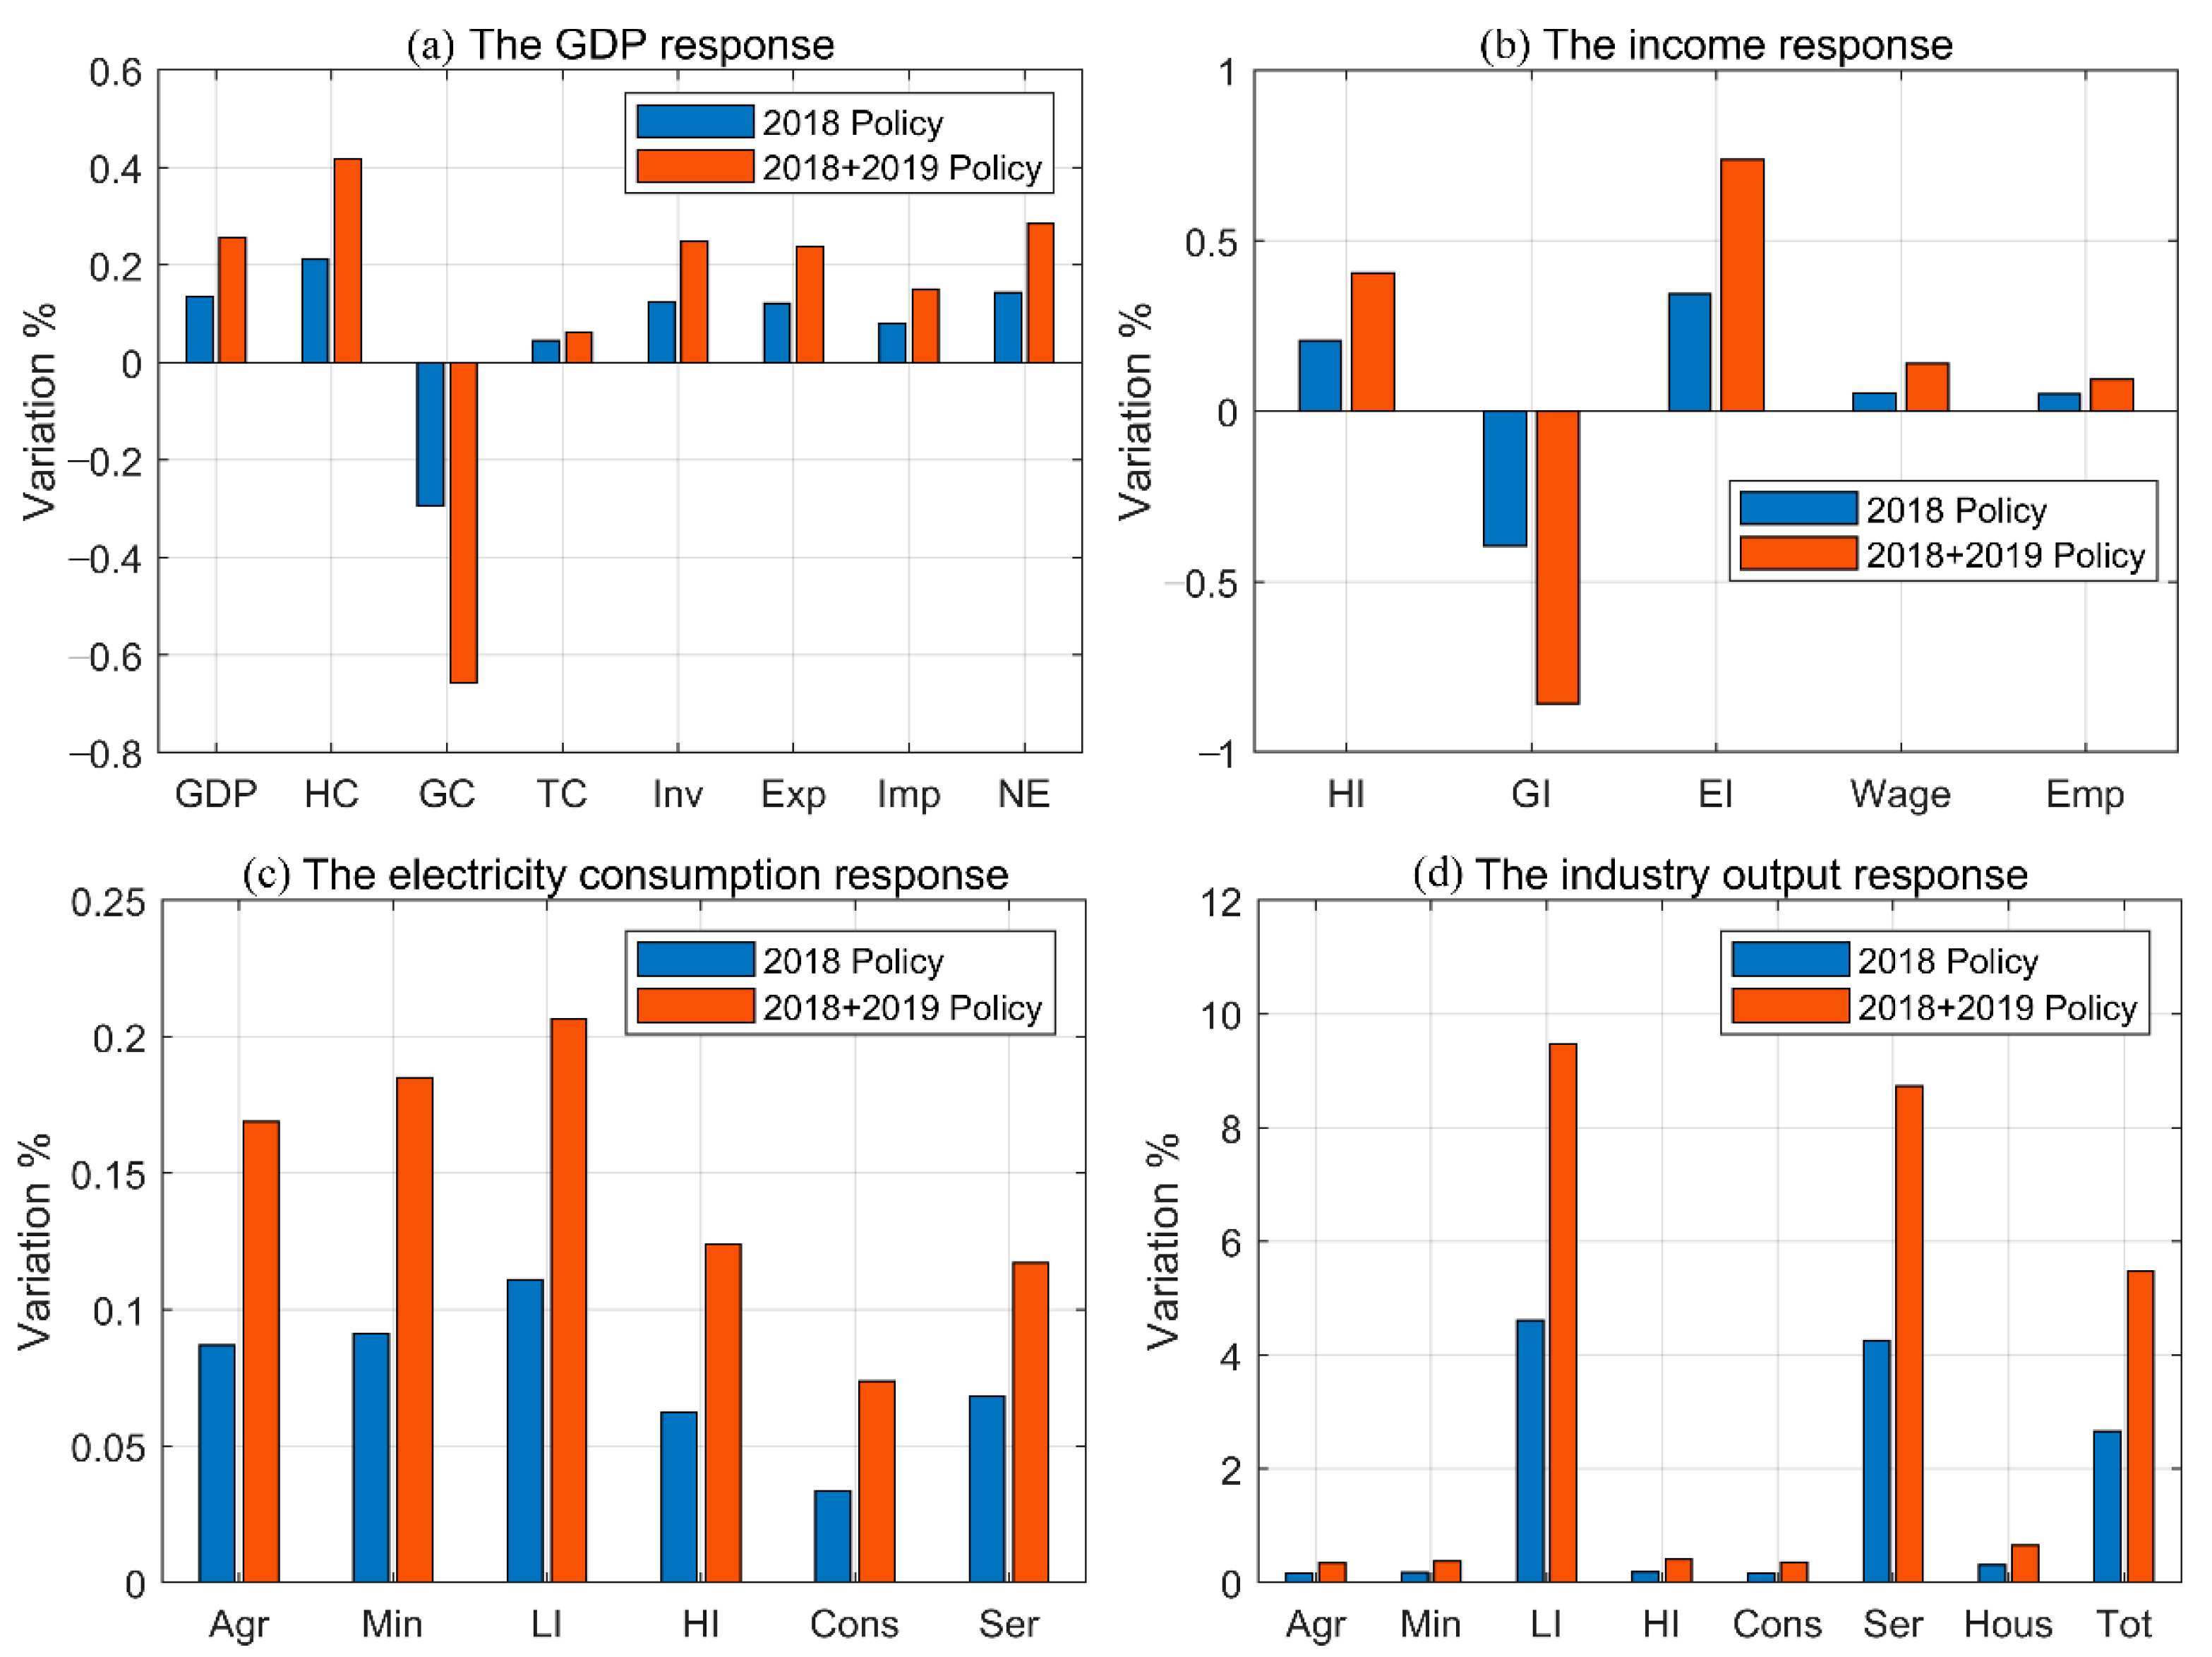
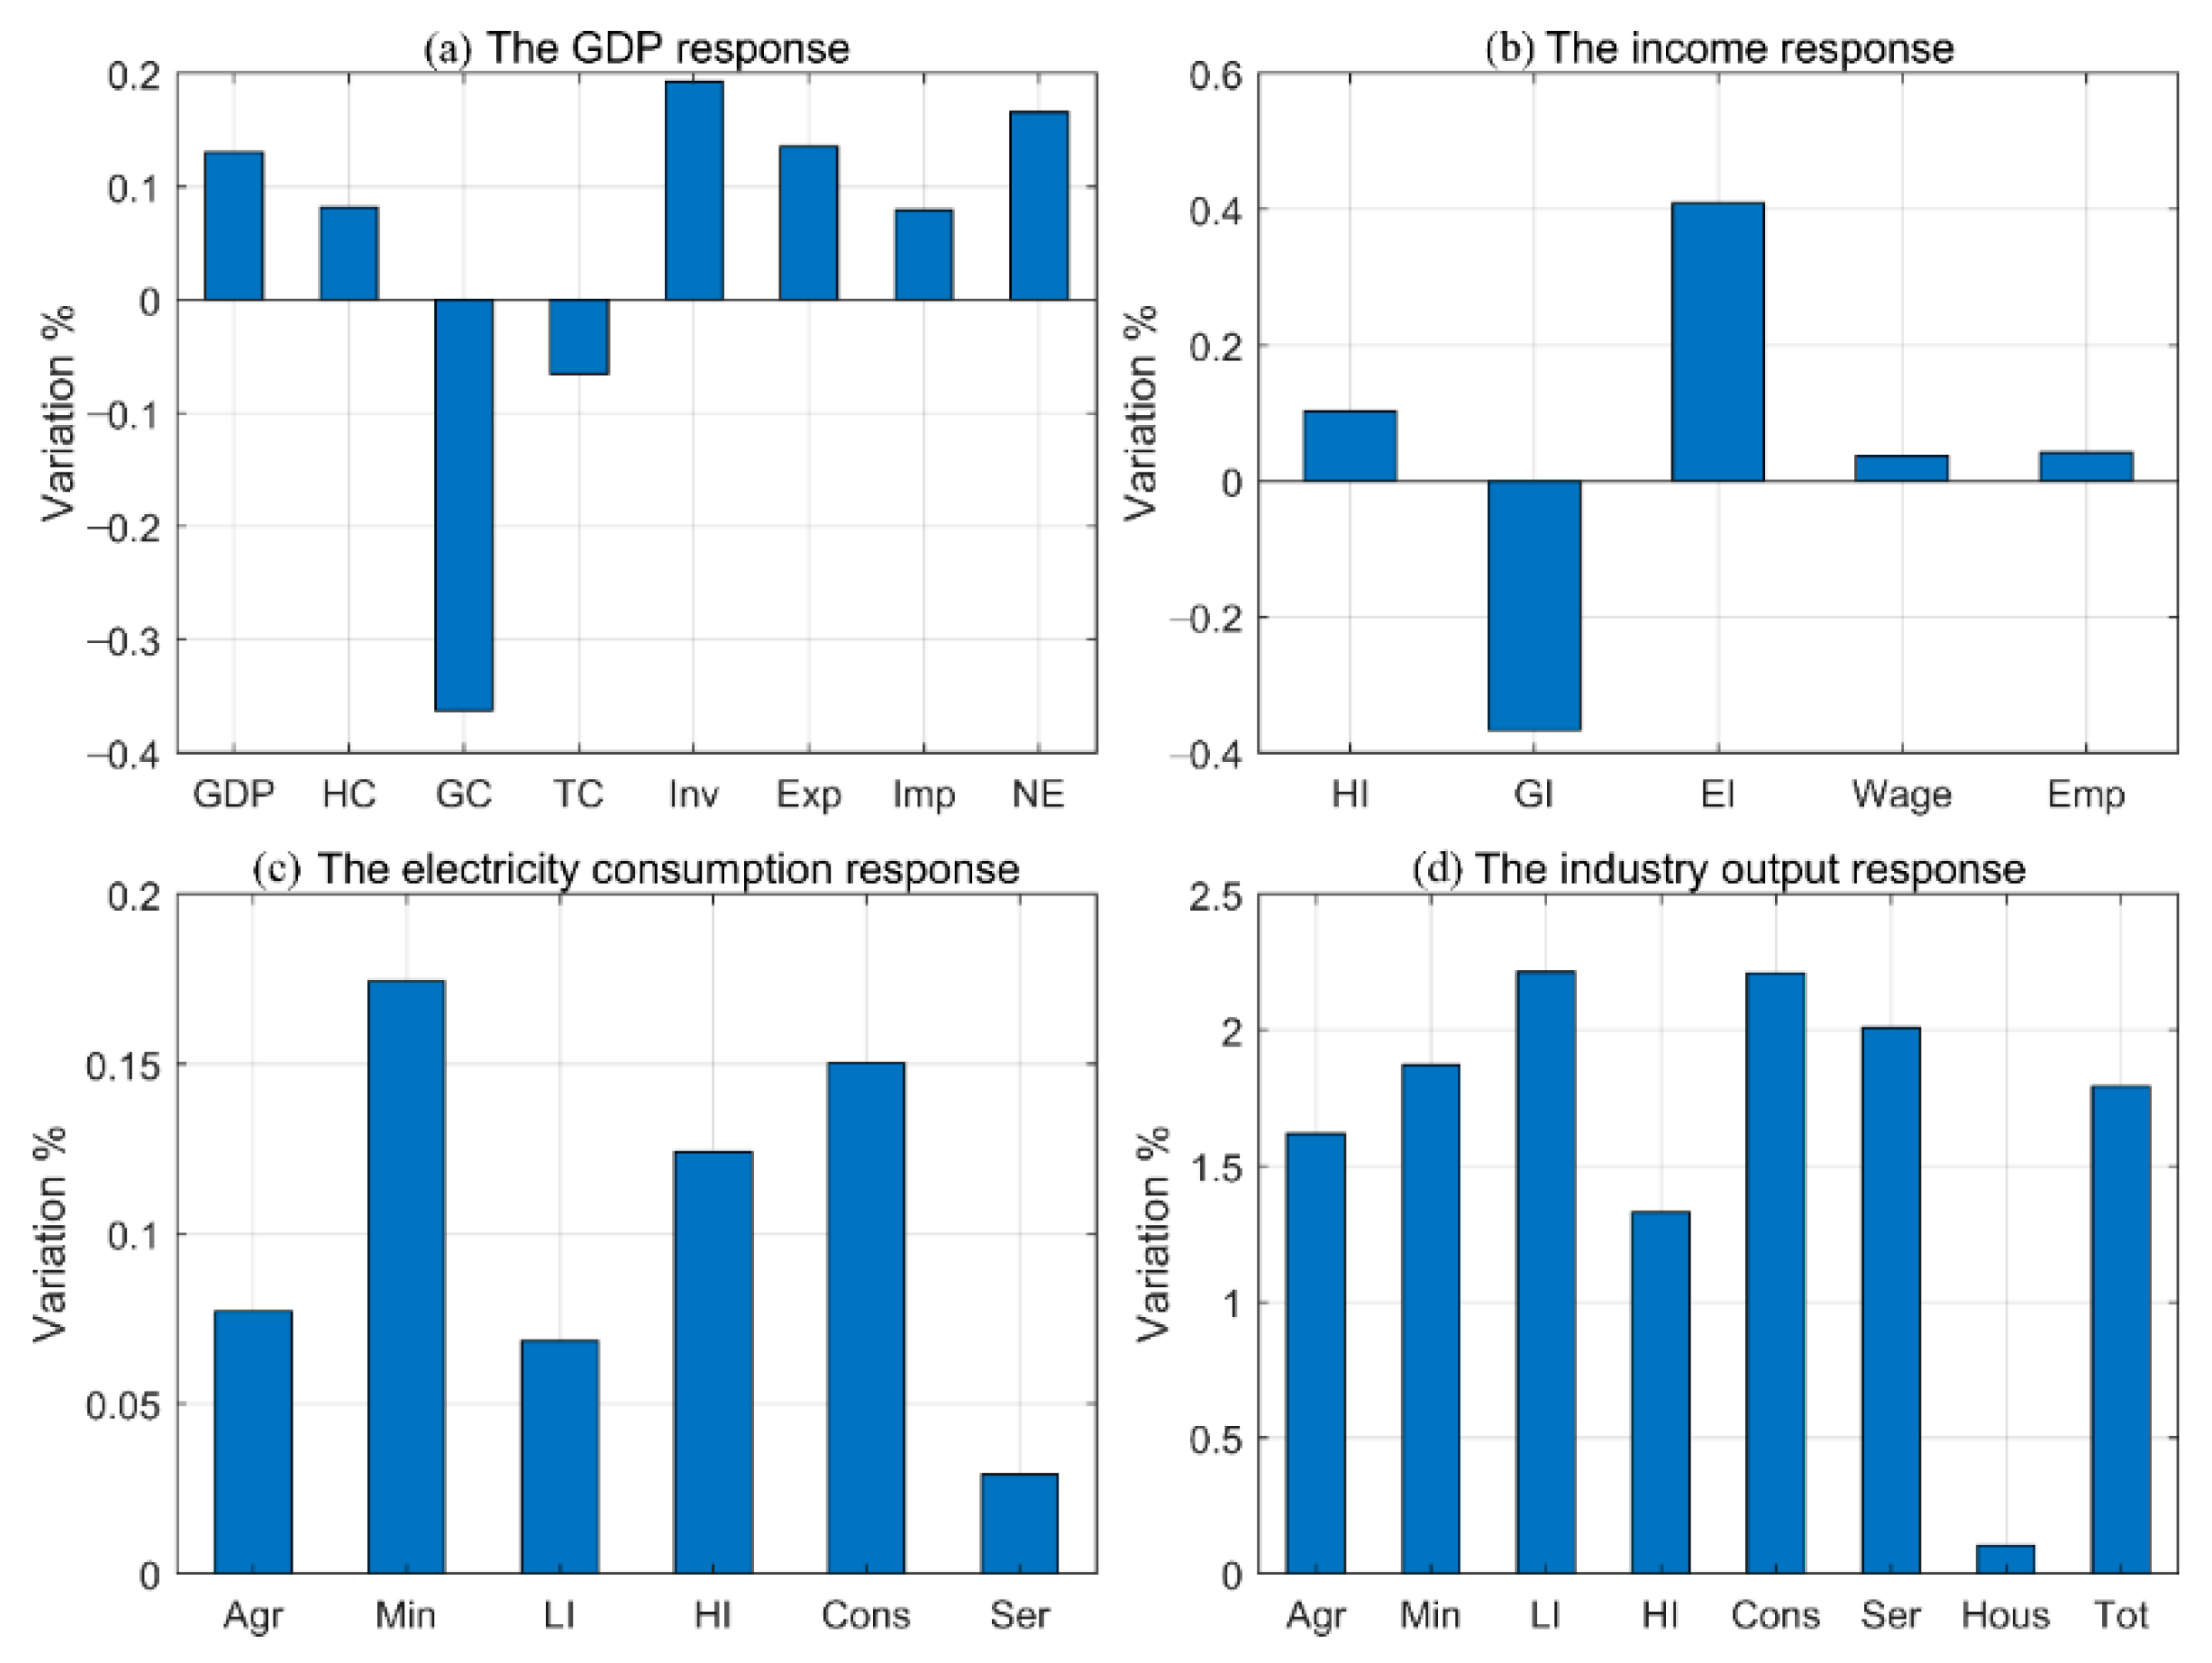
Figure 2 shows the impact of the DinG policy scenario on the macro-economy in Zhejiang province. There are four sub-graphs in this figure, corresponding to the responses for four aspects, the overall economic condition (GDP), the income of major entities, electricity consumption for various industries, and industrial outputs. The response in 2019 superimposes the impact of 2018 price-cutting.
As shown in
Figure 2a, the electricity price-cutting policy in 2018 increased total GDP by 0.135%, and GDP further rose by 0.2571% after 2019. If calculated according to the actual GDP in 2017, the two price adjustments increased Zhejiang’s GDP by 7.1 billion yuan and 13.5 billion yuan, respectively. In general, decreasing the general industrial and commercial electricity prices positively impacted total GDP, though such an economic response is not so remarkable. Closer inspection of the various components of GDP indicated that the growth rate of household consumption was the largest, increasing by 0.212% and 0.418% for two years. The rationale behind this phenomenon is that a high proportion of products in general industry and commerce are used for terminal consumption. The drop in electricity prices might decrease product prices, which ultimately attracts more household consumption. Another channel is that residents’ disposable income was raised indirectly. There are a considerable number of employees in general industry and commerce. After decreasing the electricity price, the drop in production costs and the rising demand made it possible to increase wage levels, thereby positively affecting consumption. Unlike household consumption, the reduction in electricity prices has produced a negative impact on government consumption. The price adjustments reduced government consumption by 0.294% and 0.658% in 2018 and 2019, respectively. This outcome might be attributed to the decreases in government revenue. The price-cutting cost is eventually afforded by the government and grid companies. As the grid companies are also nationalized, all the price-cutting costs are related to the government, reducing its purchasing power. Additionally, household consumption accounts for a more significant proportion of total consumption than government consumption, so the final total consumption still slightly increased by about 0.045% and 0.062% after the two price adjustments. Investment also responded positively to the decline in general industrial and commercial electricity prices. A possible explanation for this might be that the increase in the income of related industries motivated greater demand for investments. With the ascent of residents’ incomes and the corresponding rise in savings, investment inevitably became more convenient. The lower electricity prices even induced an opportunity for industries to produce products with lower total costs. As a result, Chinese products became more competitive in the international market, and a higher increase was found in exports rather than imports. Correspondingly, net exports increased after the policy shocks.
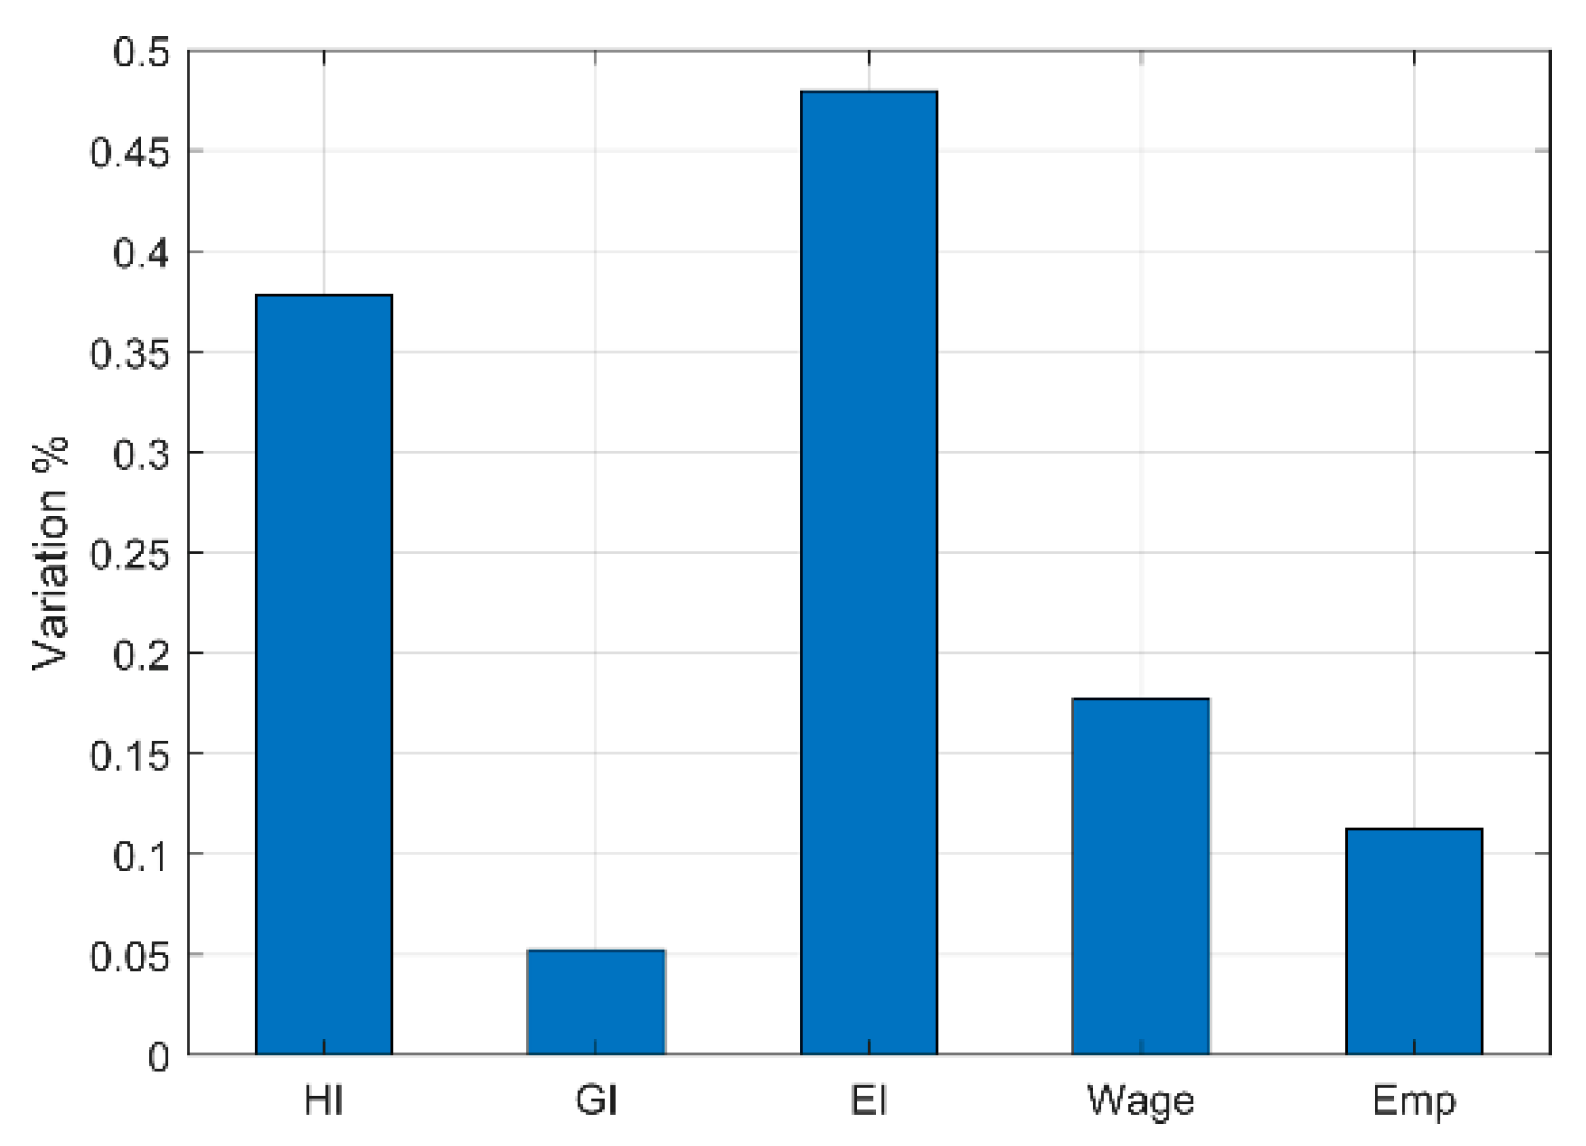
Turning now to the simulation results on the income of each entity in the economic system, the electricity price policy shocks in the two years increased the income of households by 0.207% and 0.406%, respectively. One of the main attributes of this situation was the increase in labor compensation income. With the general industrial and commercial demand growth, the overall wage level rose by about 0.053% and 0.140%. Meanwhile, the rising labor demand also brought a larger number of employed people. A decline in government revenue demonstrated that the government was the final payer for spending related to the electricity price policies.
Given that different industries have different sensitiveness to the electricity prices, the response of electricity consumption for various industries facing similar electricity price-cutting policy shocks might display different patterns. In
Figure 2c, it can be seen that the light and tertiary industries’ electricity consumption significantly increased but to different degrees. This result is consistent with the reality that the electricity price policy in these two years mainly aimed at general industry and commerce. The path from the electricity prices to consumption can be described from two aspects. On the one hand, as the relative cost of electric energy dropped after policy shocks, companies used more electricity to replace other energy or intermediate inputs; on the other hand, the cost of the related industries directly decreased for electricity price cutting, and the amount of output increased, thereby inducing an enormous amount of electricity demand. Interestingly, the electricity demand of other industries and residents also rose. This result may be explained by the fact that cutting electricity prices had a positive spillover effect on other sectors. The policy-induced income ascent of household income increased their capability to pay for more electricity consumption.
Figure 2d shows how the electricity price adjustments affected the output of various industries. Light industry achieved the largest growth in output due to direct lower production costs. Although the tertiary sector also benefited from the decline in power costs, its output growth was not as significant as light industry. These results are likely to be related to the nature of tertiary industry. Tertiary industry includes public service industries such as research and development, education, etc., and the main provider of these services is the government. The decline in government revenues caused by the electricity price policy led to a corresponding reduction in expenditures on public services, ultimately leading to a decline in the demand for tertiary industry. Industries that were not included in the scope of the reduction in electricity prices have also shown an output growth, which further mirrors the spillover effects of the electricity price policy. The expansion of the overall economy could drive the development of these industries; the policy shocks reduced the prices of general industrial and commercial products, which also alleviated the cost pressure of other industries for purchasing intermediate inputs.
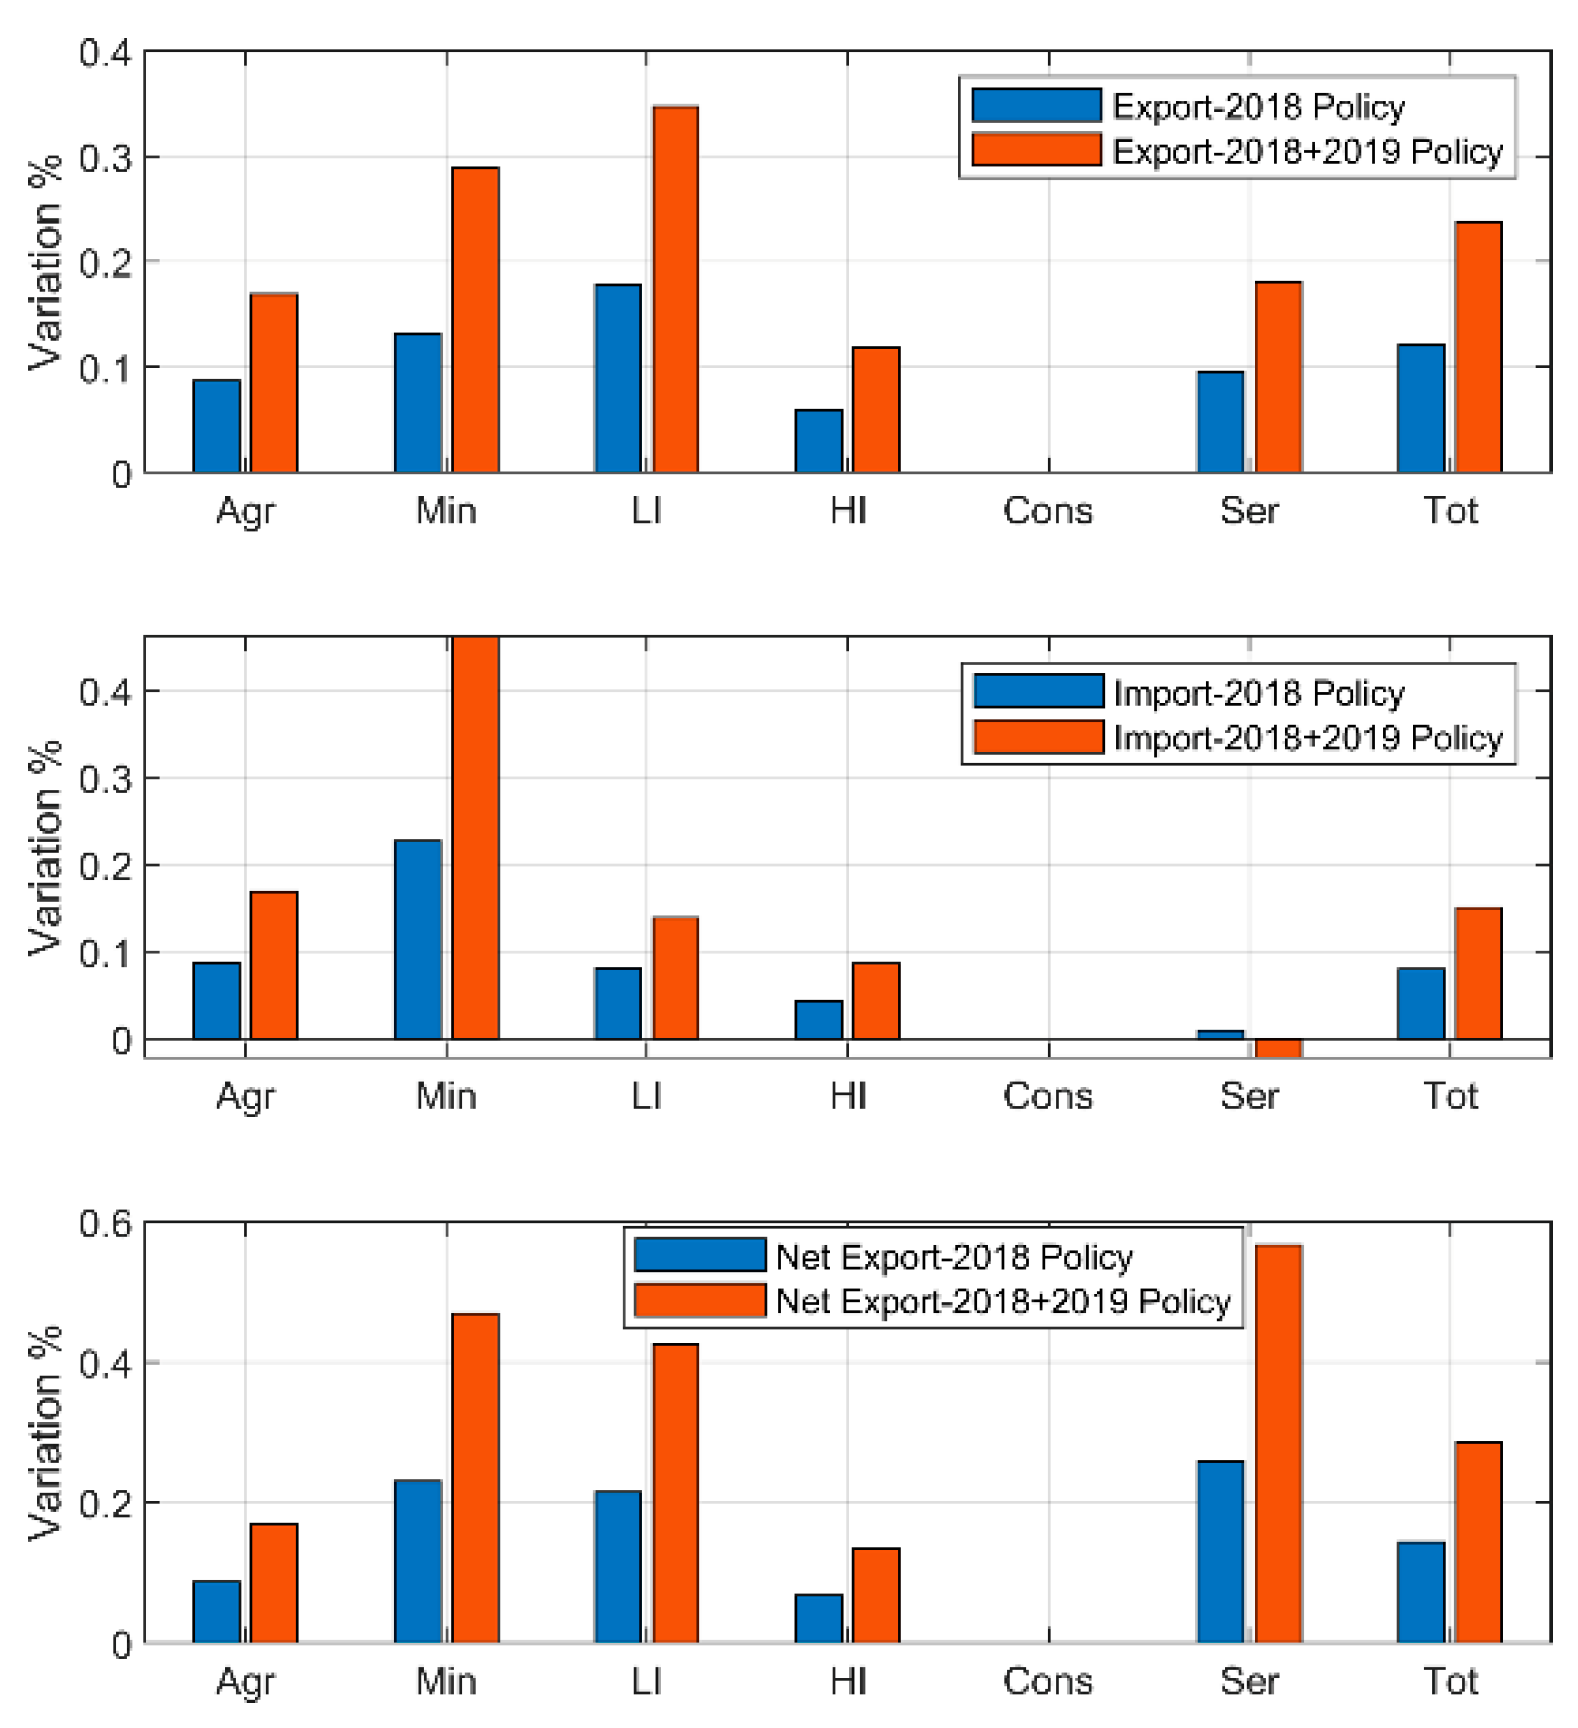
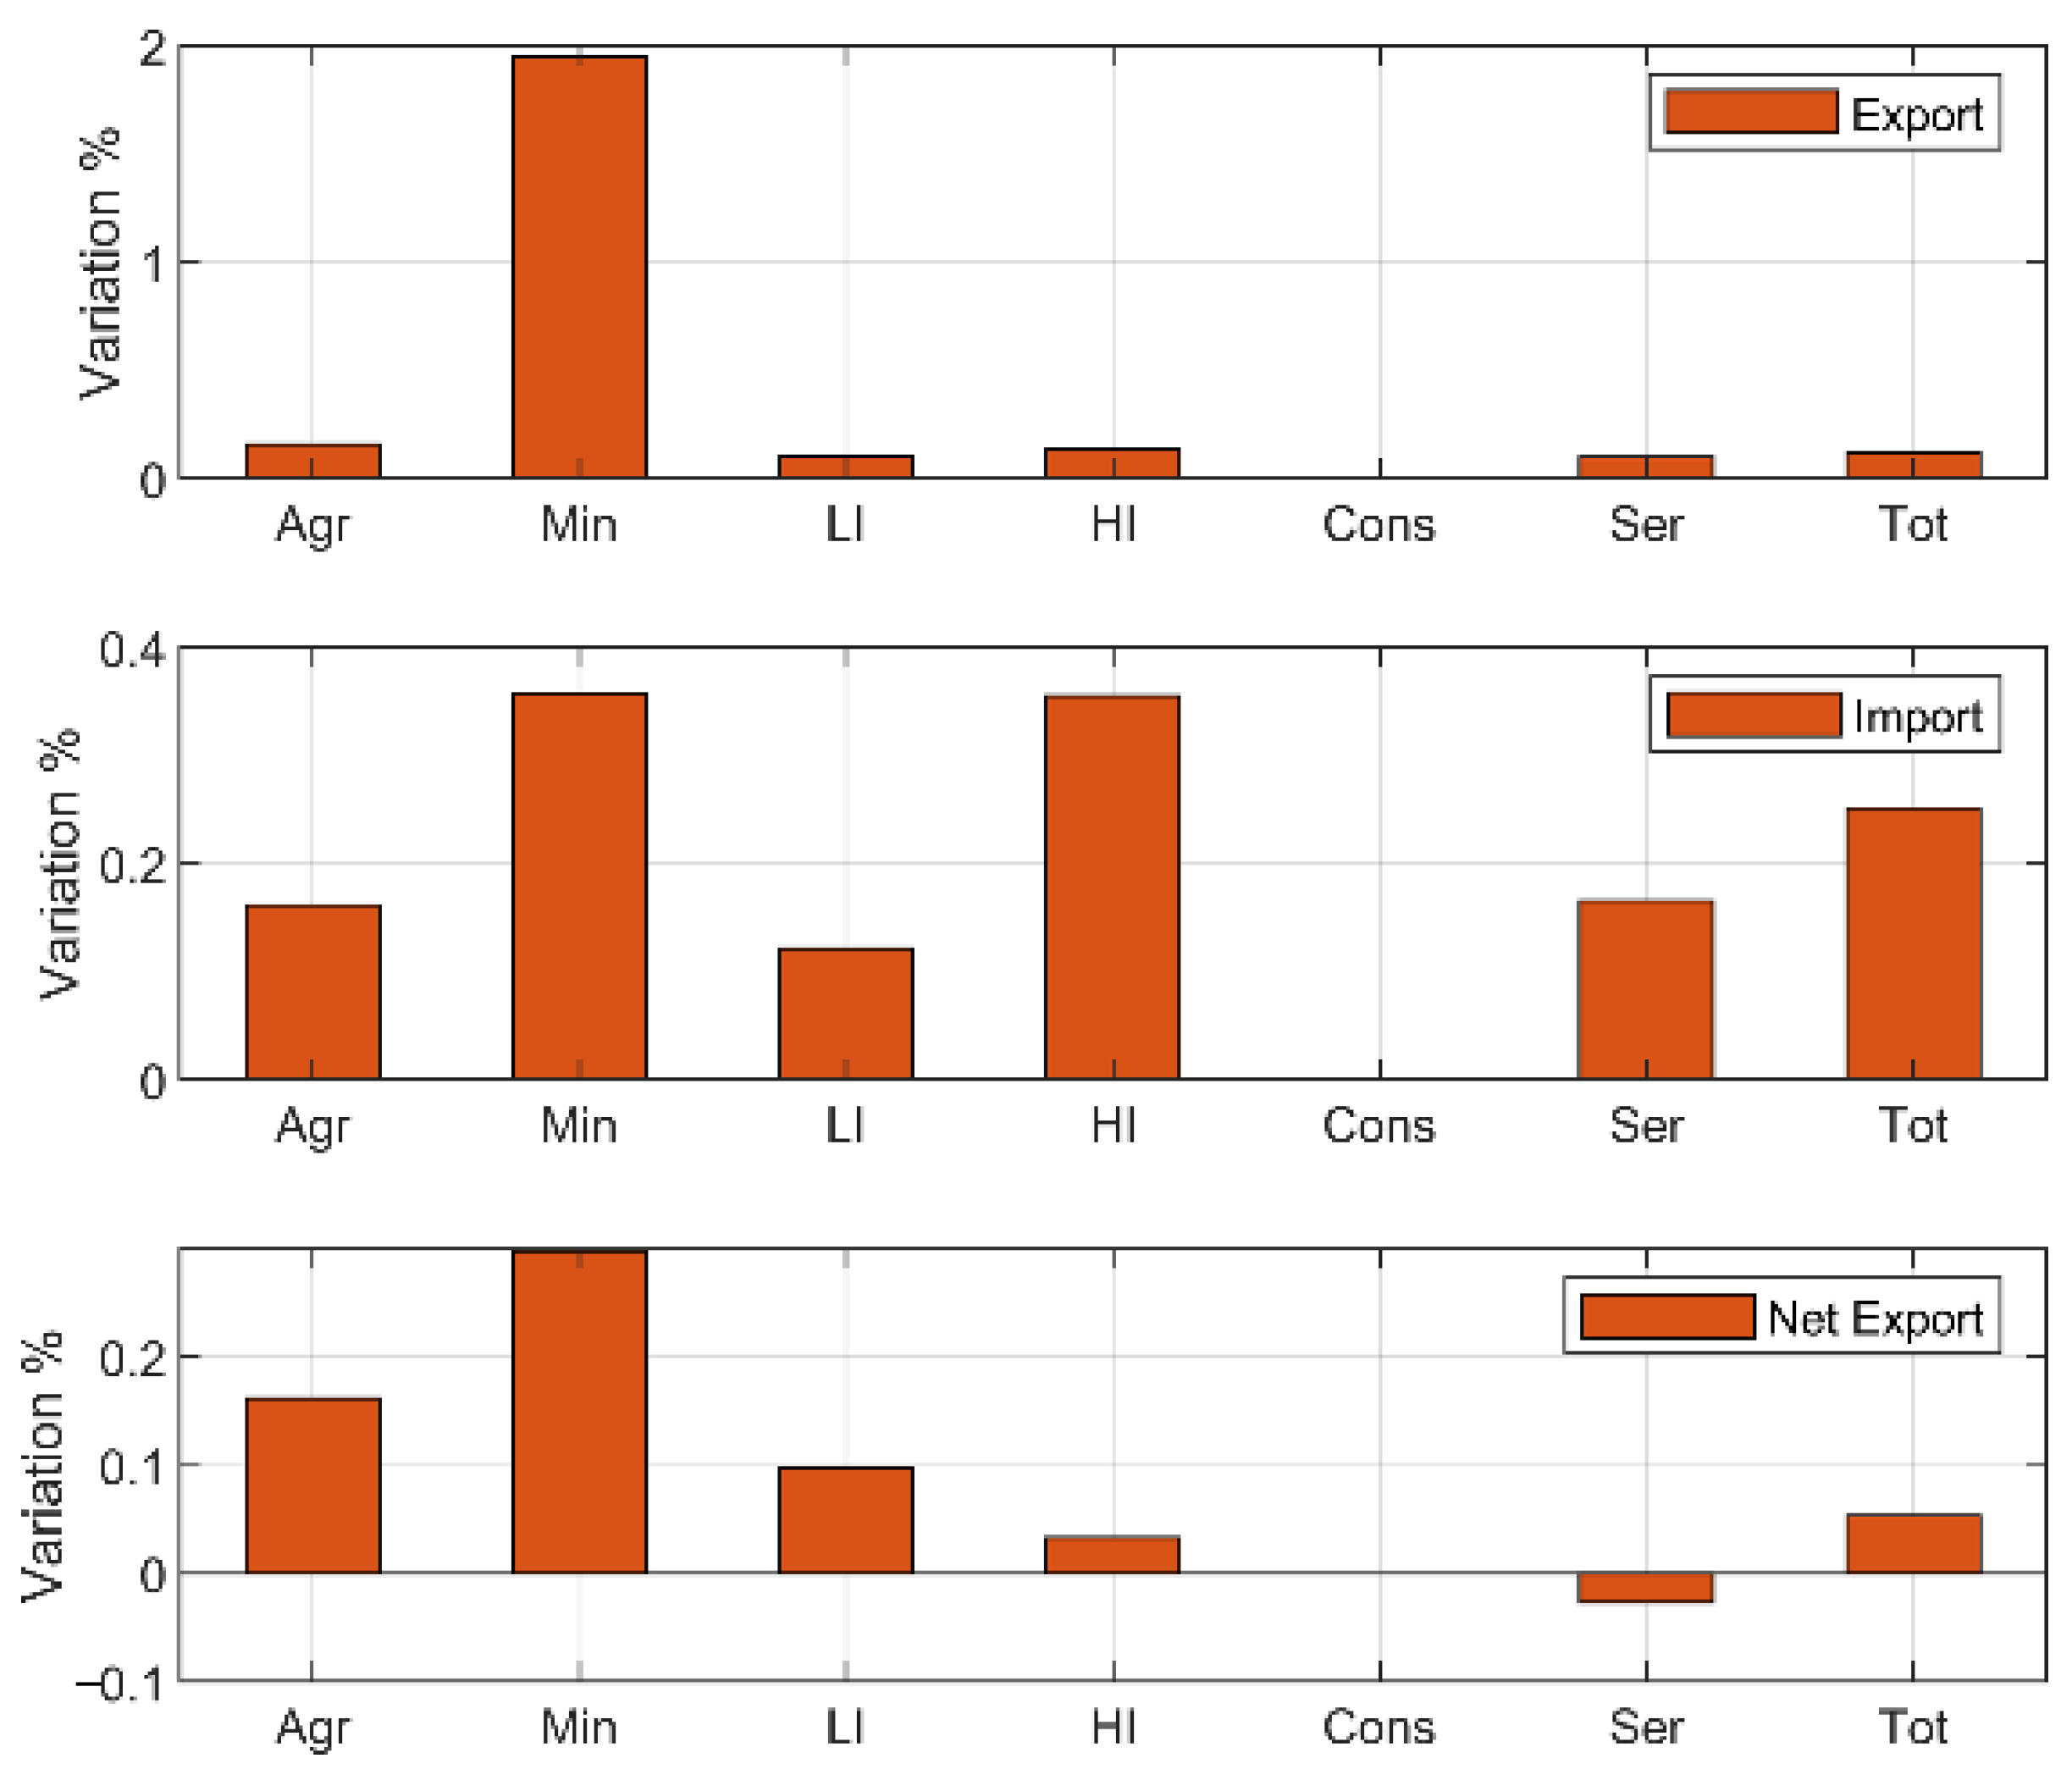
The decline in electricity prices brought Chinese products in related industries a better cost advantage. The import and export conditions correspondingly were affected. More details are shown in
Figure 3. The import and export volume of light industry both increased, but its import demand growth was lower than the export. Therefore, the net exports of light industry rose, which demonstrates that the policy of reducing electricity prices effectively promoted the development of an export-oriented economy. On the contrary, both imports and exports of the mining industry increased significantly, but the growth rate of imports was higher than that of exports. A possible explanation is that the increase in total electricity consumption drove the dependence on imported coal. Zhejiang’s electricity production is dominated by coal power, so there is a stronger demand for imported coal. Due to increasing industrial output growth, it is also rational to speculate that the demand for other mining products increased. Overall, the electricity price adjustments in 2018–2019 increased net exports by 0.13% and 0.29%.
4.2. Temporary Reducing Electricity Prices
According to the requirements of the National Development and Reform Commission, Zhejiang Province further reduced its electricity price by 5%. In addition to general industry and commerce, the industries covered by this policy were expanded to all non-energy-intensive industries. After excluding the six major energy-intensive industries (According to the "Statistical Report on National Economic and Social Development in 2010", the six energy-intensive industries are: chemical raw materials and chemical products manufacturing, ferrous metal smelting and rolling processing industry, non-ferrous metal smelting and rolling processing industry, and non-metallic mineral products industry, Petroleum processing, coking and nuclear fuel processing industry, power and heat production and supply industry), we simulated the economic response to this policy shock.
The responses of the macro-economy to the DinA policy shock are shown in
Figure 4. The temporary reducing electricity prices policy could increase GDP by approximately 0.12%. As this electricity price adjustment aimed to hedge the negative economic impact of the COVID-19 epidemic temporarily, the extent of the GDP response suggests this policy intervention played a limited role. From the perspective of the components of GDP, the temporary electricity price adjustment policy increased household consumption by 0.09%, while government consumption decreased. Similar to the electricity price-cutting policy in 2018 and 2019, these policy shocks also spurred growth in investment and net exports.
Figure 4b further explains the results of GDP responses. This electricity price adjustment positively affected wage levels and employment, which stimulated the growth of residents’ income and consumption. The decline in government consumption can be attributed to the decrease in government revenue, while the increase in investment and net exports might result from a higher corporate income and lower production costs.
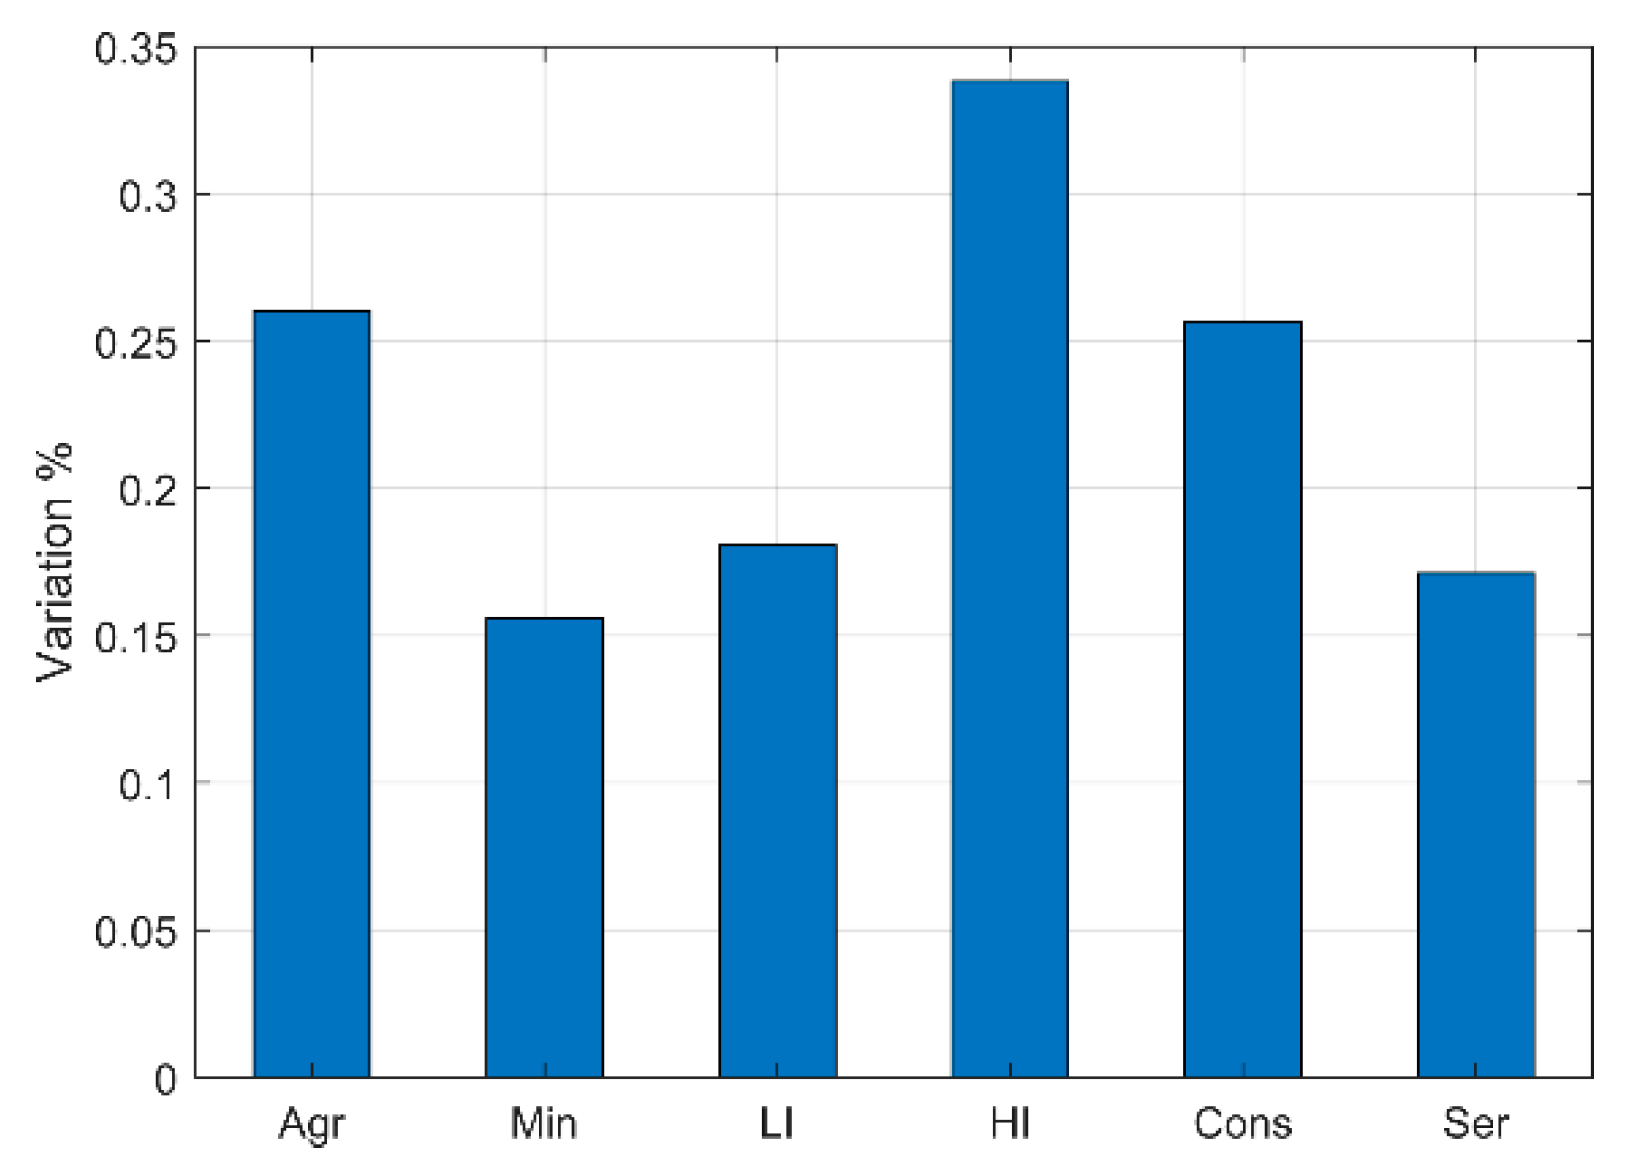
The price adjustments reduced the relative cost of electricity, bringing companies the incentive to replace other inputs with electric energy. Thus, the electricity demand of all departments increased facing the temporary electricity price policy shock. Specifically, the electricity demand for primary industry increased by 1.62%, the mining industry increased by 1.87%, light industry increased by 2.22%, heavy industry increased by 1.33%, the construction industry increased by 2.21%, tertiary industry increased by 2.01%, household consumption increased by 0.10%, and the total of electricity consumption increased 1.79%. It was found that the growth in electricity demand in heavy industry was not as high as in other industries since energy-intensive industries were not included in this price-cutting policy. Moreover, the output of various departments expanded. After the implementation of the price-reduction policy, the output of all industries increased slightly. The most surprising aspect of the output changes is that heavy industry even displayed a larger growth rate of output than some other industries, though electricity prices for energy-intensive industries remained in the initial stages. This discrepancy could be attributed to the fact that most heavy industrial products are used for investment. Responding to a policy shock, the increase in investment demand eventually triggered the output growth of heavy industry.
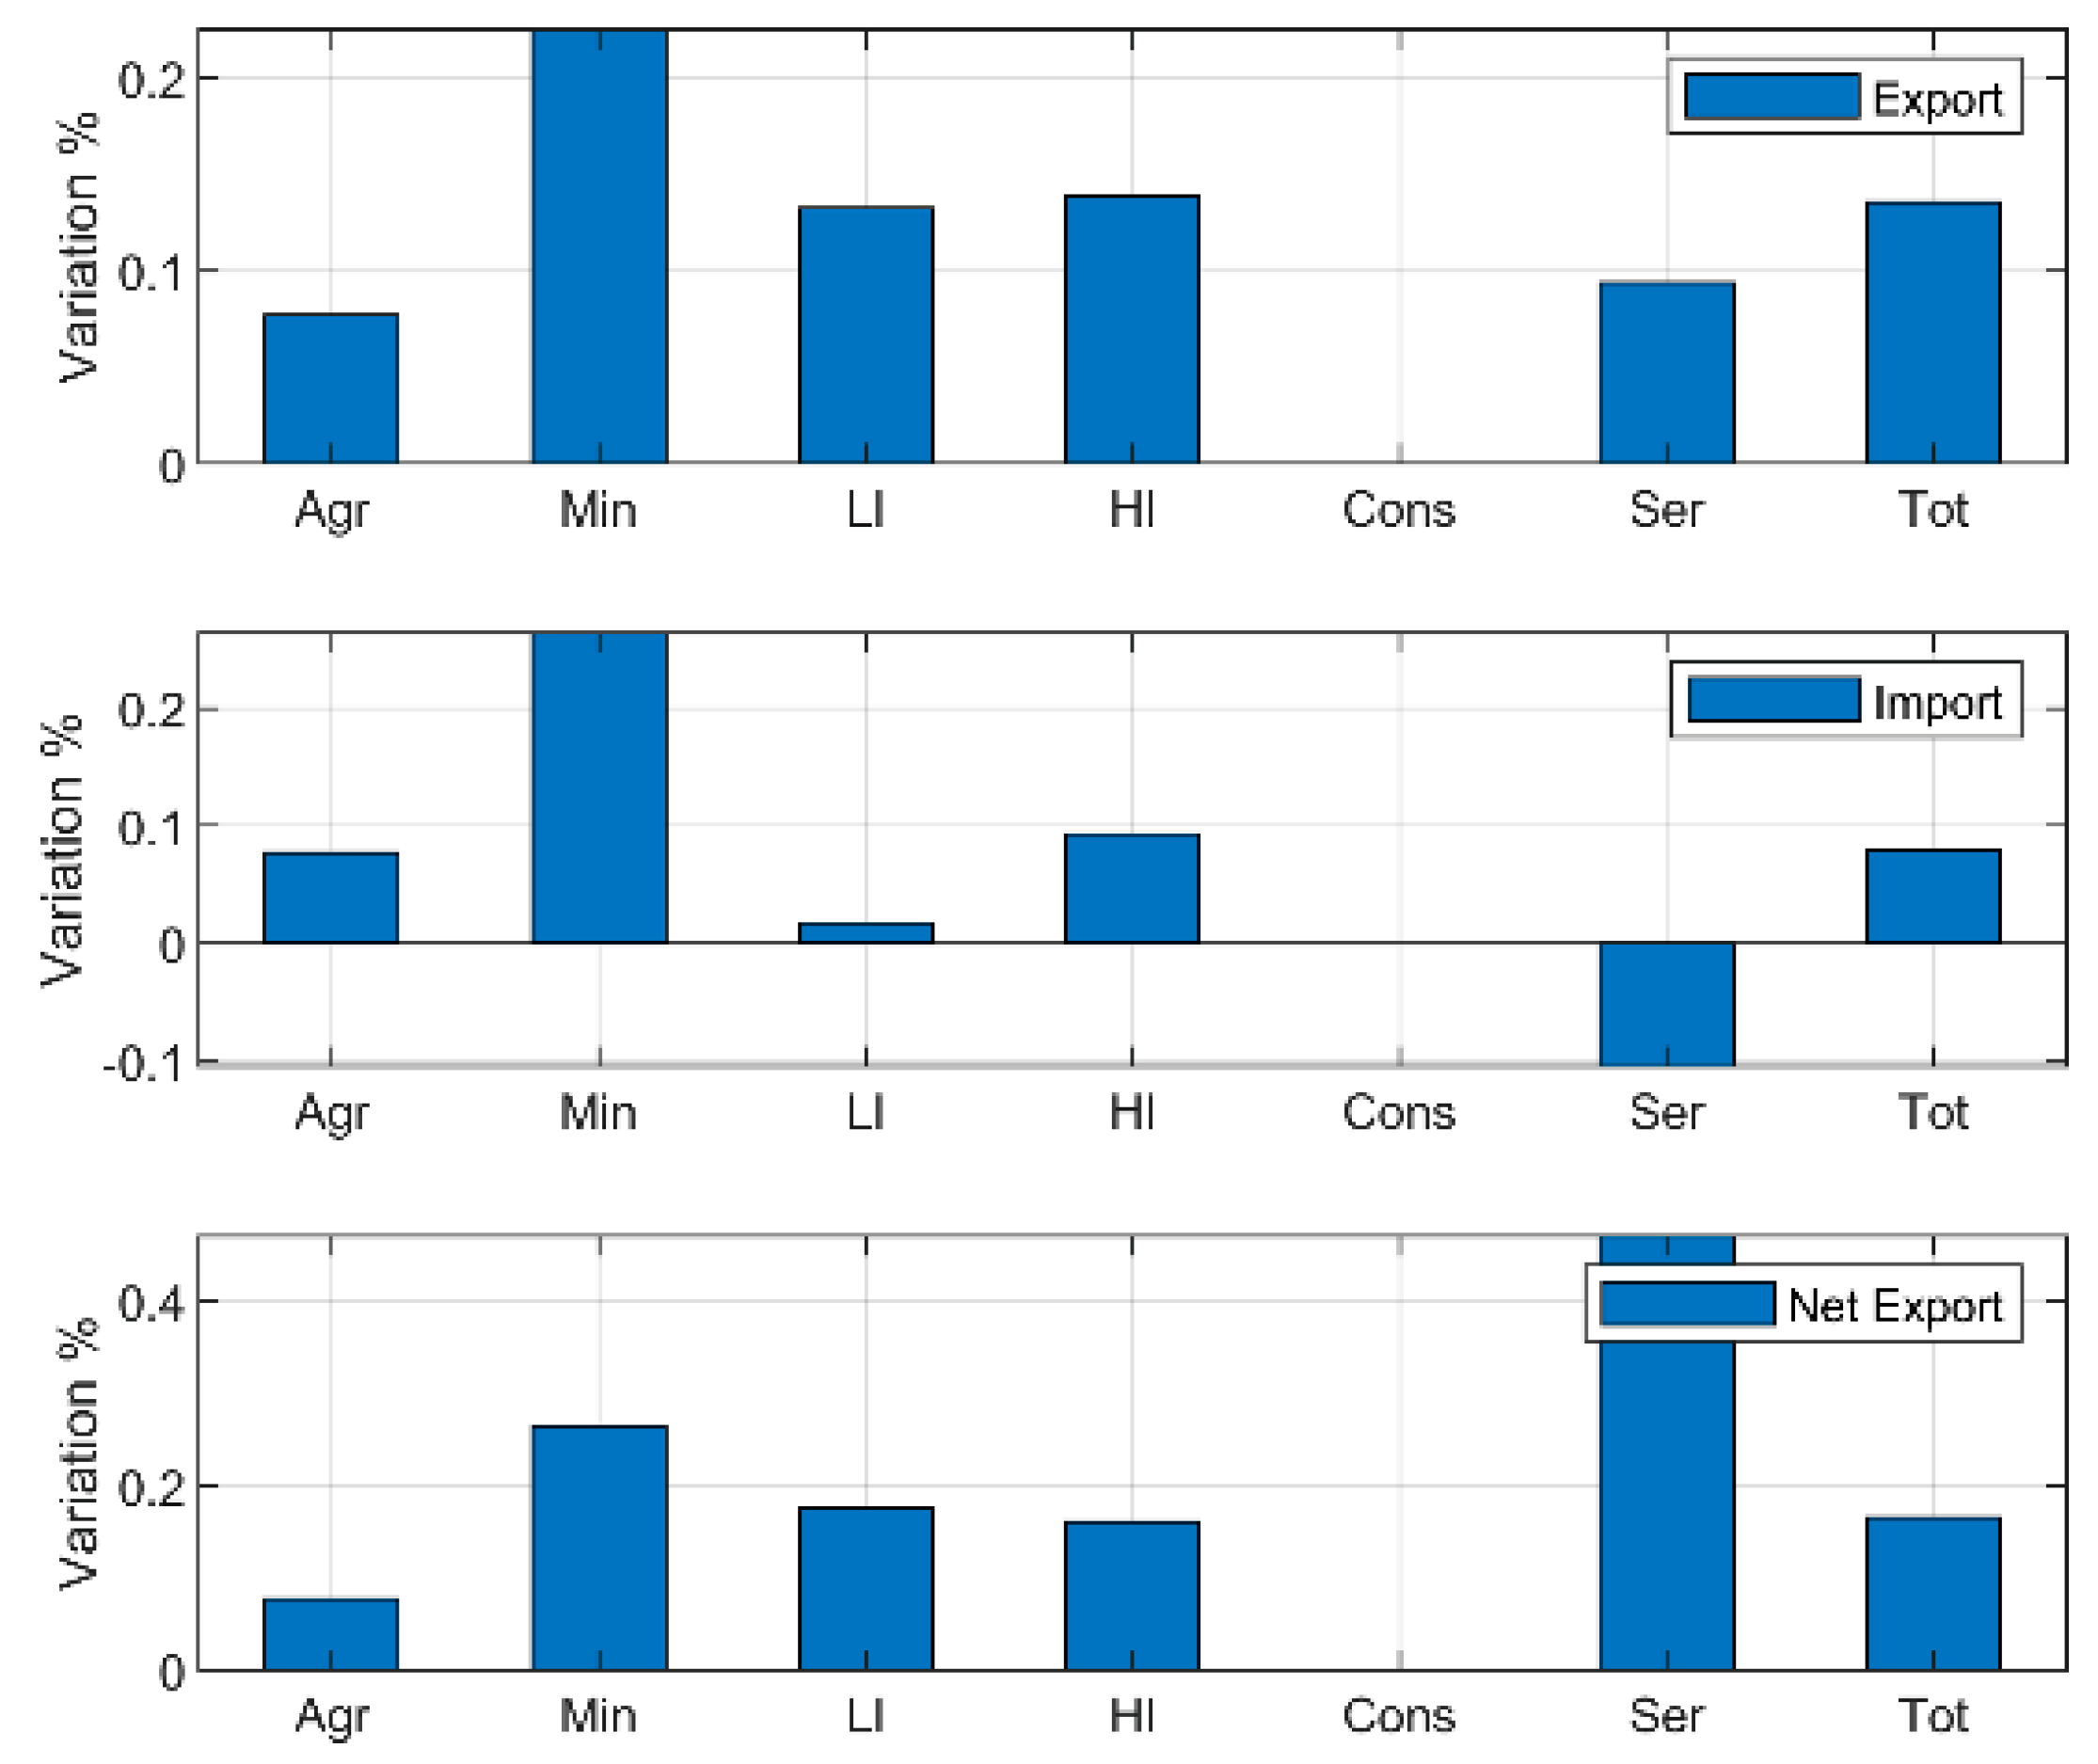
Figure 5 further illustrates the responses of foreign trade for different sectors. Overall, Zhejiang’s net exports might increase by 0.13% under the policy scenario DinA. In detail, the trade deficit of the mining industry decreased, while the surplus of other industries expanded. Among all sectors, tertiary industry had the highest growth rate of net exports. Both the economic and foreign trade responses to policy scenario DinA were similar to the impact of the 2018–2019 electricity price-cutting policy, suggesting different specific policy arrangements can always eventually guide economic operations through similar channels. The only difference in policy outcome was the various degrees of impact.
4.3. Reducing Large Industrial Electricity Prices
According to the policy content of the Zhejiang Provincial Development and Reform Commission, the average sales electricity price of large industries in Zhejiang Province will drop by 5.2 cents per kilowatt-hour compared with 2019.
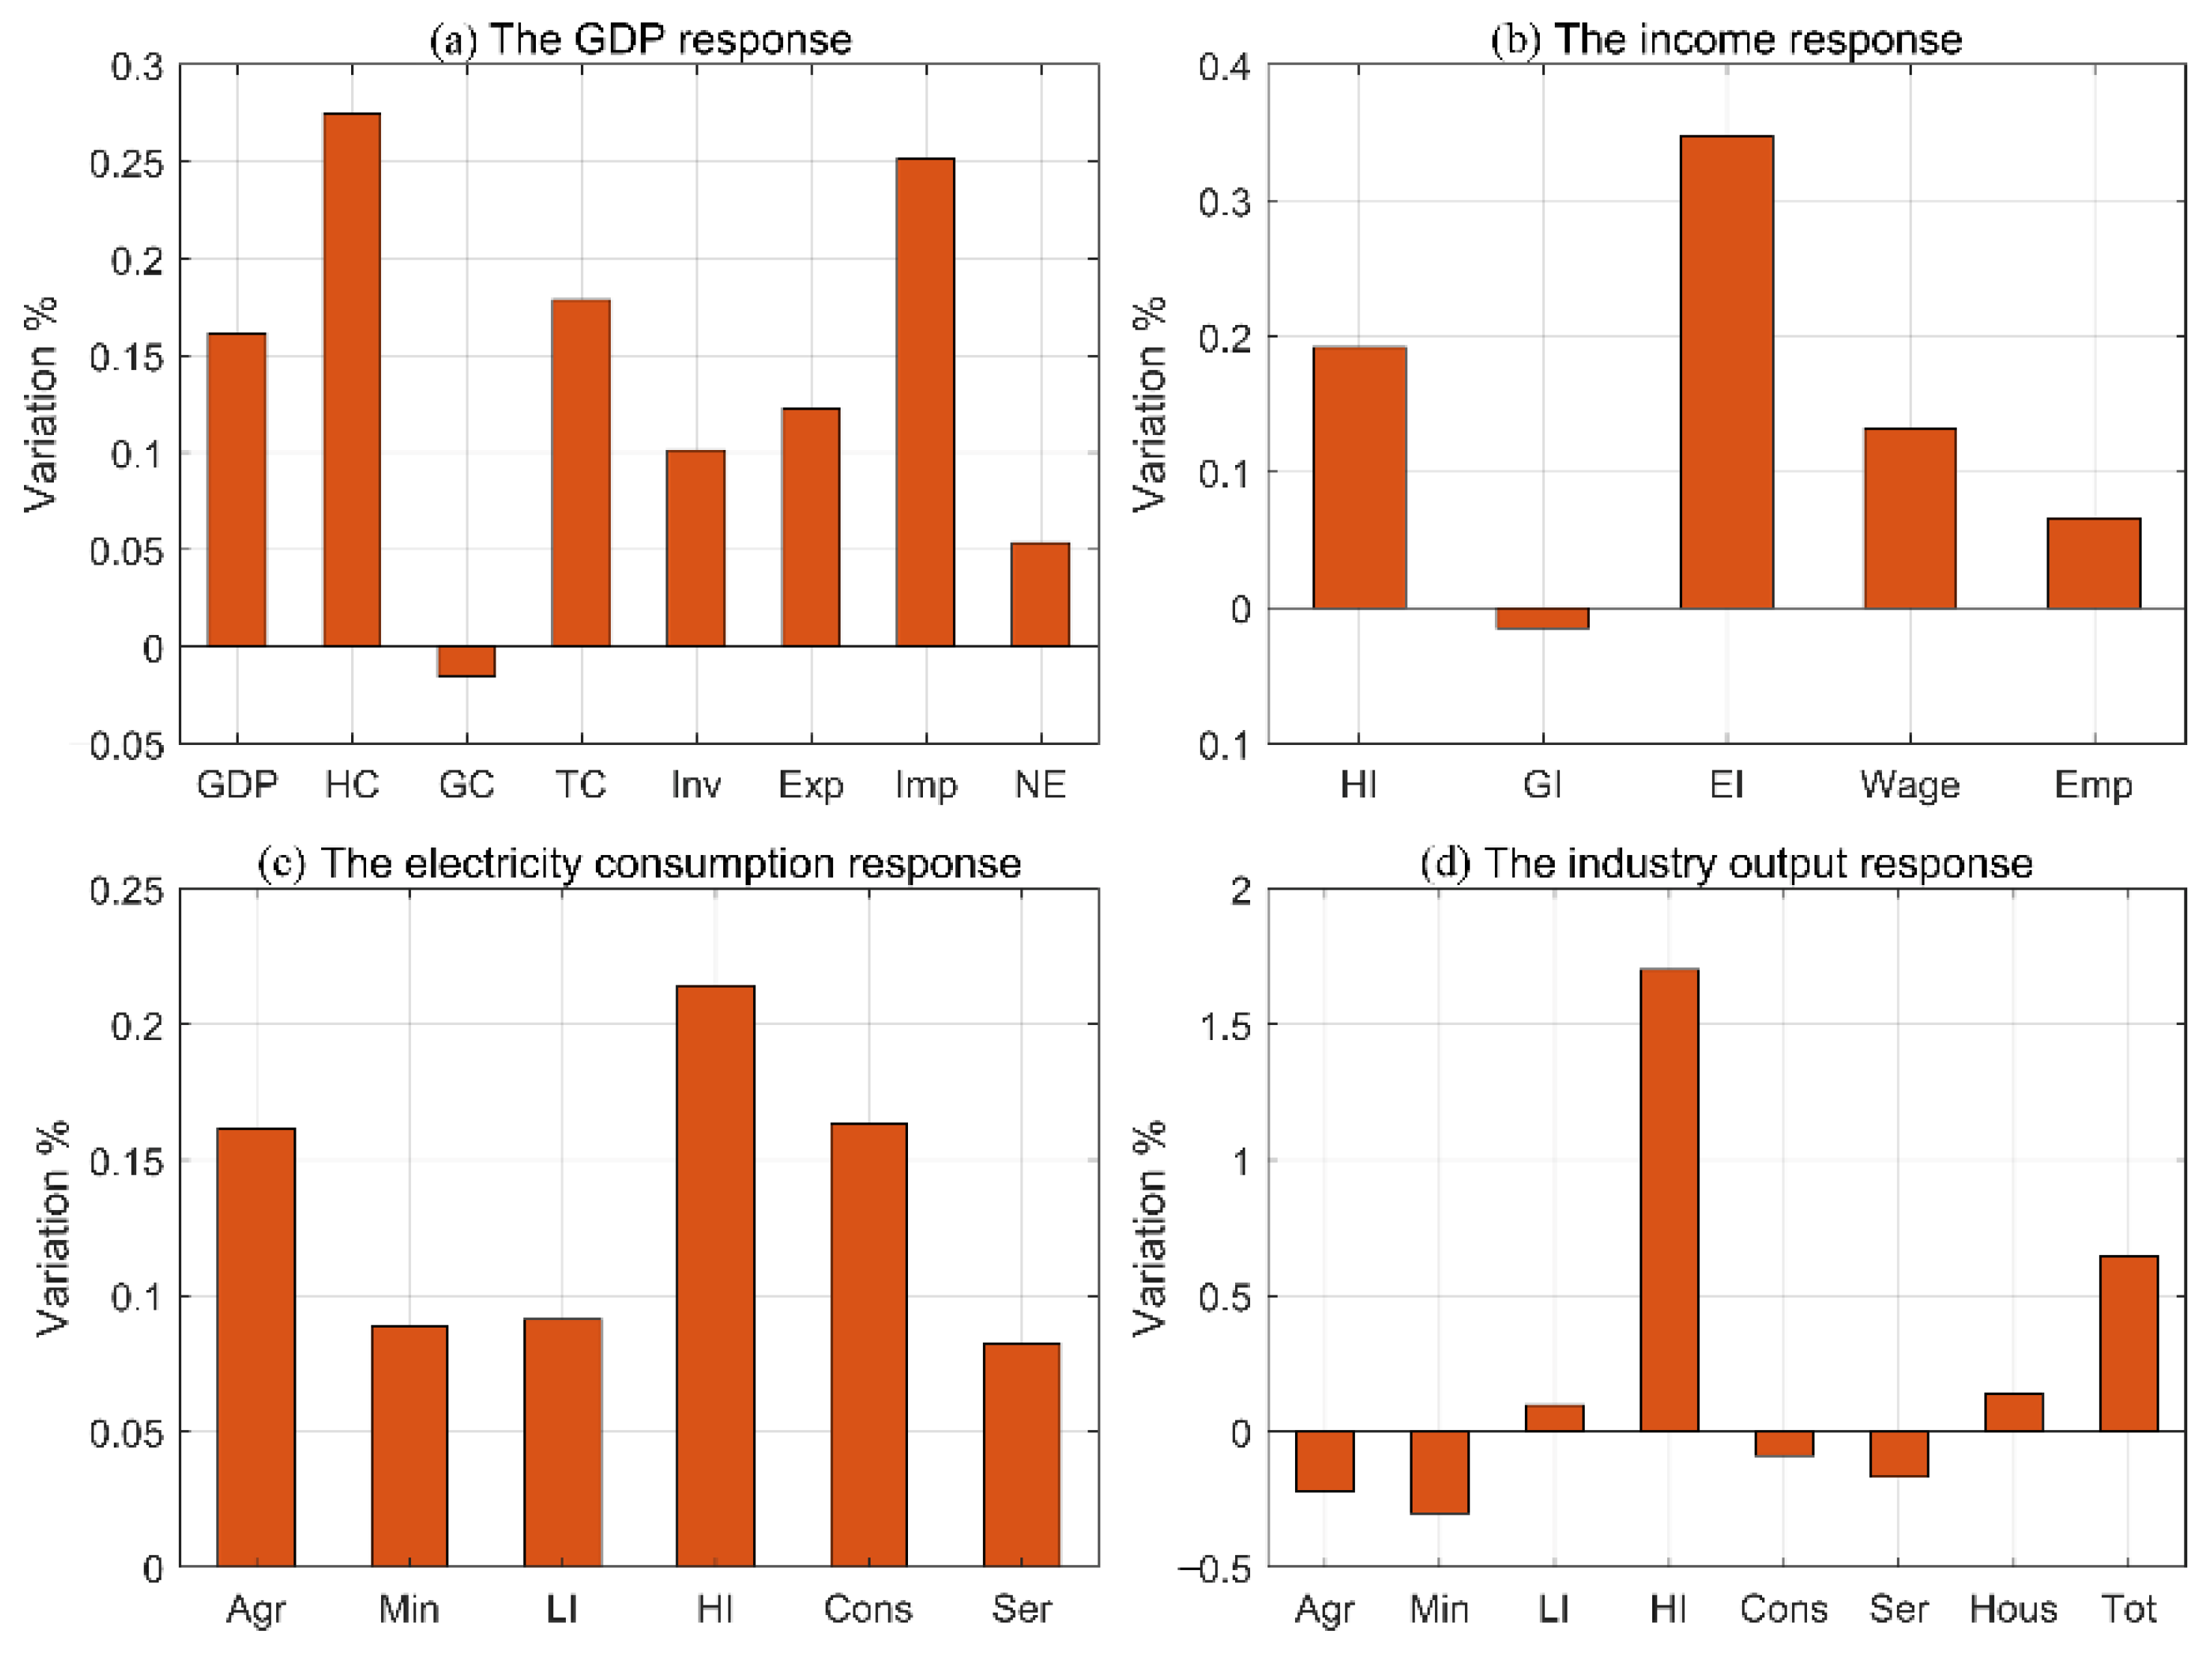
Figure 6 shows the macro-economic response of cutting large industrial electricity prices. Firstly, this policy shock increased GDP by 0.16%, where household consumption increased by 0.27%, government consumption fell by 0.02%, total consumption increased by 0.18%, investment increased by 0.1%, and net exports increased by 0.05%. Compared with the two policy shocks mentioned above, there was a weaker impact of large industrial electricity price cuts on government revenue (see
Figure 6b). Based on this result, we can speculate that large industries made greater contributions to taxation after the policy intervention. The tax increase brought about by the rise in large industrial output offset the cost of the electricity price cut. Consequently, there were no drastic changes in government revenue.
Regarding the responses of electricity consumption, there was an overall increase of 0.7%. Heavy industries increased most, by 1.7%. An explanation of this result might be that heavy industrial enterprises are often in the category of large industries; the targeted policy for reducing the electricity prices of large industries dramatically reduced the cost of electricity for heavy industries. Household electricity consumption increased by 0.2%, which could also be attributed to income improvement, similar to scenarios DinG and DinA. It is worth noting that the electricity consumption of the primary, mining, construction, and tertiary industries all declined to vary degrees. A possible explanation is that heavy industry products include secondary energy products such as petroleum processing and coking. Due to the reduction in electricity prices for heavy industry, the cost of these products fell correspondingly. Because of the substitution effect, companies who did not receive an electricity price cut increased their consumption of these secondary energy products and reduced their electricity consumption.
This policy shock also had spillover effects. In general, facing the policy shock, the output of almost all industries rose, though heavy industry output increased the most, reaching 0.22%. Such contemporaneous output growth in different sectors reveals a fact: regardless of whether an industry was within the scope of the policy intervention, as long as the electricity prices of some other sectors were adjusted, its output ultimately responded to this policy shock.
From
Figure 7, this targeted price-cutting policy also benefitted the development of export trade. There was a slight increase in the net exports of heavy industry after this policy shock. Due to the high input proportion of the mining industry in heavy industry, the export growth of the mining industry was higher than other industries. Meanwhile, there was also a substantial increase in imports from the mining industry. As a critical intermediate input of heavy industries, the demand for mining products rapidly increased after the electricity price decreased. This led to a rapid increase in imports of the mining industry.
5. Price-Cutting Policy Optimization
Based on the above investigation, several recent electricity price adjustments produced different effects on the macroeconomy. This brings up a more in-depth research question: which kind of electricity price-reduction policy can bring about the strongest economic promotion effect? To evaluate the actual effectiveness of the three electricity price-cutting policies, we estimated their respective costs and GDP outcome as well as the price cut multiplier effects. The multiplier effect of price cuts is equivalent to the driving impact of each 1 yuan of electricity price reduction on GDP, reflecting the “effectiveness” of electricity price policies.
Table 4 displays the corresponding results for the three policy scenarios.
As can be seen from the table, the policy scenario DinG had the lowest multiplier effect at only 0.45. This suggests that the price-cutting policy for general industrial and commercial electricity produced a limited impact on macroeconomic growth. Recalling the results in
Figure 2, we can speculate that the main outcome of this policy scenario was transferring profits or revenue from the government and the grid to terminal enterprises. The multiplier effect of DinA was 0.67, which is at the middle level of the three policy scenarios, while DinL had the highest multiplier effect, reaching 1.81. Therefore, it seems that cutting the electricity price for large industrial enterprises had the strongest effect on the economy.
As the three policy scenarios had performance differences, it is possible to further optimize the current electricity price policy by adjusting the industry scope of policy implementation. We further analyzed the effectiveness of electricity price cuts in each sub-industry. The specific steps were individually reducing the electricity price of each industry by 10% in the initial CGE model and then simulating their changes in GDP and the electricity price-cutting costs.
Table 5 displays the corresponding results. Three industries had a multiplier effect greater than 1. They were the non-metallic ore and other mining and beneficiation products industry, the petroleum, coking products, and nuclear fuel processed products industry, and the metal smelting and rolled products industry.
Additionally, the comprehensive multiplier effect can be measured based on the income changes of the government and the power grid. The comprehensive multiplier effect indicates how a single unit change in grid and government revenue can stimulate GDP growth. A negative comprehensive multiplier effect corresponds to an increase in the total income of the government and the grid after the electricity price is reduced. Based on the multiplier effect of price reduction in different industries, electricity price optimization schemes can be designed. This finding is also consistent with the previous literature [
44,
45]. Not all sectors are affected equally by electricity price changes, and it is always important to consider this heterogeneity in designing sectoral policies and development plans.
An electricity price optimization plan can be assigned to limit the scope of electricity price reduction to industries where the comprehensive multiplier effect is greater than 1. The corresponding economic responses can be found in
Appendix A Figure A4,
Figure A5 and
Figure A6. At first, the optimized electricity price policy increased GDP by 3.1%. After accounting for the cost of electricity price cuts, government revenue still increased slightly by 0.05%, and the policy also positively affected total consumption, investment, and net exports. These findings suggest that the optimized electricity price policy had a better economic stimulating effect. In this simulation, the income of state-owned grid companies was merged into the calculation of government income. Because government revenue can still achieve positive growth after inducing the optimized electricity price-cutting policy, the government can afford all the costs of reducing electricity prices by increasing transfer payments to grid companies. Moreover, the spillover effect of the electricity price reduction could benefit all industries and all entities. Previous studies have already confirmed this point [
46,
47]. Electricity prices are always closely correlated to many commodities and production sections, which could eventually induce an influence on all industries. From
Figure A6, an optimized electricity price policy could effectively drive the growth of various industries. The possible source of such a positive outcome could be the spillover effects brought about by rising GDP. With an increase in GDP, there is a growing demand for consumption and investment. Thus, the output of primary industry, the mining industry, and the construction industry also displayed significant growth.
6. Conclusions
Due to its state-controlled power supply and pricing system, China often intervenes by adjusting power prices. However, it is still unclear how the electricity price adjustment policies affect the macroeconomy. This paper aimed to fill this knowledge gap based on the case of Zhejiang.
In this research, a CGE model was developed to explore the impacts of the recent electricity price-cutting policy stimulus implemented in Zhejiang province. We conducted simulations for three policy scenarios and obtained some findings as follows:
- (1)
It was adequate in promoting the economy by reducing electricity prices. All three policy scenarios lead to an increase in GDP, as well as positively driving the incomes of both households and enterprises, even if some government revenue and expenditure was lost. Meanwhile, the production cost advantage brought about by the electricity price-cutting policy enlarged the export trade of China, and the total outputs also increased. Regardless of externality costs, reducing electricity prices could be treated as an efficient economic stimulus;
- (2)
Though the electricity price-cutting policy had spillover effects among different industries, it still caused imbalances in the industrial structure. However, spillover effects could not offset the small impact of the policies; the industries directly supported by the policies were often more affected. The dissimilar changes in the electricity consumption of various sectors facing the same policy shock provided another piece of evidence for this finding;
- (3)
The specific arrangements of the electricity price-cutting policy led to differences in economic stimulus consequences. Comparing the economic response under the three policy scenarios, it was found that the scope of price reduction, the degree of price reduction, and the duration of the policy might have affected the final effectiveness of the policy. Among them, the most critical setting was the industrial scope of the policy implementation. Further analysis showed that an optimized electricity price policy was more effective than the current policies and could avoid a significant drop in government revenue.
Our findings also brought some targeted policy implications: (1) Considering the limited policy effect, the government should avoid temporary electricity price adjustment policies. On the contrary, more adequate and detailed arrangements could significantly improve policy efficiency. (2) Implementing a reduction policy for only some industries with a significant multiplier effect is a good option. (3) With the acceleration of carbon-neutral processes, the pressure of energy transition increases. Thus, China should gradually phase out the practice of stimulating the economy by reducing electricity prices. (4) Decreasing electricity prices directly increases the utilization of thermal power, which damages long-term carbon emission reduction efforts. If we consider the carbon cost of reducing electricity prices, electricity price adjustment policies may not be worthwhile. Thus, the government should monitor the positive effects of electricity price policy and the value of the corresponding environmental loss. Only when the expected value of loss is lower than the positive effects on economics should electricity price-cutting policies be applied.
Limited by the research focus and the weakness of the paradigm, this paper still had some shortcomings and could be further extended in several directions. Firstly, we only focused on the case of the Zhejiang province of China, which might have some biases in understanding the effects of similar policies in other areas, since different areas have their own industrial structure. Secondly, our policy effect estimation was obtained from a CGE model simulation. This method still has shortcomings in terms of its parameter settings being simple and its constraints being too many, which makes the estimation not so precise. In the future, some work should be conducted by applying the data of other areas and econometric models in measuring the precise effect of electricity price policies. In fact, we are planning to conduct further work where we will link the CGE simulation findings of this paper more specifically to formal statistical data to examine the impact of these policies.
Author Contributions
Conceptualization, Y.X. and W.W.; Data curation, J.H.; Formal analysis, W.Z. and W.W.; Funding acquisition, Y.X.; Investigation, Y.X.; Methodology, Y.X. and J.H.; Project administration, W.Z. and W.W.; Resources, Y.X. and J.H.; Software, Y.W. and W.W.; Supervision, Y.X. and W.W.; Validation, W.Z. and W.W.; Visualization, Y.X.; Writing — original draft, Y.W.; Writing—review & editing, W.W. All authors have read and agreed to the published version of the manuscript.
Funding
This paper is supported by the National Natural Science Foundation of China grant number 72104206, the Ministry of Education in China Project of Humanities and Social Sciences grant number 20YJC790148, the Innovation Strategy Research Foundation of Fujian grant number 2021R0006, the Fundamental Research Funds for the Central Universities grant number 20720201019, the State Grid Zhejiang Electric Power Company grant number SGTYHT/20-JS-224, and National Energy Group grant number GJNY-21-143.
Institutional Review Board Statement
Not applicable.
Informed Consent Statement
Not applicable.
Data Availability Statement
Data and codes are available upon request due to restrictions, e.g., privacy or ethics. The data and codes presented in this study are available on request from the corresponding author. The data are not publicly available due to the data being obtained from non-public sources.
Conflicts of Interest
The authors declare no conflict of interest.
Appendix A
Appendix A.1. Production Module Construction
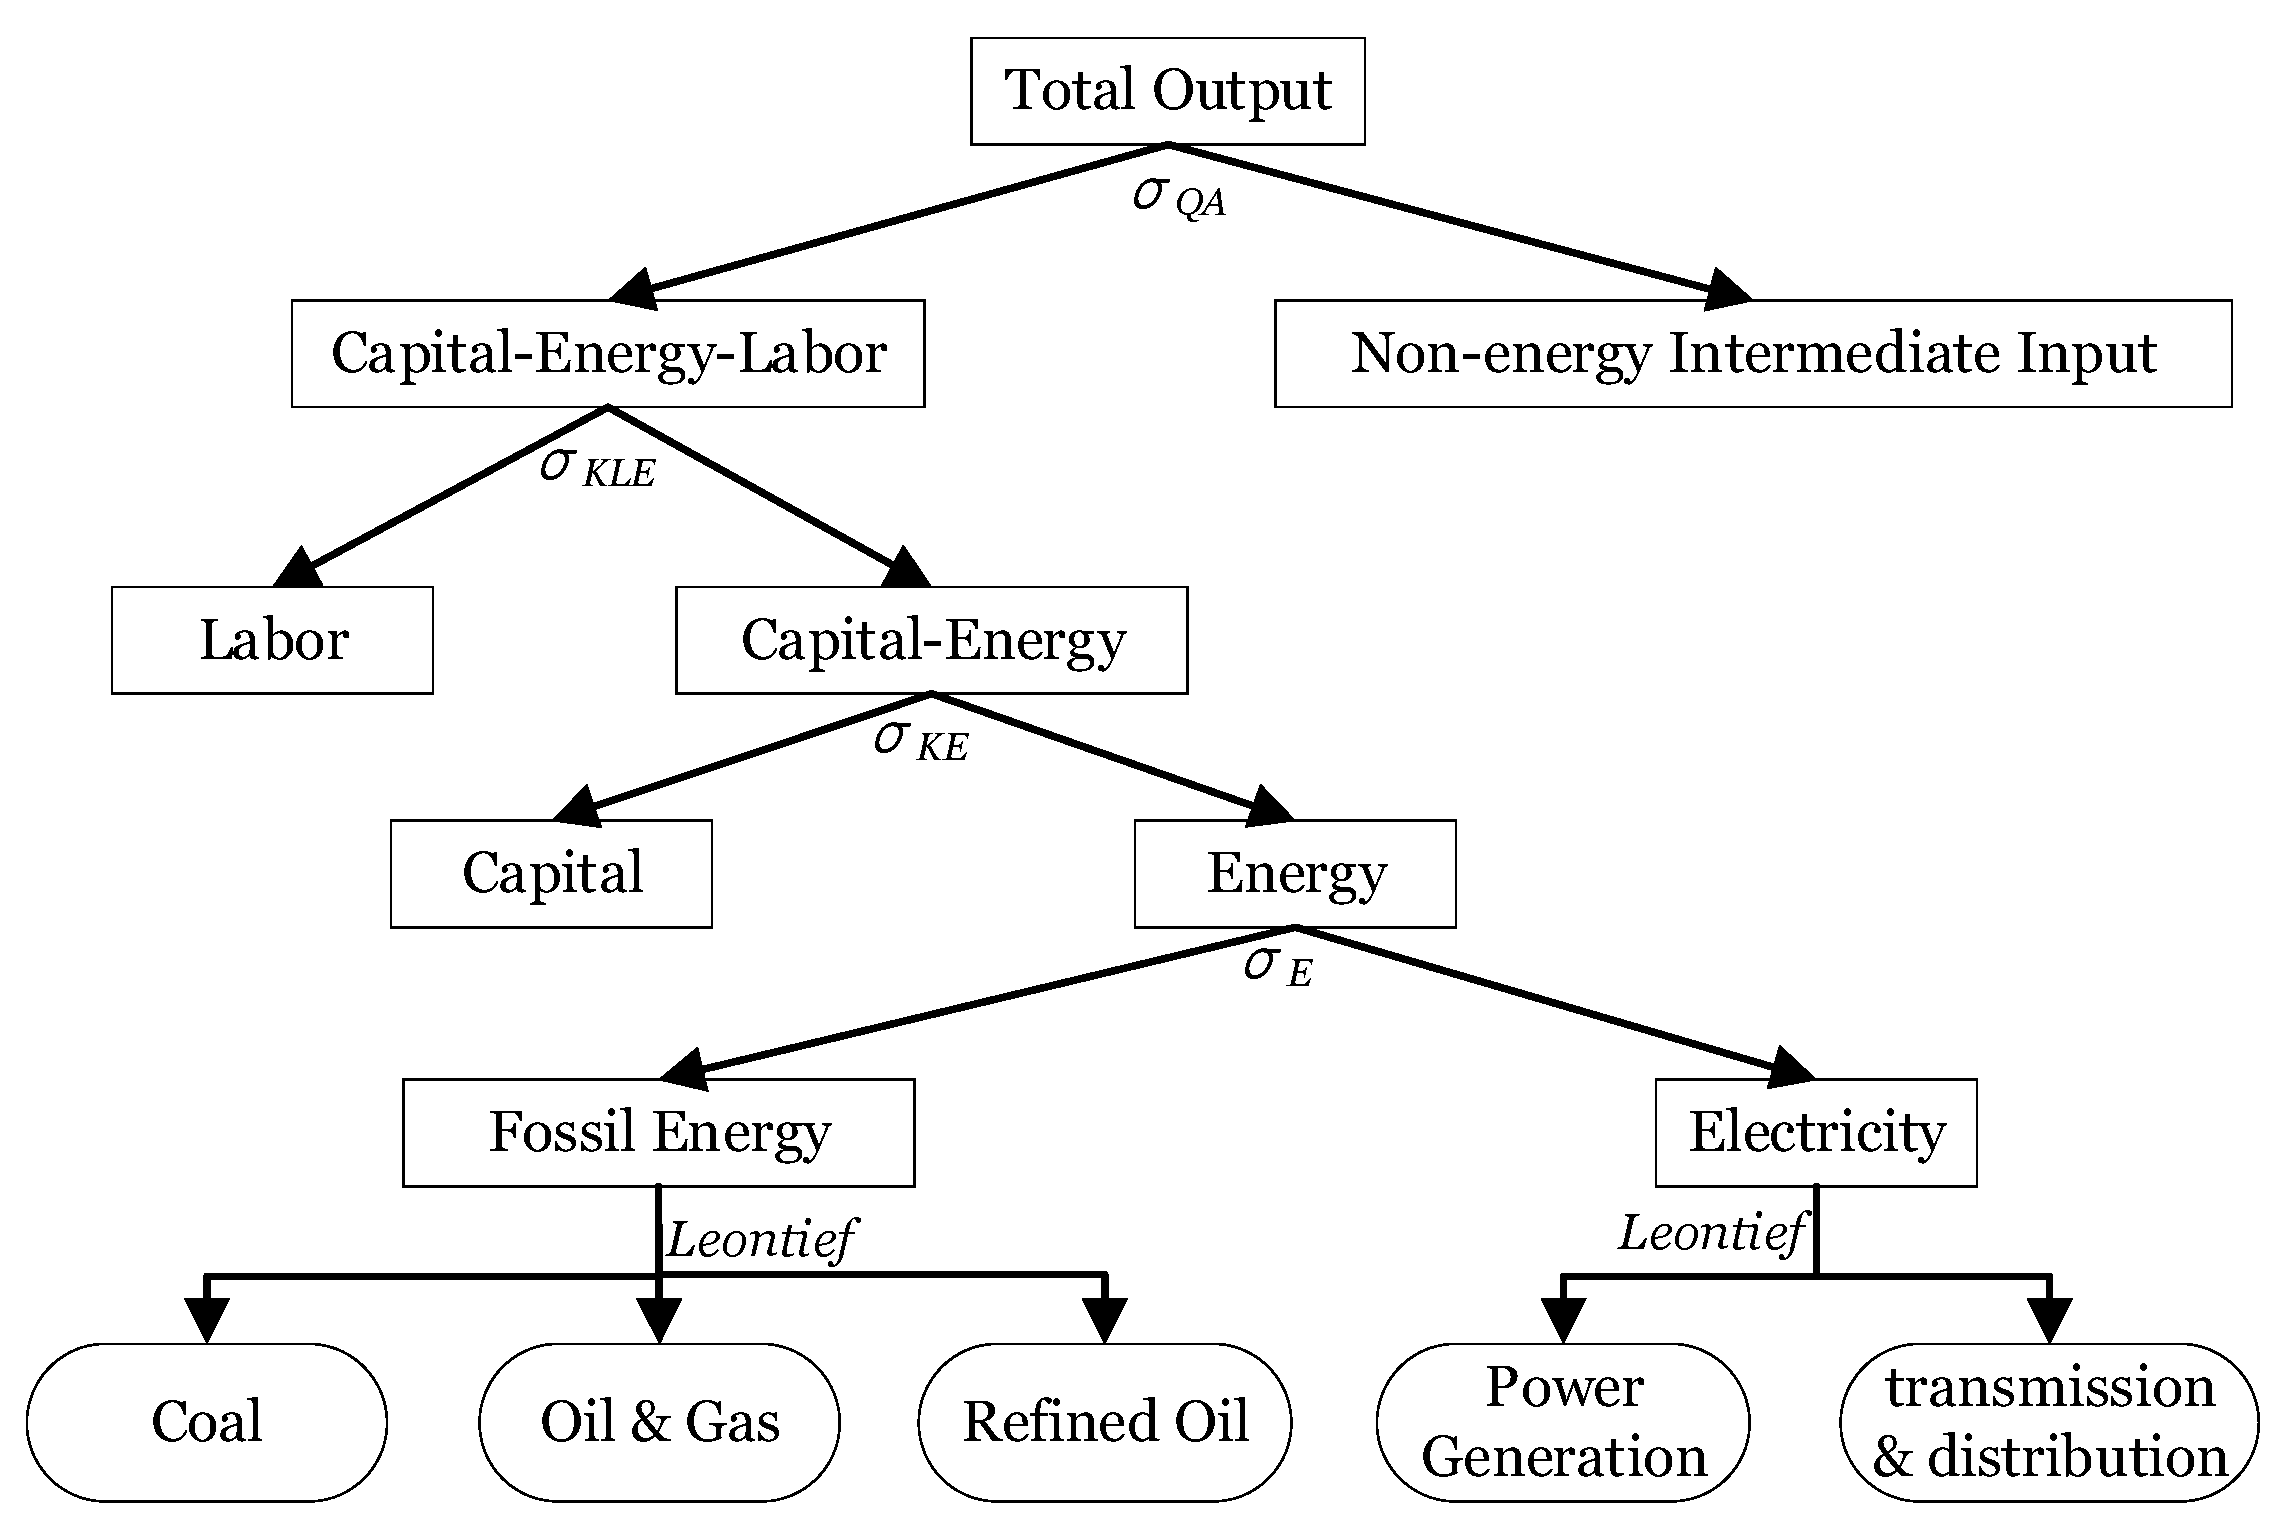
First, the production module is described as shown in
Figure A1, applying the five-layer production functions (CES) with a nested constant elasticity of substitution. Given that the main focus of this research is electricity price adjustments, we separated energy inputs from intermediate inputs. Combining energy with capital and labor inputs, we constructed the whole production inputs. Thus, the inputs in the CES function include two categories, “Capital-Energy-Labor” and “Non-energy intermediate inputs”. “Capital-Energy-Labor” is further composed of labor factor and “Capital-Energy” collection, which is compounded by capital and energy composite inputs while Non-energy intermediate input is calculated through the Leontief production function. It should be noted that we divided the composite energy input into non-electric energy and electricity to investigate the electricity price-cutting effects in a targeted way. We used the Leontief production functions to characterize the energy inputs since substitution rarely occurs between energy varieties. In this paper, fossil energies are coal, oil–gas, and refined oil, while electricity input consists of two parts, power generation, and power transmission and distribution.
Figure A1.
The construction of the production module.
Figure A1.
The construction of the production module.
Taking the production function of total output as an example, the following formula expresses the CES function:
where
is the efficiency factor or scale factor. The higher the
value, the higher the output capacity under the same input.
is the contribution share coefficient for different inputs;
is related to the elasticity of substitution and can be calculated based on
;
indicates the quantity of outputs;
represents the input of factor and energy composite products; and
indicates the intermediate inputs.
Furthermore, we use
to denote the composite price of Capital-Energy-Labor,
represents the price of other intermediate inputs, and
proxies the terminal product price. The relationship between the variables can be established according to the nature of the CES function.
The CES functions in each layer are similar to the above forms, while the Leontief functions used in modeling intermediate input are as below.
where
represents the total intermediate input of the sector
;
is the share coefficient of the intermediate input structure, i.e., the proportion of the products in
industry in the unit intermediate input of sector
; and
is the intermediate input price.
Appendix A.2. Trade Module
The trade module of provincial CGE should be adjusted based on the standardized national CGE model. There are two main reasons for the adjustment. Firstly, the trade flow of a province is always more complicated than that of a country, and there is large-scale inter-provincial trade. A national CGE only needs to accommodate imports and exports, while a provincial CGE should introduce cross-provincial commodity trading. Secondly, the traditional CGE model generally divides domestic production into two parts: domestic supply and export. As there may be a large amount of transit trade, the export volume of Zhejiang might be much larger than its production volume due to its developed shipping industry. It could lead to a negative domestic supply, so the model is hard to calculate.
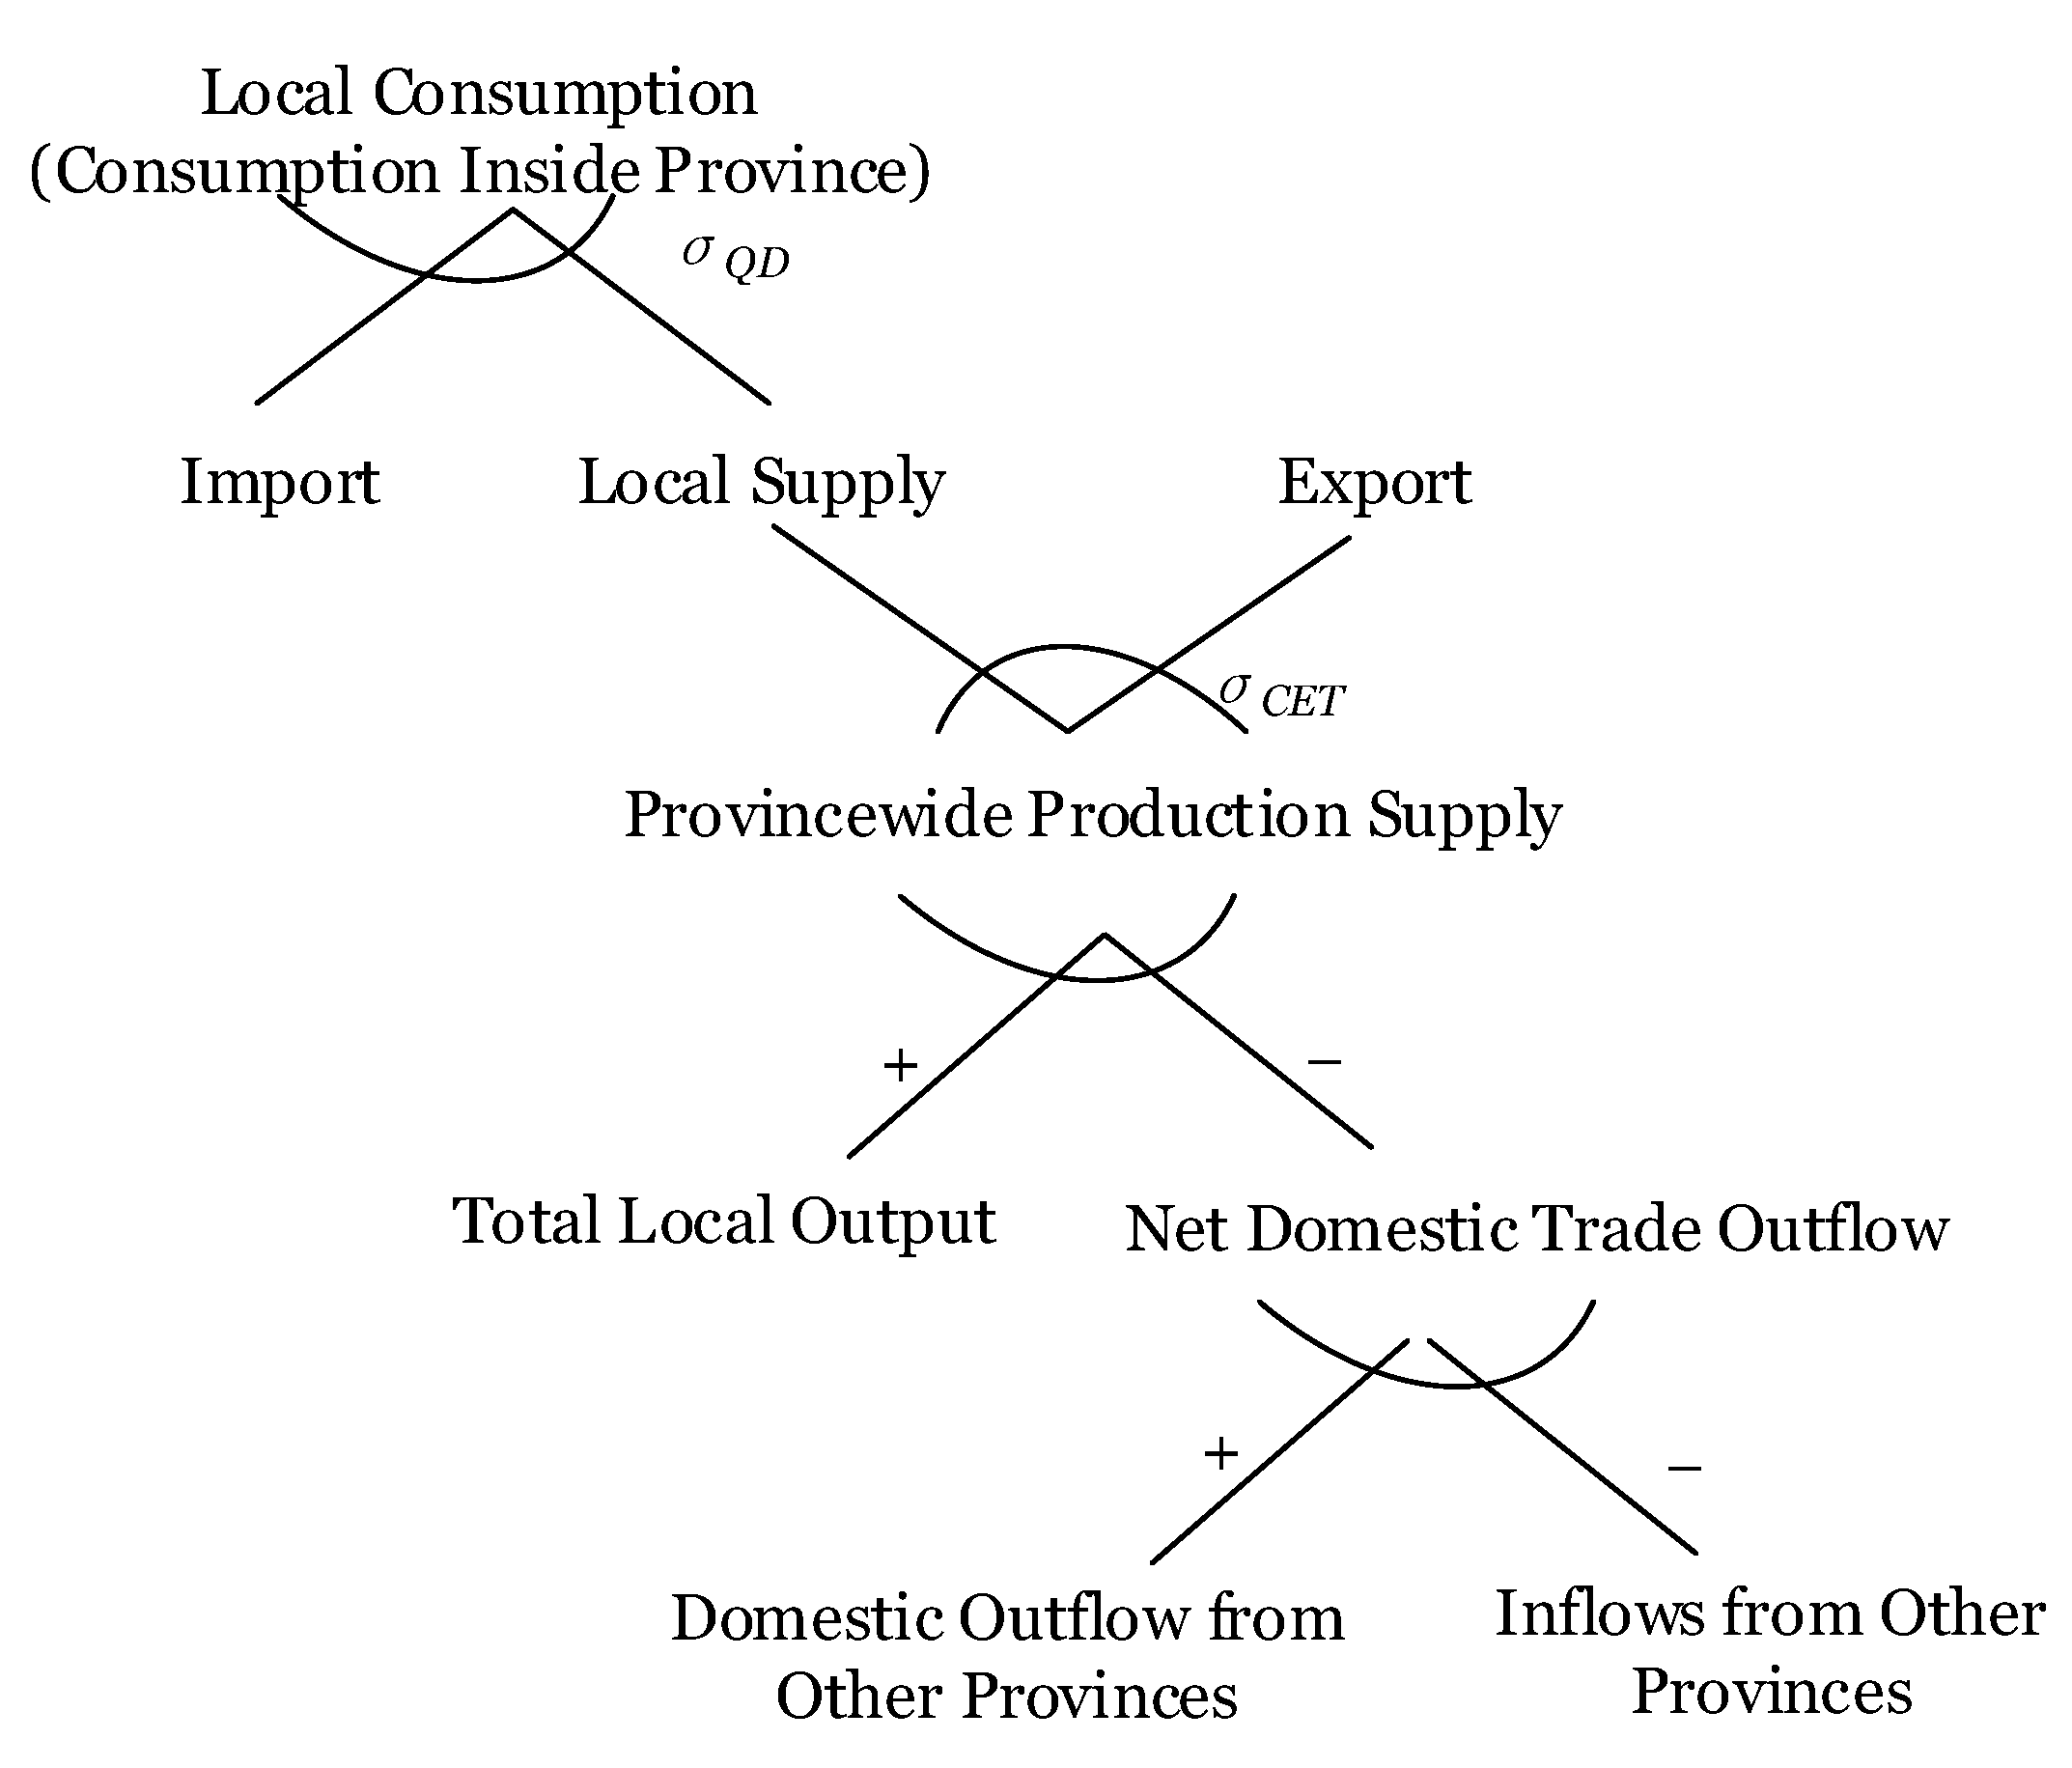
Figure A2 displays the details of the trade module setting. The province-wide production supply is defined as the difference value between total local output and the net domestic trade outflow. It could also be assigned to provincial local supply and export by introducing the Armington condition function [
48]. The net domestic trade outflow equals the domestic outflows minus the inflows from other provinces; provincial local supply and import can further be compounded into intra-provincial consumption. Among the above settings, the total local output is calculated based on the production functions of each sector, while inter-provincial trade flows are set as the exogeneities.
Figure A2.
Trade module structure.
Figure A2.
Trade module structure.
Appendix A.3. Domestic Accounts Flow
Recall
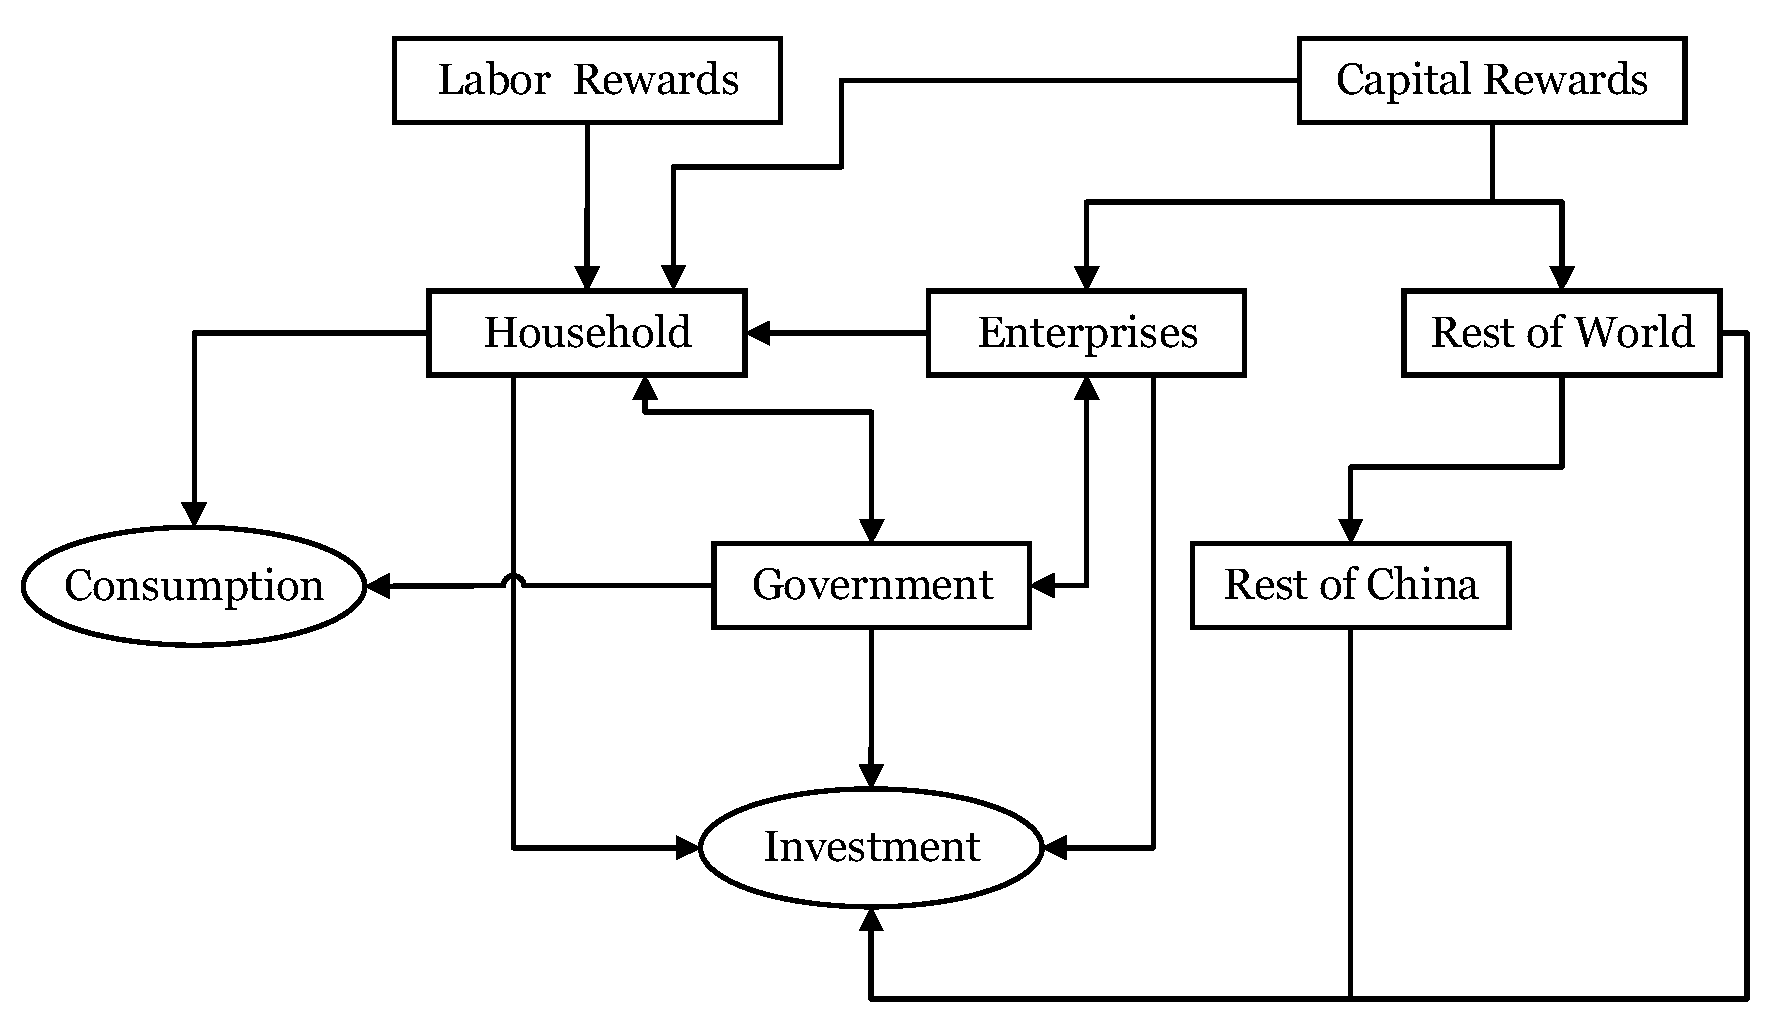
Figure 1: in addition to the sectors in the production and trade module, six accounts need to be linked, these being households, enterprises, government, rest of world, and rest of China. The relationship between these accounts is shown in
Figure A3.
Figure A3.
Flow relationship between accounts.
Figure A3.
Flow relationship between accounts.
In this figure, labor wage is distributed to residents while capital income is allocated to households, enterprises, and foreign countries according to specific ownership. Income tax, household consumption, and savings jointly consume the income of the household. Enterprise income is mainly divided into taxes to the government, distributed wages to residents, and remaining funds for investment. After deducting government consumption, government revenue is mainly used for transfer payments to residents and other areas in the country. Similar to enterprises, the government also uses the remaining part for investment. The account of ‘rest of world’ mainly purchases export commodities. Its revenue could be divided into the flow to other regions in China and investment.
In the terminal demand, the investment function is calculated through the Leontief function; namely, the internal structure of the investment products remains unchanged. We employed the linear expenditure system function in describing the consumption behavior. Maximizing the consumer utility, the consumption function satisfies the following formula:
where
and
represent the price and consumption amount of a commodity
, respectively.
indicates the basic subsistence consumption amount of
. Thus,
indicates the marginal budget share spent on a product. After obtaining the first-order optimization conditions for the above formula, the consumption function can be derived as follows: the principle of the linear expenditure system is that only when the consumers have satisfied their basic subsistence consumption, the remaining consumption can be used to purchase other consumer goods.
Table A1.
Zhejiang Social Accounting Matrix in 2017 (Unit: billion yuan).
Table A1.
Zhejiang Social Accounting Matrix in 2017 (Unit: billion yuan).
| | Activity | Commodity | Factor | Household | Enterprises | Government | Rest of World | Rest of China | Investment | Sum |
|---|
| Labor | Capital |
|---|
| Activity | | 15,262.0 | | | | | | | | | 15,262.0 |
| Commodity | 10,018.0 | | | | 1659.1 | | 834.6 | 2146.8 | 4149.5 | 3220.0 | 22,027.8 |
| Factor | Labor | 2494.5 | | | | | | | | | | 24,945 |
| Capital | 2007.7 | | | | | | | | | | 20,077 |
| Household | | | 2494.5 | 182.8 | | 205.9 | 317.4 | | | | 3200.6 |
| Enterprises | | | | 1801.3 | | | | | | | 1801.3 |
| Government | 741.8 | | | | 39.5 | 654.0 | | | | | 1435.3 |
| Rest of World | | 750.7 | | 23.7 | | | | | | 1372.4 | 2146.8 |
| Rest of China | | 6015.1 | | | | | 458.1 | | | | 6473.3 |
| Investment | | | | | 1502.0 | 941.4 | −174.8 | | 2323.8 | | 4592.3 |
| Sum | 15,262.0 | 22,027.8 | 2494.5 | 2007.7 | 3200.6 | 1801.3 | 1435.3 | 2146.8 | 6473.3 | 4592.3 | |
Table A2.
Electricity cross-subsidy estimation results.
Table A2.
Electricity cross-subsidy estimation results.
| Sector | Power Supply Cost (yuan/kWh) | To-Home Electricity Price (yuan/kWh) | Cross-Subsidy Ratio |
|---|
| Citizens | 0.90531 | 0.55322 | 63.64% |
| Rural residents | 1.03616 | 0.55322 | 87.30% |
| Aggregate agriculture | 0.68932 | 0.62343 | 10.57% |
| Light industry | 0.51027 | 0.75952 | −32.82% |
| Heavy industry | 0.51666 | 0.64253 | −19.59% |
| Mining industry | 0.53596 | 0.75952 | −29.43% |
| Electricity, gas and water production and supply industry | 0.56809 | 0.64253 | −11.58% |
| Construction industry | 0.82699 | 0.77665 | 6.48% |
| Transportation, storage and postal industry | 0.69360 | 0.77665 | −10.69% |
| Information transmission, computer service and software industry | 0.56643 | 0.77665 | −27.07% |
| Commercial, accommodation and catering industry | 0.65558 | 0.77665 | −15.59% |
| Finance, real estate, business and residential services | 0.75986 | 0.77665 | −2.16% |
| Public utilities and management organizations | 0.68345 | 0.77665 | −12.00% |
Figure A4.
The GDP response for optimized electricity price-policy scenario.
Figure A4.
The GDP response for optimized electricity price-policy scenario.
Figure A5.
The income response for optimized electricity price-policy scenario.
Figure A5.
The income response for optimized electricity price-policy scenario.
Figure A6.
The output response for optimized electricity price-policy scenario.
Figure A6.
The output response for optimized electricity price-policy scenario.
References
- Yin, J.; Yan, Q.; Lei, K.; Baležentis, T.; Streimikiene, D. Economic and efficiency analysis of China electricity market reform using computable general equilibrium model. Sustainability 2019, 11, 350. [Google Scholar] [CrossRef]
- Yan, J.; Yang, Y.; Campana, P.E.; He, J. City-level analysis of subsidy-free solar photovoltaic electricity price, profits and grid parity in China. Nat. Energy 2019, 4, 709–717. [Google Scholar] [CrossRef]
- Li, W.; Long, R.; Zhang, L.; Cheng, X.; He, Z.; Chen, F. How the uptake of electric vehicles in China leads to emissions transfer: An Analysis from the perspective of inter-provincial electricity trading. Sustain. Prod. Consum. 2021, 28, 1006–1017. [Google Scholar] [CrossRef]
- Lin, B.; Wang, Y. Does energy poverty really exist in China? From the perspective of residential electricity consumption. Energy Policy 2020, 143, 111557. [Google Scholar] [CrossRef]
- Zhao, X.; Lyon, T.P.; Song, C. Lurching towards markets for power: China’s electricity policy 1985–2007. Appl. Energy 2012, 94, 148–155. [Google Scholar] [CrossRef]
- Song, M.L.; Cui, L.B. Economic evaluation of Chinese electricity price marketization based on dynamic computational general equilibrium model. Comput. Ind. Eng. 2016, 101, 614–628. [Google Scholar] [CrossRef]
- Wang, D.; Zhang, Z.; Yang, X.; Zhang, Y.; Li, Y.; Zhao, Y. Multi-scenario simulation on the impact of China’s electricity bidding policy based on complex networks model. Energy Policy 2021, 158, 112573. [Google Scholar] [CrossRef]
- Cherni, J.A.; Kentish, J. Renewable energy policy and electricity market reforms in China. Energy Policy 2007, 35, 3616–3629. [Google Scholar] [CrossRef]
- Wang, Z.; Zhang, B.; Zhang, Y. Determinants of public acceptance of tiered electricity price reform in China: Evidence from four urban cities. Appl. Energy 2012, 91, 235–244. [Google Scholar] [CrossRef]
- Wang, F.; Zhang, B. Distributional incidence of green electricity price subsidies in China. Energy Policy 2016, 88, 27–38. [Google Scholar] [CrossRef]
- Chen, H.; Chyong, C.K.; Mi, Z.; Wei, Y.M. Reforming the operation mechanism of Chinese electricity system: Benefits, challenges and possible solutions. Energy J. 2020, 41, 219–245. [Google Scholar] [CrossRef]
- Jia, J.J.; Xu, J.H. Estimating residential electricity demand’s response to price policy and income dynamics in China. Energy Effic. 2021, 14, 1–23. [Google Scholar] [CrossRef]
- Liu, Y.; Hu, X.; Feng, K. Economic and environmental implications of raising China’s emission standard for thermal power plants: An environmentally extended CGE analysis. Resour. Conserv. Recycl. 2017, 121, 64–72. [Google Scholar] [CrossRef]
- He, Y.; Lin, B. Time-varying effects of cyclical fluctuations in China’s energy industry on the macro economy and carbon emissions. Energy 2018, 155, 1102–1112. [Google Scholar] [CrossRef]
- Lin, B.; Su, T. Does COVID-19 open a Pandora’s box of changing the connectedness in energy commodities? Res. Int. Bus. Financ. 2021, 56, 101360. [Google Scholar] [CrossRef]
- Akkemik, K.A. Potential impacts of electricity price changes on price formation in the economy: A social accounting matrix price modeling analysis for Turkey. Energy Policy 2011, 39, 854–864. [Google Scholar] [CrossRef]
- Matar, W. A look at the response of households to time-of-use electricity pricing in Saudi Arabia and its impact on the wider economy. Energy Strategy Rev. 2017, 16, 13–23. [Google Scholar] [CrossRef]
- Lin, B.; Chen, Y. Does electricity price matter for innovation in renewable energy technologies in China? Energy Econ. 2019, 78, 259–266. [Google Scholar] [CrossRef]
- Ling-Yun, H.; Yan, L. Characteristics of China’s coal, oil and electricity price and its regulation effect on entity economy. Procedia Earth Planet. Sci. 2009, 1, 1627–1634. [Google Scholar] [CrossRef]
- Lim, S.Y.; Yoo, S.H. The impact of electricity price changes on industrial prices and the general price level in Korea. Energy Policy 2013, 61, 1551–1555. [Google Scholar] [CrossRef]
- Ai, H.; Xiong, S.; Li, K.; Jia, P. Electricity price and industrial green productivity: Does the “low-electricity price trap” exist? Energy 2020, 207, 118239. [Google Scholar] [CrossRef]
- de Mendonça, H.F.; Finn, E.S. Can credibility offset electricity price effect on business confidence? An empirical investigation from a large emerging economy. Appl. Econ. 2021, 54, 1229–1242. [Google Scholar] [CrossRef]
- Norouzi, N.; Zarazua de Rubens, G.Z.; Enevoldsen, P.; Behzadi Forough, A. The impact of COVID-19 on the electricity sector in Spain: An econometric approach based on prices. Int. J. Energy Res. 2021, 45, 6320–6332. [Google Scholar] [CrossRef]
- Norouzi, N.; Fani, M.; Talebi, S. Green tax as a path to greener economy: A game theory approach on energy and final goods in Iran. Renew. Sustain. Energy Rev. 2022, 156, 111968. [Google Scholar] [CrossRef]
- Li, J.; Jiang, Q.; Dong, K.; Dong, X. Does the local electricity price affect labor demand? Evidence from China’s industrial enterprises. Environ. Dev. Sustain. 2022, 3, 1–25. [Google Scholar] [CrossRef]
- Whalley, J. Trade Liberalization among Major World Trading Areas; MIT Press: Cambridge, MA, USA, 1985. [Google Scholar]
- Feenstra, R.C. Introduction to “Trade Policies for International Competitiveness”. In Trade Policies for International Competitiveness; University of Chicago Press: Chicago, IL, USA, 1989; pp. 1–4. [Google Scholar]
- Boyd, R.; Krutilla, K. The politics and consequences of protectionism: A case study in the North American lumber market. J. Policy Modeling 1988, 10, 601–609. [Google Scholar] [CrossRef]
- Mun-Heng TO, H.; Qian LI, N. An evaluation of the 1994 tax reform in China using a general equilibrium model. China Econ. Rev. 2005, 16, 246–270. [Google Scholar]
- He, Y.; Lin, B. The impact of natural gas price control in China: A computable general equilibrium approach. Energy Policy 2017, 107, 524–531. [Google Scholar] [CrossRef]
- Dong, B.; Ma, X.; Wang, N.; Wei, W. Impacts of exchange rate volatility and international oil price shock on China’s regional economy: A dynamic CGE analysis. Energy Econ. 2020, 86, 103762. [Google Scholar] [CrossRef]
- Lin, B.; Wu, W.; Song, M. Industry 4.0: Driving factors and impacts on firm’s performance: An empirical study on China’s manufacturing industry. Ann. Oper. Res. 2019, 10, 1–21. [Google Scholar] [CrossRef]
- Wu, W.; Lin, B. Benefits of electric vehicles integrating into power grid. Energy 2021, 224, 120108. [Google Scholar] [CrossRef]
- Lin, B.; Wu, W. Economic viability of battery energy storage and grid strategy: A special case of China electricity market. Energy 2017, 124, 423–434. [Google Scholar] [CrossRef]
- Wu, W.; Lin, B.; Xie, C.; Elliott, R.J.; Radcliffe, J. Does energy storage provide a profitable second life for electric vehicle batteries? Energy Econ. 2020, 92, 105010. [Google Scholar] [CrossRef]
- Lin, B.; Wu, W.; Bai, M.; Xie, C.; Radcliffe, J. Liquid air energy storage: Price arbitrage operations and sizing optimization in the GB real-time electricity market. Energy Econ. 2019, 78, 647–655. [Google Scholar] [CrossRef]
- Cunha Montenegro, R.; Lekavičius, V.; Brajković, J.; Fahl, U.; Hufendiek, K. Long-term distributional impacts of European cap-and-trade climate policies: A CGE multi-regional analysis. Sustainability 2019, 11, 6868. [Google Scholar] [CrossRef]
- Lin, B.; Jia, Z. Economic, energy and environmental impact of coal-to-electricity policy in China: A dynamic recursive CGE study. Sci. Total Environ. 2020, 698, 134241. [Google Scholar] [CrossRef] [PubMed]
- Guo, Z.; Li, T.; Peng, S.; Zhang, H. Environmental and economic consequences of the incentive policy on electric vehicle industry: A CGE based study in China. Resour. Conserv. Recycl. 2021, 169, 105542. [Google Scholar] [CrossRef]
- Wang, Z.; Qiu, S. Can “energy saving and emission reduction” demonstration city selection actually contribute to pollution abatement in China? Sustain. Prod. Consum. 2021, 27, 1882–1902. [Google Scholar] [CrossRef]
- Huang, H.; Roland-Holst, D.; Wang, C.; Cai, W. China’s income gap and inequality under clean energy transformation: A CGE model assessment. J. Clean. Prod. 2020, 251, 119626. [Google Scholar] [CrossRef]
- Robinson, T.; McMullan, G.; Marchant, R.; Nigam, P. Remediation of dyes in textile effluent: A critical review on current treatment technologies with a proposed alternative. Bioresour. Technol. 2001, 77, 247–255. [Google Scholar] [CrossRef]
- Wu, W.; Lin, B. Application value of energy storage in power grid: A special case of China electricity market. Energy 2018, 165, 1191–1199. [Google Scholar] [CrossRef]
- De Filippo, A.; Lombardi, M.; Milano, M. User-aware electricity price optimization for the competitive market. Energies 2017, 10, 1378. [Google Scholar] [CrossRef]
- Akarsu, G. Analysis of regional electricity demand for Turkey. Reg. Stud. Reg. Sci. 2017, 4, 32–41. [Google Scholar] [CrossRef]
- Ding, W.; Xu, Y.; Gao, F.; Wu, B.; Fu, Y. Electricity market dynamics: The influence of fuel prices and the spillover effect. In IOP Conference Series: Earth and Environmental Science; IOP Publishing: Bristol, UK, 2020; Volume 615, p. 012079. [Google Scholar]
- Worthington, A.; Kay-Spratley, A.; Higgs, H. Transmission of prices and price volatility in Australian electricity spot markets: A multivariate GARCH analysis. Energy Econ. 2005, 27, 337–350. [Google Scholar] [CrossRef]
- Armington, P.S. A theory of demand for products distinguished by place of production. Staff Pap. 1969, 16, 159–178. [Google Scholar] [CrossRef]
| Publisher’s Note: MDPI stays neutral with regard to jurisdictional claims in published maps and institutional affiliations. |
© 2022 by the authors. Licensee MDPI, Basel, Switzerland. This article is an open access article distributed under the terms and conditions of the Creative Commons Attribution (CC BY) license (https://creativecommons.org/licenses/by/4.0/).


