Article

HVAC Control Systems for a Negative Air Pressure Isolation Room and Its Performance

1
Department of Mechanical and Industrial Engineering, Faculty of Engineering, Universitas Syiah Kuala, Banda Aceh 23111, Indonesia
2
Graduate School of Engineering, Faculty of Engineering, Universitas Syiah Kuala, Banda Aceh 23111, Indonesia
3
Medical Research Unit, School of Medicine, Universitas Syiah Kuala, Banda Aceh 23111, Indonesia
4
Department of Internal Medicine, School of Medicine, Universitas Syiah Kuala, Banda Aceh 23111, Indonesia
5
School of Civil and Environmental Engineering, University of Technology Sydney, Ultimo, Sydney, NSW 2007, Australia
*
Authors to whom correspondence should be addressed.
Sustainability 2022, 14(18), 11537; https://doi.org/10.3390/su141811537
Submission received: 5 August 2022 / Revised: 30 August 2022 / Accepted: 5 September 2022 / Published: 14 September 2022

Abstract

:
The controlled environment room, called an isolation room, has become a must have for medical facilities, due to the spreading of severe acute respiratory syndrome coronavirus 2 (SARS-CoV-2), to isolate the high risk infected patients. To avoid the transmission of the virus through airborne routes, guidelines were published by the government and the association. A medical facility must comply with this document for high-risk patient treatment. A full-scale N class isolation room was built at Syiah Kuala University to investigate the performance in terms of the controller, temperature, pressure, humidity, and energy consumption. The isolation room was equipped with a proper capacity heating, ventilating, and air conditioning (HVAC) system, which consisted of an air conditioning compressor and a negative pressure generator (NPG), and its installation was ensured to fulfil the guidelines. Since the current NPG was controlled manually, a computer-based control system was designed, implemented, and compared with the manual control. The results showed that the computer-based control outputs better stability of pressure and electric power. For that reason, a computer-based control was chosen in the real case. To investigate the performance of the isolation room, a 24 h experiment was carried out under different parameter setups. The results showed that improvement of the control strategy for temperature and humidity is still necessary. The energy consumption during the activation of the NPG for the recommended negative pressure was slightly different. An additional piece of equipment to absorb the heat from the exhaust air would be promising to improve the energy efficiency.

1. Introduction

Infectious diseases can be caused by pathogens that are able to spread from one person to another through the air. Air is one of the main transmission media of infectious diseases such as tuberculosis, severe acute respiratory syndrome (SARS) in 2011, H1N1 influenza in 2011, Middle East respiratory syndrome (MERS) in 2013, and coronavirus disease (COVID-19) in 2019 [1,2,3]. In 2021, more than 8000 SARS cases were reported with 774 deaths which led to a wave of research and standardization of medical facilities with respect to airborne diseases [1,3]. To reduce mortality and avoid spreading to other people, the high risk of SARS infected patients must be isolated in a medical facility called an isolation room, where their environment is controlled according to a standard.
The indirect contact transmission of airborne viruses in the isolation room takes more attention compared to direct transmission, such as touching the door handle, due to the difficulty of controlling the ventilation. Inadequate ventilation in the patient room not only greatly affects the virus spread in the room to the healthcare workers but also through the air rapidly to other patients, and even visitors [4]. To ensure the isolation room is functioning properly, the associations and governments published some guidelines for the isolation room [5,6]. The guidelines mention several technical aspects including the layout and pressure of the heating, ventilating, and air conditioning (HVAC) system. The isolation room must comply with the N class requirements as following [7]:
  • An anteroom that operates as an airlock with interlocking doors; both doors must not open at the one time; the anteroom must be large enough to permit bed movement in and out of the isolation room if direct doors from the corridor to the isolation room are not provided.
  • An alarm to be activated on the loss of differential pressure; time delay may be required to permit entry/exit from the isolation room.
  • A clinical handwash basin with ‘hands free’ operation in the isolation room and the anteroom.
  • An ensuite shower and toilet.
  • Self-closing doors with interlocking doors to the anteroom
  • 100% outside air ventilation (i.e., no return air permitted), with low-level exhaust ducts approximately 200 mm above floor level to discharge vertically to the outside air.
  • Supply air ducts are to be independent of the building supply air system.
  • For immunosuppressed and infectious patients, a high-efficiency particulate absorbing (HEPA) filtration system should be provided on the supply air ducting to protect the patient from unfiltered air.
  • Exhaust air should be HEPA filtered and provided with UV irradiation.
  • Provision of a pan/utensil sanitizer is optional. If provided, it should be located within the ensuite. Alternatively, disposables can be considered.
Not all requirements of N class were considered in this research. Several related requirements which complied with the technical guidelines from the Ministry of Health of Republic Indonesia [6] were prepared. The air conditioning type must be split duct and one flow, and must be able to maintain the room temperature at where the optimal temperature environment in the isolation room is, between 18 and 26 °C [8,9,10]. The flow air rate is approximately 850 CFM (1445 CMH) and relative humidity is maximal 60%. In 2007 the pressure gradient was recommended at −30 Pa [2], while in a recent year it was adjusted to more than 2.5 Pa [5] as shown in Table 1.
To fulfil the requirements stated by the Ministry of Health of Republic Indonesia, a HVAC system tightly keeping the isolation room to remain sterile from virus contamination is mandatory. This system has also able to control the air pressure by maintaining the stability of air pressure, temperature, air velocity, and circulation in the room [5]. With a proper setup, the HVAC system is intended not only to avoid virus transmission but also to ensure the room is more comfortable [11,12]. The placement of exhaust air (EA) and supply air (SA) within the patient room has a significant effect on the risk of spreading the virus indoors through changes in the movement and direction of airflow [3,13,14]. The optimal position of the EA and SA for minimizing the air contamination within the patient room has been investigated either experimentally or using computational fluid dynamics (CFD) simulations [13,15]. Commonly, a HVAC system is designed for the isolated room, placing the SA device on the ceiling over the patient’s bed while the EA is mounted on the wall next to the patient’s head. Several studies have discussed the effectiveness of the placement of the ventilation system and optimization of the air flow distribution within the isolation room, to be able to absorb air optimally so that it can create negative pressure in the isolation room [15,16]. However, limited knowledge is available on developing a HVAC-controlling system that contributes to minimize electrical power consumption.
In our study, a full-scale isolation room, including a HVAC system according to the Indonesian Ministry of Health (MoH) technical guidelines [6], was built. Additionally, a HVAC computer-based control system instead of a manual control was prepared to improve the stability of the air pressure supply and exhaust in the isolated room. A control strategy was designed and tested to obtain its safety and accuracy. The temperature, humidity, room pressure, air velocity, and power consumption were also measured during the HVAC system operation with the purpose to investigate its performance and safety for patients. Based on the Indonesian Ministry of Health guidelines, the pressure gradient at −15 Pa is recommended [6]. However, many of the local medical facilities use high negative pressure that requires high electrical power. Based on discussion with the contractor, the medical facility perquisites the manual regulated pressure at −25 Pa in the construction document. Therefore, the contractor installed the exhaust system which could generate the pressure gradient at −30 Pa to pass the commissioning process in the handover easily.

2. Materials and Methods

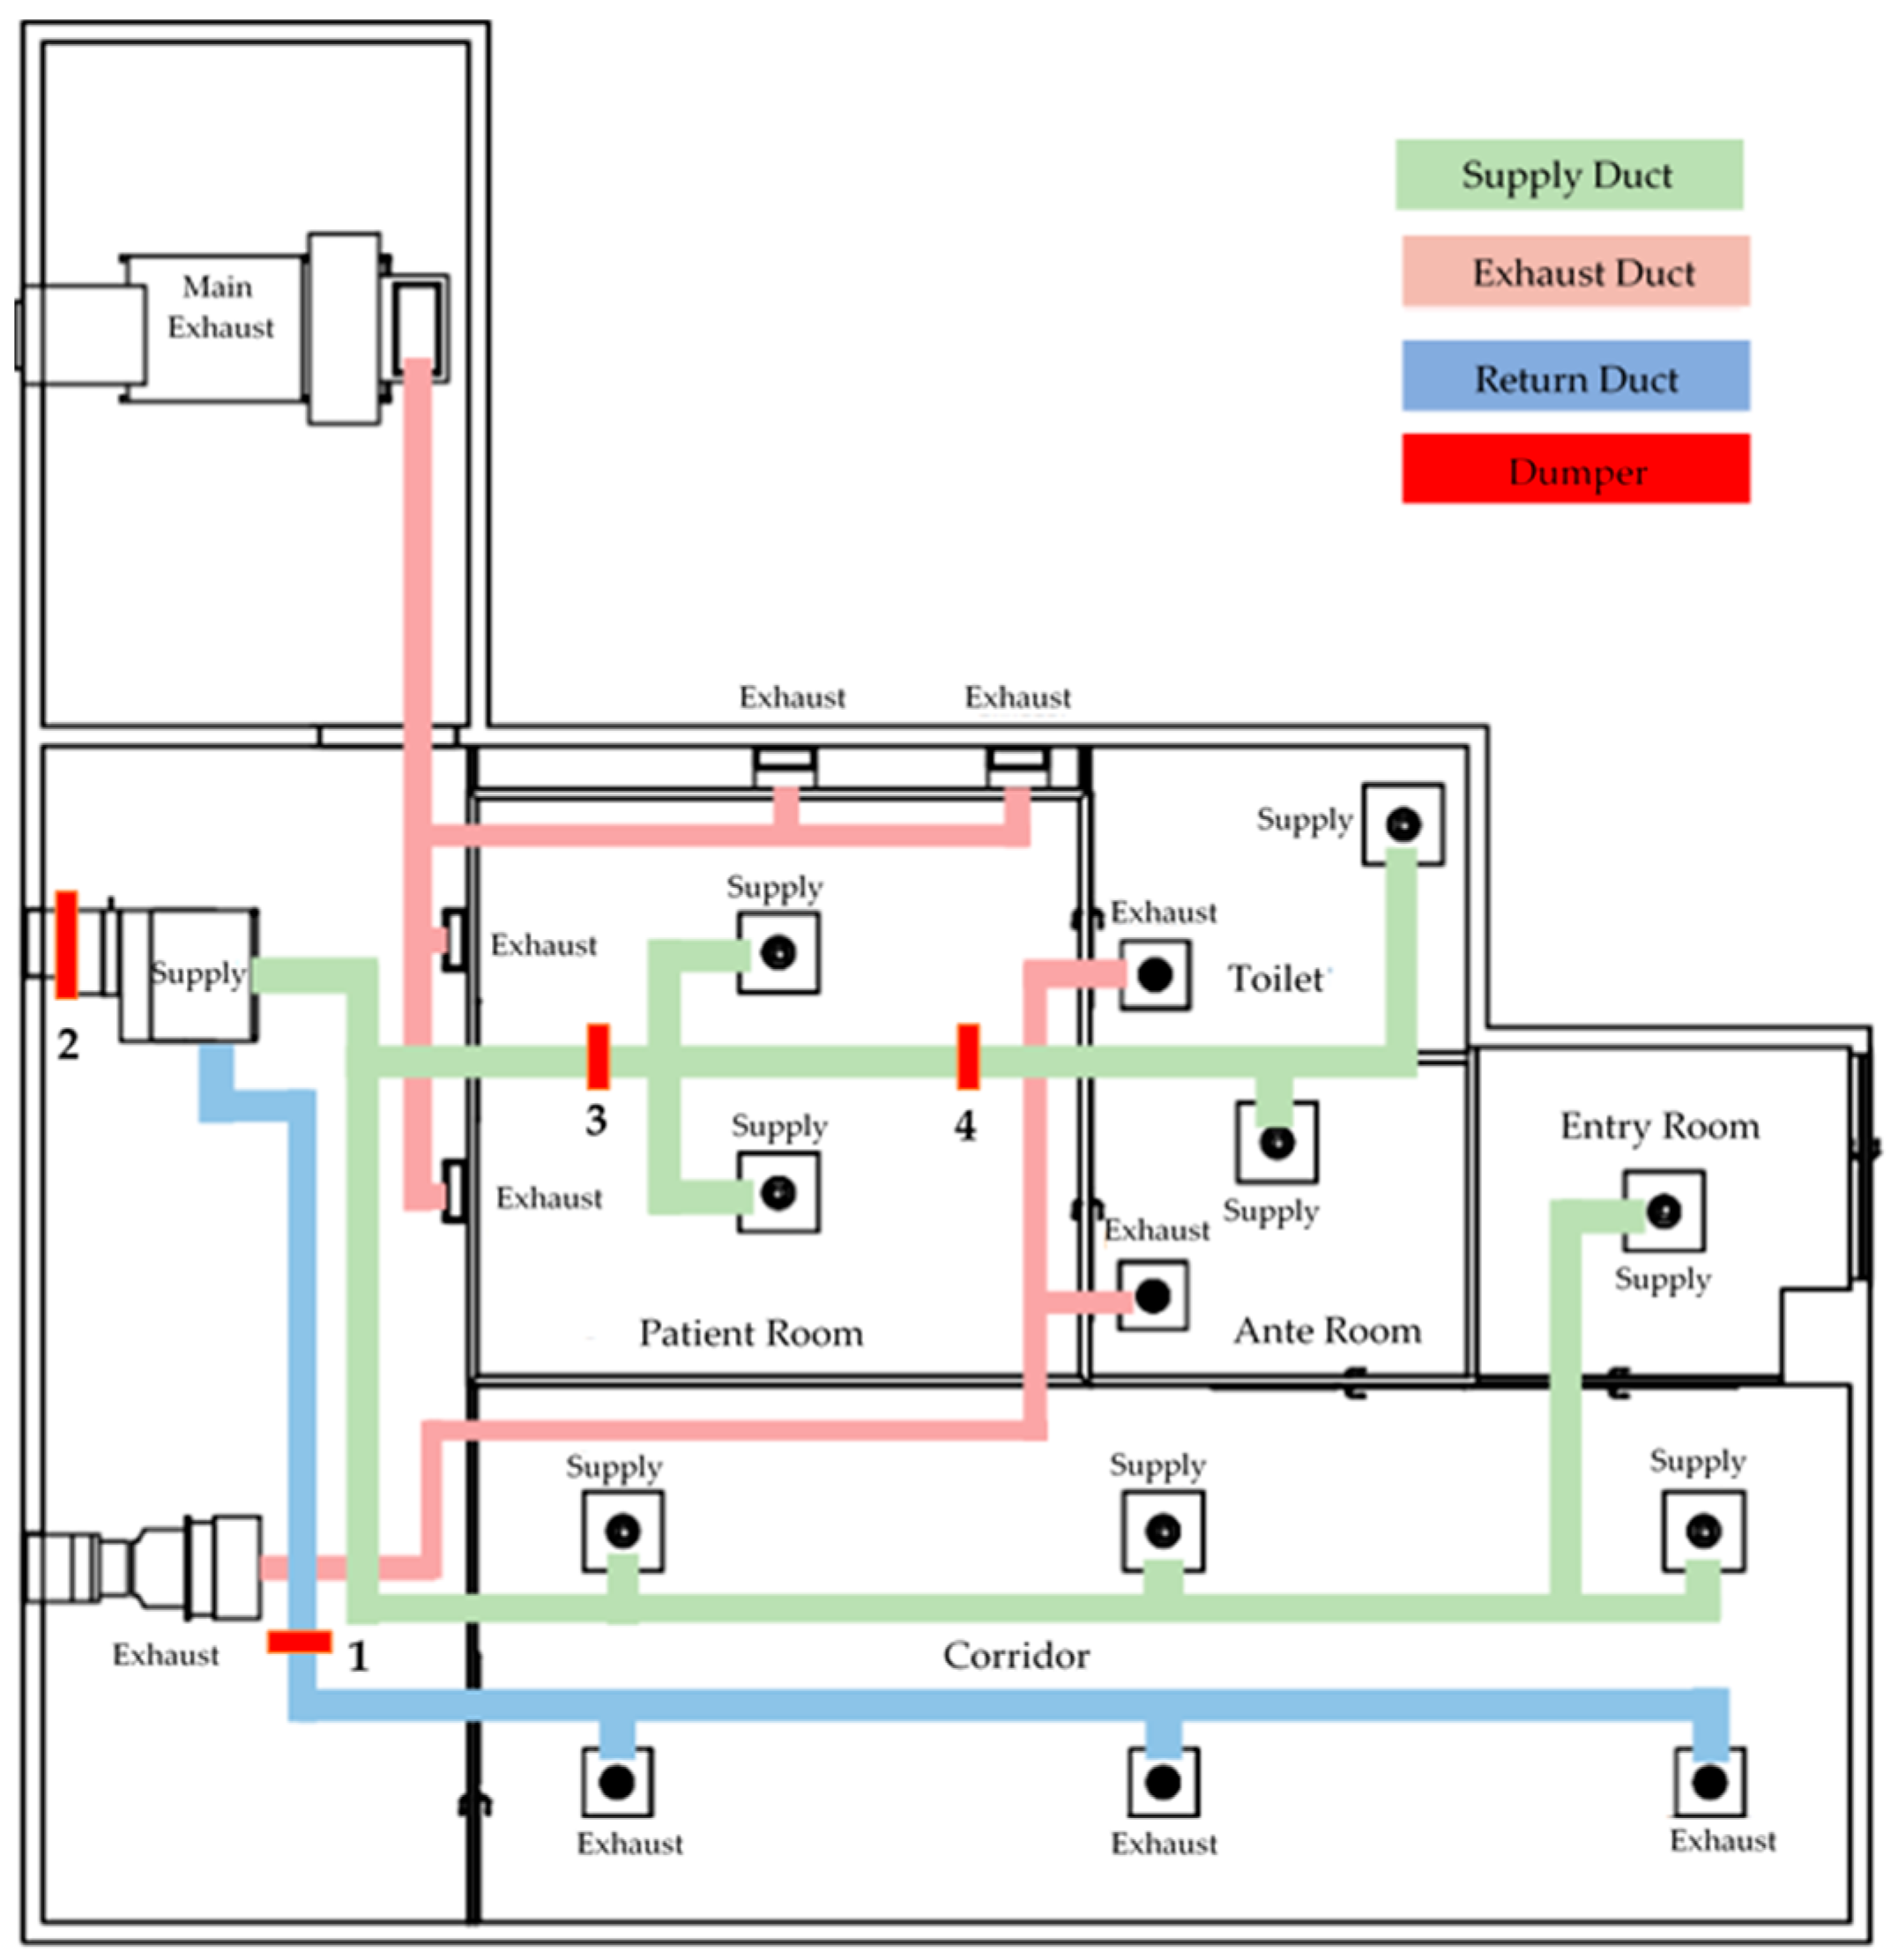
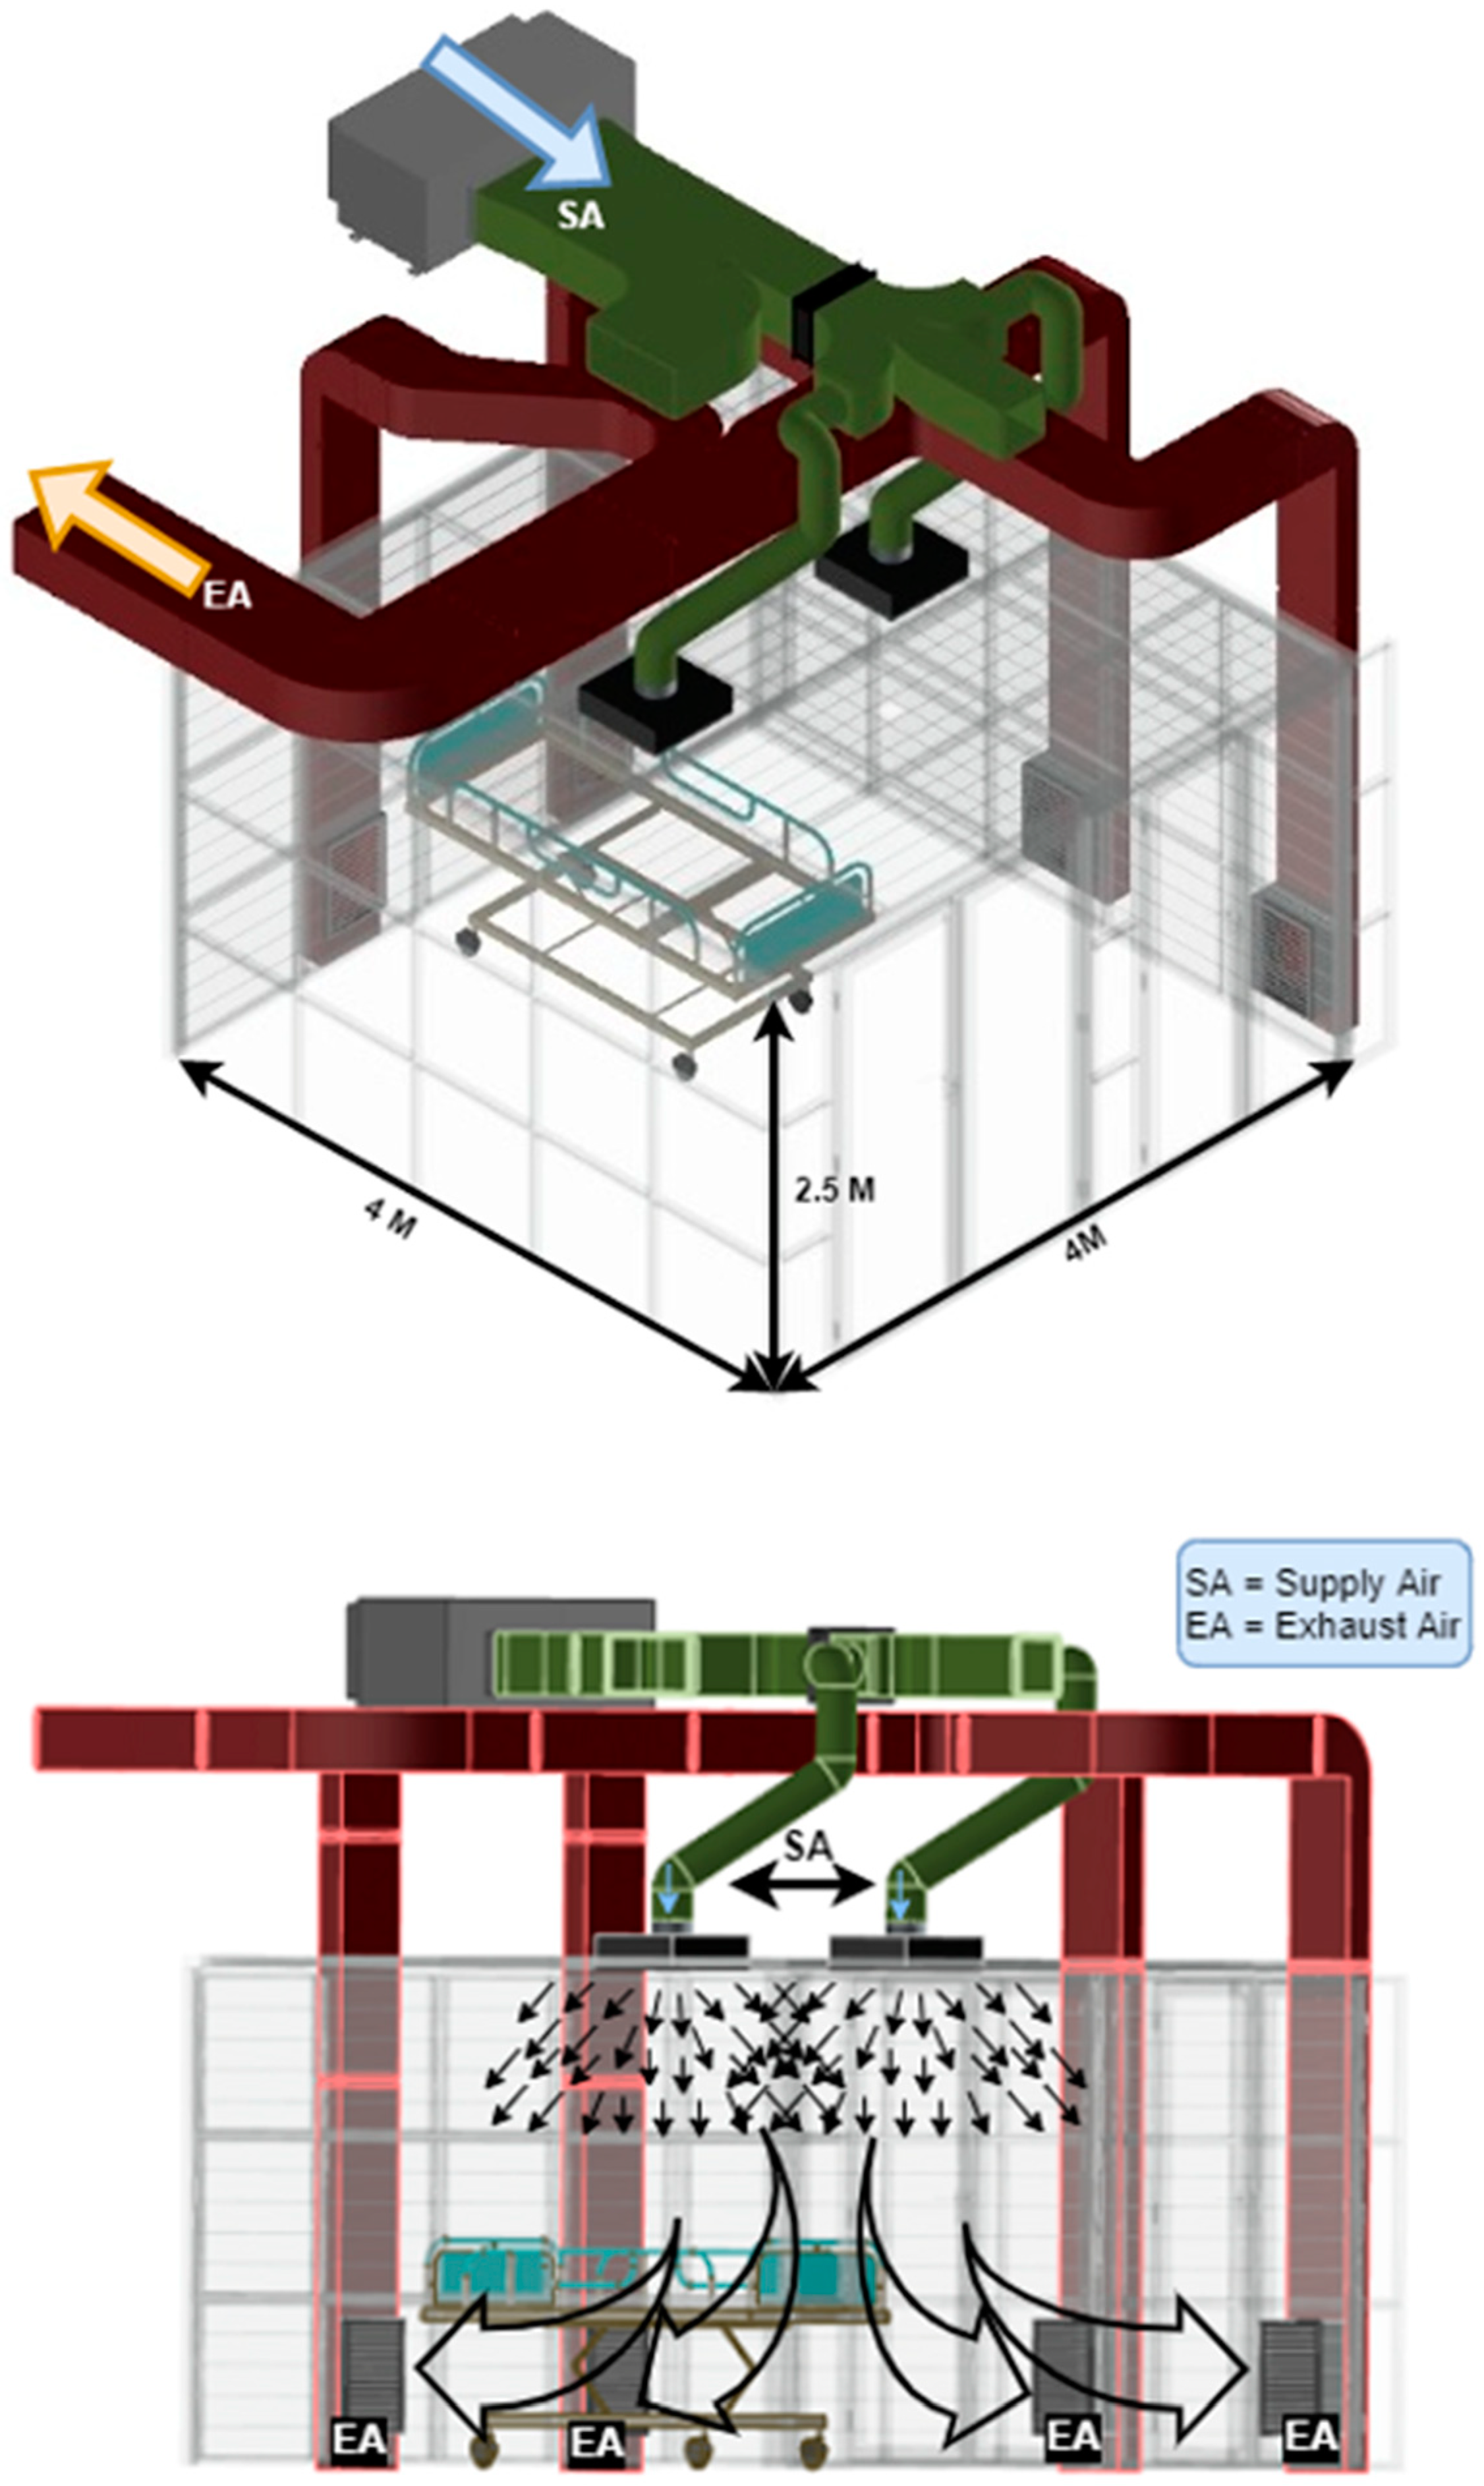
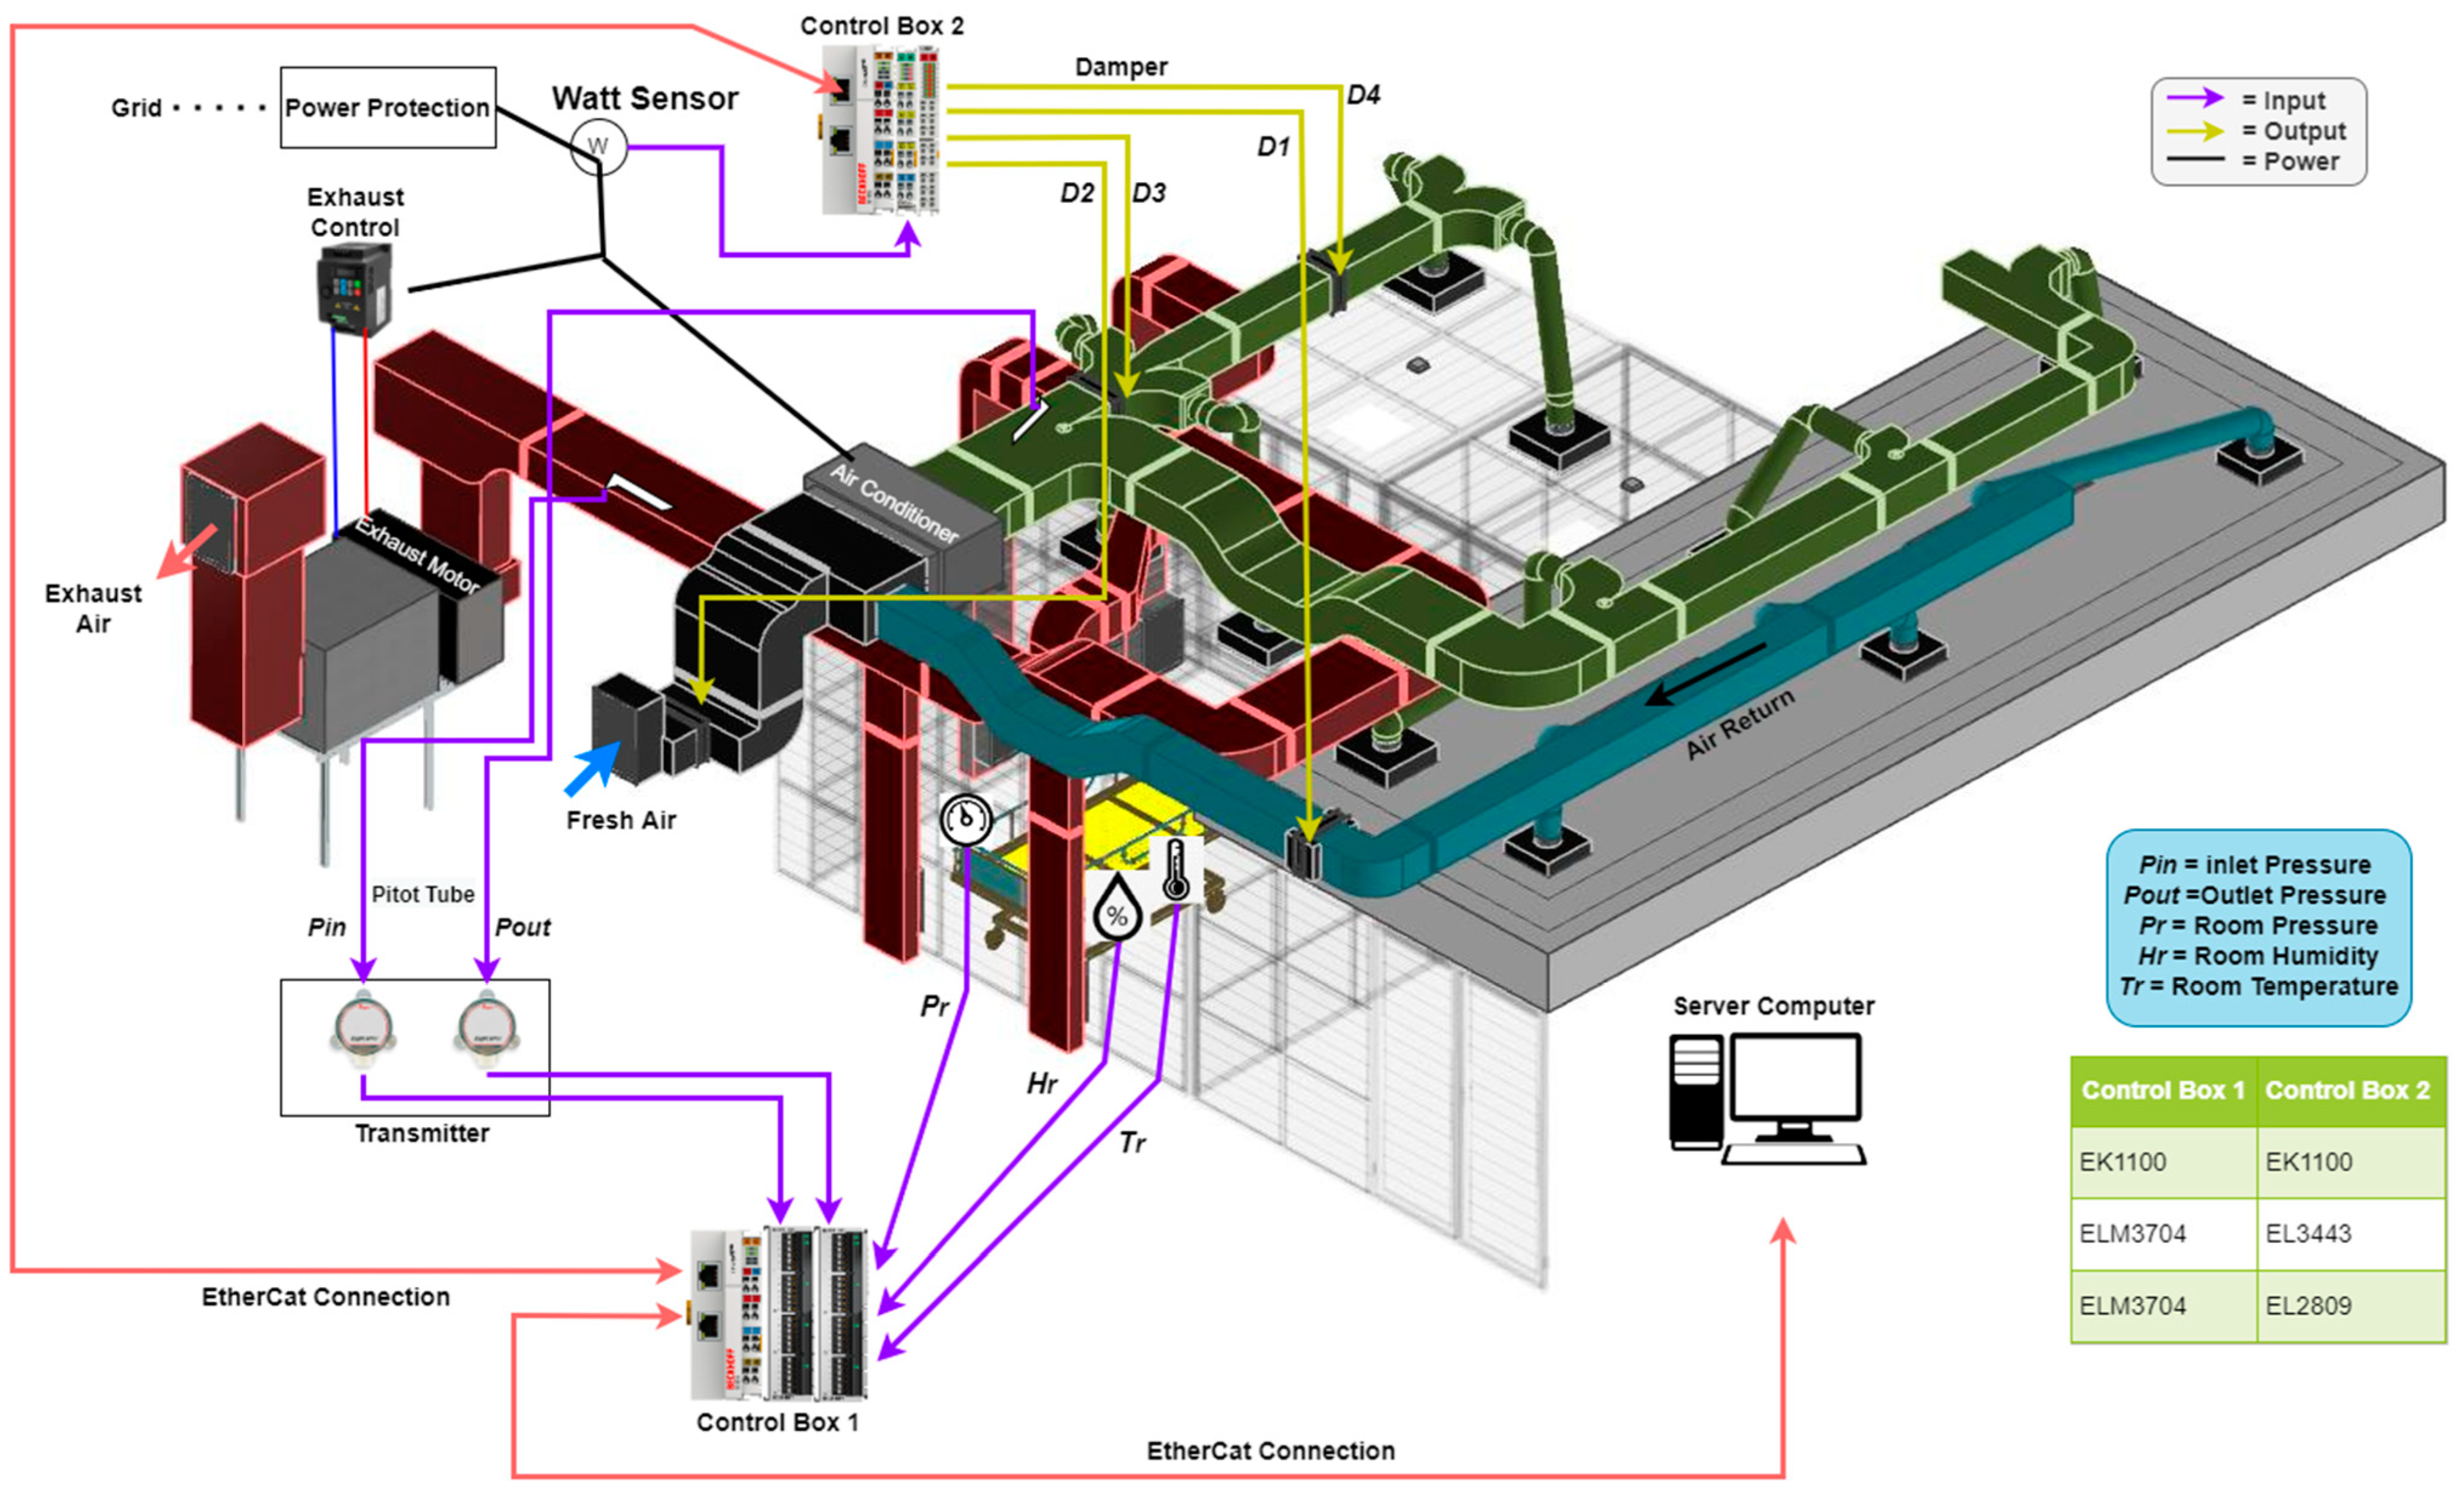
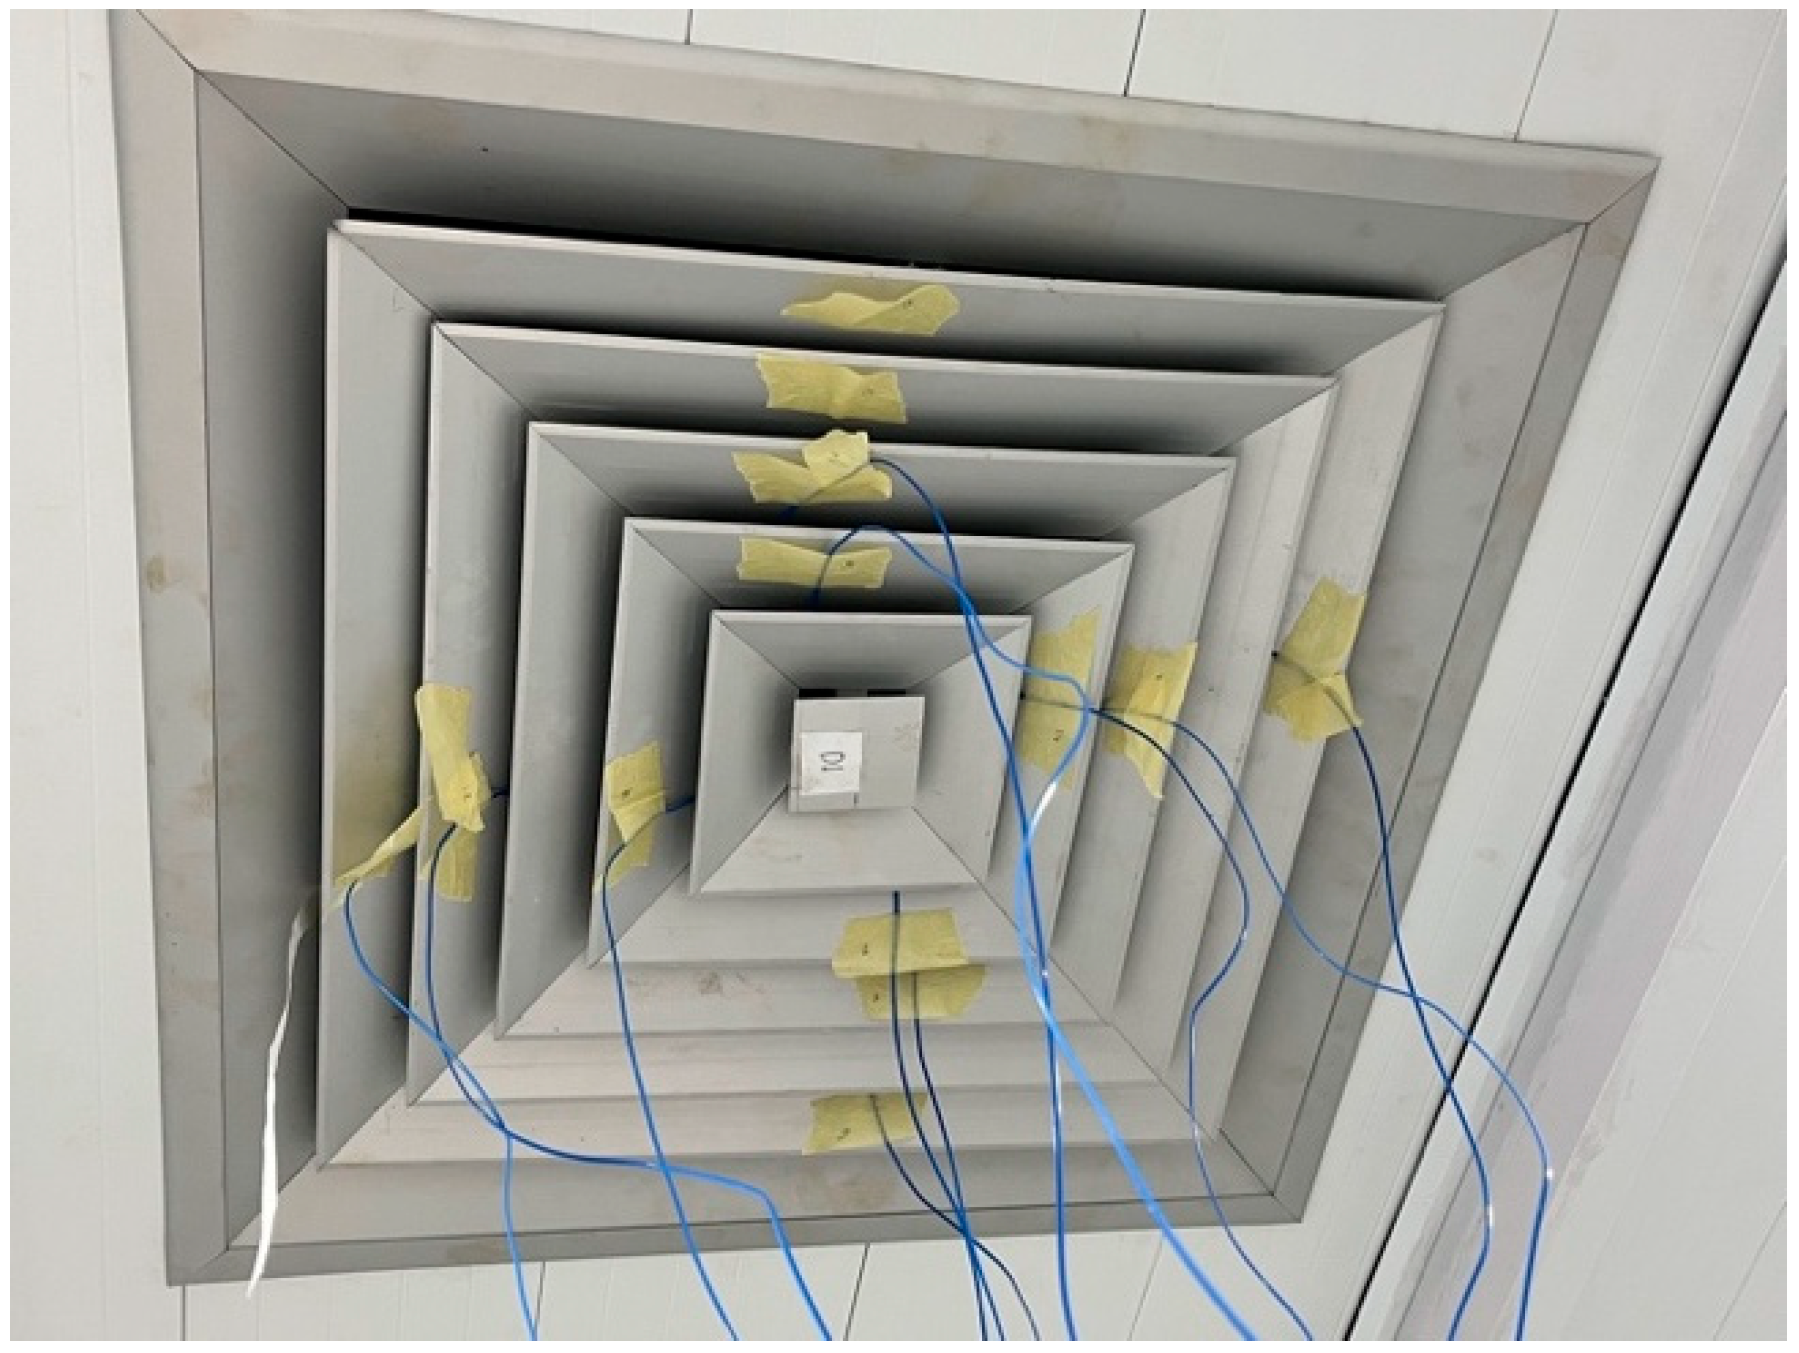
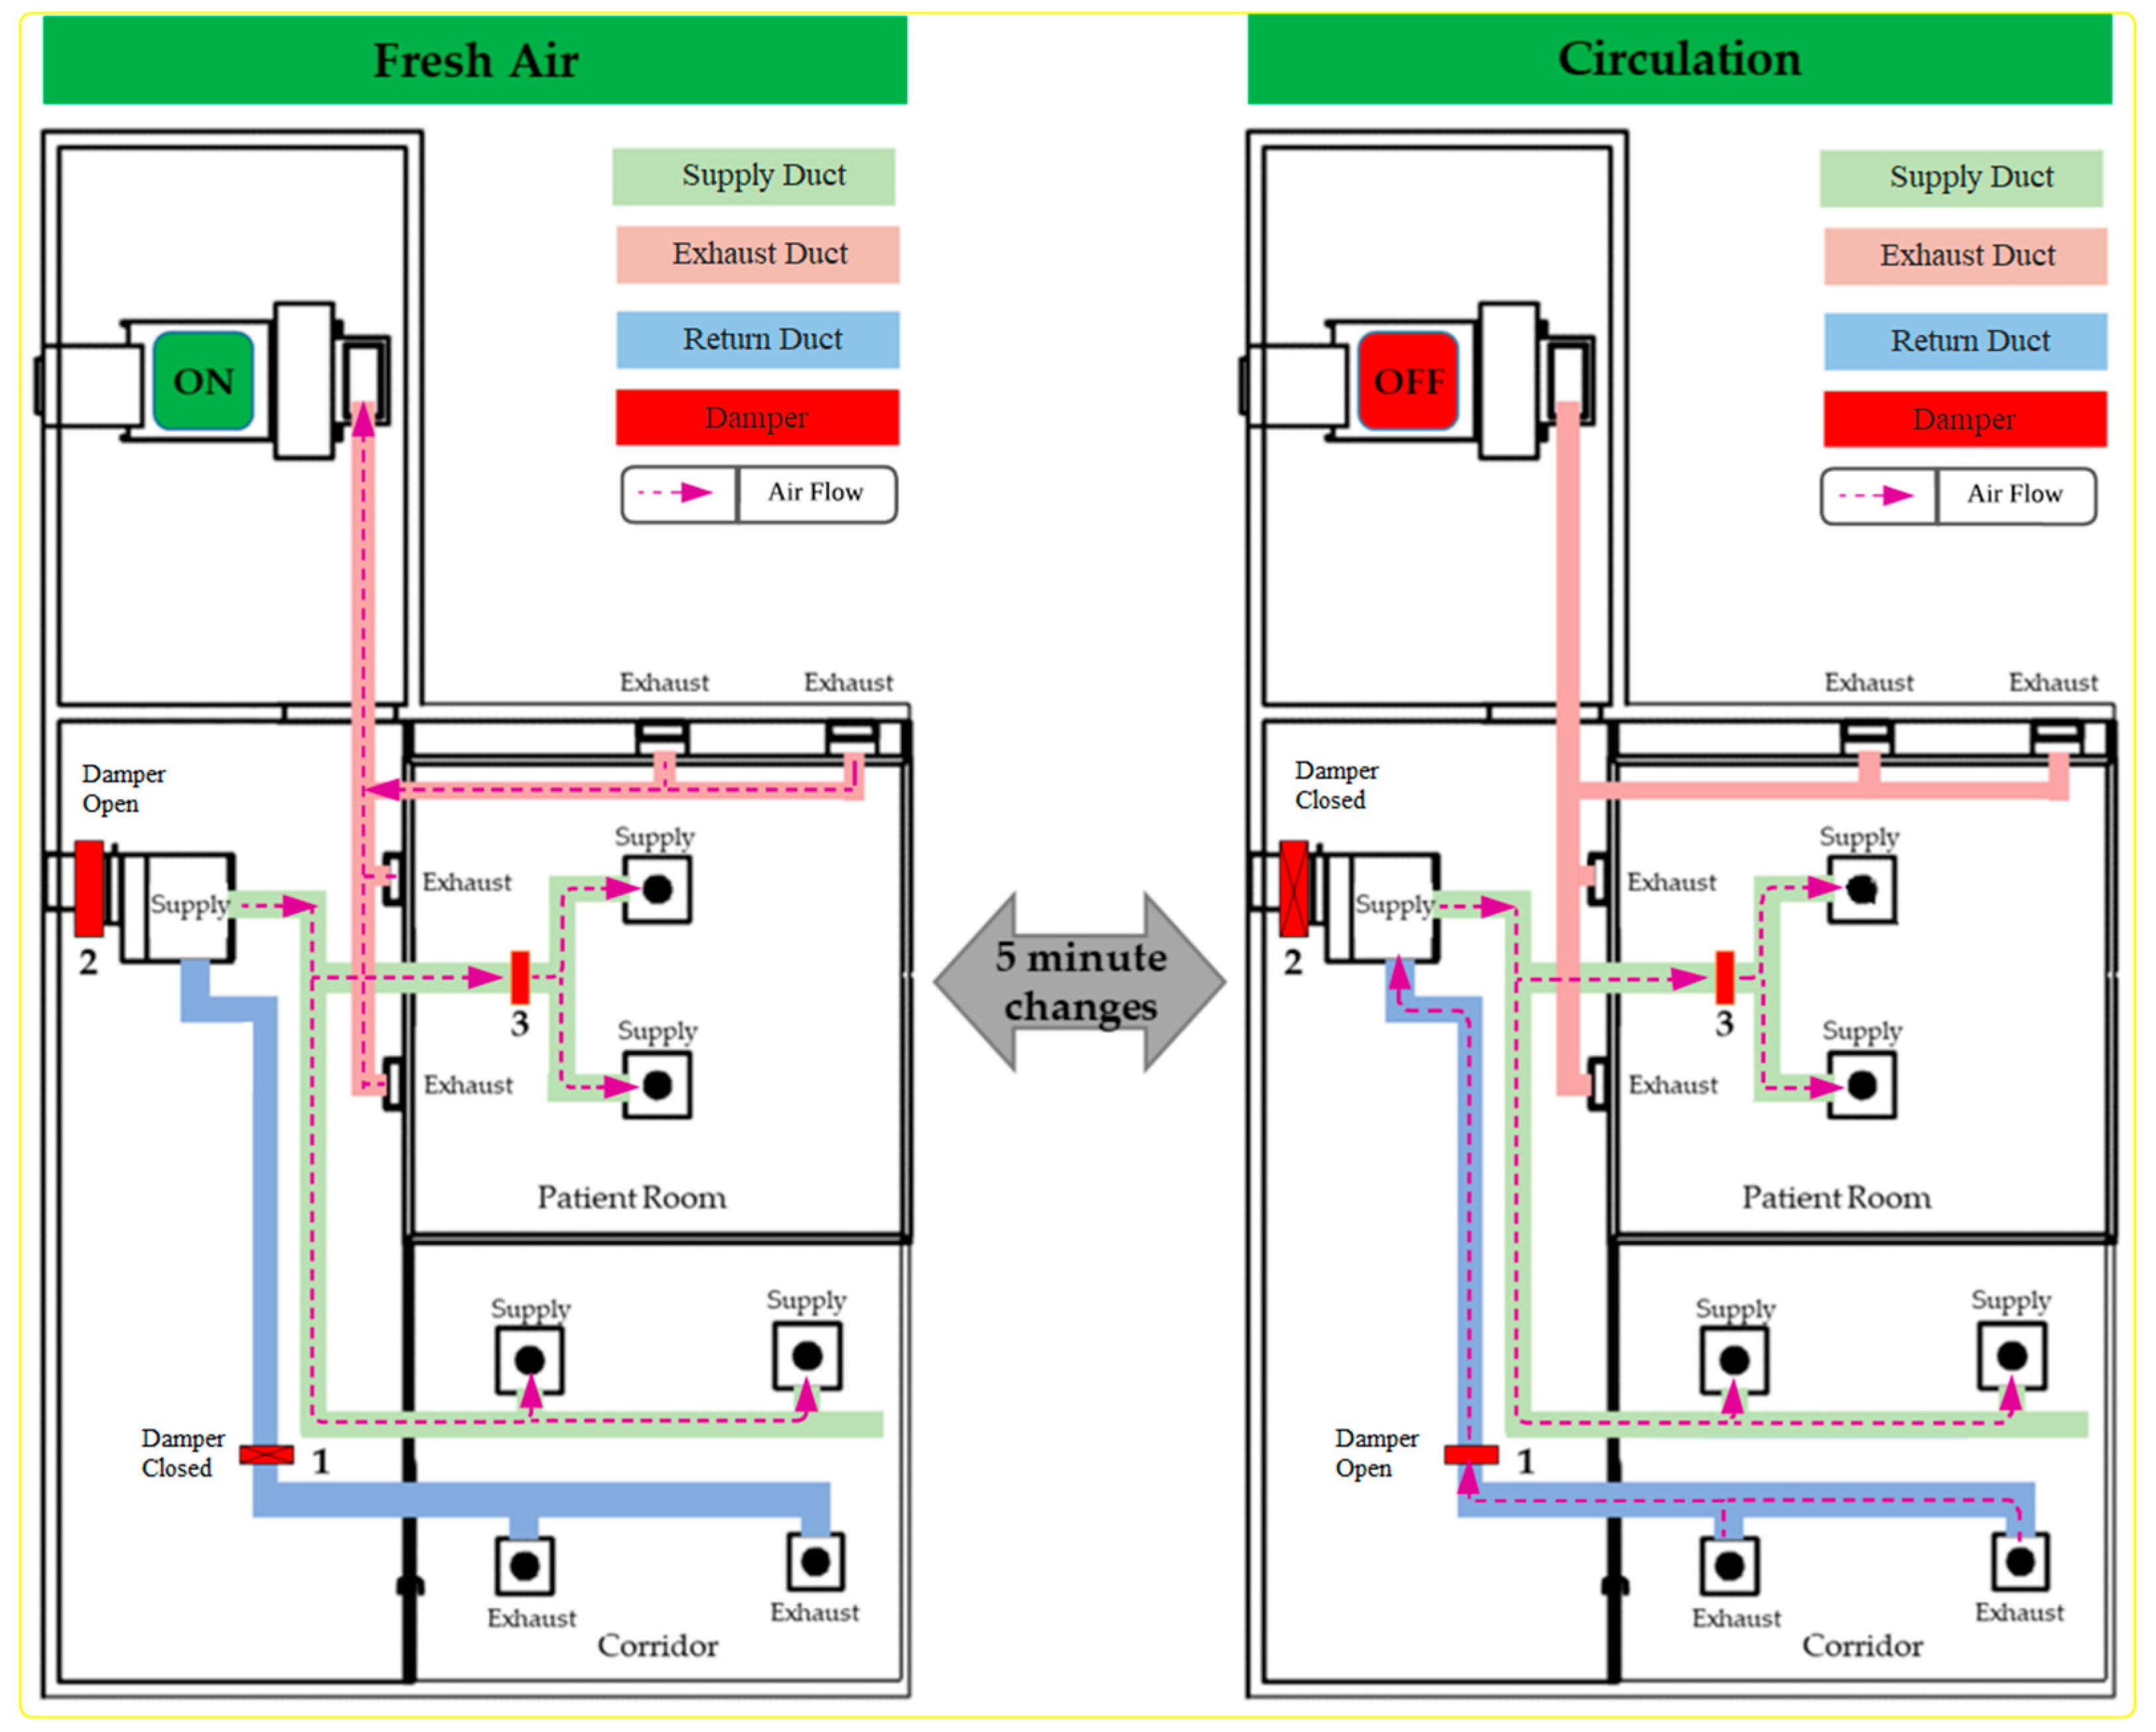
2.1. System Overview

There were two options to regulate the NPG, manual control, or computer-based control. The experiment was carried out by regulating the pressure in the patient room at −15 Pa for both controls. Then, the electricity consumption and patient room pressure were measured during the operation for both control methods. The measurement result was compared, then the best control strategy was chosen by considering the related scientific and technical aspects. The selected control strategy was applied in the following experimental work.
The parameter setup of this experiment is given in Table 2, where S1 to S6 stand for scenarios 1 to 6, respectively. These measurement data for each scenario were collected for 23 h 55 min and 14 s and started from 00:00. The temperature and flow mode of this experiment were chosen in accordance with [5,6]. The HVAC system was running in one flow mode which was realized by opening Damper 1 to Damper 4. The temperature was regulated at 24 °C and the fan speed was in auto mode to ensure the air conditioning (AC) supply had the sufficient airflow rate. The negative pressure regulator was not activated in scenario 1 while the exhaust at the bed head and bed side remained open. The NPG was operated at maximal capacity at −30 Pa in combination with the exhaust opening to investigate its influence on the energy consumption. In scenario 5 and scenario 6, the room pressure was regulated according to the standard in Indonesia/Australia and USA as shown in Table 1.
The N class isolation room consisted of the patient room, bathroom, anteroom, and waiting room with a specific size [6]. Based on the guideline [6], a full-scale isolation room was built at the Faculty of Engineering of Universitas Syiah Kuala in Banda Aceh (5°33′56.0″ N 95°22′04.7″ E). The city is located on the northwestern tip of Sumatera Island. The layout of the isolation room is illustrated in Figure 1. The patient room dimension had length, width, and height of 4 m, 4 m, and 2.5 m, respectively. The outside wall of the isolation room was concrete, and the inner partition was composed of unplasticized polyvinyl chloride (UPVC) and glass. The rubber isolator was installed at the door frame to avoid leakage.
It was also recommended in [6] to control air change per hour (ACH) within the isolation room, which was realized by installing four dampers as depicted in Figure 1. The volume damper was actuated by an electrical motor to bypass or stop the airflow. The air supply and exhaust design in Figure 1 allowed the controller to regulate the airflow for one flow for a specific value of the ACH.
A Daikin SDN80H with 8.9 HP (80,000 Btu/h) was used for conditioning the supply air for the whole room as depicted in Figure 2. Two diffusers (supply air (SA)) were installed on the ceiling as depicted in Figure 2, where their position was chosen based on a recommendation [5,9,14]. The ducting had a dimension of 0.6 × 0.3 m.
The negative pressure was generated by a centrifugal cabinet fan, Vanco type VFCD 400, with a variable speed driver max of 1000 revolutions per minute, a motor power of 4.0 kW, and a maximum air volume of 12,800 (m2/h), which could regulate the air pressure from −2.5 to −15 Pa in accordance with previous studies [1,13,16,17]. A control module was available to regulate the level of negative pressure manually using a potentiometer or through an input signal for an additional system such as a computer control system.
Since the point of interest in this research was the patient room, four exhausts (exhaust air (EA)) were mounted on the lower side of the partition of the patient room as depicted in Figure 2. In accordance with the guidelines [5,13,15], two EAs were placed at the patient’s bed head and two additional ones at the bed foot for this research purpose.
The setup of the isolation room including the control hardware, sensors, and data acquisition is shown in Figure 3. Excluding the AC system, the windows control and automation technology (TwinCAT 3) (Beckhoff in Verl, Germany) software was chosen for the automation platform and data acquisition. This software allowed the automation and data acquisition to run simultaneously at the same time and use the same data cable. These measurement data were presented on the so called TwinCAT scope view, a software oscilloscope for the graphic representation of signal curves in different chart types. For further use, these measurement data can be exported to another format such as comma separated values.
The TwinCAT 3 was running on a Beckhoff industrial PC, and exchanged the data with the sensors/actuator through an Ethernet-based fieldbus system called Ethernet for Control Automation Technology (EtherCAT). The logic to actuate the volume damper position (open or closed) was transmitted from TwinCAT 3 within the computer controller through the Beckhoff terminal EL 2809 to the relay.
Split-core current transformers of type Beckhoff SCT6101-0060, combined with the Beckhoff EL3443 terminal were used to enable the real-time measurements of the three phases current, and the voltage for the AC system and NPG. The room pressure and humidity were measured with a Dwyer MS differential pressure transmitter and humidity sensor, respectively. Twelve thermocouples of type K were installed on a supply air grill with the arrangement shown in Figure 4. The pressure, humidity, and temperature data were transmitted to the server computer through a Beckhoff ELM 3704 terminal.
The air velocity within the ducting was computed from the pressure difference which was measured with the pitot tubes. Two ellipsoidal pitot tubes with the dimensions of 480 mm × 8.00 mm and 305 mm × 4 mm, were installed before the third damper and before the exhaust as depicted in Figure 3. The pressure difference measured with the pitot tubes was transmitted to the Beckhoff ELM 3704 terminal with the Dwyer MS differential pressure transmitter.
For the air supply, the pitot tube sensor was placed on the air supply duct before the patient room duct and before the 3rd damper. As for the exhaust, our sensor was placed on the duct after the main exhaust lane and before the patient room duct.
The average flow velocity Ω was calculated by [18]
Ω = κ 2 ( P t P s ) ρ
where κ ,     P t ,     P t s , and ρ were the flow coefficient, total pressure, static pressure, and air density, respectively. P t was the measure of the total energy of the airstream, and was equal to the pressure of a fluid at rest (static pressure P t s ) plus dynamic pressure. The mass airflow of the air supply to the patient room was computed by
Q = A Ω
where Q and A were the flow rate and ducting sectional area (in this case 0.18 m2).

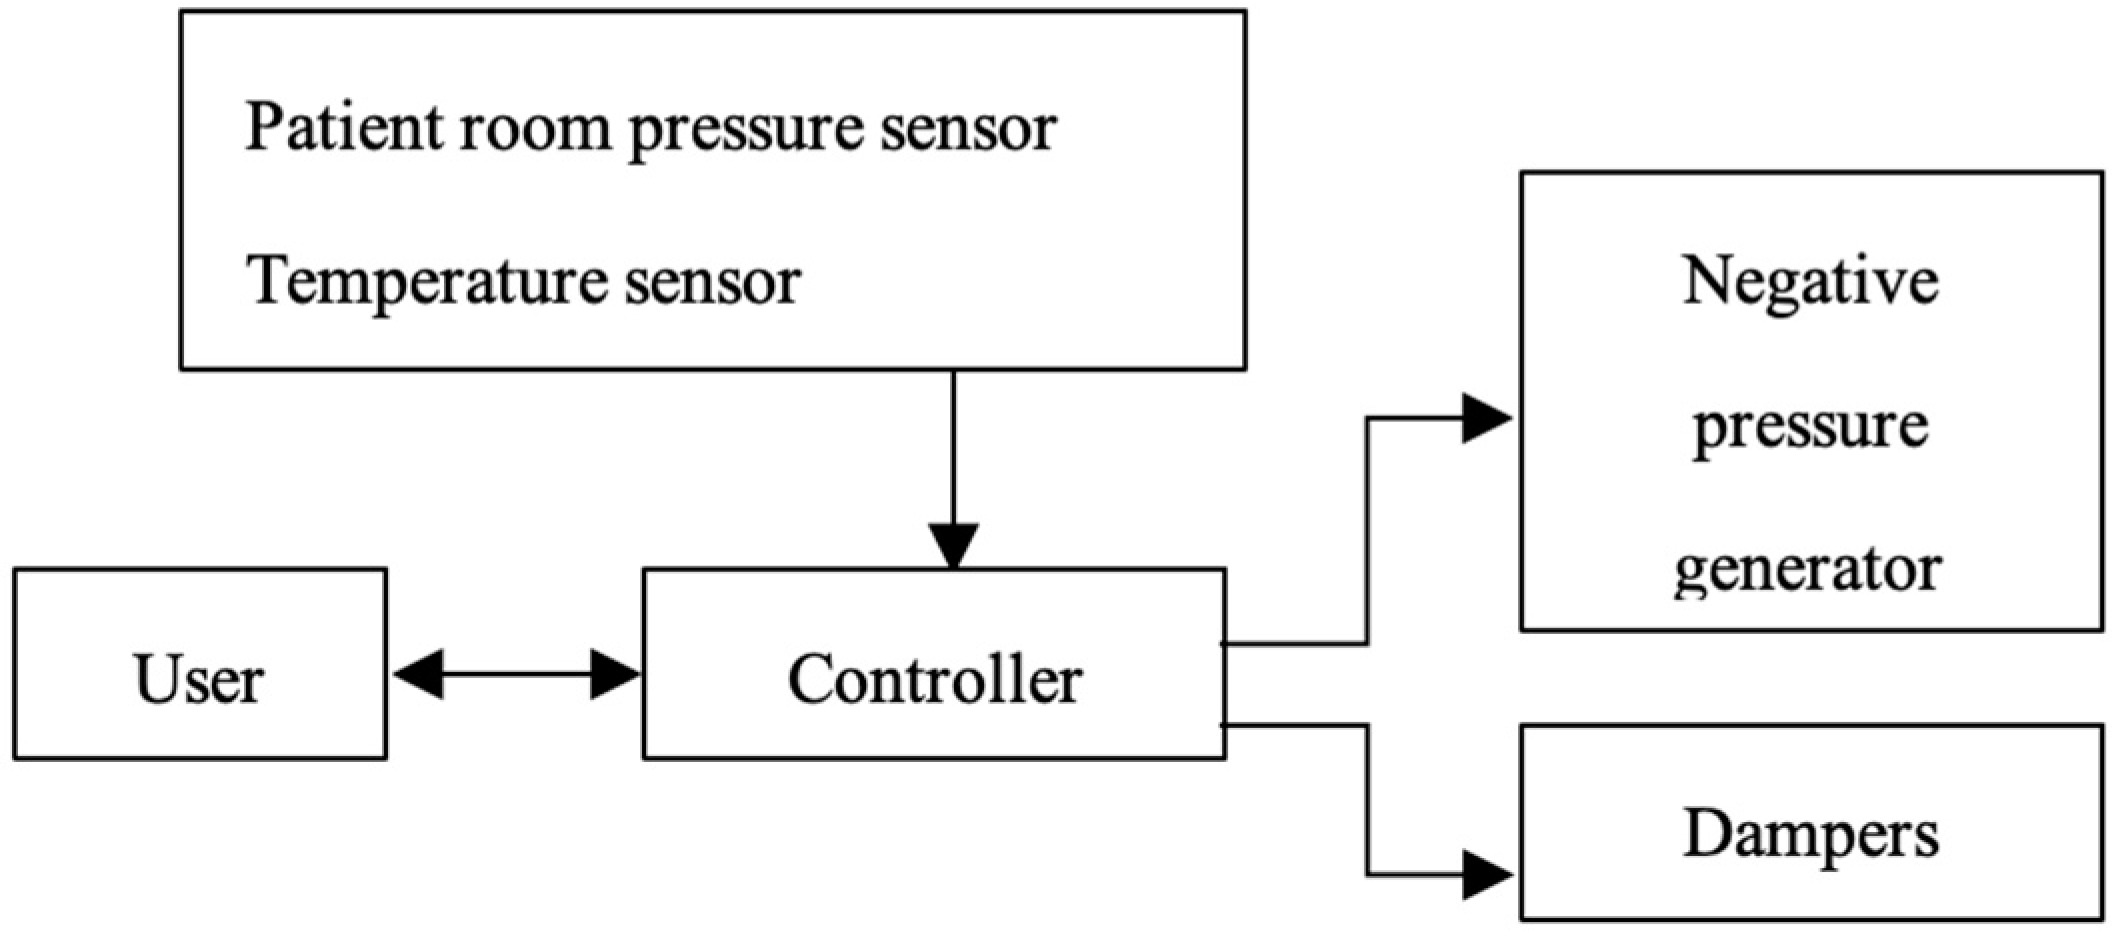
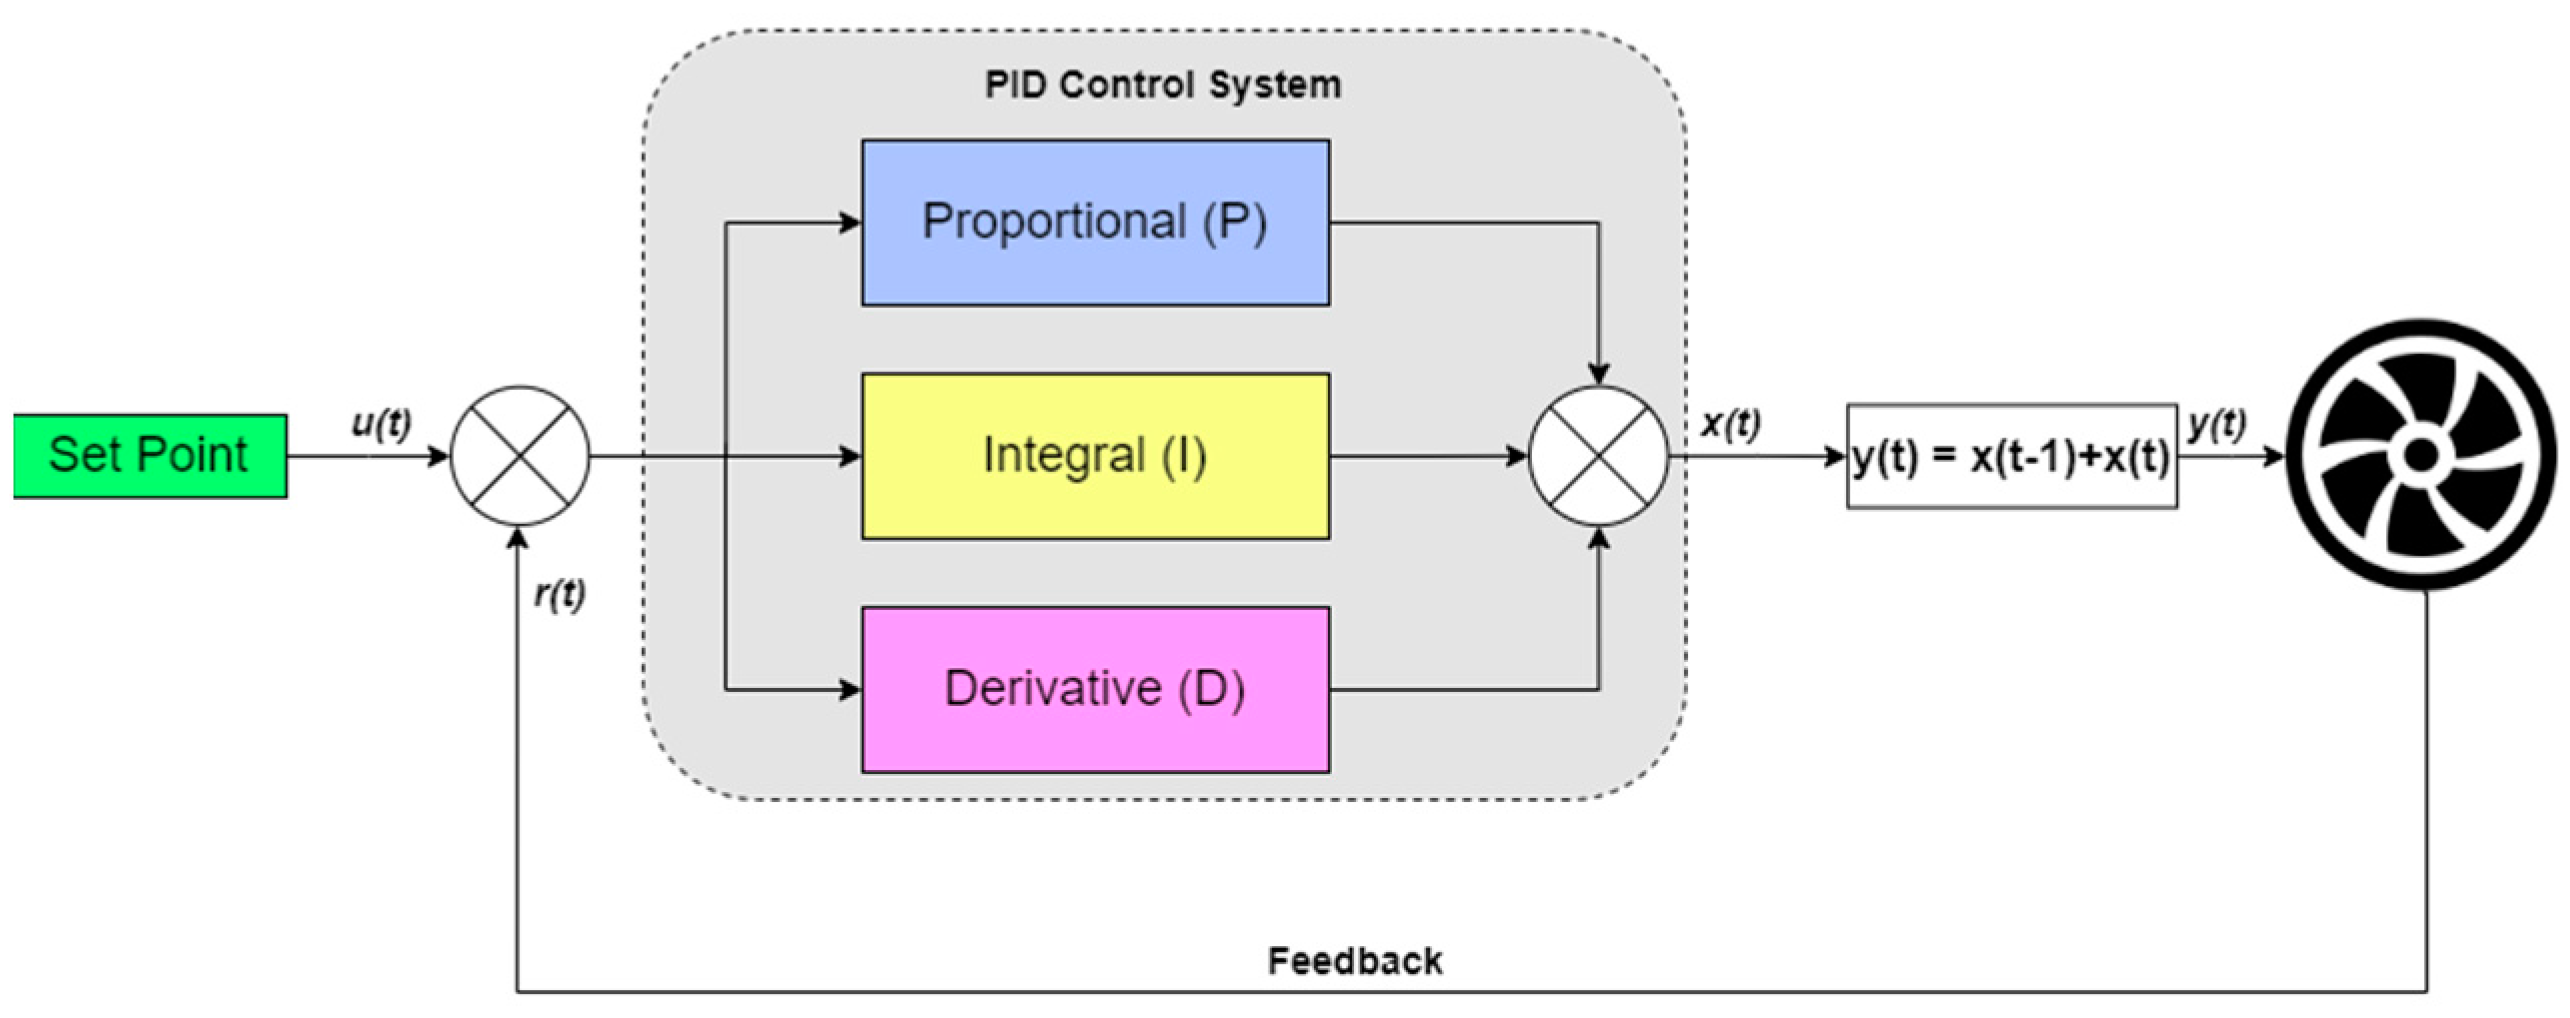
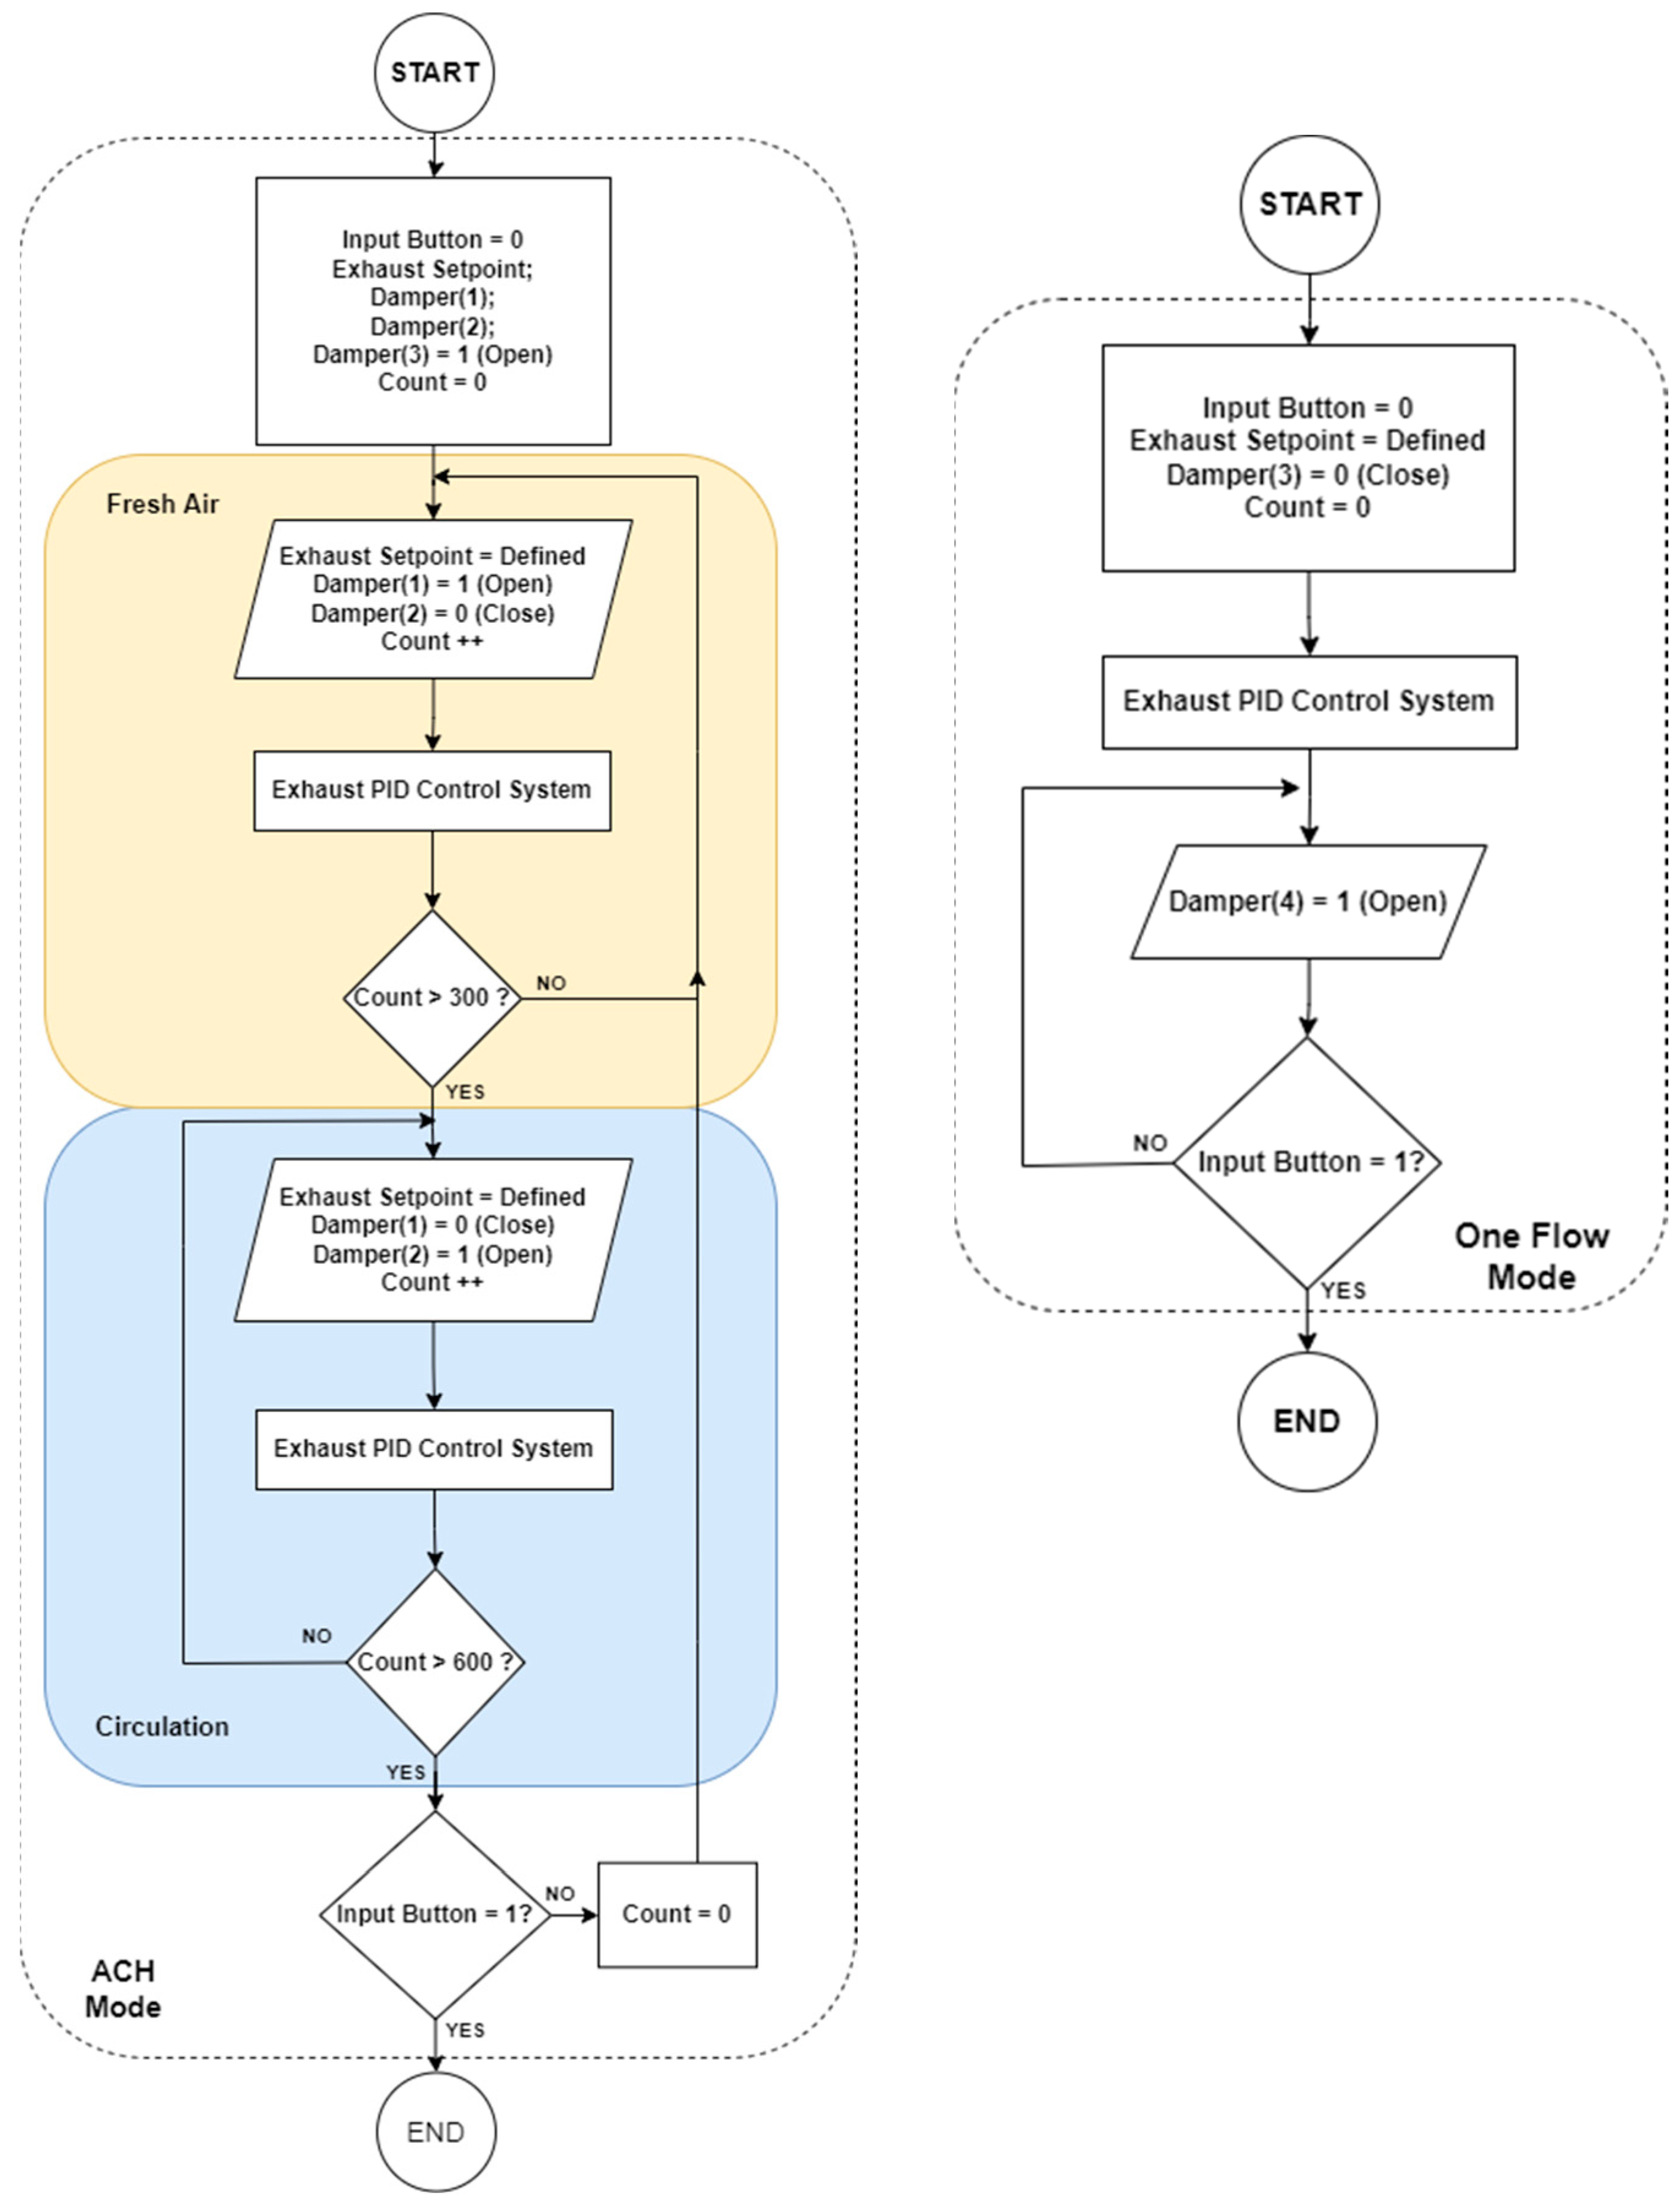
2.2. Control Strategy

The pressure gradient of the patient room had to be maintained to fulfil the recommendation of the pressure as shown in Table 1 or in the guidelines [5,6,15]. In this research, an experiment was conducted to compare the performance between manual adjustment and computer-based control systems. The sampling time of the measurement data was 10 ms. The pressure control schematic in the patient room is depicted in Figure 5.
The desired pressure and the desired ACH was defined in the user interface on the TwinCat 3 software as the input to the controller. The controller received the real-time pressure measurement as feedback from the sensors and calculated the value to actuate the NPG and the volume dampers. For the experimental purpose, the ACH and one flow mode were investigated to obtain their parameters. The flowchart of both modes is depicted in Figure 6. Since the cycle time of the program on TwinCAT 3, described by the flowchart in Figure 6, was 1 s, the specific number of parameter “count” as shown in Figure 6 was defined to achieve the ACH of 12 times/hour as required in [4,8,9,16].
In the ACH mode, the controller regulated the volume dampers opening to allow the AC system to supply the fresh air from the open air into the patient room and the waiting room. After five minutes, the controller switched the volume dampers opening to other combinations to circulate the air from the waiting room to the patient room for another five minutes. Figure 7 clearly illustrates the air circulation in both modes.
The ducting design in Figure 1 avoided the contaminated air from the patient room being supplied into the waiting room. Meanwhile, in the one flow mode, the controller ensured only the fresh air from the open air was supplied to the whole room.
For the manual control of the NPG, the setpoint was adjusted manually by the operator at the control module to achieve the desired negative pressure. Meanwhile, a control algorithm to compute the magnitude of the voltage signal was necessary for the computer-based control to regulate the negative pressure. This specific voltage signal was transmitted through an EL 4002 Beckhoff terminal to the control module. One of the popular methods among engineers is the proportional-integral-derivative (PID) controller. The PID controller is a method used to stabilize a system [19,20] with reference to the magnitude of the error with respect to the time. This controller was chosen in this research to regulate the negative pressure due to its robustness, simplicity, and ease to apply. The schematic of the PID controller is shown in Figure 8, which was used only for the computer-based negative pressure control. This part is excluded from the flowchart if the NPG was controlled manually.
The setpoint (u(t)), the feedback (r(t)), and the output (y(t)) were the desired pressure gradient in the patient room, the measured pressure in the patient room and the computed voltage magnitude, respectively. The PID parameters were tuned based on the Ziegler–Nichols PID procedure.

3. Results and Discussion

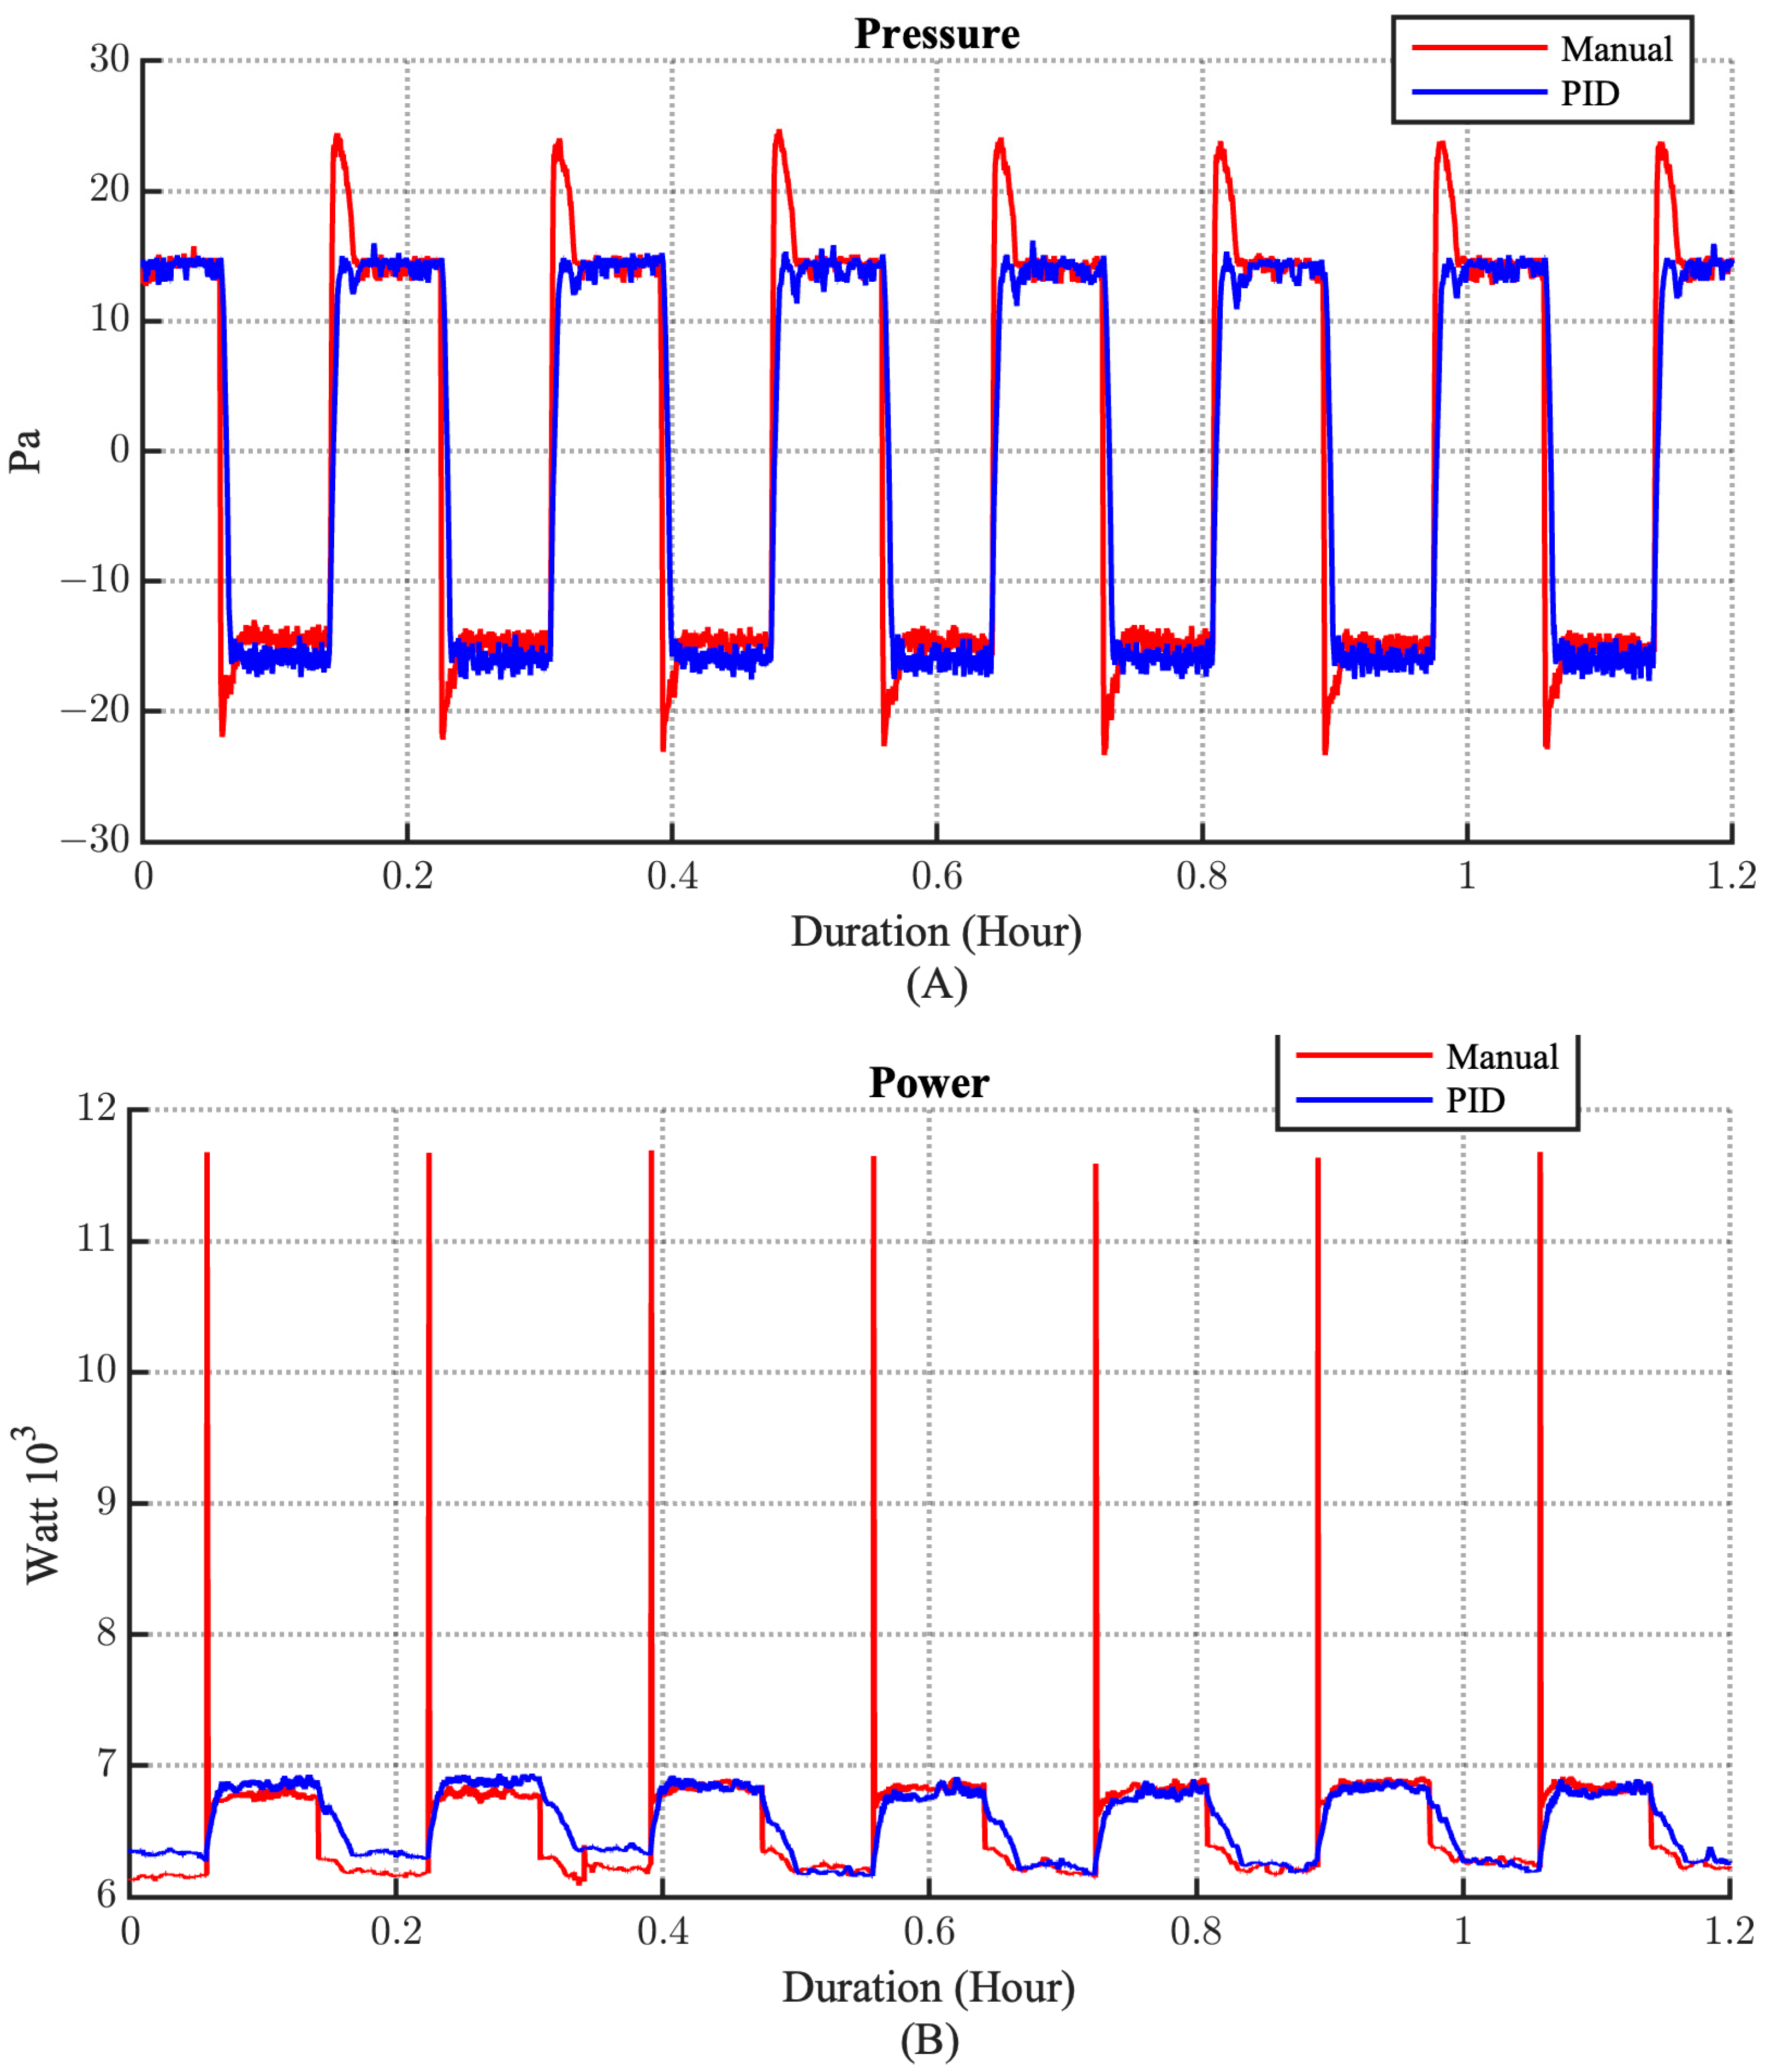
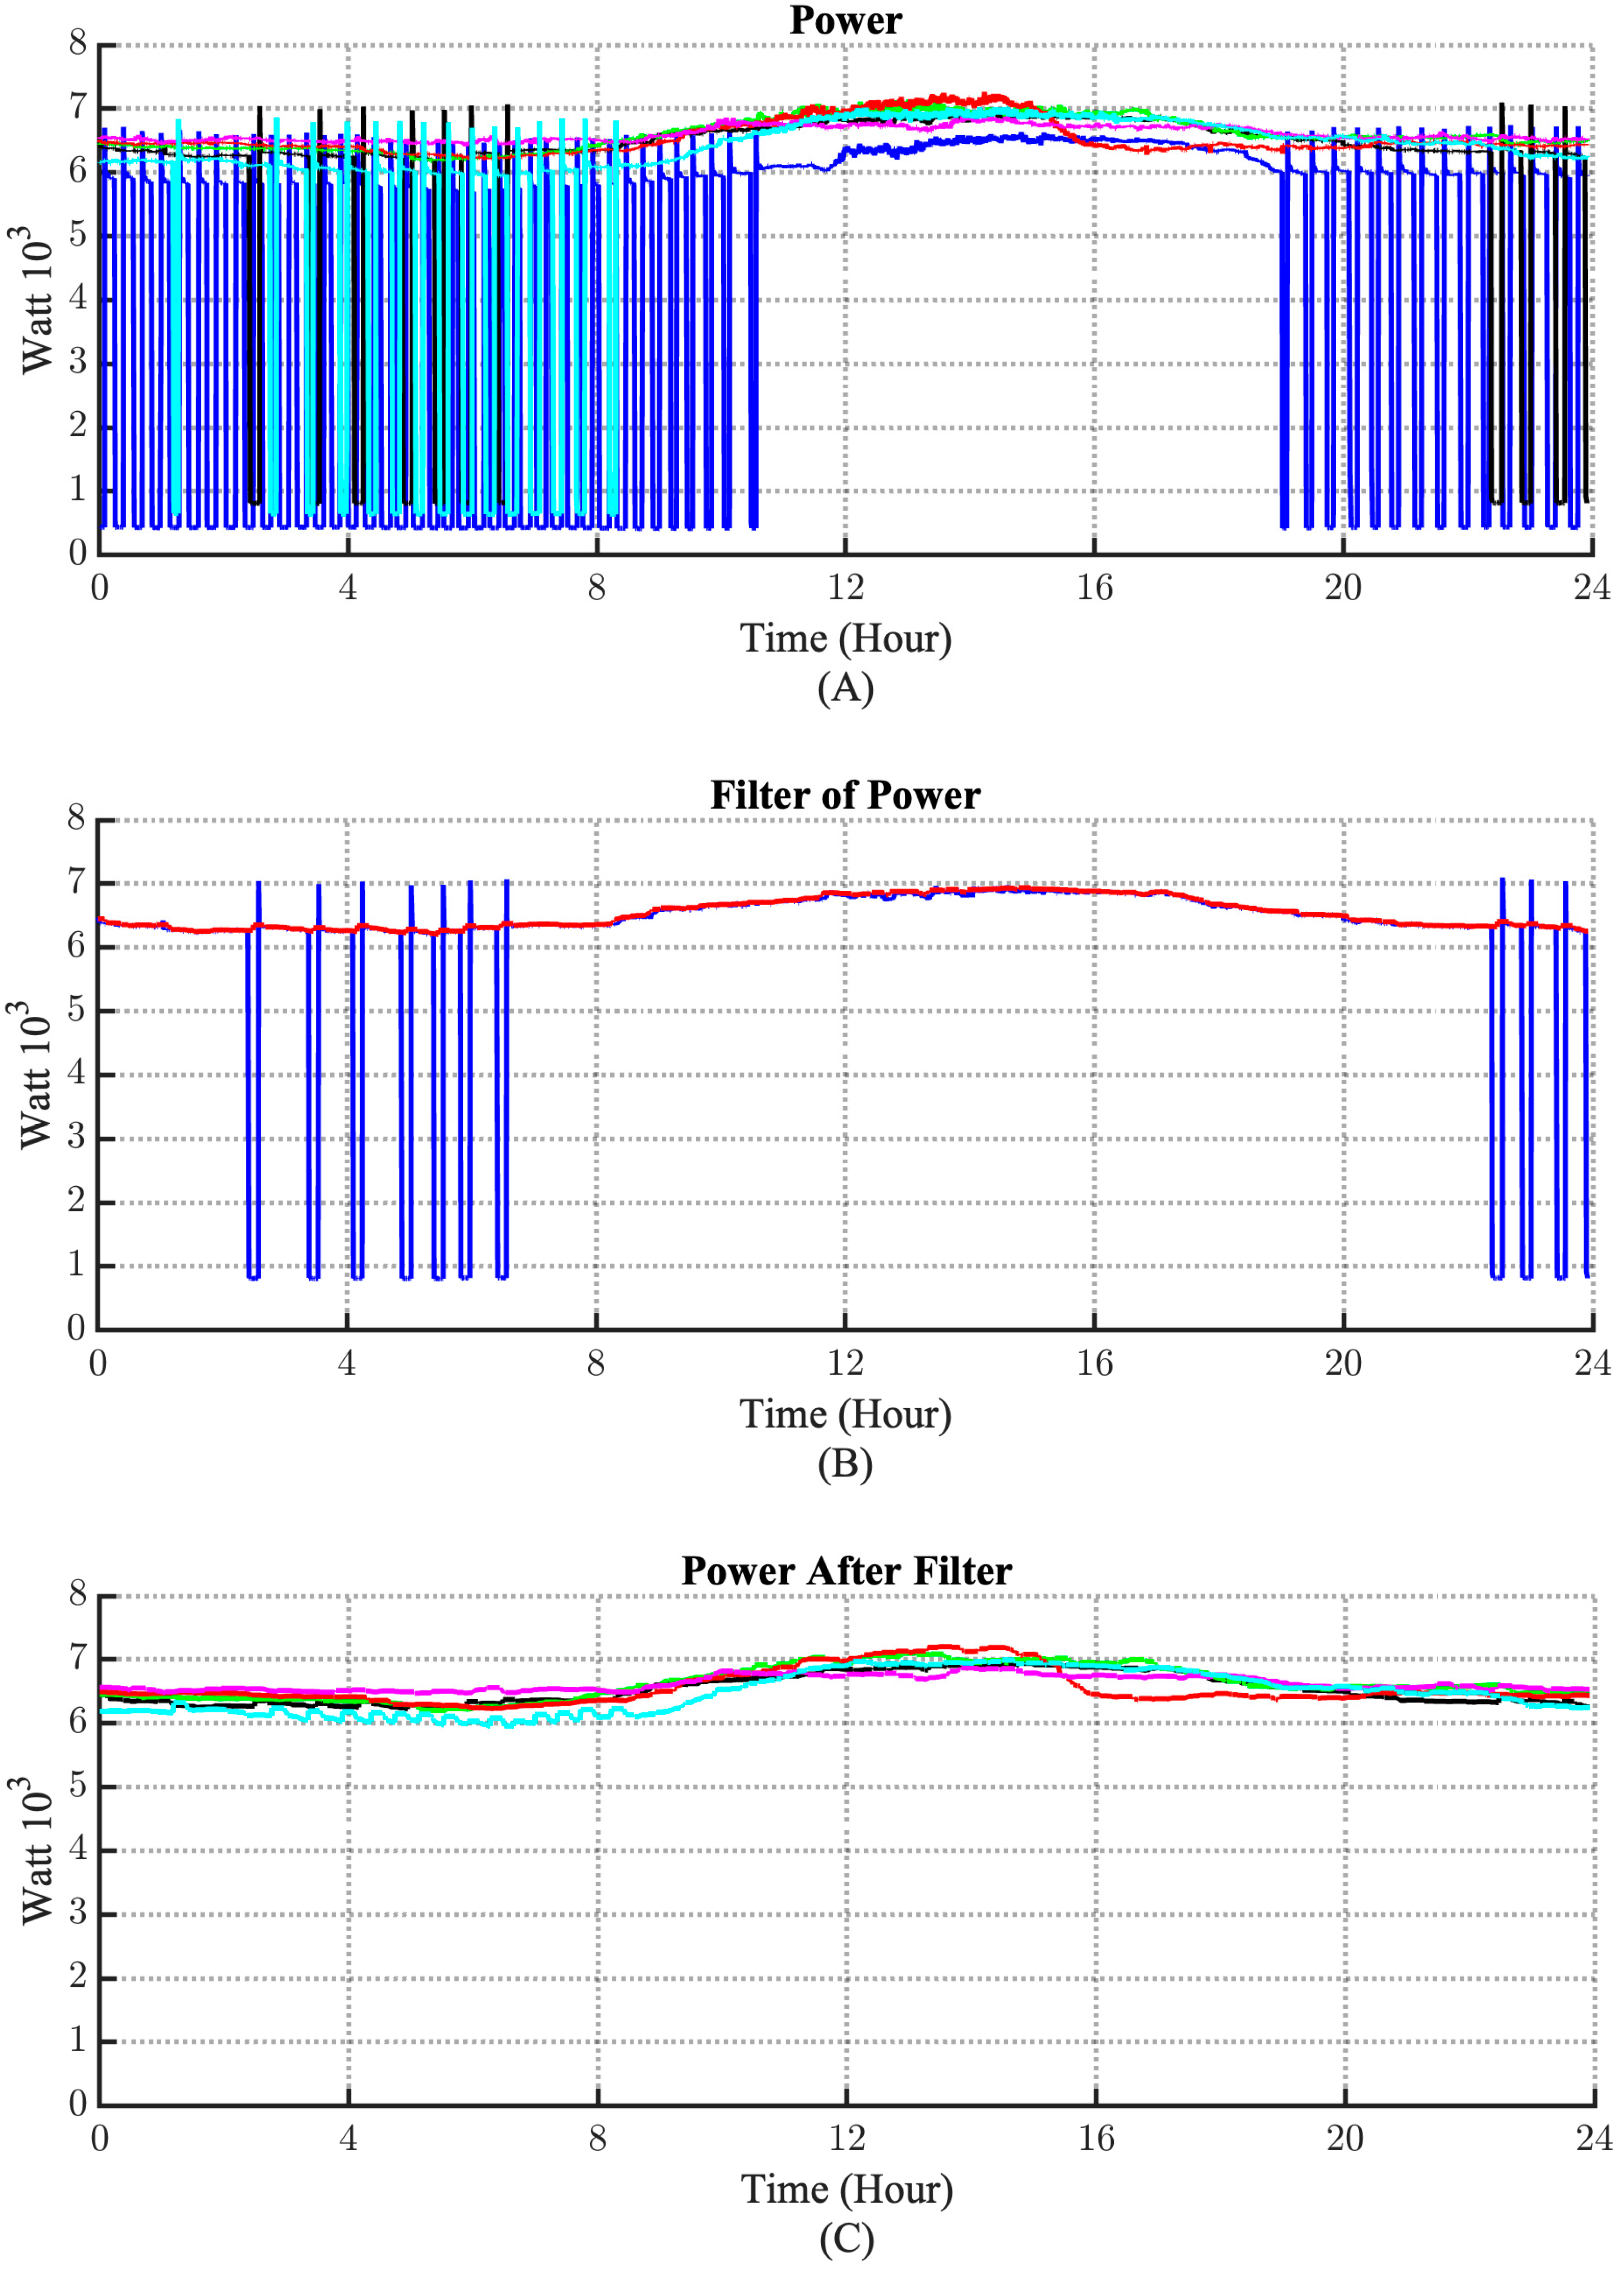
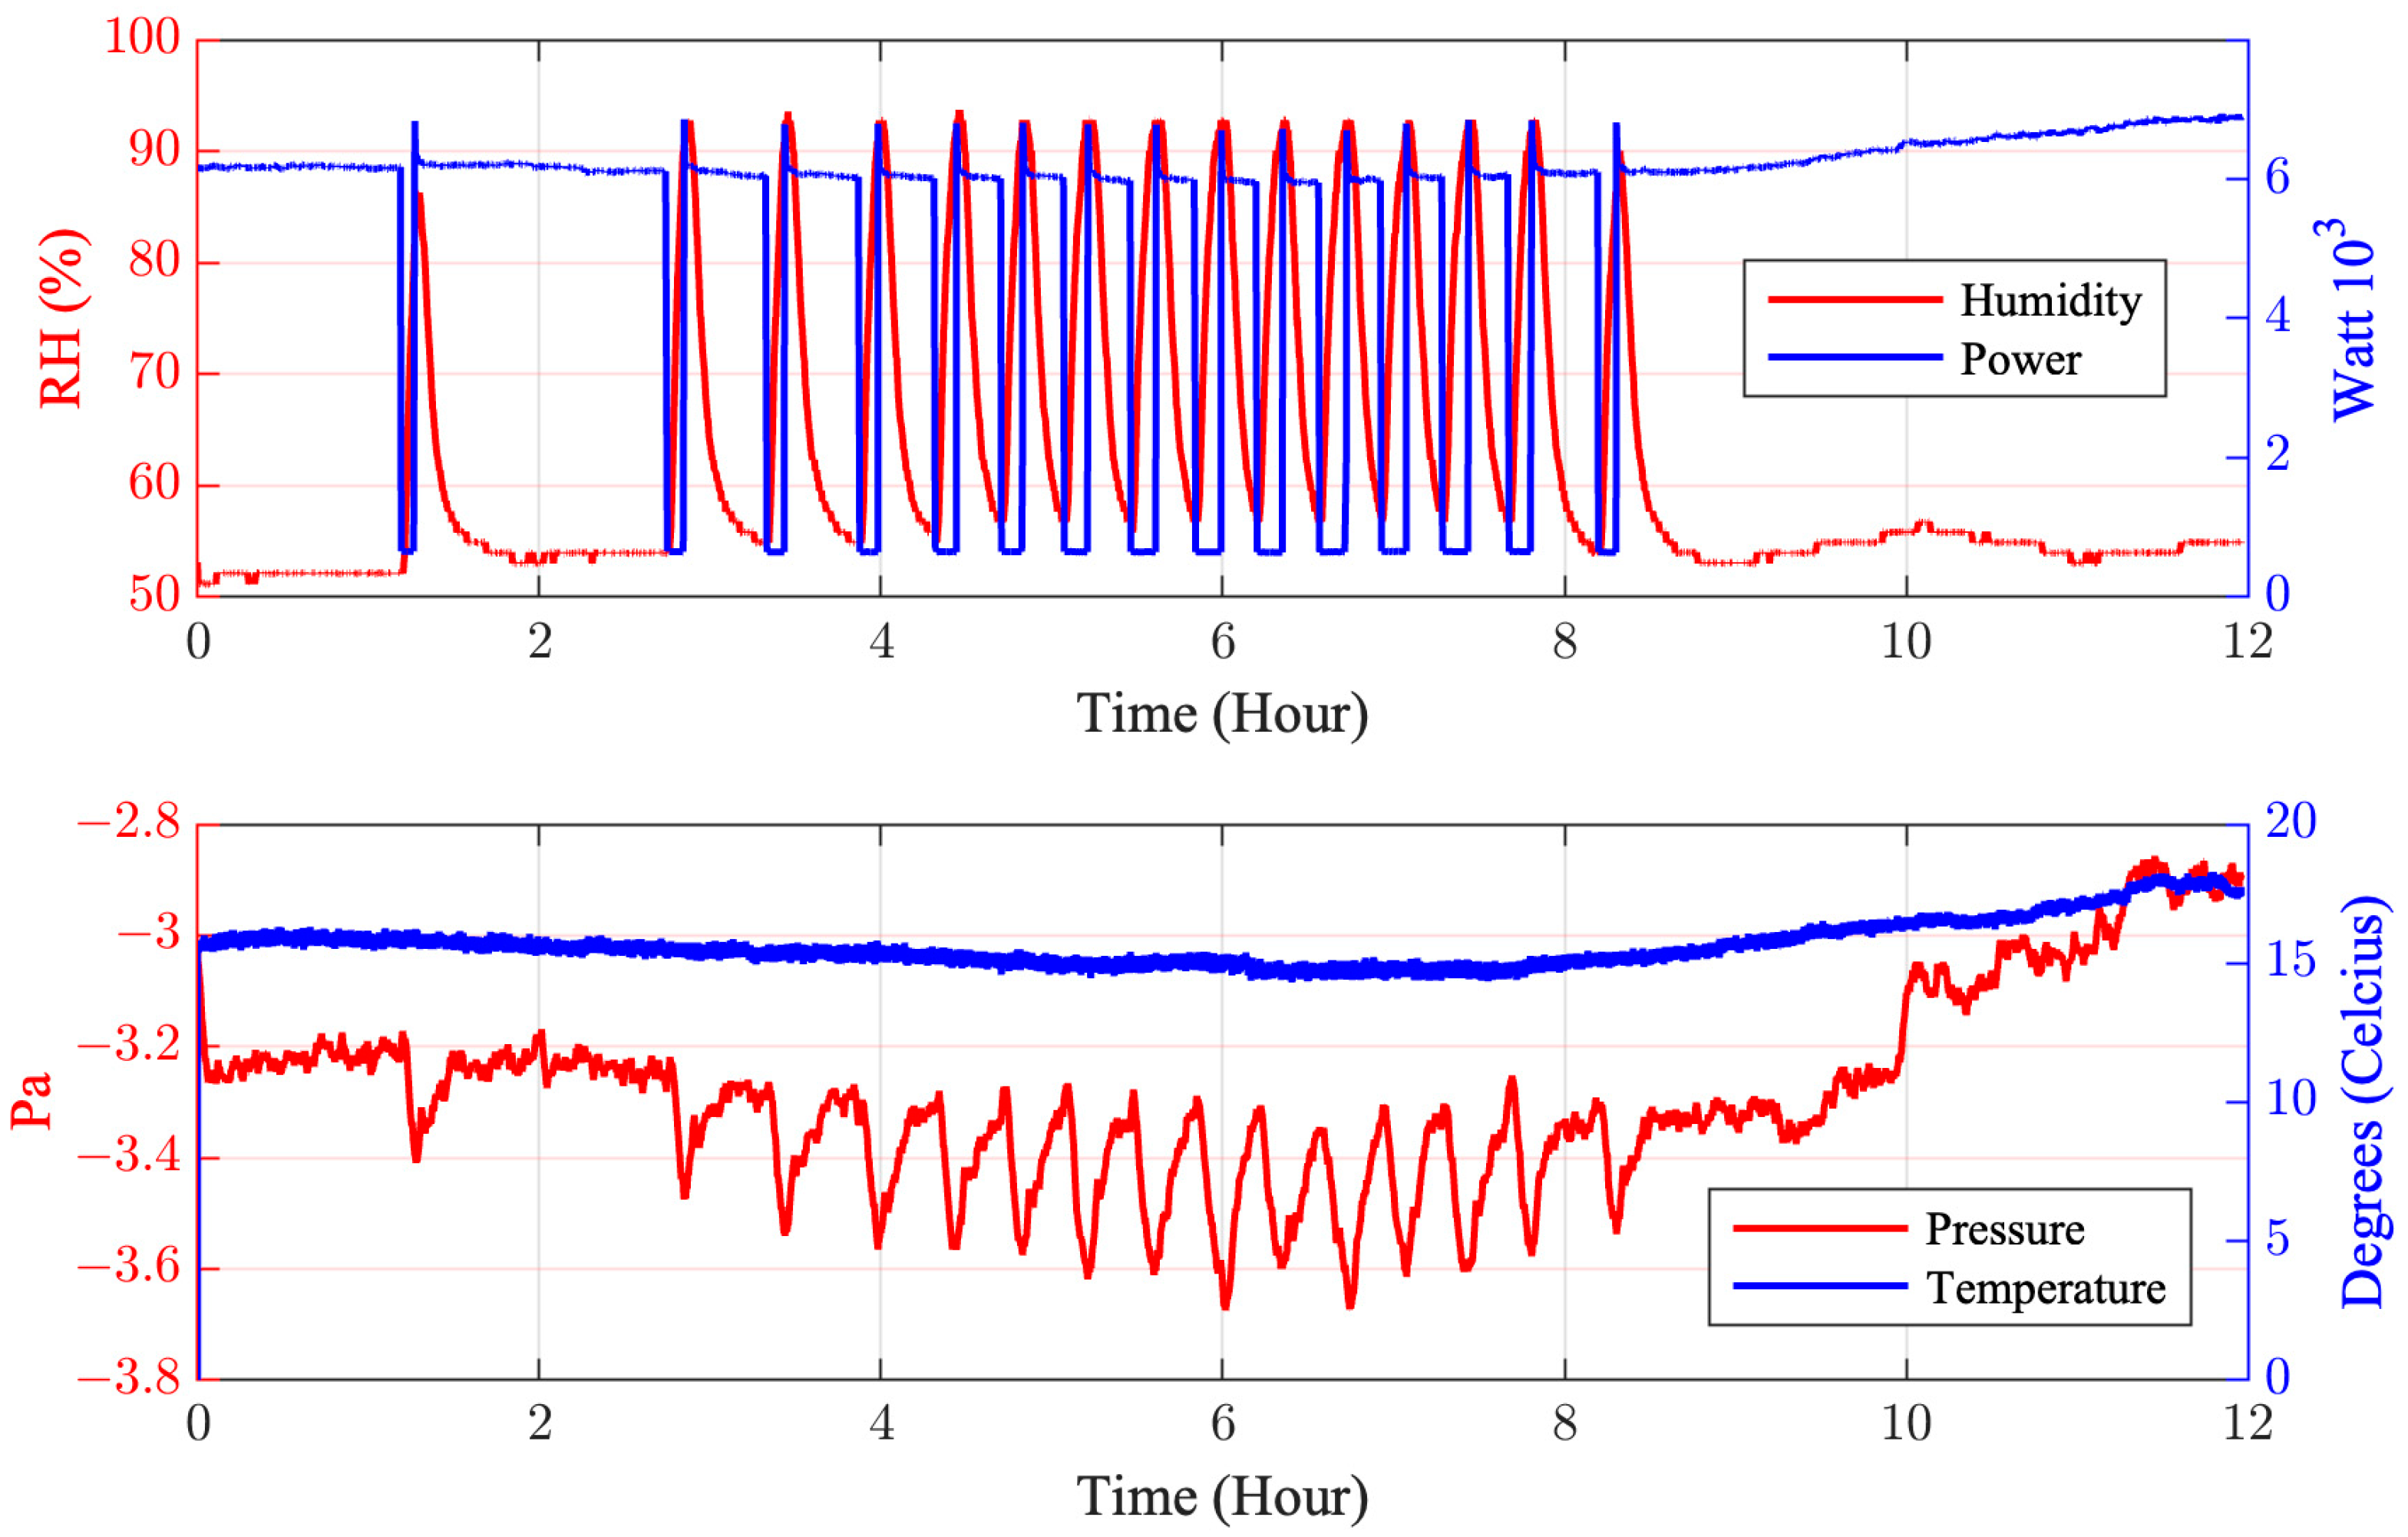
3.1. The Comparison of Control Strategy

The comparison of pressure in the patient room during the operation is shown in Figure 9. At the manual control, the exhaust generator was activated by a relay. The sudden connection of electricity, with a pulse form of load direct to the maximum, led to the fluctuation of the pressure.
The same trend could also be seen in the power graph as depicted in Figure 9. The fluctuation was 70% higher than the continuous load. The improvement of the control strategy from manual to computer-based successfully overcame the fluctuation. Without fluctuation, the electrical load would have been lower. Since the electrical load was the parameter to calculate the circuit breaker size to protect the HVA overcurrent, the lower electrical load led to the smaller circuit breaker size. According to the comparison shown in Figure 9, the PID control strategy was chosen in this research for the next experiment due to its advantage.

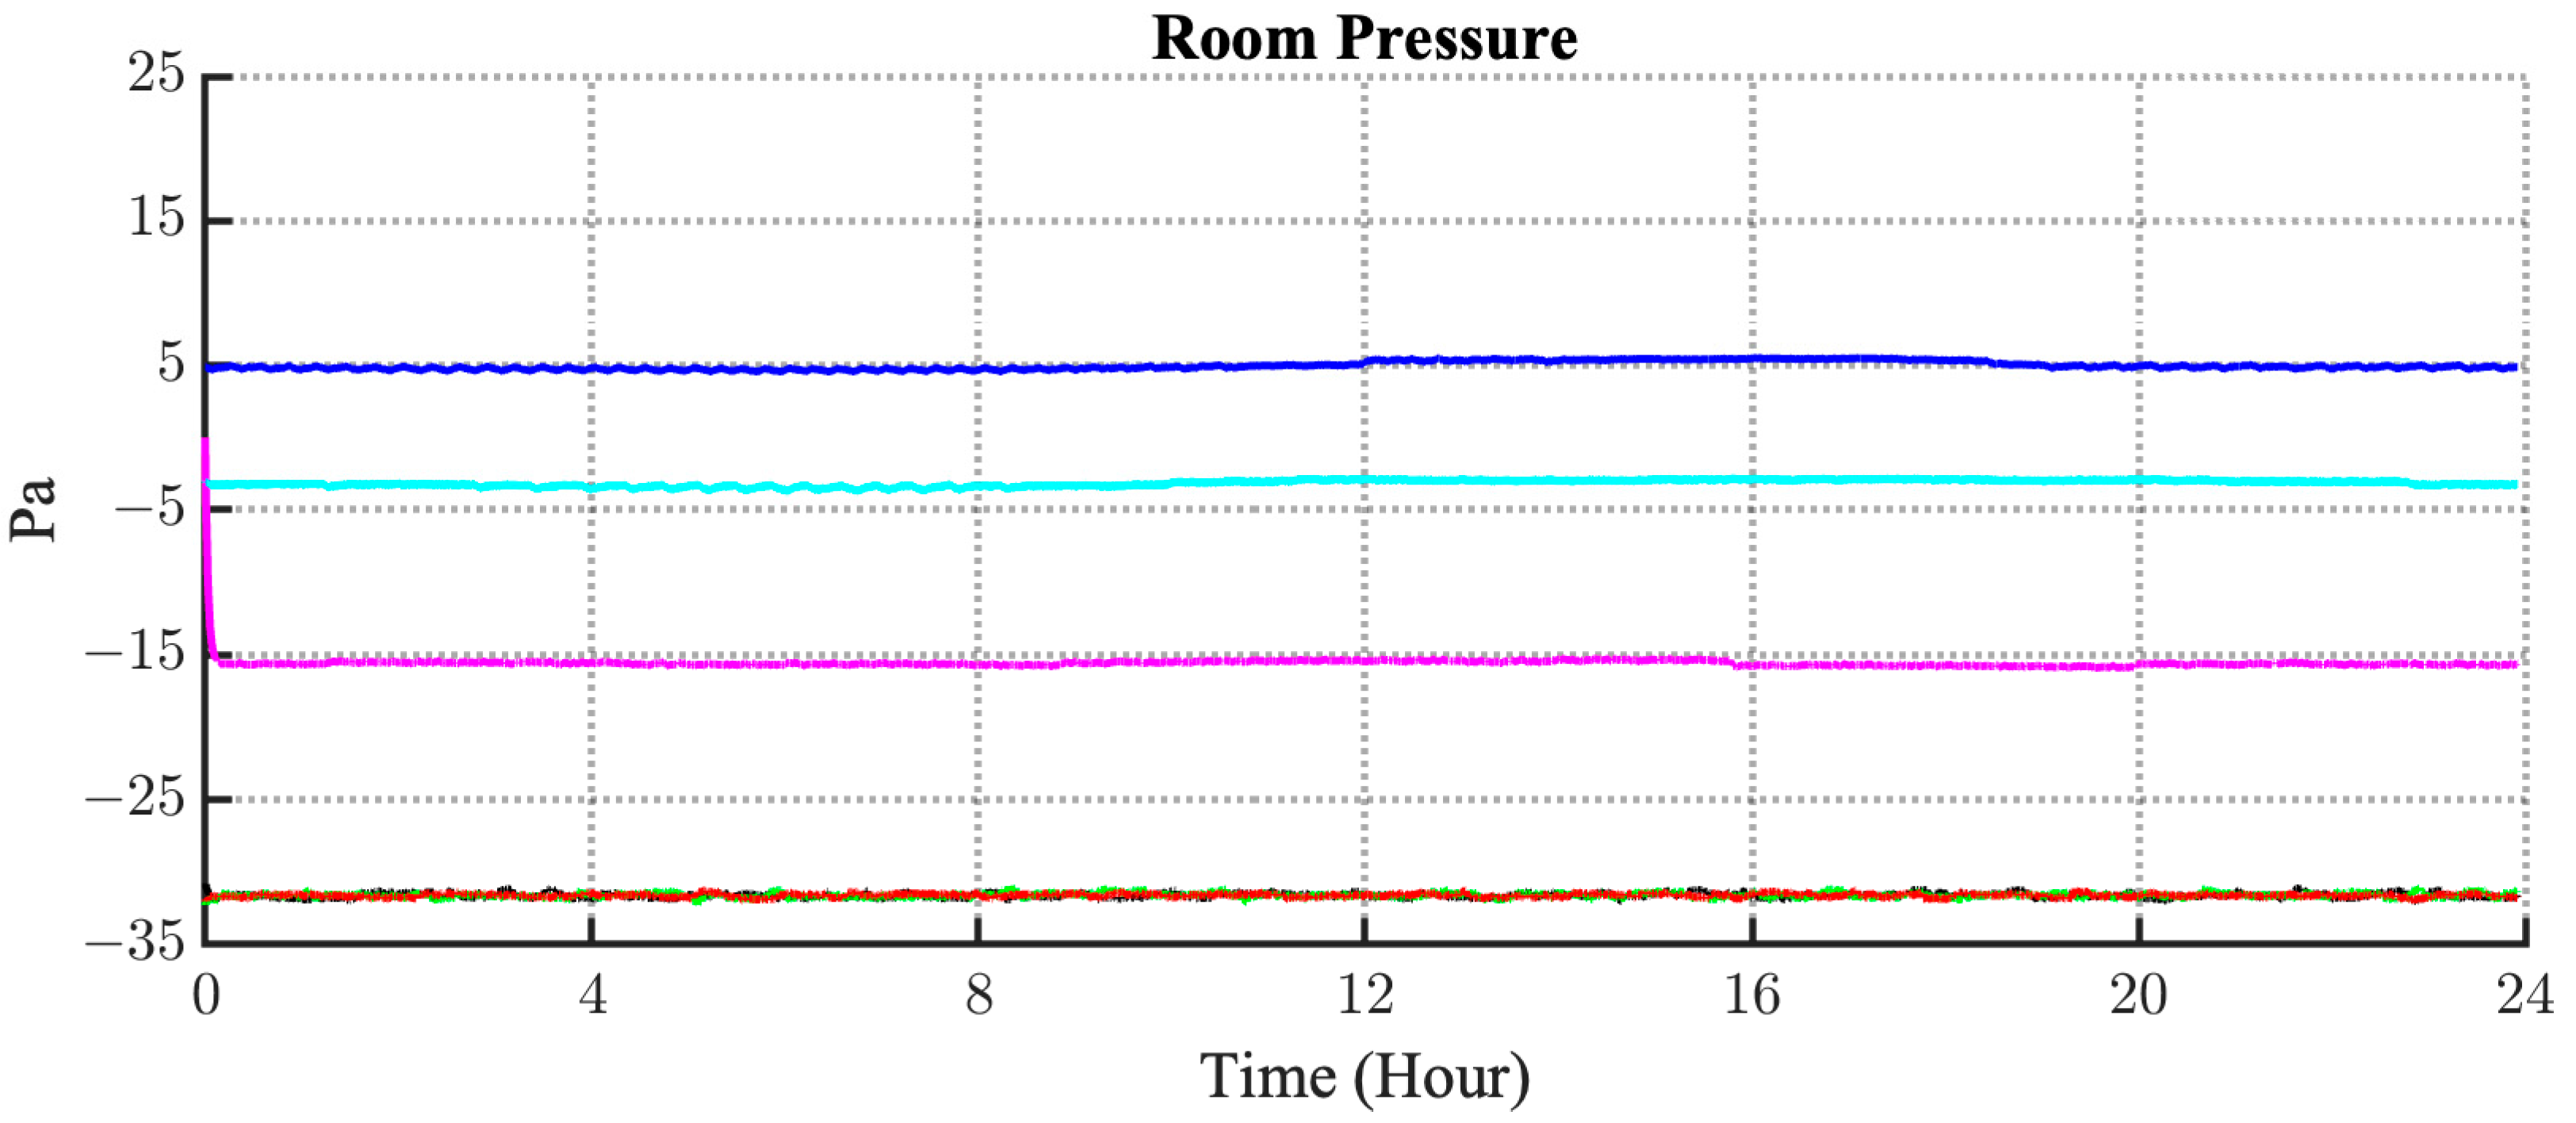
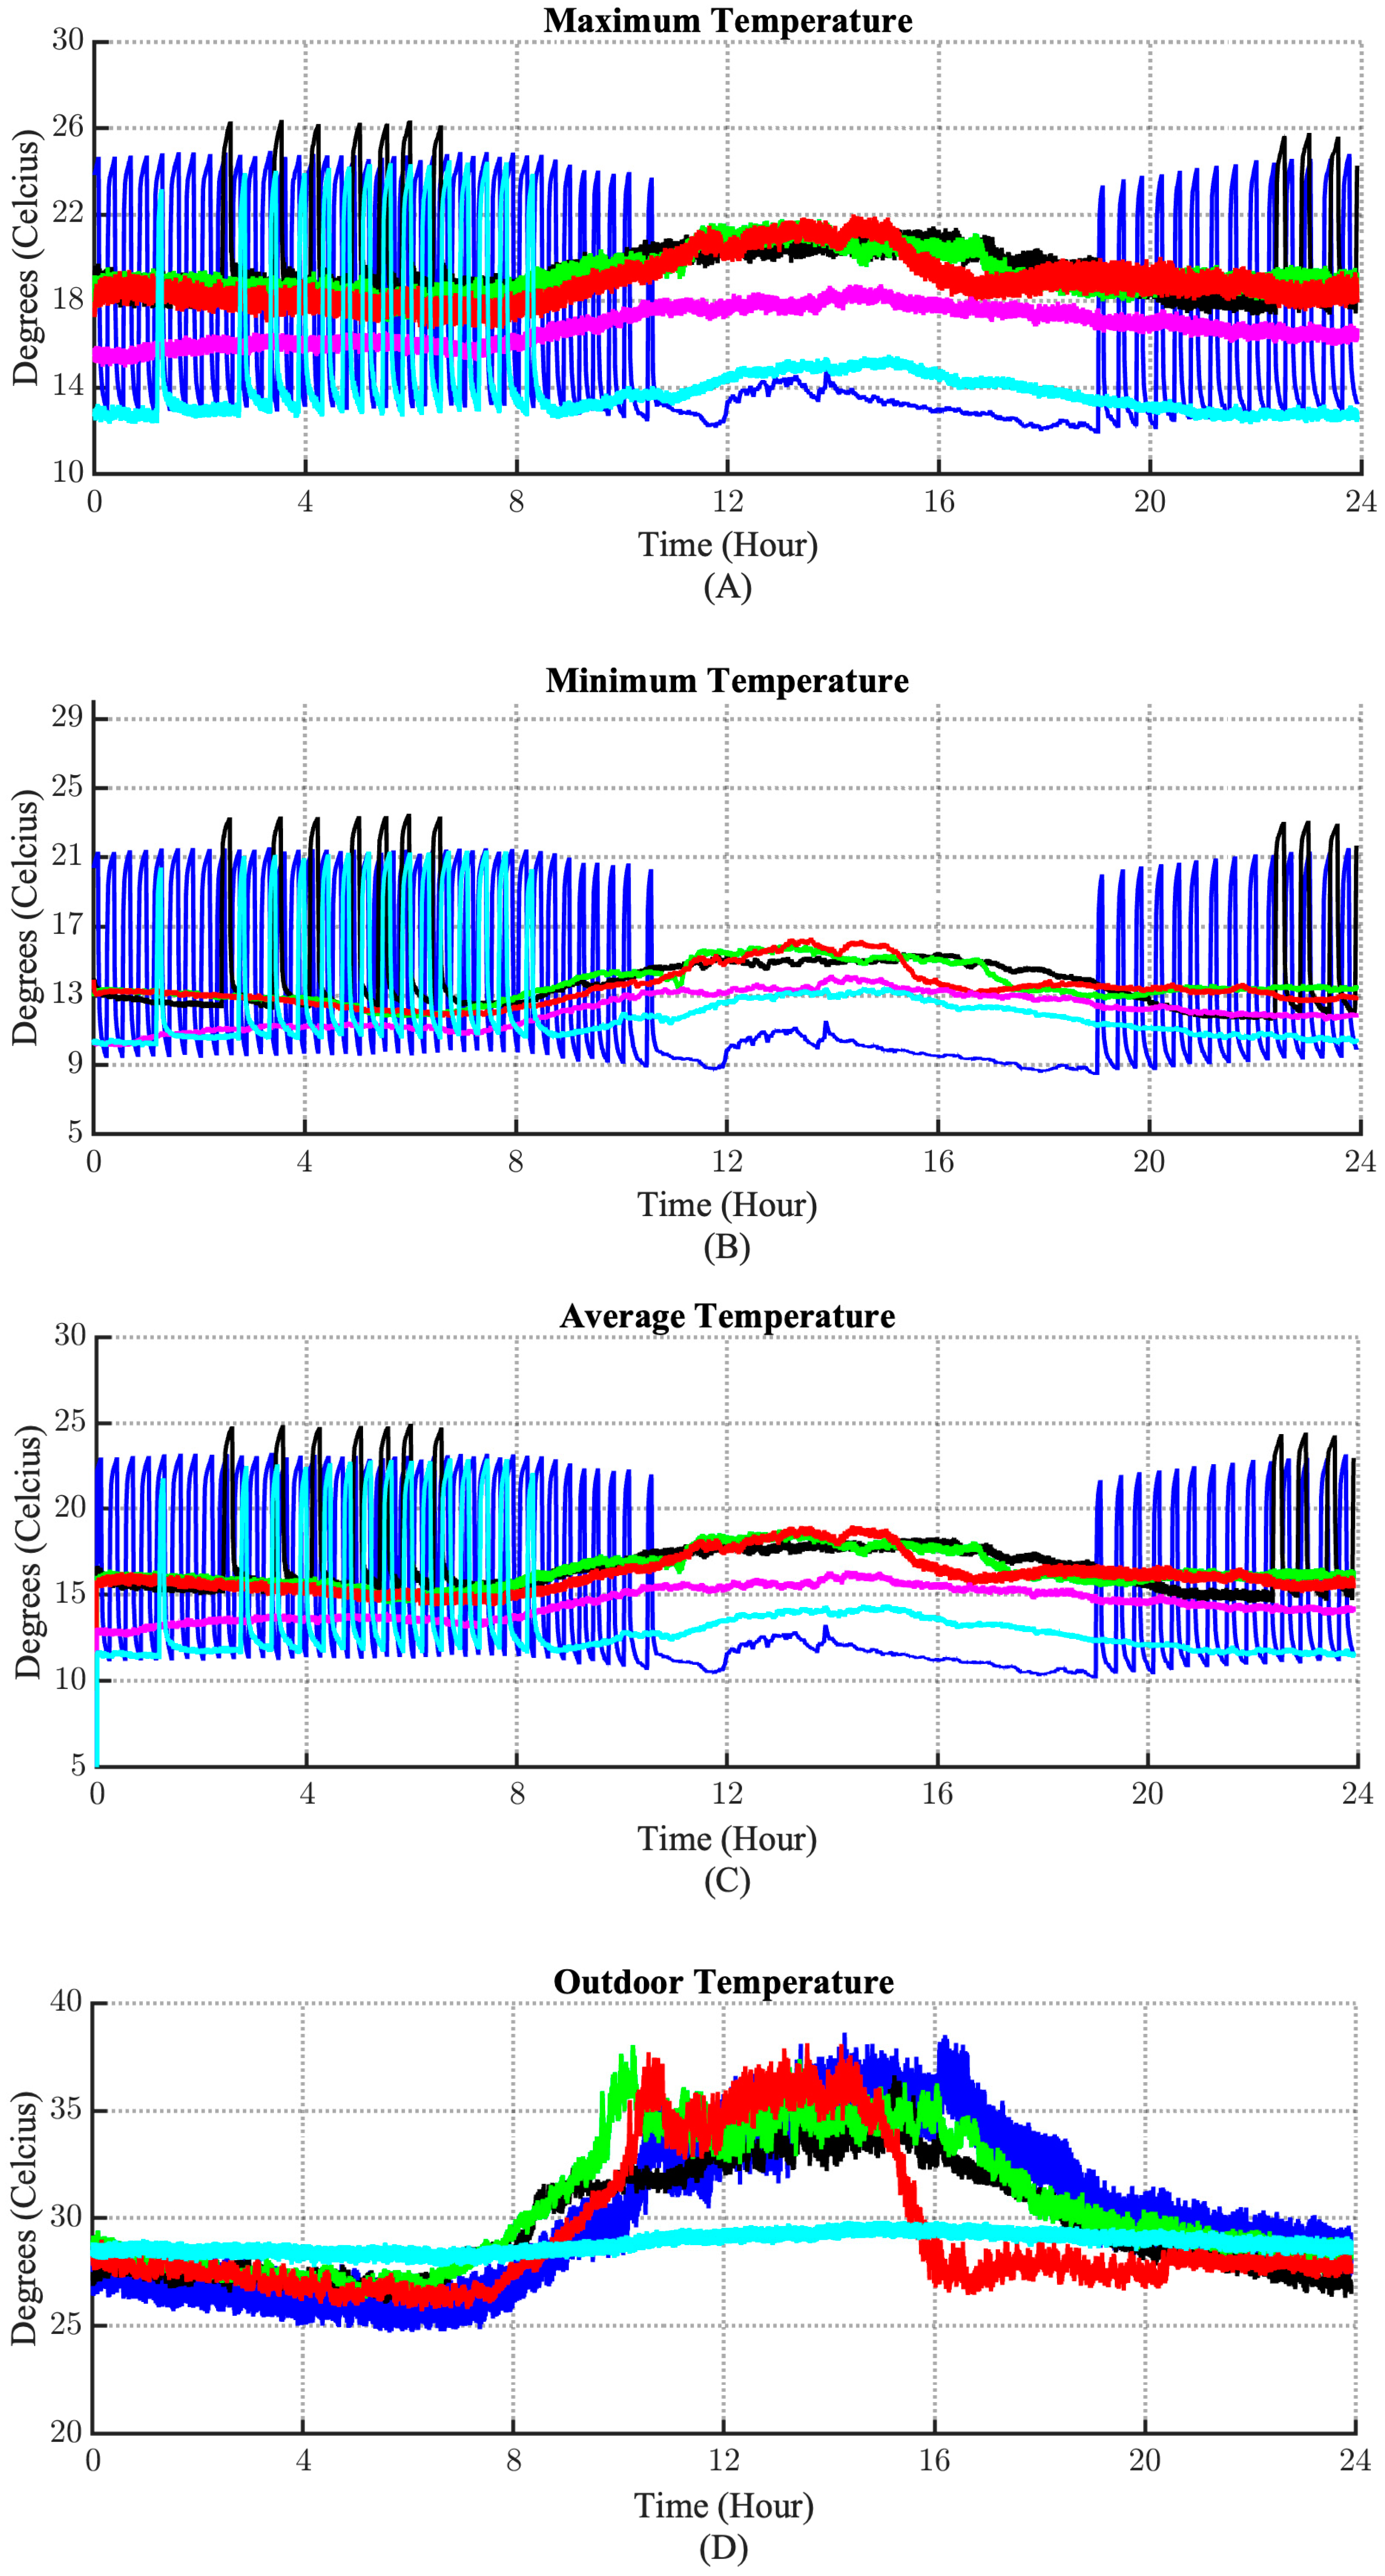
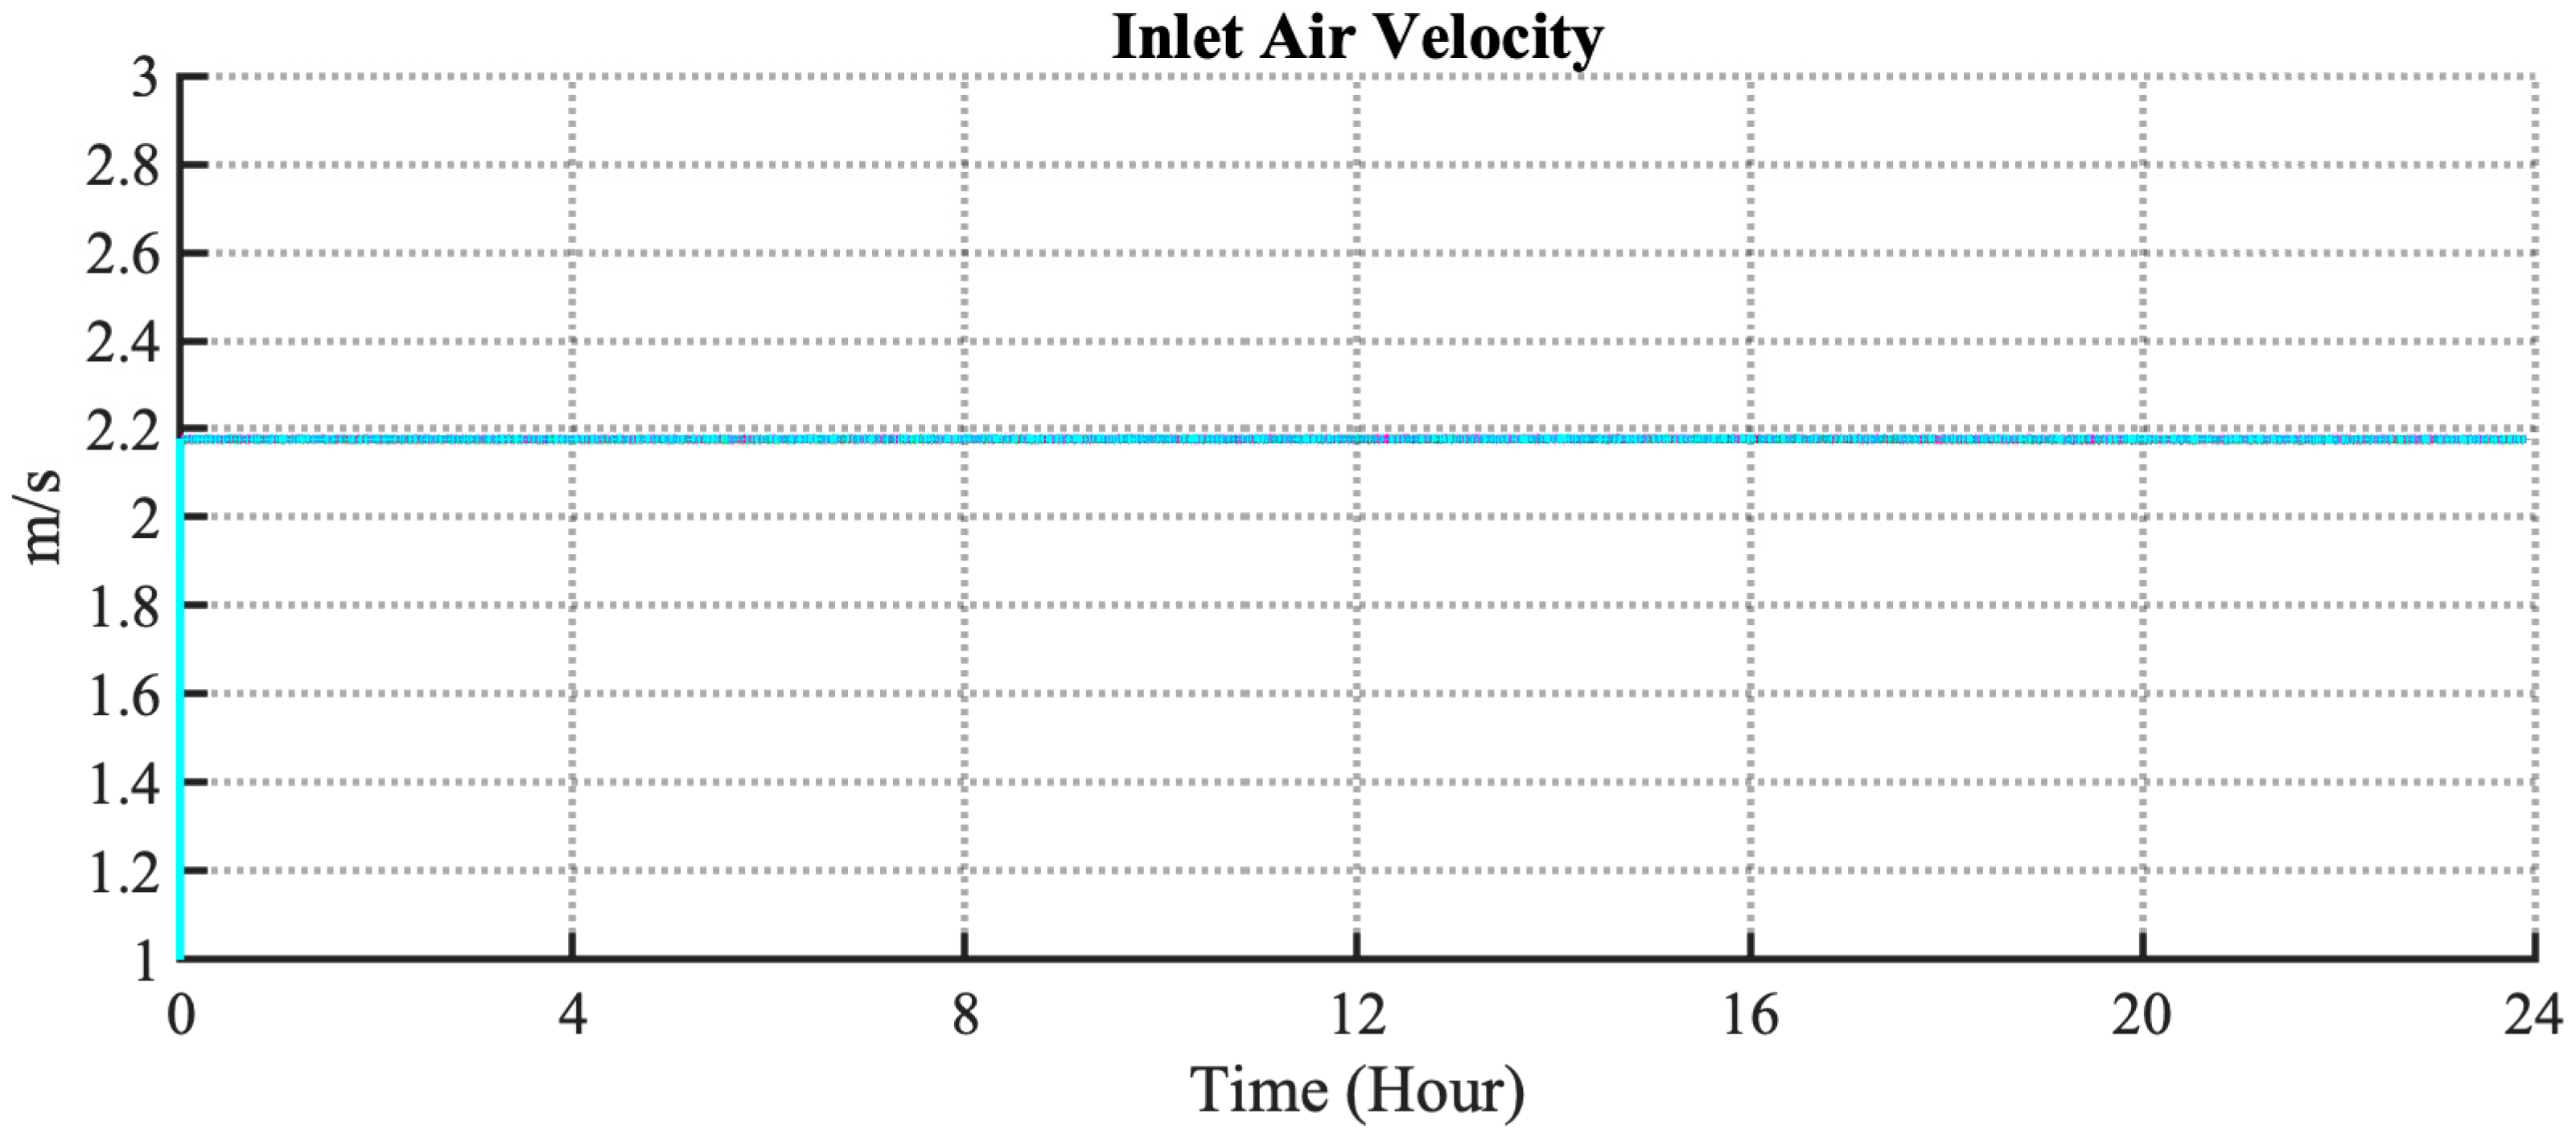
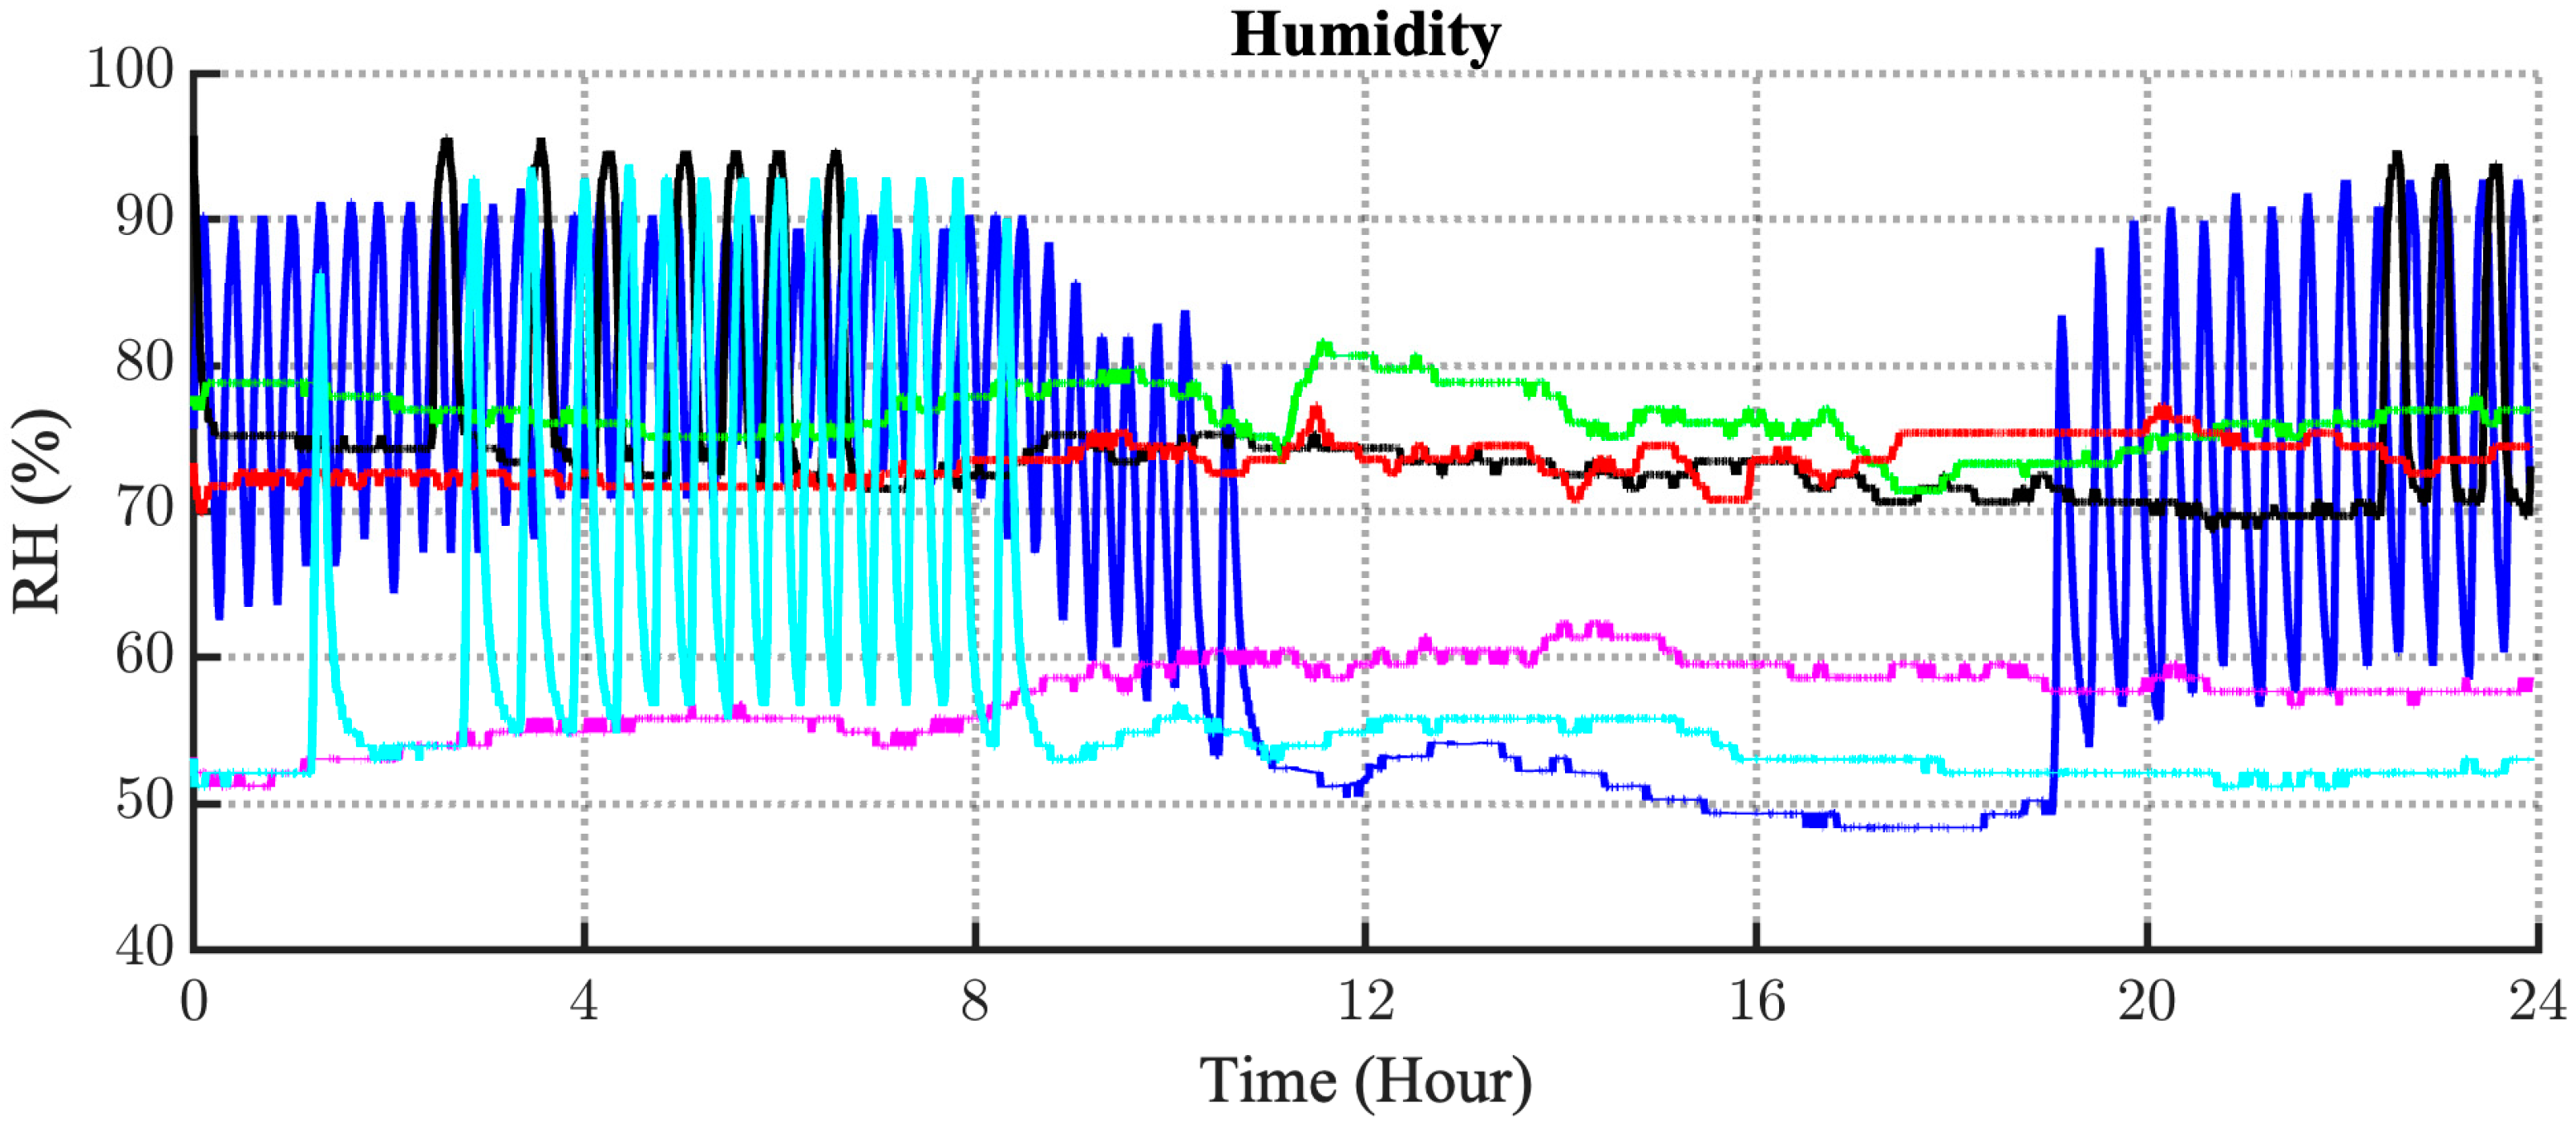
3.2. Performance Measurement of the Isolation Room

The performance of the patient isolation room is presented in this subsection. The legend of Figure 10 is valid for Figure 11, Figure 12, Figure 13 and Figure 14. The abscissae of Figure 10, Figure 11, Figure 12, Figure 13, Figure 14 and Figure 15 mention the time from 00.00 midnight to 23.55:14 in 24 hours’ time format with a sampling time of 10 ms.
The computer-based control was applied to maintain the pressure in the isolation room under different scenarios, except scenario one. In scenario one, the AC system was activated with the auto fan setting while the exhaust including the controller was deactivated. As the output, the pressure differential in the experimental room was positive as shown in Figure 10. It can be seen in Figure 1, that the room pressure was not perfectly constant during the experiment. In the rest scenario, the whole HVAC system including the controller was activated. During the experiment, the control system managed the pressure to the setpoint. Similar with scenario one, slight deviations in the pressure differential were also visible. Several factors outside the controlled parameters could be reasons for the deviation from the desired setpoint, such as voltage fluctuation, AC performance, and measurement instrument deviations.
The maximum, minimum, and average temperatures among all the temperature measurements in the diffuser, and the outdoor temperature are shown in Figure 11. When the outside temperature increased, the AC compressor remained active.
Even the temperature setpoint of the air conditioning was adjusted to comply with the recommendation in guideline [6] however, the supply air temperature to the isolation room was outside the range. Some other aspects were possibly reasons for supply air temperature deviation, for instance in [21] where the thermocouple was mentioned as a reason. To ensure the supply air temperature within the desired range, an additional control strategy was necessary [5,6].
The temperature of supply air was relatively constant when the AC compressor was active (S2 and S5) and fluctuated in the condition when the AC compressor was deactivated, as depicted in Figure 12.
Figure 12 shows the total energy consumption during the experiment for all scenarios. The accumulations presented in numeric are given in Table 3. The activation of the NPG increased the energy consumption by between 36.27 and 50.07%.
The AC fan speed was not measured in this research. Alternatively, a pitot tube was installed after the AC fan to measure the inlet air velocity. Figure 13 shows the inlet air velocity, which was constant for all scenarios. It could be assumed that the fan speed was constant during experiments for all scenarios.
The supply flow rate could be calculated by the multiplication of air velocity with the ducting sectional area. In this case for the air velocity of 2.17 m/s, then the computed air flow is 828 CFM which was slightly below the recommendation of 850 CFM [6].
The sensor to measure energy consumption was installed at the power supply cable for the HVAC system. Meanwhile, the HVAC system consisted of an air conditioning system and a NPG. For that reason, these measurement data in Figure 12 show the total energy consumption for the HVAC system. The investigation of the energy consumption for the difference pressure differential could be performed with this sensor setup if the AC system was working in the same condition. In other words, the AC compressor was always active and used the same fan speed to ensure the energy consumption from the AC compressor was almost the same for S2 to S4.
If that condition was satisfied, comparison of energy consumption between different scenarios showed the influence of the pressure differential. The fan speed was assumed to be constant according to Figure 12, while the activation of the AC compressor could be obtained with measurement data interpretation, for example scenario one/S1 in Figure 12. When the compressor was deactivated, the power dropped significantly. The power was fluctuated when the compressor reactivated. The continuous power showed that the AC compressor was operational.
A two-step filtering of S1 data in Figure 12 could simulate the condition where the AC compressor was always active. In the first step, the fluctuation above the continuous load was removed by moving the mean filter [22], which was then followed by moving the maximum filter [23]. The comparison of S1 data before and after filtering showed good agreement as depicted in Figure 12.
The kWh after filtering was slightly different for all scenarios. There was no strong correlation between the difference pressure differential and the energy consumption, where the maximum and minimum were 1.36% and 0.35%, respectively. Similarly, the number of EA openings did not influence the energy consumption.
These humidity measurement data during the experiment are shown in Figure 14. To have a better overview, a magnification of humidity data of S6 in comparison with power, pressure, and temperature is depicted in Figure 15.
It can be seen in Figure 14 and Figure 15, that the humidity was influenced strongly by the activation of the AC compressor. When the AC compressor was deactivated, the humidity increased up to 90%. Soon after the AC compressor was activated, the humidity decreased to approximately 55%. Considering the technical guidelines in [5,6] where the humidity was recommended at 60%, additional air treatment was necessary to keep the humidity near to the recommendation.

4. Conclusions

A real case of a patient isolation room, including its support system, was presented in this study. The currently used manual control system led to pressure and power fluctuations. An improvement in the control system, through applying PID control combined with the proper hardware, successfully eliminated the fluctuation of pressure and power.
The NPG and the control system kept the pressure differential in the patient isolation room within the desired range. The selected AC compressor had enough capacity to supply fresh air and to reduce air temperature in the isolation room. However, an additional system was necessary to ensure the temperature was within the recommendation range. The pretreatment of supply air was strongly recommended to reduce the humidity within the permitted range.
The total energy consumption for ca. 24 h was 105.29 kWh when the NPG deactivated. The maximum and minimum difference in energy consumption under difference pressure differential were 1.36% and 0.35%, respectively. There was no strong correlation between the difference pressure differential and the energy consumption.
To reduce energy use, equipment which absorbs the heat from the exhaust air for precooling the supply air would be a promising solution.

Author Contributions

Conceptualization, H.H. (Harapan Harapan); methodology, H.H. (Harapan Harapan), S.R., and T.M.I.M.; software, R.K., I.I., and S.E.S.; data curation, R.K., I.I., and F.S.S.; formal analysis, H.H. (Harapan Harapan), S.R., and T.M.I.M.; validation, H.H. (Hamdani Hamdani), R.K., I.I., and M.S.; resources, F.S.S., S.R., and M.S.; writing—original draft preparation; H.H. (Harapan Harapan); writing—review and editing, H.H. (Harapan Harapan), H.H. (Hamdani Hamdani), R.K., R.R., and I.I. All authors have read and agreed to the published version of the manuscript.

Funding

This research was funded by Lembaga Pengelola Dana Pendidikan (LPDP), managed by Indonesian Science Fund (ISF): RISPRO/KI/B1/TKL/5/15448/2020; Syiah Kuala University: 370/UN11.2.1/PT.01.03/PNBP/2021).

Institutional Review Board Statement

Not applicable.

Informed Consent Statement

Not applicable.

Data Availability Statement

Not applicable.

Conflicts of Interest

The authors declare no conflict of interest.

References

  1. Qian, H.; Zheng, X. Ventilation control for airborne transmission of human exhaled bio-aerosols in buildings. J. Thorac. Dis. 2018, 10, S2295–S2304. [Google Scholar] [CrossRef] [PubMed]
  2. Nourmohammadi, M.; Mirzaei, R.; Taban, E.; Yari, S. Effect of Ventilation System on Spread and Control of Infections (COVID-19) in Indoor Environments: Based on Current Studies. Asian Pac. J. Environ. Cancer 2020, 3, 55–58. [Google Scholar] [CrossRef]
  3. Heating, Ventilation and Air-Conditioning Systems in the Context of COVID-19: First Update. Available online: https://www.ecdc.europa.eu/en/publications-data/heating-ventilation-air-conditioning-systems-covid-19 (accessed on 3 August 2022).
  4. Santos, A.F.; Gaspar, P.D.; Hamandosh, A.; de Aguiar, E.B.; Filho, A.C.G.; de Souza, H.J.L. Best Practices on HVAC Design to Minimize the Risk of COVID-19 Infection within Indoor Environments. Braz. Arch. Biol. Technol. 2020, 63, 1–11. [Google Scholar] [CrossRef]
  5. Korea, S.; Byungseon, S.; Kim, P.D. Improved Ventilation System for Removal of Airborne Contamination in Airborne Infectious Isolation Rooms. 2019. Available online: www.ashrae.org (accessed on 3 August 2022).
  6. Kementerian kesehatan Republik Indonesia, Panduan Teknis Pelayanan Rumah Sakit Pada Masa Adaptasi. Kebiasaan Baru Pustaka, Badan Mutu Pelayanan Kesehatan. Available online: http://badanmutu.or.id/pustaka/ (accessed on 3 August 2022).
  7. Tahpi, Isolation Rooms. International Health Facility Guidelines. Available online: https://www.healthfacilityguidelines.com/GuidelineIndex/Index/Infection-Control (accessed on 3 August 2022).
  8. Weng, C.L.; Kau, L.J. Planning and design of a full-outer-air-intake natural air-conditioning system for medical negative pressure isolation wards. J. Healthc. Eng. 2021, 2021, 8872167. [Google Scholar] [CrossRef] [PubMed]
  9. Saran, S.; Gurjar, M. Baronia, A.; Sivapurapu, V.; Ghosh, P.S.; Raju, G.M.; Maurya, I. Heating, ventilation and air conditioning (HVAC) in intensive care unit. Crit. Care 2020, 24, 194. [Google Scholar] [CrossRef] [PubMed]
  10. Zheng, W.; Hu, J.; Wang, Z.; Li, J.; Fu, Z.; Li, H.; Jurasz, J.; Chou, S.K.; Yan, J. COVID-19 Impact on Operation and Energy Consumption of Heating, Ventilation and Air-Conditioning (HVAC) Systems. Adv. Appl. Energy 2021, 3, 100040. [Google Scholar] [CrossRef]
  11. Sporr, A.; Zucker, G.; Hofmann, R. Automated HVAC Control Creation Based on Building Information Modeling (BIM): Ventilation System. IEEE Access 2019, 7, 74747–74758. [Google Scholar] [CrossRef]
  12. Anuntasethakul, C.; Banjerdpongchai, D. Design of Supervisory Model Predictive Control for Building HVAC System with Consideration of Peak-Load Shaving and Thermal Comfort. IEEE Access 2021, 9, 41066–41081. [Google Scholar] [CrossRef]
  13. Jacob, S.; Yadav, S.S.; Sikarwar, B.S. Design and simulation of isolation room for a hospital. In Lecture Notes in Mechanical Engineering; Springer: Singapore, 2019; pp. 75–93. [Google Scholar] [CrossRef]
  14. Khankari, K. Technical Feature Patient Room HVAC. 2016. Available online: www.ashrae.org (accessed on 3 August 2022).
  15. Cho, J. Investigation on the contaminant distribution with improved ventilation system in hospital isolation rooms: Effect of supply and exhaust air diffuser configurations. Appl. Therm. Eng. 2019, 148, 208–218. [Google Scholar] [CrossRef] [PubMed]
  16. Wang, F.; Chaerasari, C.; Rakshit, D.; Permana, I. Kusnandar, Performance Improvement of a Negative-Pressurized Isolation Room for Infection Control. Healthcare 2021, 9, 1081. [Google Scholar] [CrossRef] [PubMed]
  17. Bhattacharya, A.; Ghahramani, A.; Mousavi, E. The effect of door opening on air-mixing in a positively pressurized room: Implications for operating room air management during the COVID outbreak. J. Build. Eng. 2021, 44, 102900. [Google Scholar] [CrossRef]
  18. Ezzeddine, W.; Schutz, J.; Rezg, N. Pitot sensor air flow measurement accuracy: Causal modelling and failure risk analysis. Flow Meas. Instrum. 2019, 65, 7–15. [Google Scholar] [CrossRef]
  19. Escobar, L.M.; Aguilar, J.; Garces-Jimenez, A.; de Mesa, J.A.G.; Gomez-Pulido, J.M. Advanced fuzzy-logic-based context-driven control for HVAC management systems in buildings. IEEE Access 2020, 8, 16111–16126. [Google Scholar] [CrossRef]
  20. Tamburrano, P.; de Palma, P.; Plummer, A.R.; Distaso, E.; Amirante, R. Simulink Modelling for Simulating Intensive Care Mechanical Ventilators. E3S Web Conf. 2020, 197, 07007. [Google Scholar] [CrossRef]
  21. Khalid, W.; Zaki, S.A.; Rijal, H.B.; Yakub, F. Investigation of comfort temperature and thermal adaptation for patients and visitors in Malaysian hospitals. Energy Build 2019, 183, 484–499. [Google Scholar] [CrossRef]
  22. Moving Mean-MATLAB Movmean. Available online: https://www.mathworks.com/help/matlab/ref/movmean.html#d123e948000 (accessed on 25 August 2022).
  23. Moving Maximum-MATLAB Movmax. Available online: https://www.mathworks.com/help/matlab/ref/movmax.html#d123e947144 (accessed on 25 August 2022).
Figure 1. Illustration of the isolation room. 1 to 4 are the damper number.
Sustainability 14 11537 g001
Figure 2. Design of heating, ventilation, and air conditioning (HVAC) of the isolation room.
Sustainability 14 11537 g002
Figure 3. Experimental setup for control system testing.
Sustainability 14 11537 g003
Figure 4. Thermocouple arrangement on the supply air grill.
Sustainability 14 11537 g004
Figure 5. Pressure control schematic.
Sustainability 14 11537 g005
Figure 6. Flow chart of the air change per hour (ACH) and one flow mode.
Sustainability 14 11537 g006
Figure 7. The illustration of fresh air/one flow mode and circulation mode within the isolation room.
Sustainability 14 11537 g007
Figure 8. PID controller for negative pressure generator.
Sustainability 14 11537 g008
Figure 9. Comparison of pressure (A) and power (B) for manual and PID controls.
Sustainability 14 11537 g009
Figure 10. The comparison of patient room pressure during the experiment.
Sustainability 14 11537 g010
Figure 11. The maximum (A), minimum (B), and average (C) temperatures in the patient room for the difference pressure gradient and outdoor (D) temperature.
Sustainability 14 11537 g011
Figure 12. The comparison of power measurements (A) for different pressure differentials, during filtering of the power (B), and after filtering (C).
Sustainability 14 11537 g012
Figure 13. The comparison of air inlet velocity measurement for the difference pressure differential.
Sustainability 14 11537 g013
Figure 14. The comparison of humidity measurements for the difference pressure gradient.
Sustainability 14 11537 g014
Figure 15. The influence of AC compressor activation to the humidity, pressure, and temperature in the patient room.
Sustainability 14 11537 g015
Table 1. Pressure differential for an airborne infection isolation room (AIIR) to prevent airborne contamination according to the country [5].
Pressure DifferentialCountry
More than 2.5 PaUSA, Hongkong, South Korea
More than 5 PaUnited Kingdom, Norway
More than 15 PaAustralia
15 PaIndonesia
Table 2. Parameter setup of the HVAC system.
S1S2S3S4S5S6
Date (2022)18.0619.0620.0621.065.077.07
Regulated room pressure (Pa)Negative pressure regulator is not activated−30−15−3
AC temperature (°C)24 ± 2
AC fan speedAuto
Bed head exhaustOpenOpenClosedOpen
Bed foot exhaustClosedOpen
Damper 1, Damper 2, Damper 3, Damper 4Open
Table 3. Energy consumption in 24 h for the difference pressure gradient.
S1S2S3S4S5S6
kWh
(before filter)
105.29147.17157.99156.39158.02143.49
Difference (%)
(before filter)
Baseline39.7850.0548.5350.0736.27
kWh
(after filter)
156.41158.54156.96158.53154.86
Difference (%)
(after filter)
Not
applicable
Baseline1.360.351.350.99
Publisher’s Note: MDPI stays neutral with regard to jurisdictional claims in published maps and institutional affiliations.

