

Analysis of Ecosystem Protection and Sustainable Development Strategies—Evidence Based on the RWEQ Model on the Loess Plateau, China

 and
and
Abstract
:1. Introduction
2. Materials
2.1. Study Area
2.2. Data Sources
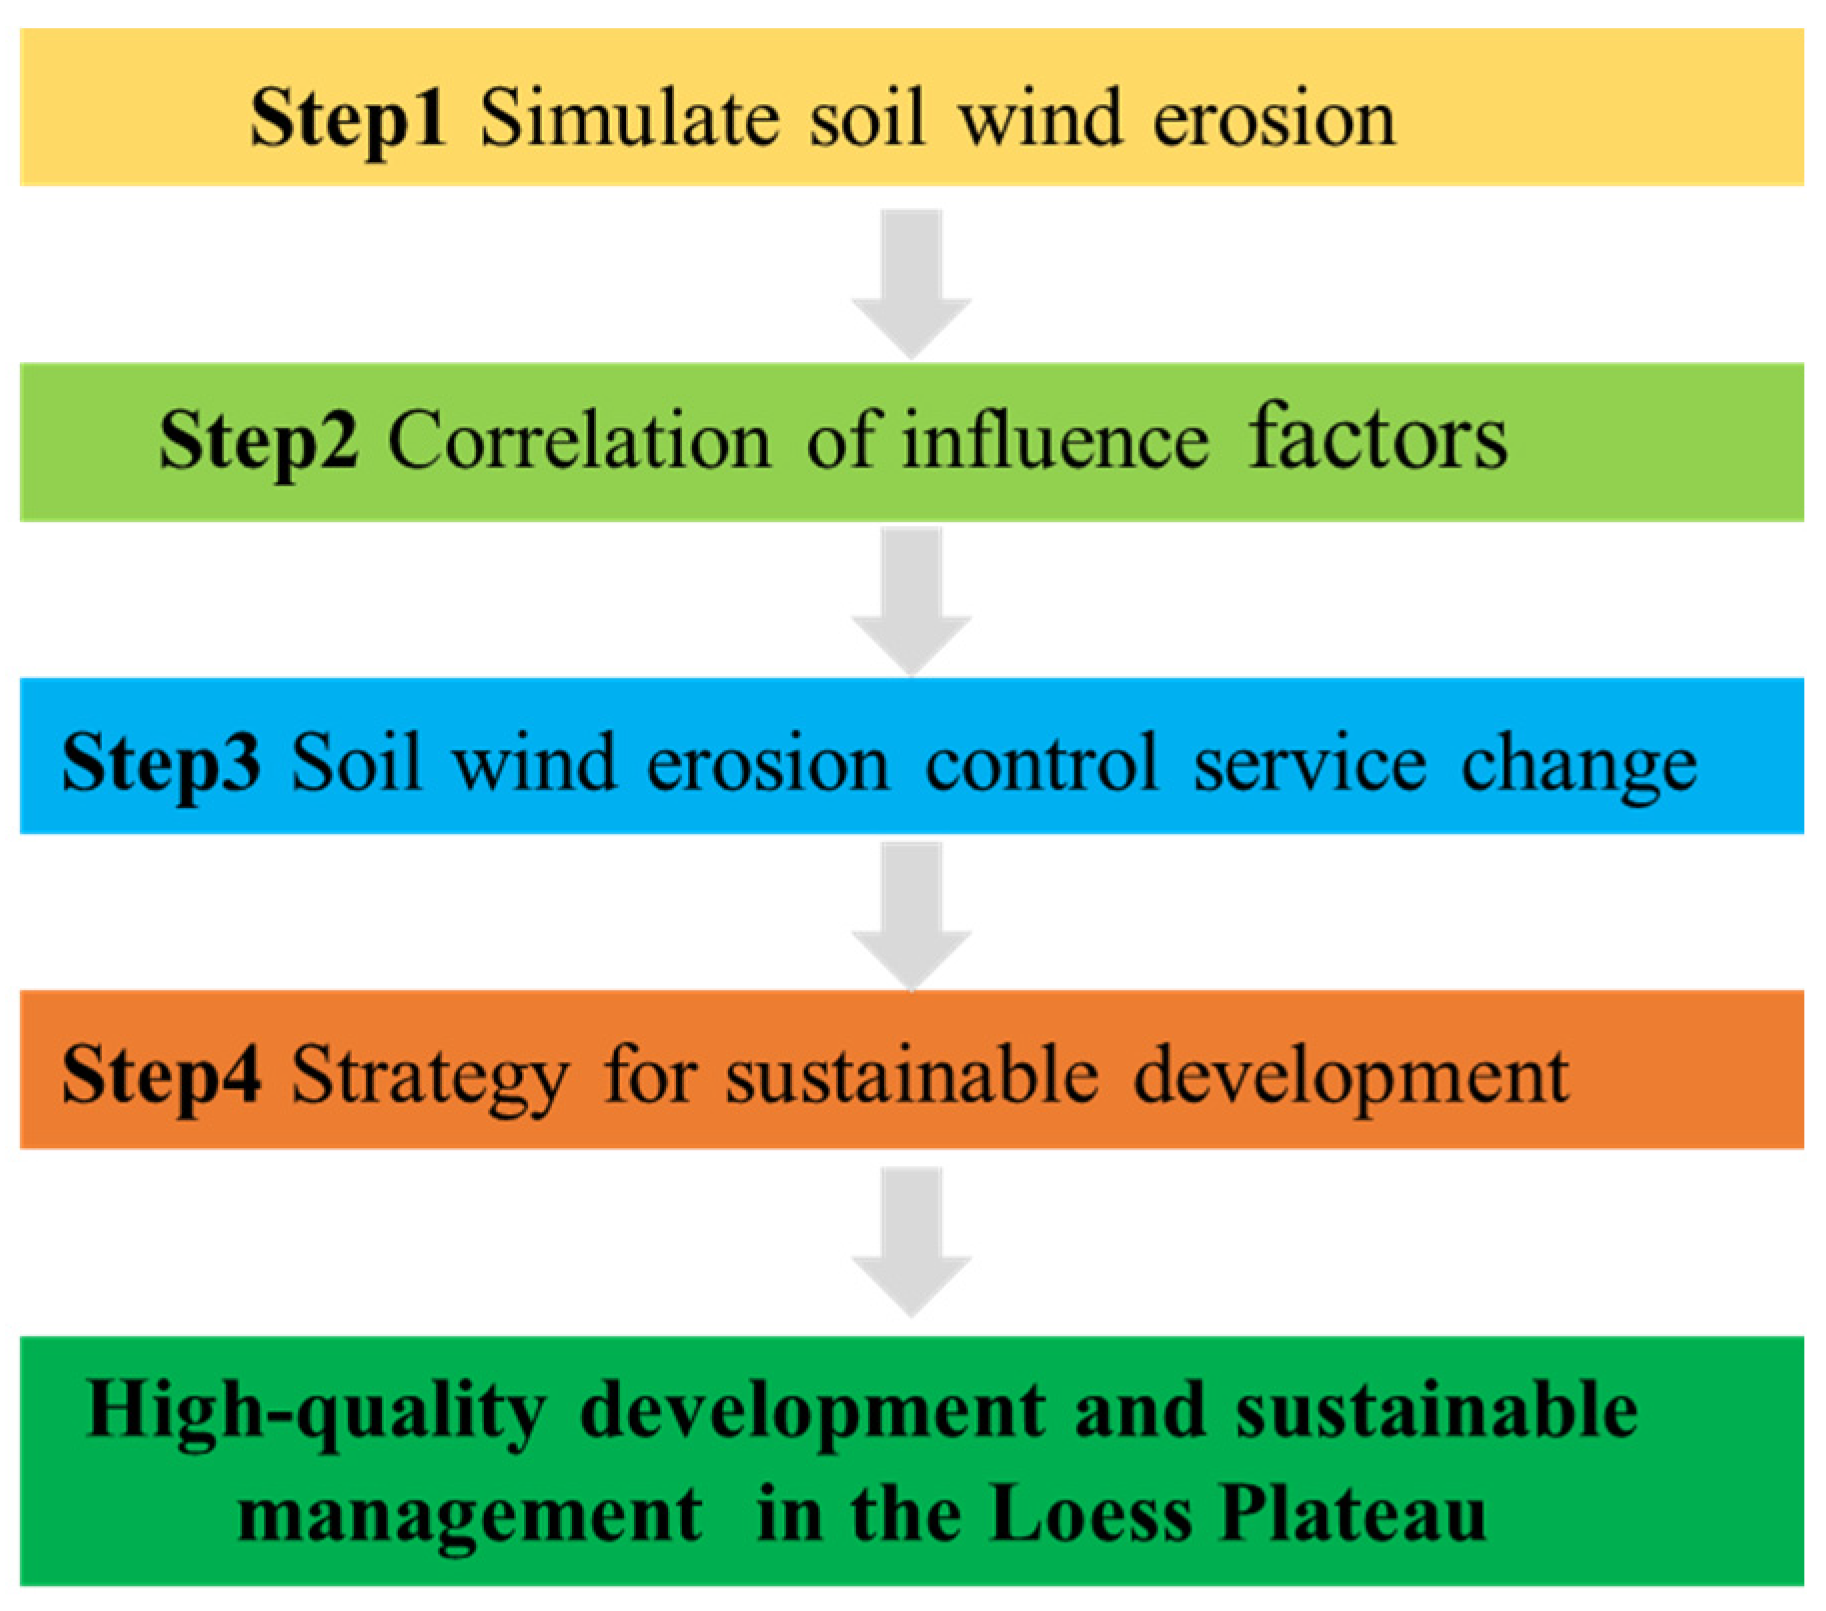
2.3. Methods
3. Results
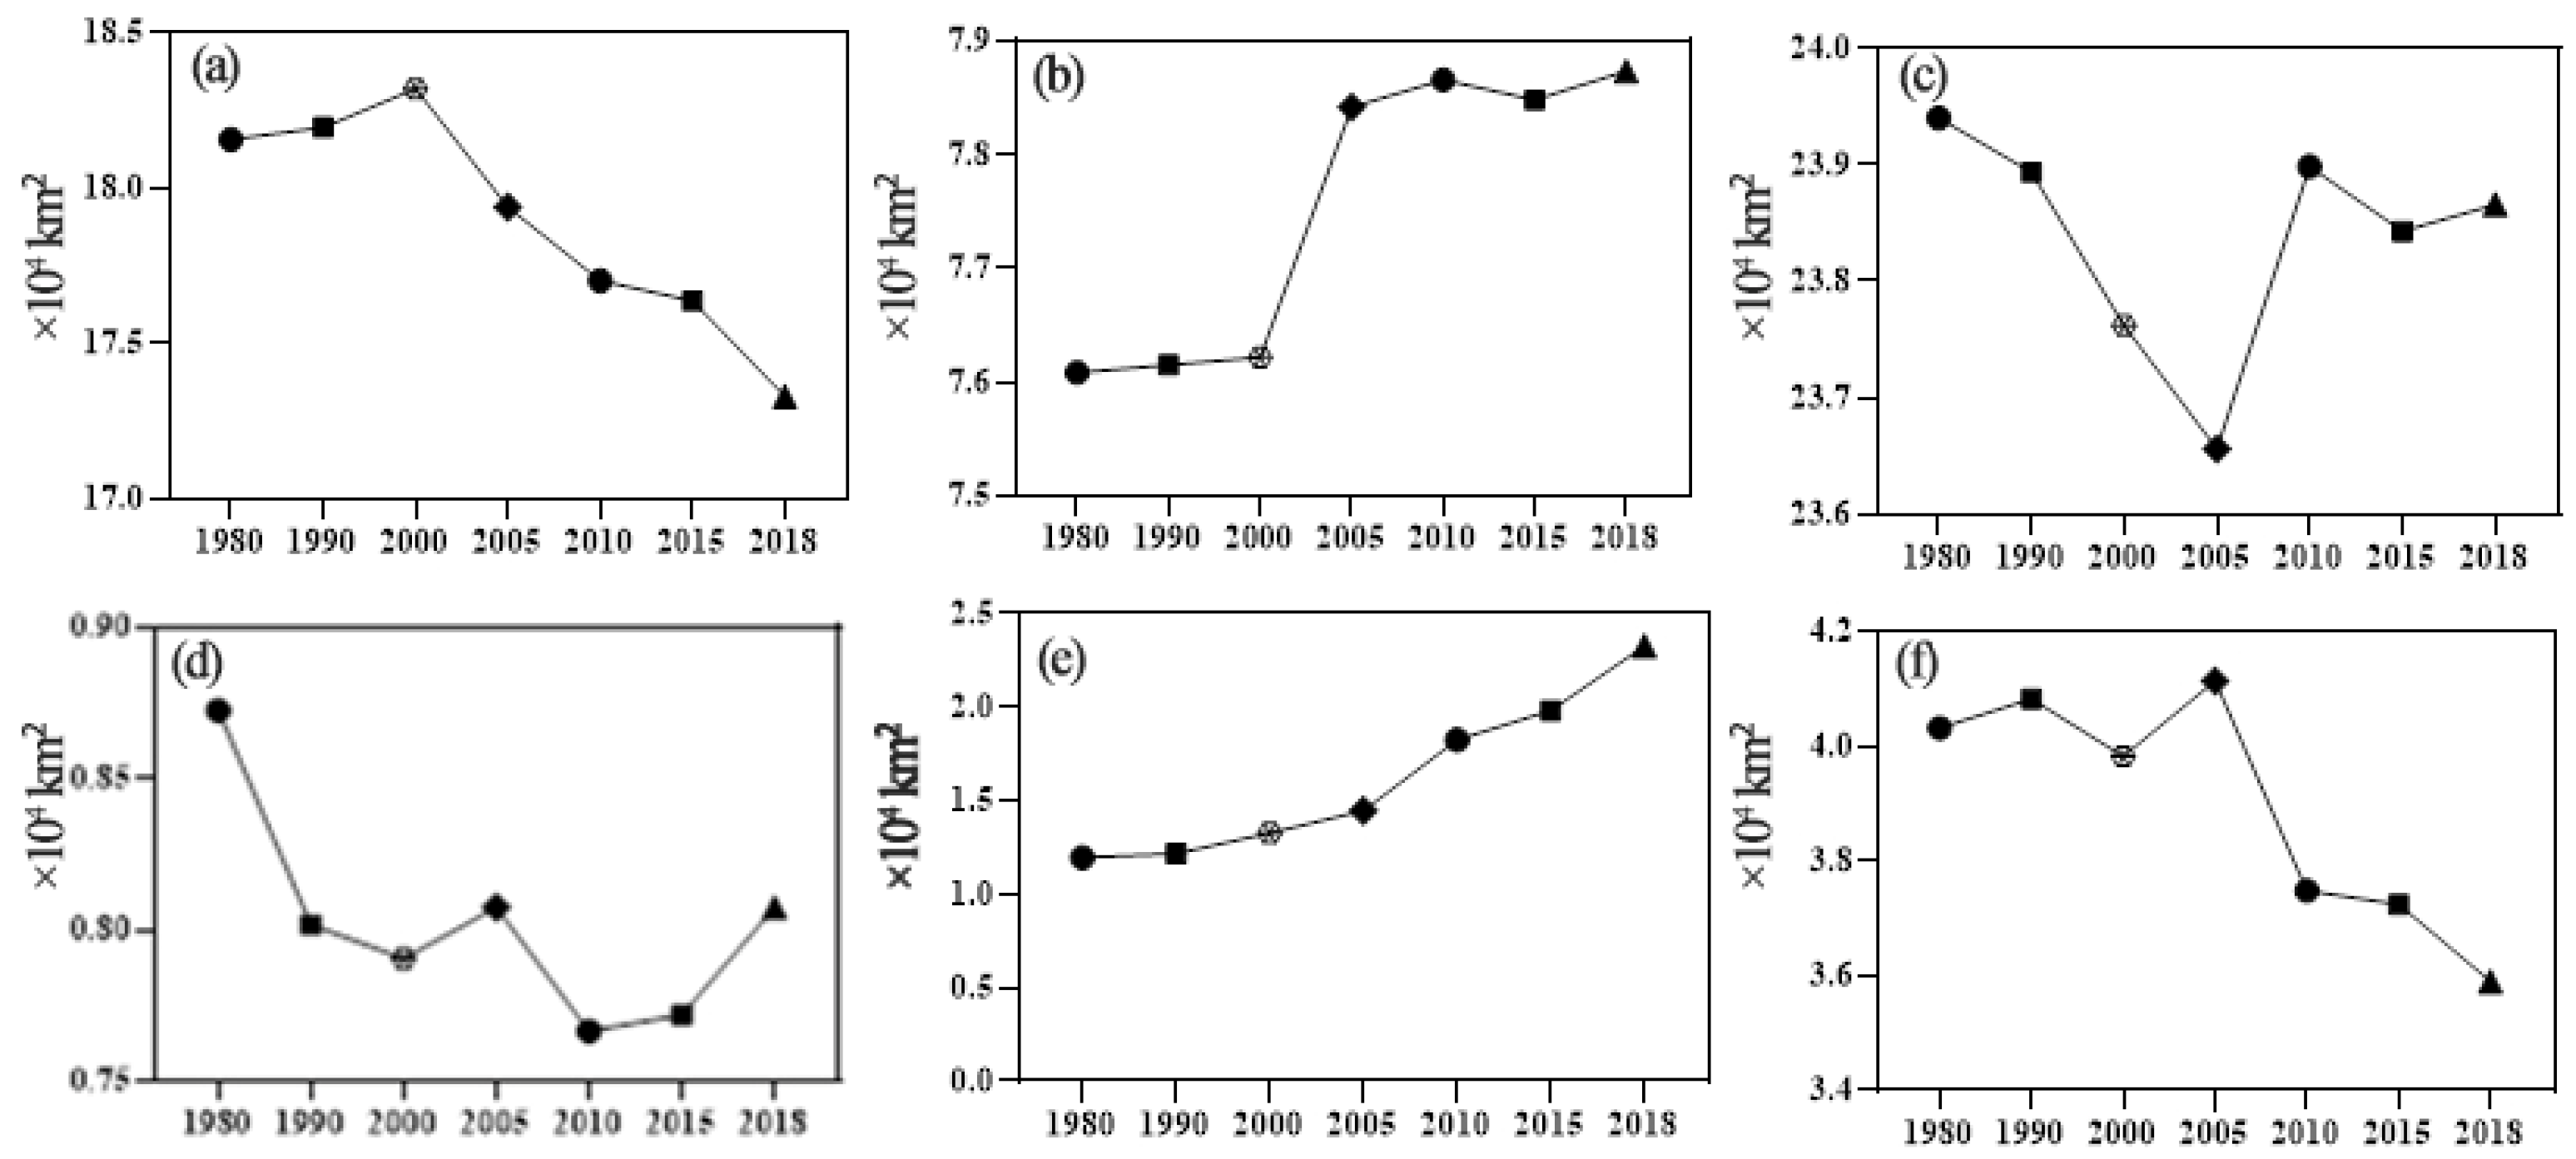
3.1. Land Cover Changes
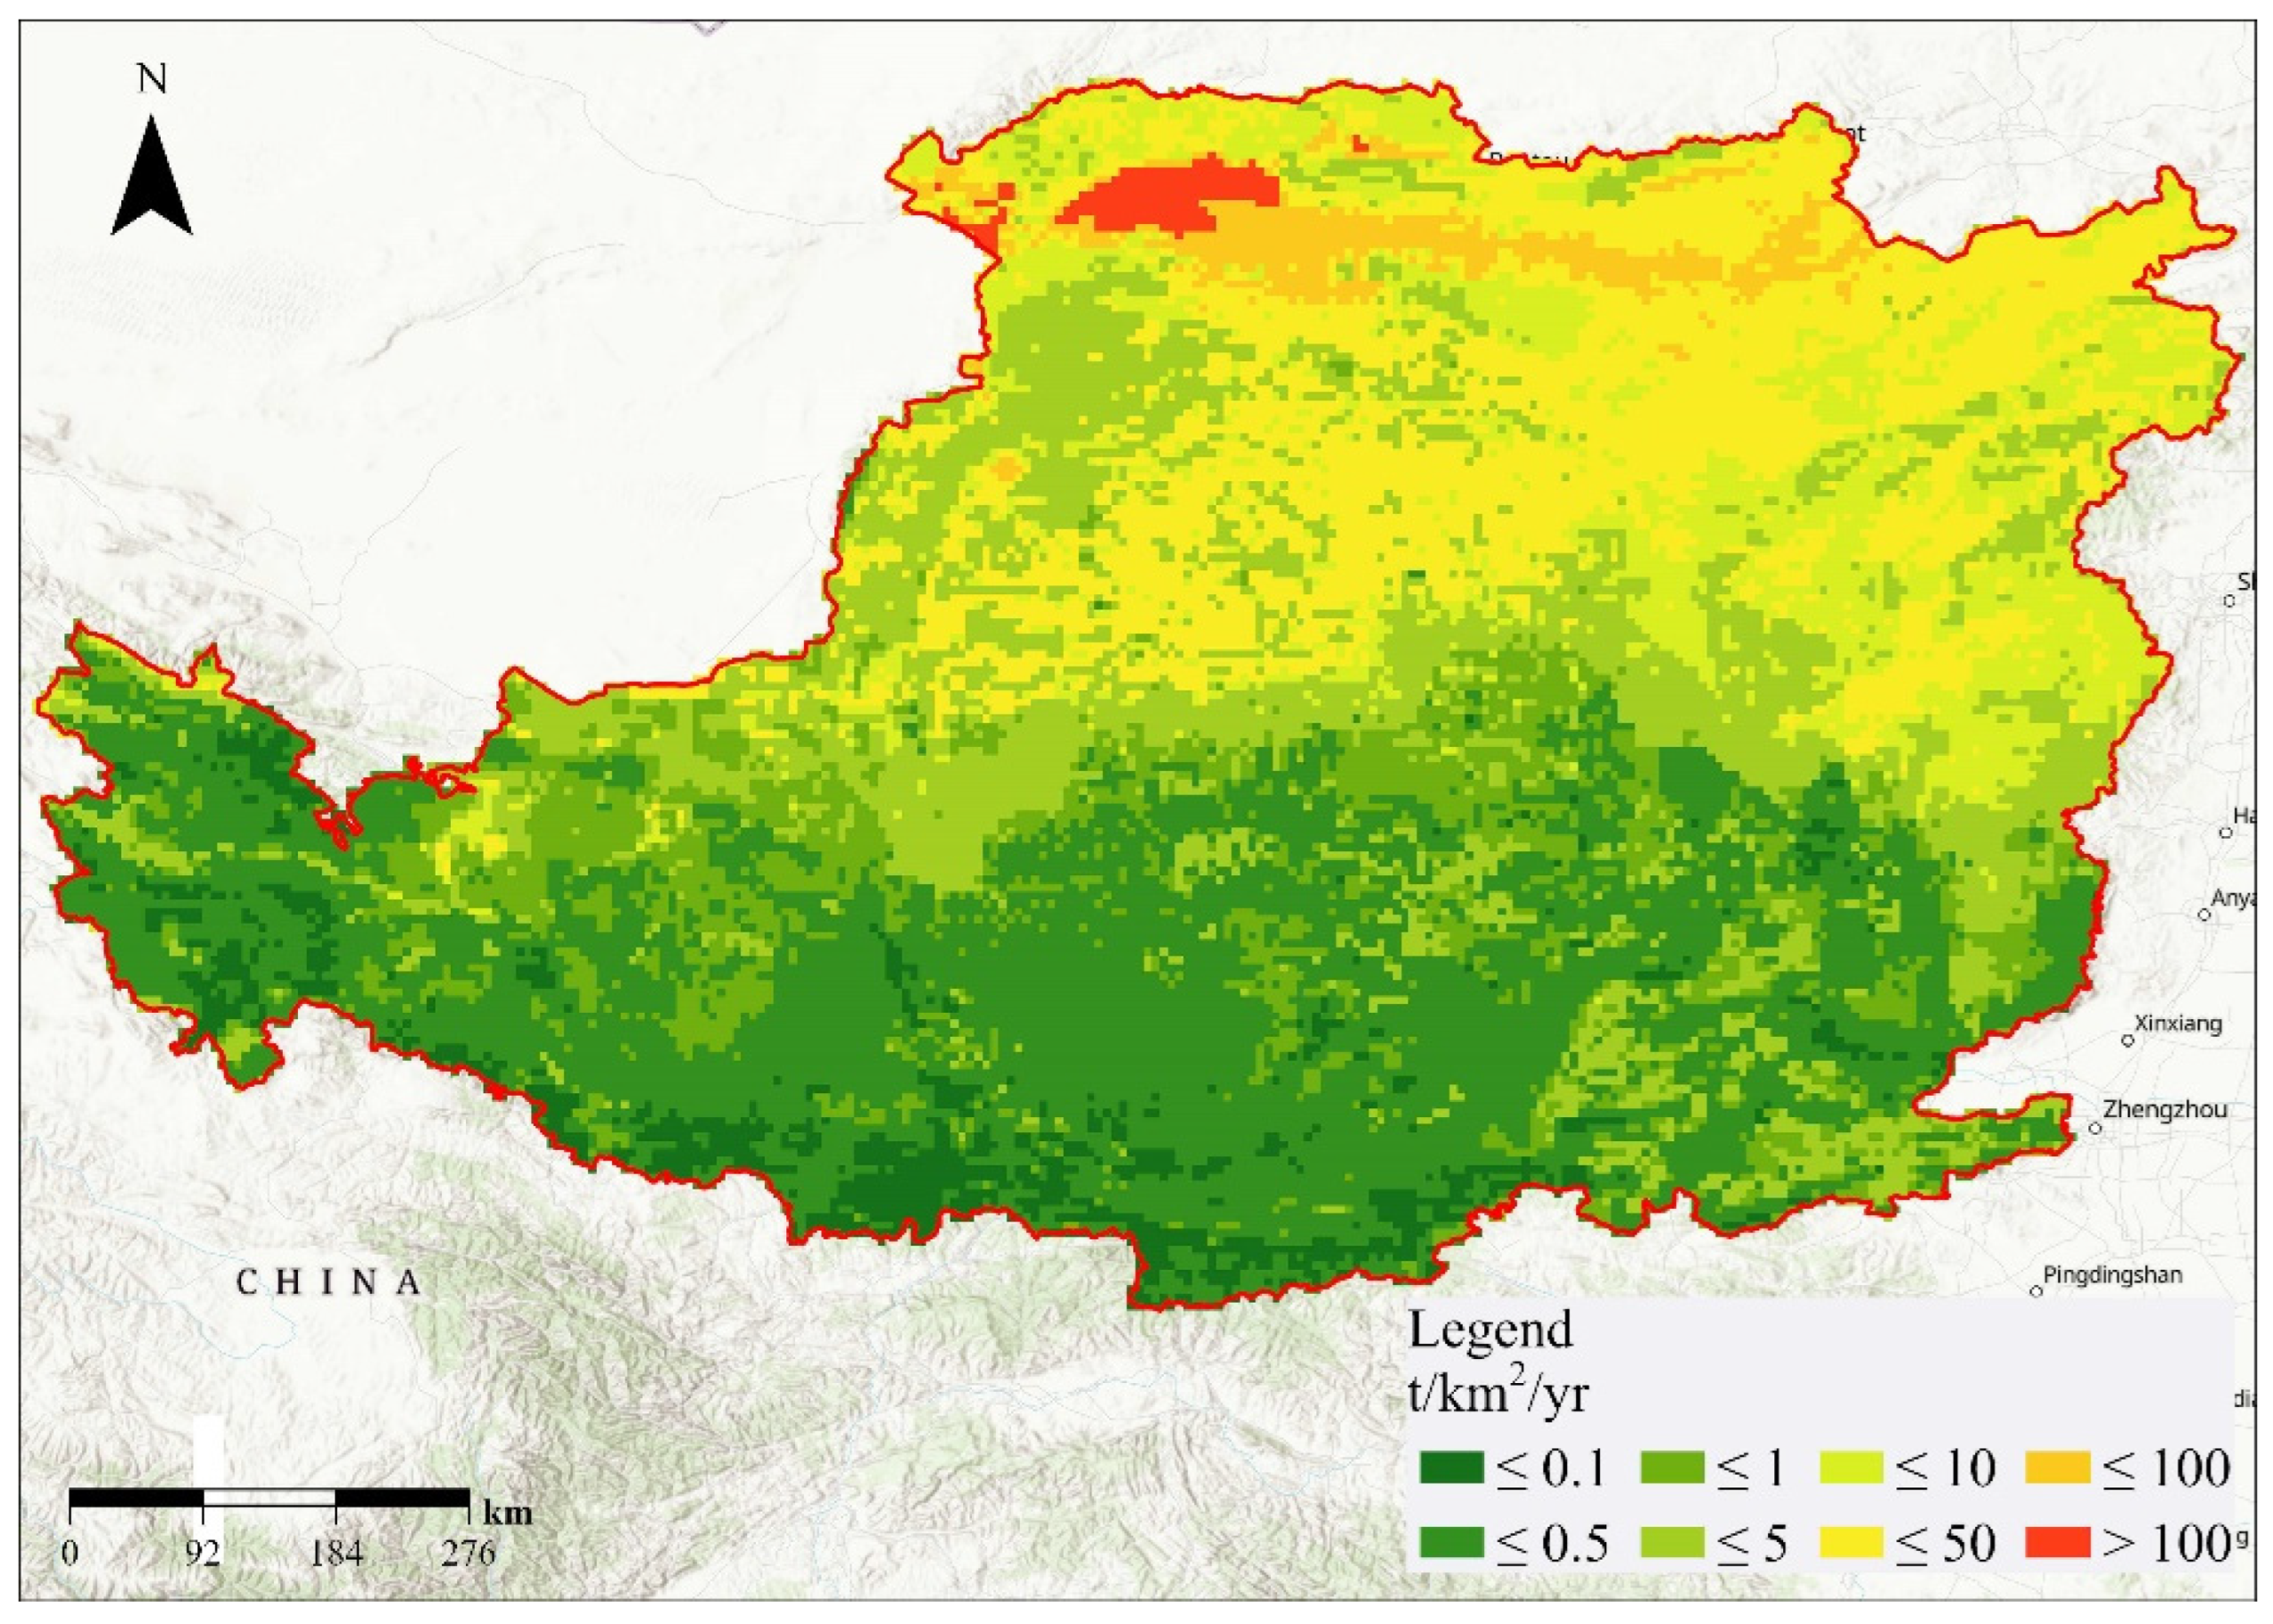
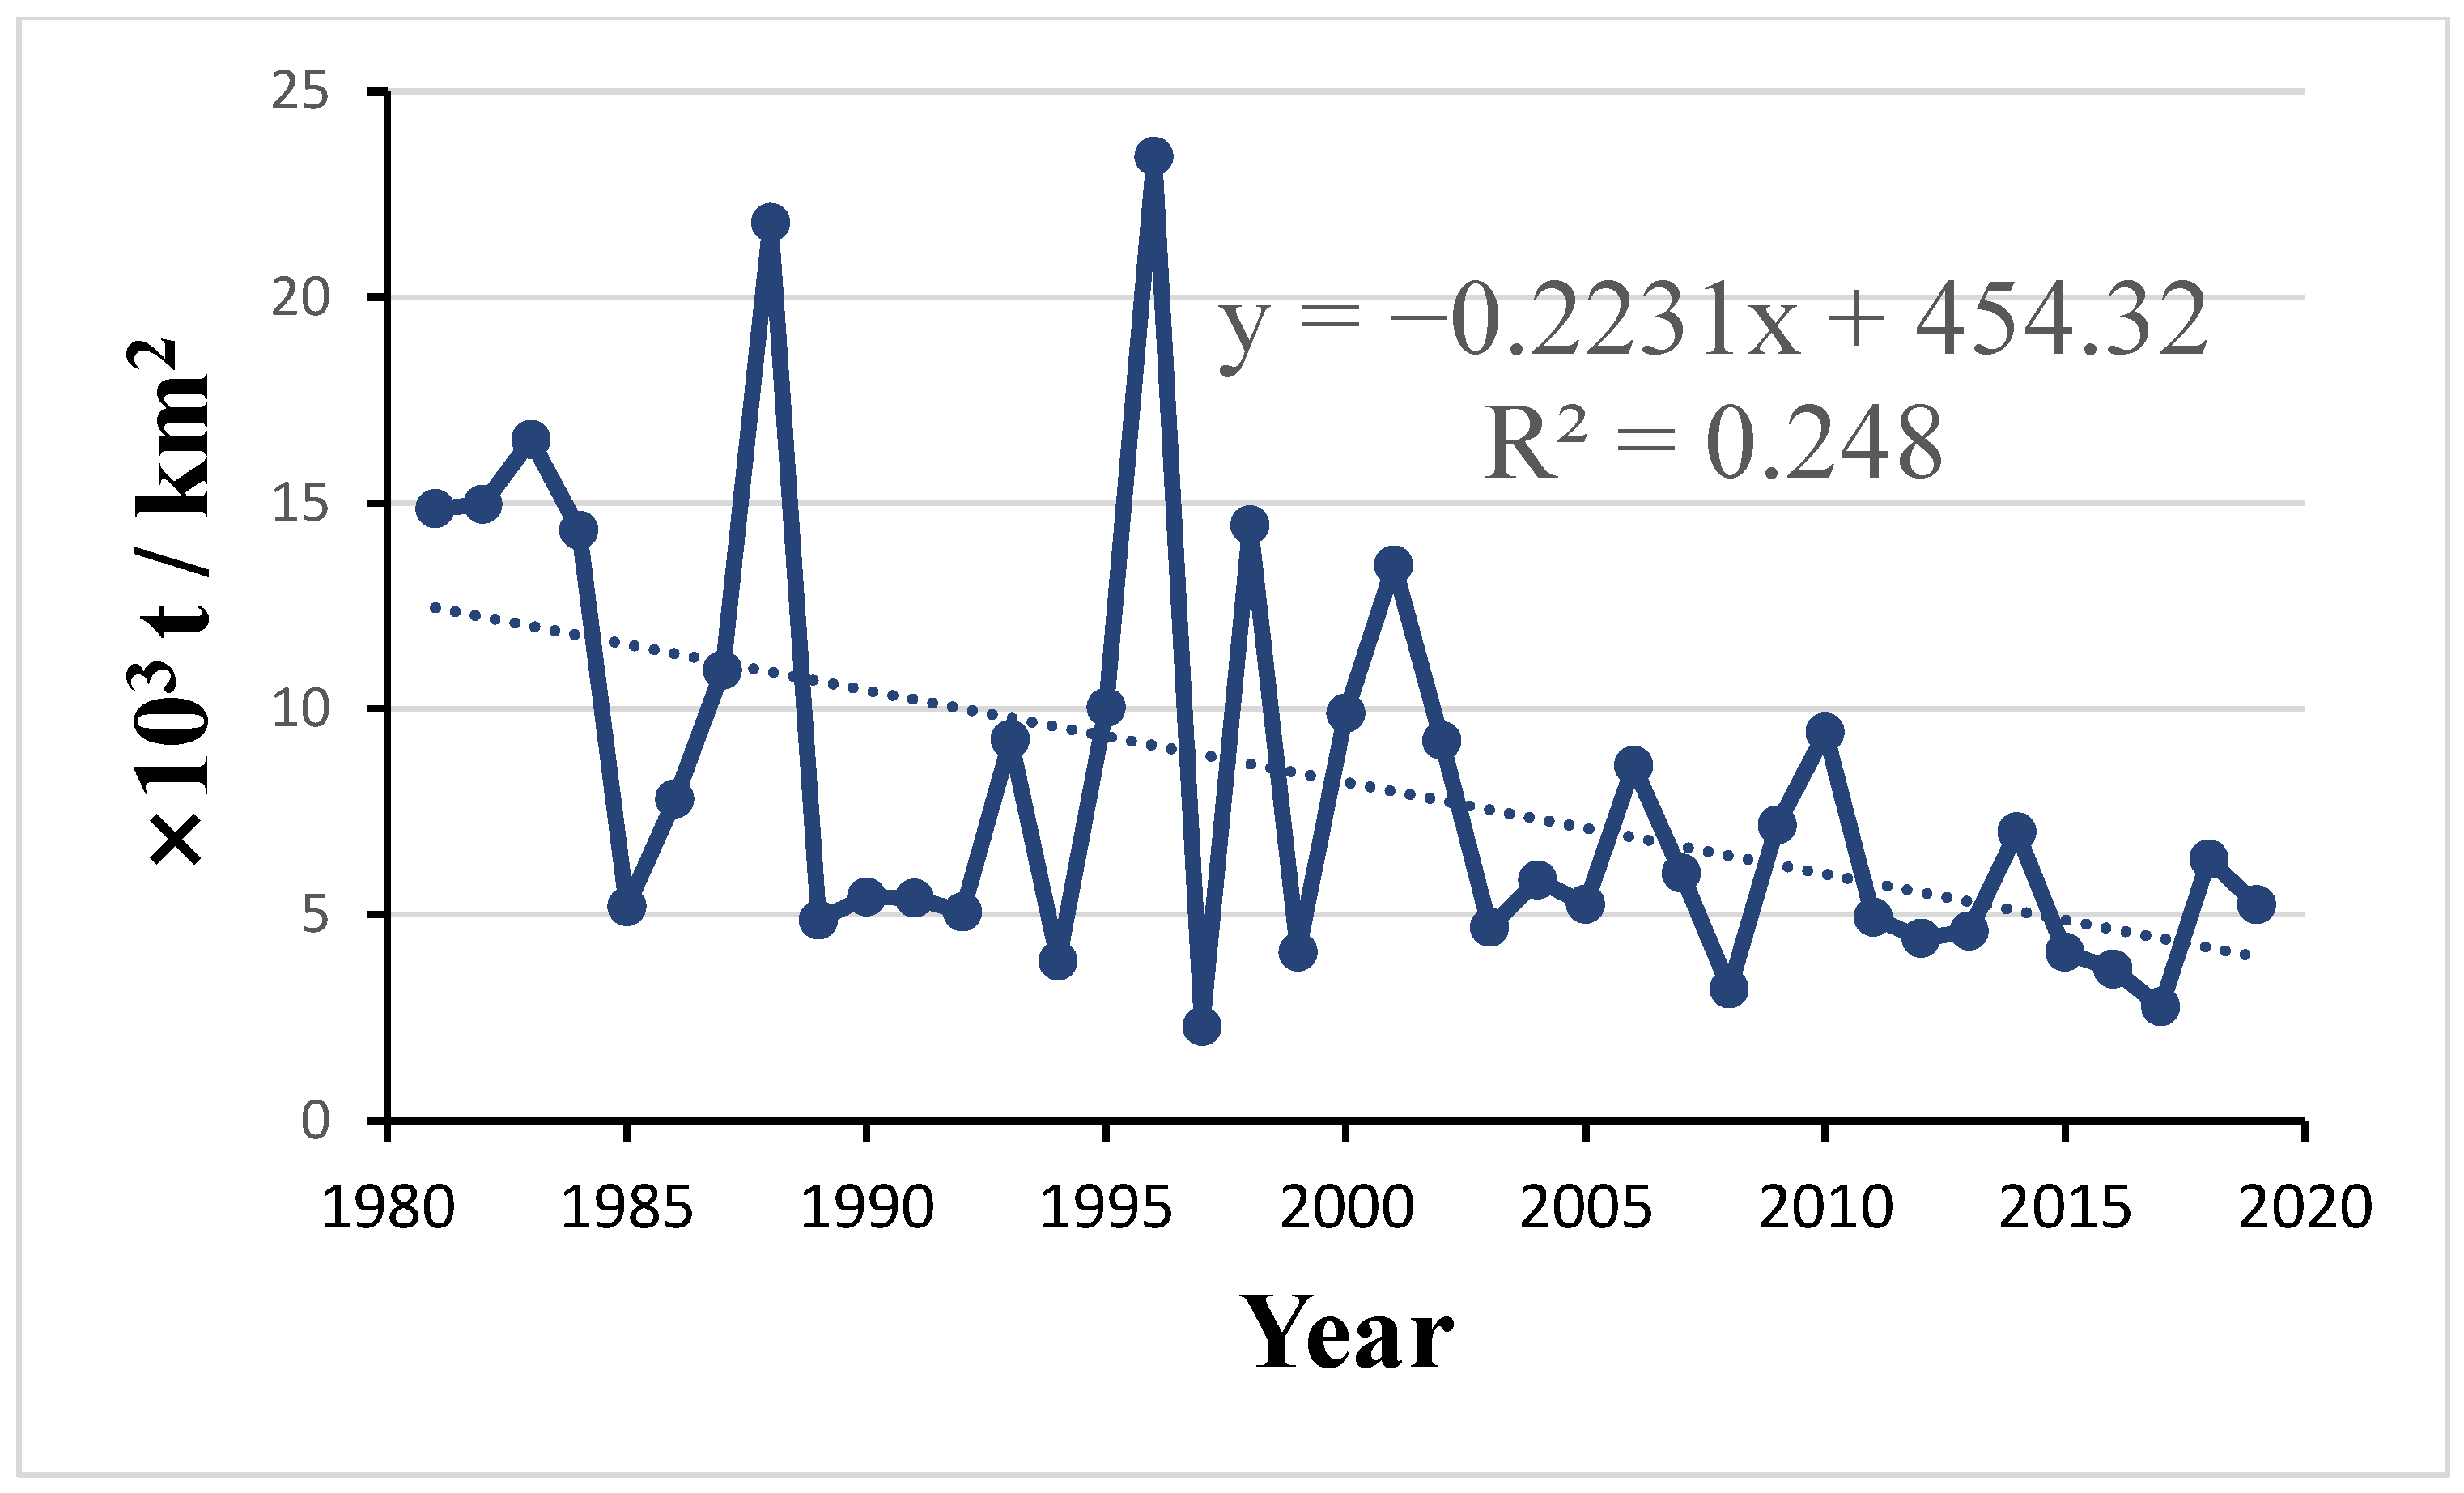
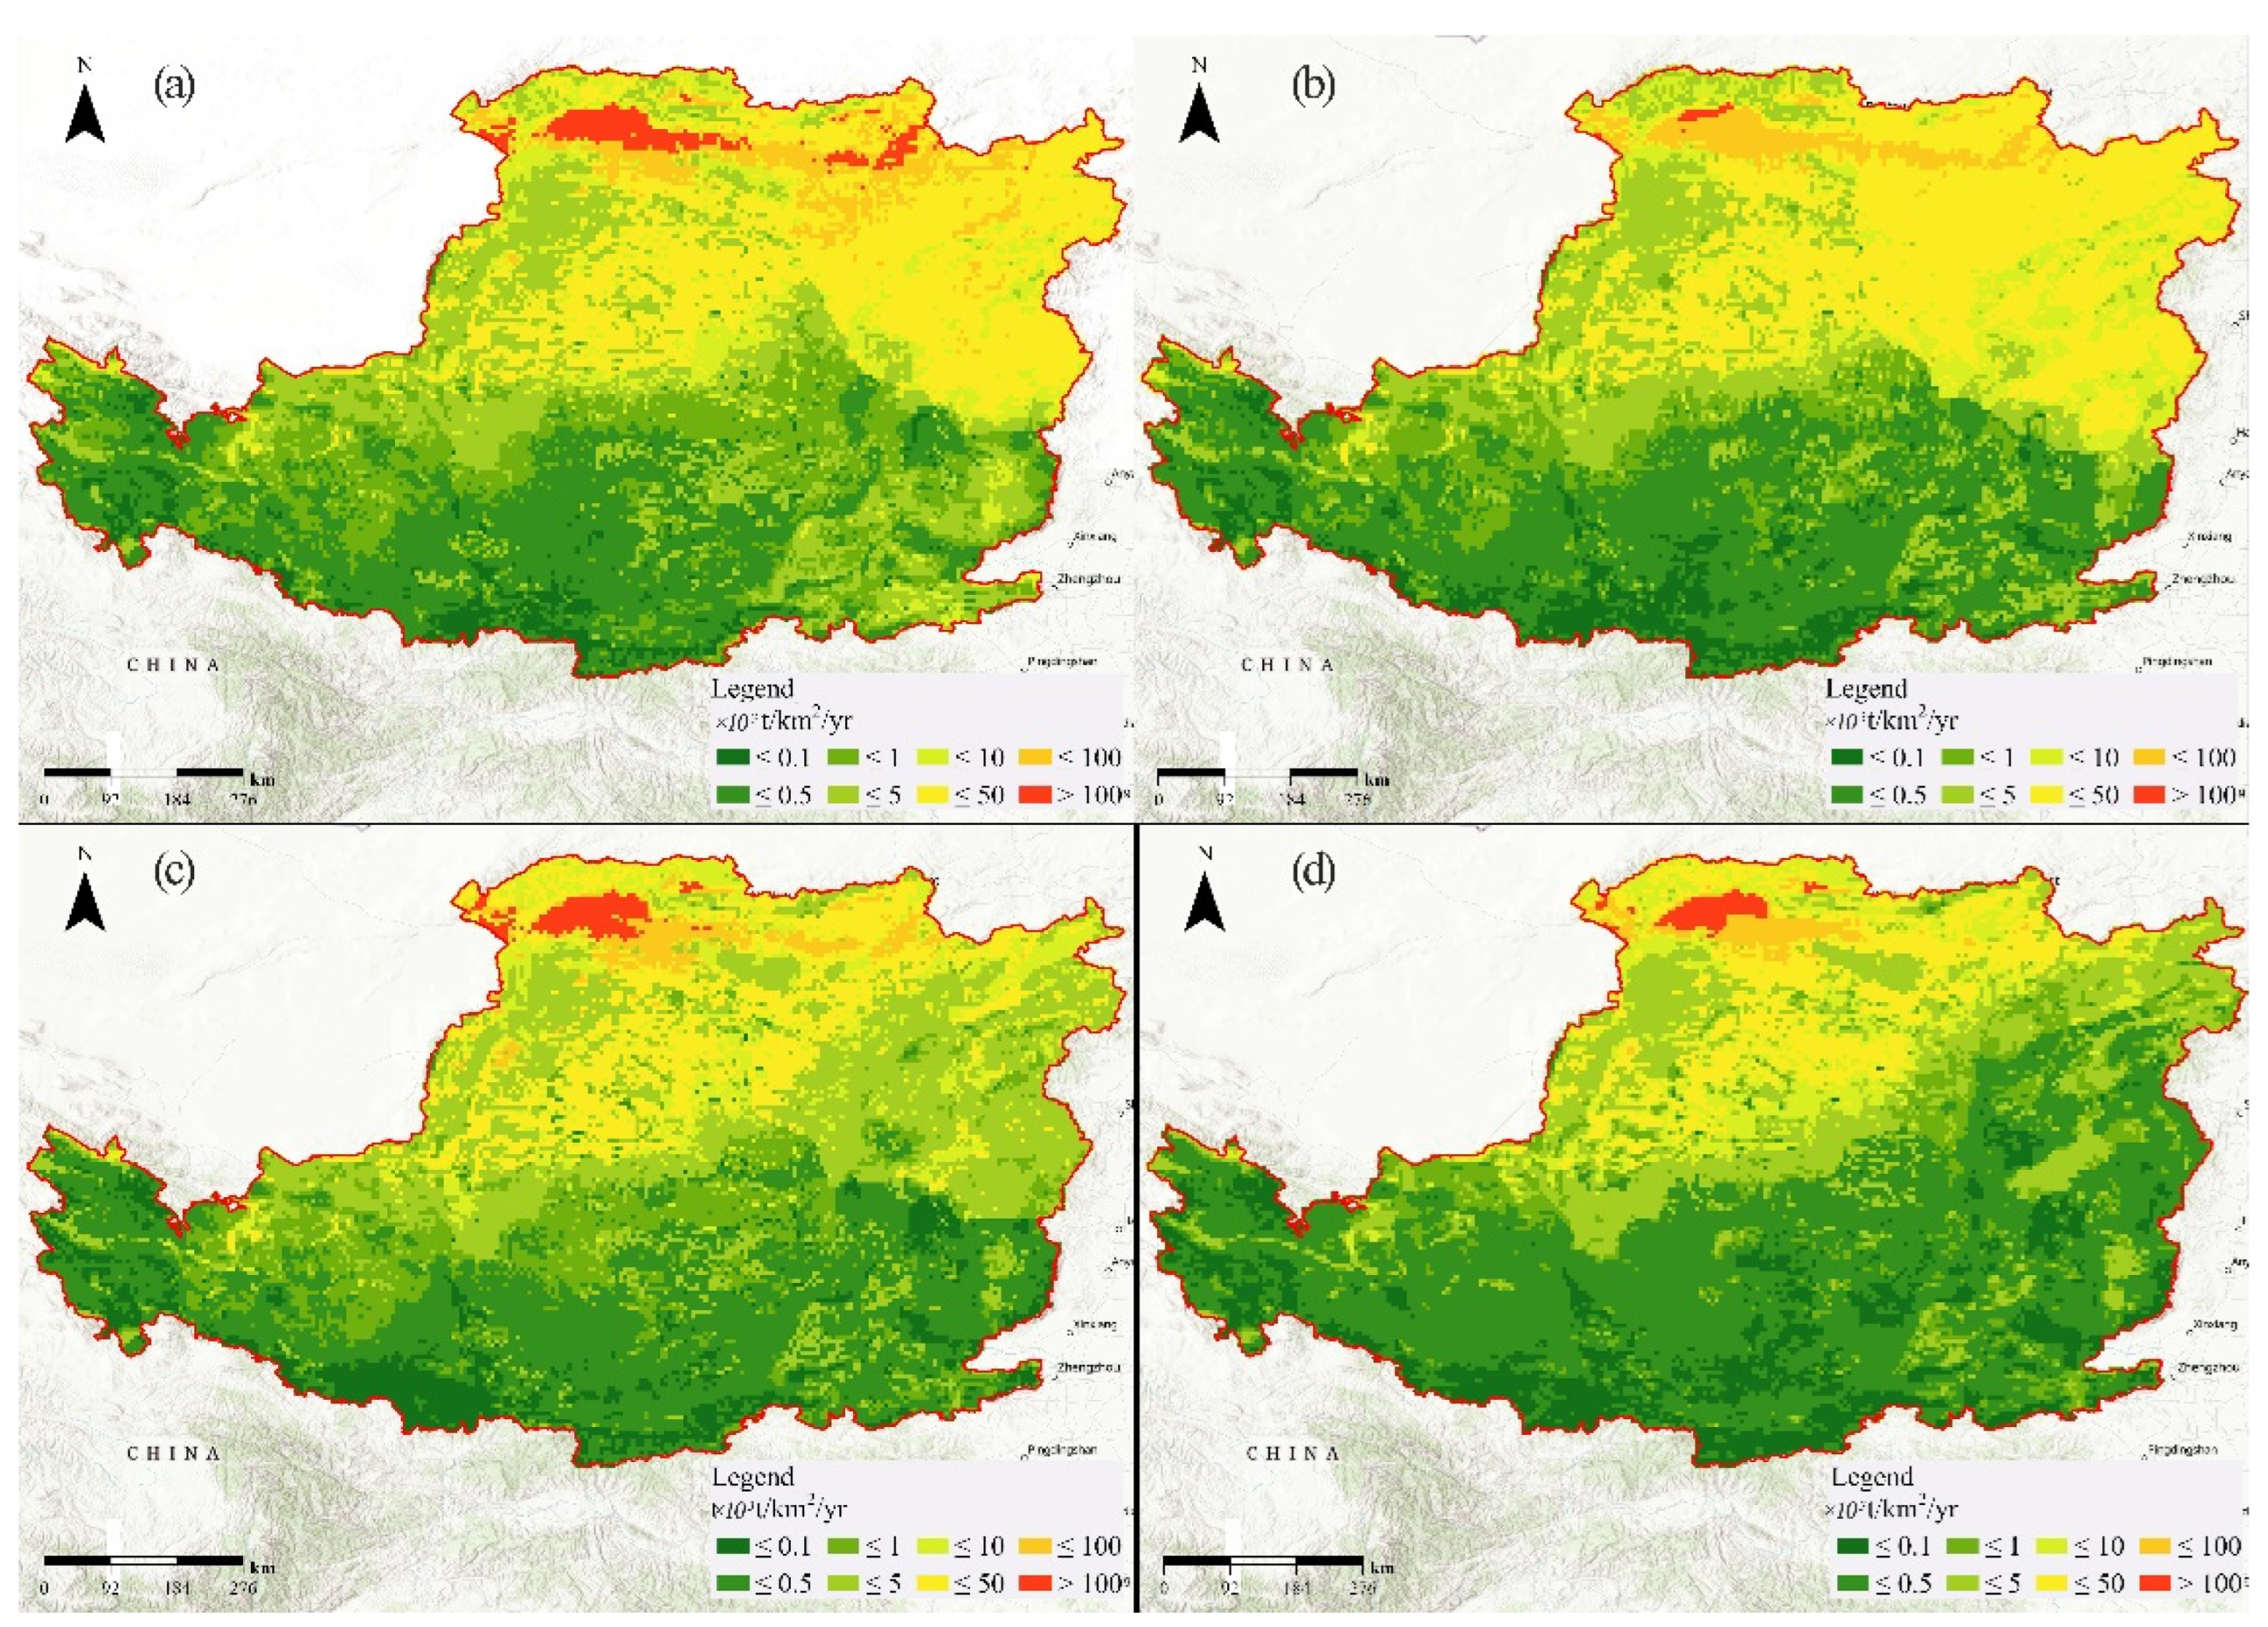
3.2. Spatial-Temporal Characteristics of Annual Soil Wind Erosion Modulus
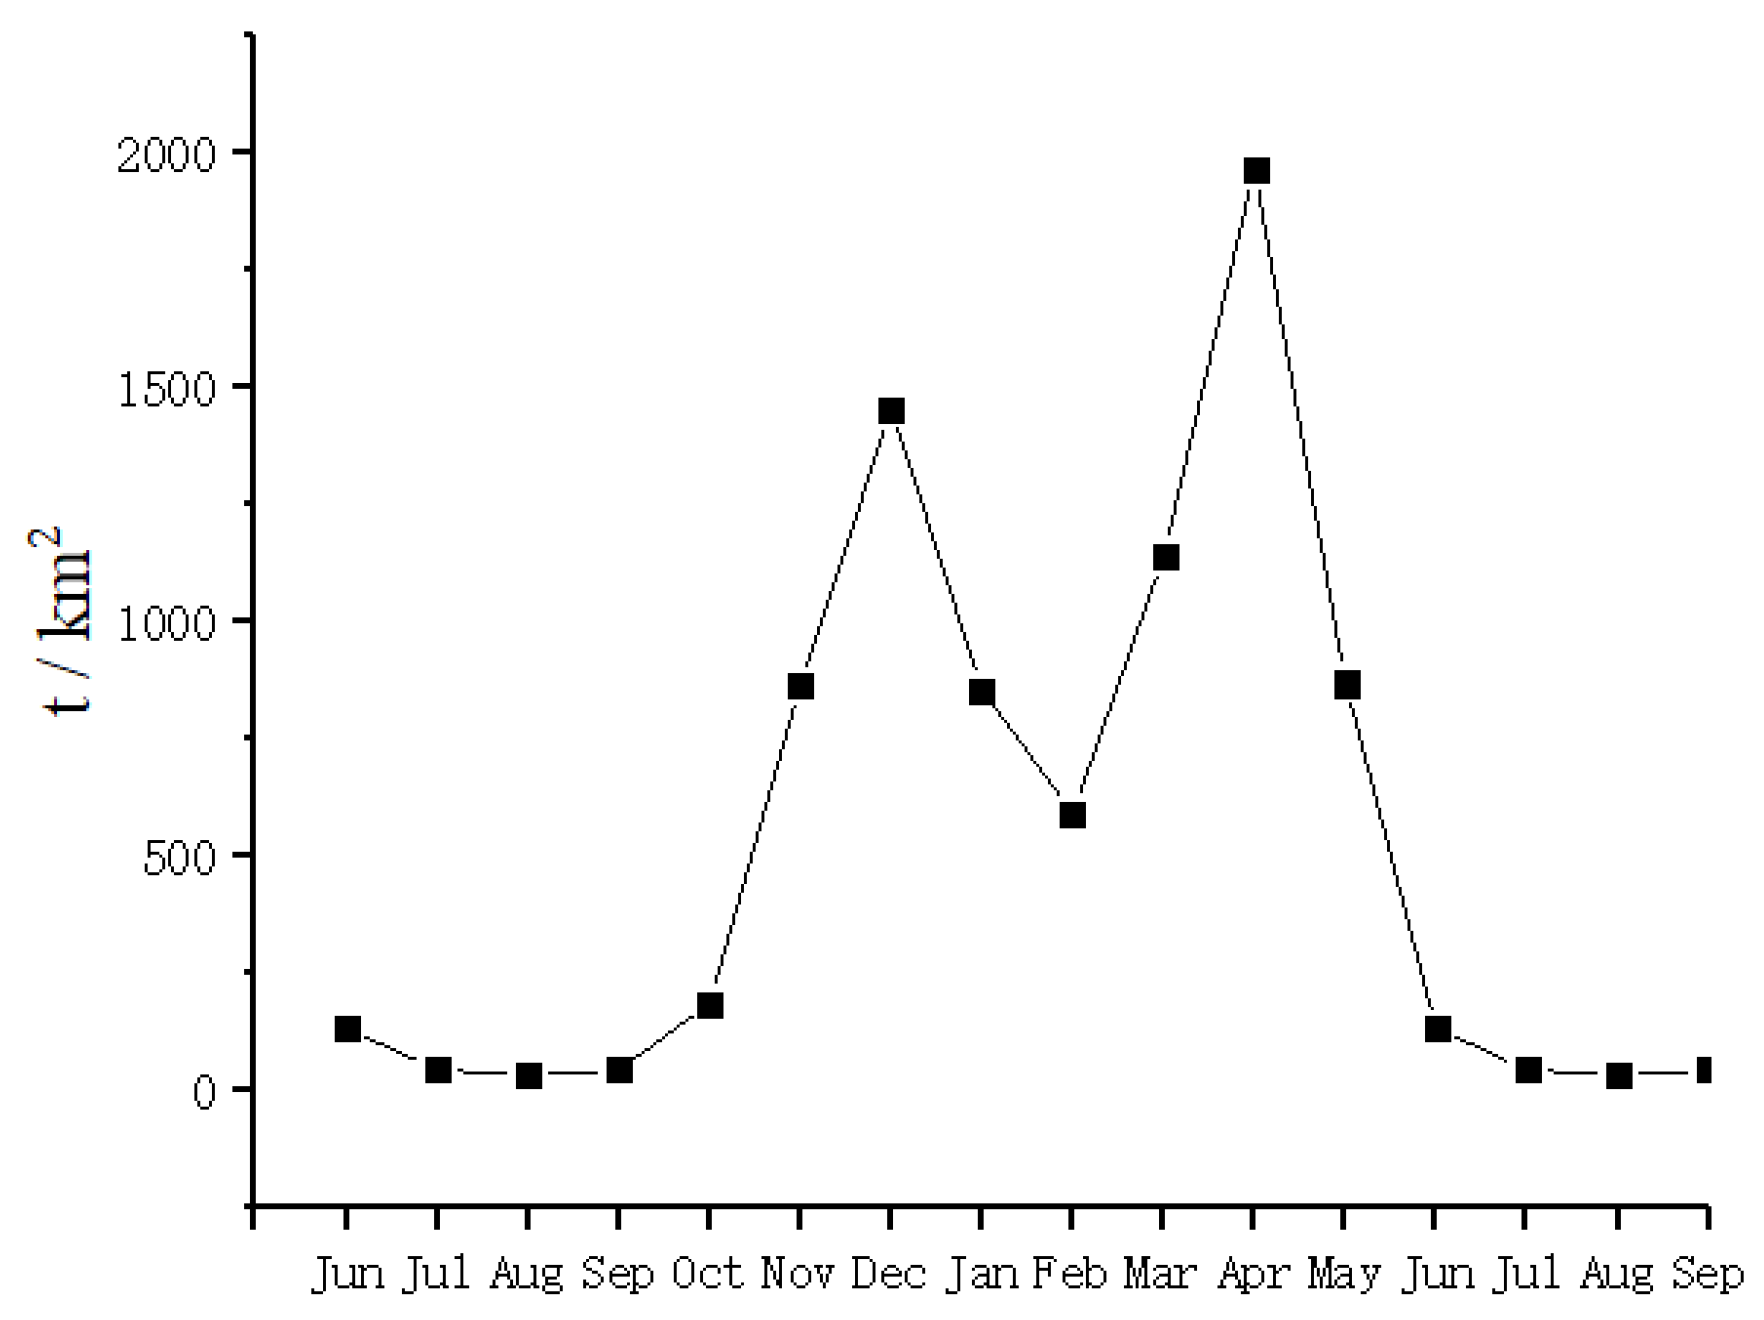
3.3. Spatial-Temporal Characteristics of Monthly Soil Wind Erosion Modulus
4. Discussion
4.1. The Factors That Influence Soil Wind Erosion
4.2. Relationship between Soil Wind Erosion and Ecological Rehabilitation Projects
4.3. Sustainable Management
5. Conclusions
Author Contributions
Funding
Institutional Review Board Statement
Informed Consent Statement
Data Availability Statement
Conflicts of Interest
References
- Jiang, C.; Zhang, H.; Zhang, Z.; Wang, D. Model-based assessment soil loss by wind and water erosion in China’s Loess Plateau: Dynamic change, conservation effectiveness, and strategies for sustainable restoration. Glob. Planet. Chang. 2019, 172, 396–413. [Google Scholar] [CrossRef]
- Pimentel, D.; Harvey, C.; Resosudarmo, P.; Sinclair, K.; Kurz, D.; McNair, M.; Crist, S.; Shpritz, L.; Fitton, L.; Saffouri, R. Environmental and economic costs of soil erosion and conservation benefits. Science 1995, 267, 1117–1123. [Google Scholar] [CrossRef] [PubMed]
- Dumanski, J. Evolving concepts and opportunities in soil conservation. Int. Soil Water Conserv. Res. 2015, 3, 1–14. [Google Scholar] [CrossRef]
- Eswaran, H.; Lal, R.; Reich, P. Land degradation: An overview. In Response to Land Degradation; CRC Press: Boca Raton, FL, USA, 2019; pp. 20–35. [Google Scholar]
- Guo, B.; Yang, G.; Zhang, F.; Han, F.; Liu, C. Dynamic monitoring of soil erosion in the upper Minjiang catchment using an improved soil loss equation based on remote sensing and geographic information system. Land Degrad. Dev. 2018, 29, 521–533. [Google Scholar] [CrossRef]
- Zhibao, D.; Xunming, W.; Lianyou, L. Wind erosion in arid and semiarid China: An overview. J. Soil Water Conserv. 2000, 55, 439–444. [Google Scholar]
- Li, D.; Xu, E.; Zhang, H. Influence of ecological land change on wind erosion prevention service in arid area of northwest China from 1990 to 2015. Ecol. Indic. 2020, 117, 106686. [Google Scholar] [CrossRef]
- Tuo, D.; Xu, M.; Gao, L.; Zhang, S.; Liu, S. Changed surface roughness by wind erosion accelerates water erosion. J. Soils Sediments 2016, 16, 105–114. [Google Scholar] [CrossRef]
- Visser, S.; Sterk, G.; Ribolzi, O. Techniques for simultaneous quantification of wind and water erosion in semi-arid regions. J. Arid. Environ. 2004, 59, 699–717. [Google Scholar] [CrossRef]
- McTainsh, G.; Lynch, A.; Burgess, R. Wind erosion in eastern Australia. Soil Res. 1990, 28, 323–339. [Google Scholar] [CrossRef]
- Du, H.; Wang, T.; Xue, X. Potential wind erosion rate response to climate and land-use changes in the watershed of the Ningxia–Inner Mongolia reach of the Yellow River, China, 1986–2013. Earth Surf. Processes Landf. 2017, 42, 1923–1937. [Google Scholar] [CrossRef]
- Du, H.; Dou, S.; Deng, X.; Xue, X.; Wang, T. Assessment of wind and water erosion risk in the watershed of the Ningxia-Inner Mongolia Reach of the Yellow River, China. Ecol. Indic. 2016, 67, 117–131. [Google Scholar] [CrossRef]
- Borrelli, P.; Ballabio, C.; Panagos, P.; Montanarella, L. Wind erosion susceptibility of European soils. Geoderma 2014, 232, 471–478. [Google Scholar] [CrossRef]
- Borrelli, P.; Lugato, E.; Montanarella, L.; Panagos, P. A new assessment of soil loss due to wind erosion in European agricultural soils using a quantitative spatially distributed modelling approach. Land Degrad. Dev. 2017, 28, 335–344. [Google Scholar] [CrossRef]
- Millennium Ecosystem Assessment. Ecosystems and Human Well-Being; Island Press: Washington, DC, USA, 2005; Volume 5. [Google Scholar]
- Koiter, A.J.; Owens, P.N.; Petticrew, E.L.; Lobb, D.A. The role of soil surface properties on the particle size and carbon selectivity of interrill erosion in agricultural landscapes. Catena 2017, 153, 194–206. [Google Scholar] [CrossRef]
- Fryrear, D.W.; Chen, W.; Lester, C. Revised wind erosion equation. Ann. Arid. Zone 2001, 40, 265–279. [Google Scholar]
- Song, Y.; Liu, L.; Yan, P.; Cao, T. A review of soil erodibility in water and wind erosion research. J. Geogr. Sci. 2005, 15, 167–176. [Google Scholar] [CrossRef]
- Hoffmann, C.; Funk, R.; Reiche, M.; Li, Y. Assessment of extreme wind erosion and its impacts in Inner Mongolia, China. Aeolian Res. 2011, 3, 343–351. [Google Scholar] [CrossRef]
- Wu, D.; Zou, C.; Cao, W.; Xiao, T.; Gong, G. Ecosystem services changes between 2000 and 2015 in the Loess Plateau, China: A response to ecological restoration. PLoS ONE 2019, 14, e0209483. [Google Scholar] [CrossRef]
- Zhang, H.; Fan, J.; Cao, W.; Harris, W.; Li, Y.; Chi, W.; Wang, S. Response of wind erosion dynamics to climate change and human activity in Inner Mongolia, China during 1990 to 2015. Sci. Total Environ. 2018, 639, 1038–1050. [Google Scholar] [CrossRef]
- Guobin, L. Soil conservation and sustainable agriculture on the Loess Plateau: Challenges and prospects. Ambio 1999, 28, 663–668. [Google Scholar]
- Tang, K. Soil Erosion and Soil and Water Conservation Terms; Science Press: Beijing, China, 1998. (In Chinese) [Google Scholar]
- Tian, S.; Xu, M.; Jiang, E.; Wang, G.; Hu, H.; Liu, X. Temporal variations of runoff and sediment load in the upper Yellow River, China. J. Hydrol. 2019, 568, 46–56. [Google Scholar] [CrossRef]
- Tian, S.; Li, Z.; Wang, Z.; Jiang, E.; Wang, W.; Sun, M. Mineral composition and particle size distribution of river sediment and loess in the middle and lower Yellow River. Int. J. Sediment Res. 2021, 36, 392–400. [Google Scholar] [CrossRef]
- Song, Z. A numerical simulation of dust storms in China. Environ. Model. Softw. 2004, 19, 141–151. [Google Scholar] [CrossRef]
- Feng, Z.-m.; Zhang, P.-t.; Yang, Y.-z. The scale of land conversion from farmland to forest or grassland, the grain response to it, and the relevant proposals in Northwest China. Geogr. Res. 2003, 22, 105–113. [Google Scholar]
- Wang, X.; Lu, C.; Fang, J.; Shen, Y. Implications for development of grain-for-green policy based on cropland suitability evaluation in desertification-affected north China. Land Use Policy 2007, 24, 417–424. [Google Scholar] [CrossRef]
- Fang, J.; Chen, A.; Peng, C.; Zhao, S.; Ci, L. Changes in forest biomass carbon storage in China between 1949 and 1998. Science 2001, 292, 2320–2322. [Google Scholar] [CrossRef]
- Zhao, Y.; Chi, W.; Kuang, W.; Bao, Y.; Ding, G. Ecological and environmental consequences of ecological projects in the Beijing–Tianjin sand source region. Ecol. Indic. 2020, 112, 106111. [Google Scholar] [CrossRef]
- Yue, X.; Mu, X.; Zhao, G.; Shao, H.; Gao, P. Dynamic changes of sediment load in the middle reaches of the Yellow River basin, China and implications for eco-restoration. Ecol. Eng. 2014, 73, 64–72. [Google Scholar] [CrossRef]
- Yu, Y.; Zhao, W.; Martinez-Murillo, J.F.; Pereira, P. Loess Plateau: From degradation to restoration. Sci. Total Environ. 2020, 738, 140206. [Google Scholar] [CrossRef]
- Jiang, C.; Wang, F.; Zhang, H.; Dong, X. Quantifying changes in multiple ecosystem services during 2000–2012 on the Loess Plateau, China, as a result of climate variability and ecological restoration. Ecol. Eng. 2016, 97, 258–271. [Google Scholar] [CrossRef]
- Ge, J.; Wang, S.; Fan, J.; Gongadze, K.; Wu, L. Soil nutrients of different land-use types and topographic positions in the water-wind erosion crisscross region of China’s Loess Plateau. Catena 2020, 184, 104243. [Google Scholar] [CrossRef]
- Sun, W.; Shao, Q.; Liu, J.; Zhai, J. Assessing the effects of land use and topography on soil erosion on the Loess Plateau in China. Catena 2014, 121, 151–163. [Google Scholar] [CrossRef]
- Fryrear, D.W.; Saleh, A.; Bilbro, J.D.; Schromberg, H.M.; Stout, J.E.; Zobeck, T.M. Revised Wind Erosion Equation; USDA Technical Bulletin No. 1; Wind Erosion and Water Conservation Research Unit: Lubbock, TX, USA, 1998.
- Fryrear, D.; Bilbro, J.; Saleh, A.; Schomberg, H.; Stout, J.; Zobeck, T. RWEQ: Improved wind erosion technology. J. Soil Water Conserv. 2000, 55, 183–189. [Google Scholar]
- Fryrear, D.; Sutherland, P.; Davis, G.; Hardee, G.; Dollar, M. Wind erosion estimates with RWEQ and WEQ. In Proceedings of the Conference Sustaining the Global Farm, 10th International Soil Conservation Organization Meeting, Purdue University, West Lafayette, IN, USA, 24–29 May 1999. [Google Scholar]
- Wang, L.; Shao, M.a.; Wang, Q.; Gale, W.J. Historical changes in the environment of the Chinese Loess Plateau. Environ. Sci. Policy 2006, 9, 675–684. [Google Scholar] [CrossRef]
- Demolli, H.; Dokuz, A.S.; Ecemis, A.; Gokcek, M. Wind power forecasting based on daily wind speed data using machine learning algorithms. Energy Convers. Manag. 2019, 198, 111823. [Google Scholar] [CrossRef]
- Lü, Y.; Fu, B.; Feng, X.; Zeng, Y.; Liu, Y.; Chang, R.; Sun, G.; Wu, B. A Policy-Driven Large Scale Ecological Restoration: Quantifying Ecosystem Services Changes in the Loess Plateau of China. PLoS ONE 2012, 7, e31782. [Google Scholar] [CrossRef]
- Yurui, L.; Xuanchang, Z.; Zhi, C.; Zhengjia, L.; Zhi, L.; Yansui, L. Towards the progress of ecological restoration and economic development in China’s Loess Plateau and strategy for more sustainable development. Sci. Total Environ. 2021, 756, 143676. [Google Scholar] [CrossRef]
- Feng, X.; Fu, B.; Piao, S.; Wang, S.; Ciais, P.; Zeng, Z.; Lü, Y.; Zeng, Y.; Li, Y.; Jiang, X. Revegetation in China’s Loess Plateau is approaching sustainable water resource limits. Nat. Clim. Chang. 2016, 6, 1019–1022. [Google Scholar] [CrossRef]


| 1981\2018 | Farmland | Woodland | Grassland | Wetland | Urban Areas | Bare Land |
|---|---|---|---|---|---|---|
| Farmland | 14.75 | 0.38 | 2.02 | 0.1 | 0.84 | 0.06 |
| Woodland | 0.2 | 6.89 | 0.41 | 0.01 | 0.06 | 0.03 |
| Grassland | 1.92 | 0.53 | 20.67 | 0.08 | 0.36 | 0.38 |
| Wetland | 0.14 | 0.01 | 0.08 | 0.58 | 0.03 | 0.04 |
| Urban areas | 0.18 | 0.01 | 0.04 | 0 | 0.96 | 0 |
| Bare land | 0.15 | 0.05 | 0.64 | 0.04 | 0.08 | 3.07 |
| Wind Erosion Modulus | |
|---|---|
| Wind velocity | 0.909 ** |
| Air temperature | 0.373 * |
| Rainfall | 0.783 ** |
| Vegetation coverage | −0.535 ** |
Publisher’s Note: MDPI stays neutral with regard to jurisdictional claims in published maps and institutional affiliations. |
© 2022 by the authors. Licensee MDPI, Basel, Switzerland. This article is an open access article distributed under the terms and conditions of the Creative Commons Attribution (CC BY) license (https://creativecommons.org/licenses/by/4.0/).
Share and Cite
Song, R.; Zhao, X.; Jing, Y.; Li, X.; Su, J.; Wang, X.; Zhao, D. Analysis of Ecosystem Protection and Sustainable Development Strategies—Evidence Based on the RWEQ Model on the Loess Plateau, China. Sustainability 2022, 14, 11502. https://doi.org/10.3390/su141811502
Song R, Zhao X, Jing Y, Li X, Su J, Wang X, Zhao D. Analysis of Ecosystem Protection and Sustainable Development Strategies—Evidence Based on the RWEQ Model on the Loess Plateau, China. Sustainability. 2022; 14(18):11502. https://doi.org/10.3390/su141811502
Chicago/Turabian StyleSong, Ruiya, Xiufeng Zhao, Yongcai Jing, Xiaoxia Li, Jiwen Su, Xiao Wang, and Dandan Zhao. 2022. "Analysis of Ecosystem Protection and Sustainable Development Strategies—Evidence Based on the RWEQ Model on the Loess Plateau, China" Sustainability 14, no. 18: 11502. https://doi.org/10.3390/su141811502
APA StyleSong, R., Zhao, X., Jing, Y., Li, X., Su, J., Wang, X., & Zhao, D. (2022). Analysis of Ecosystem Protection and Sustainable Development Strategies—Evidence Based on the RWEQ Model on the Loess Plateau, China. Sustainability, 14(18), 11502. https://doi.org/10.3390/su141811502