
Simulation of Artificial Lighting Using Leading Software to Evaluate Lighting Conditions in the Absence of Daylight in a University Classroom


Abstract
:1. Introduction
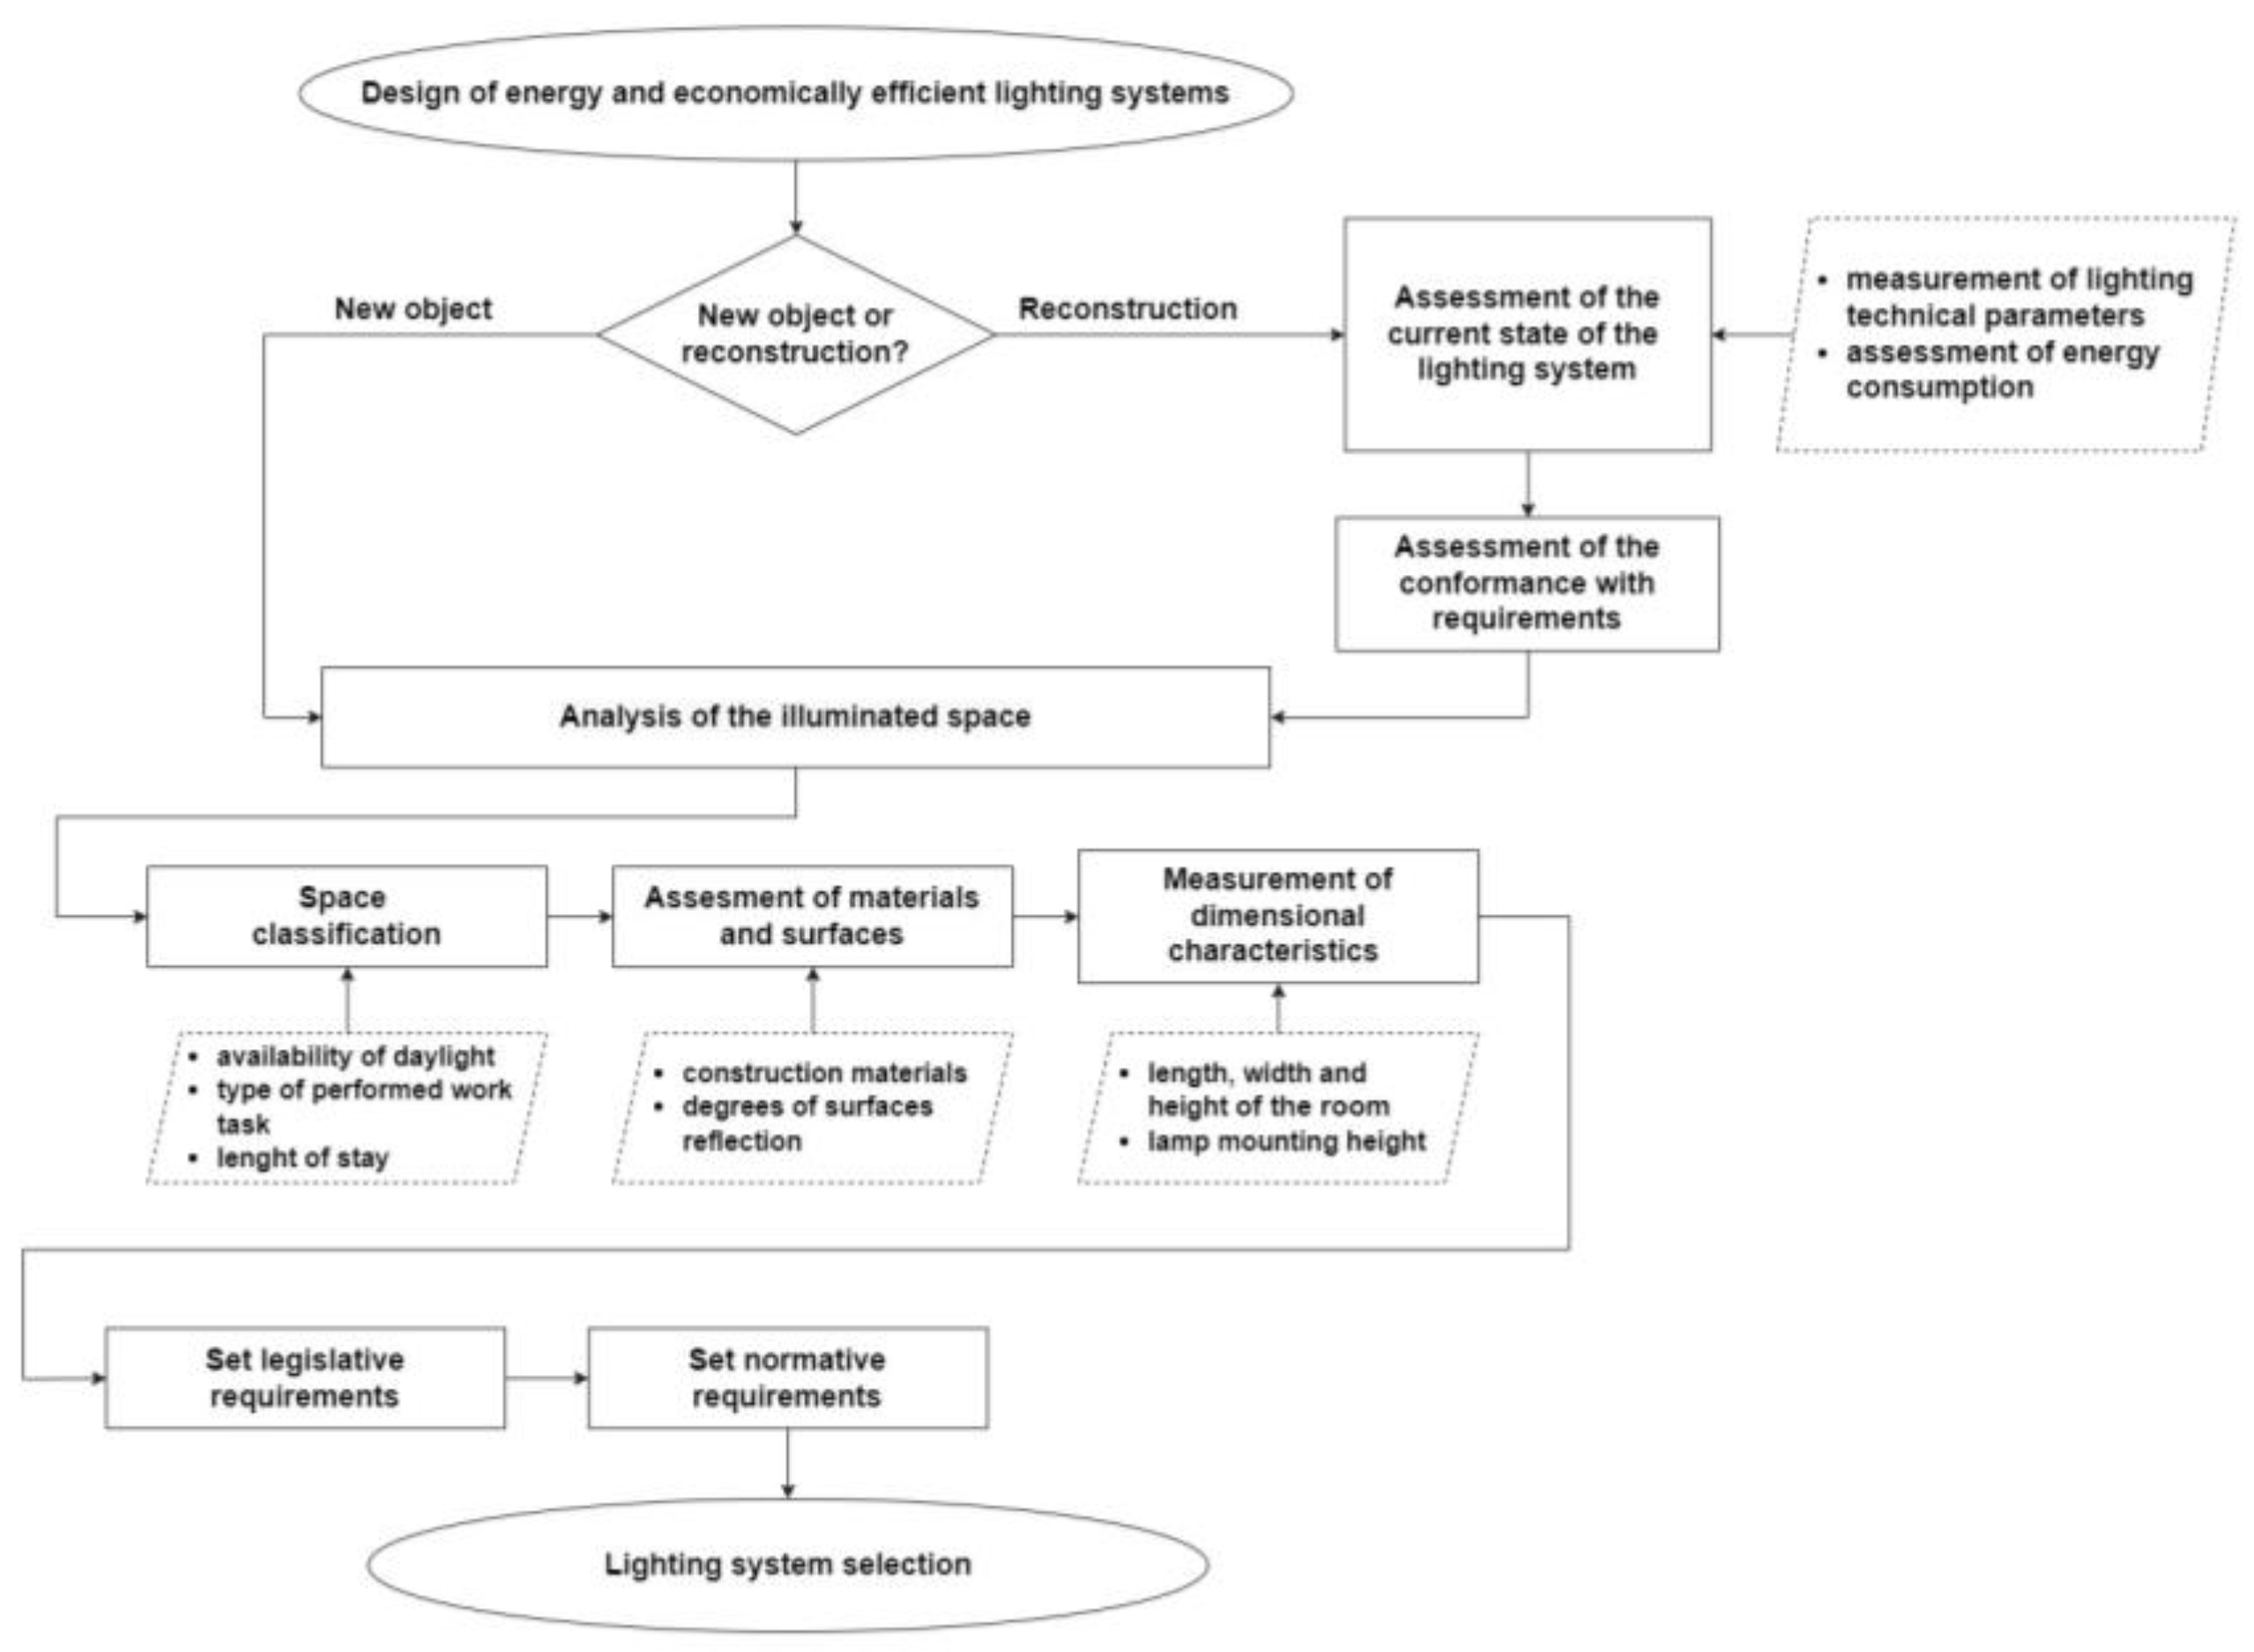
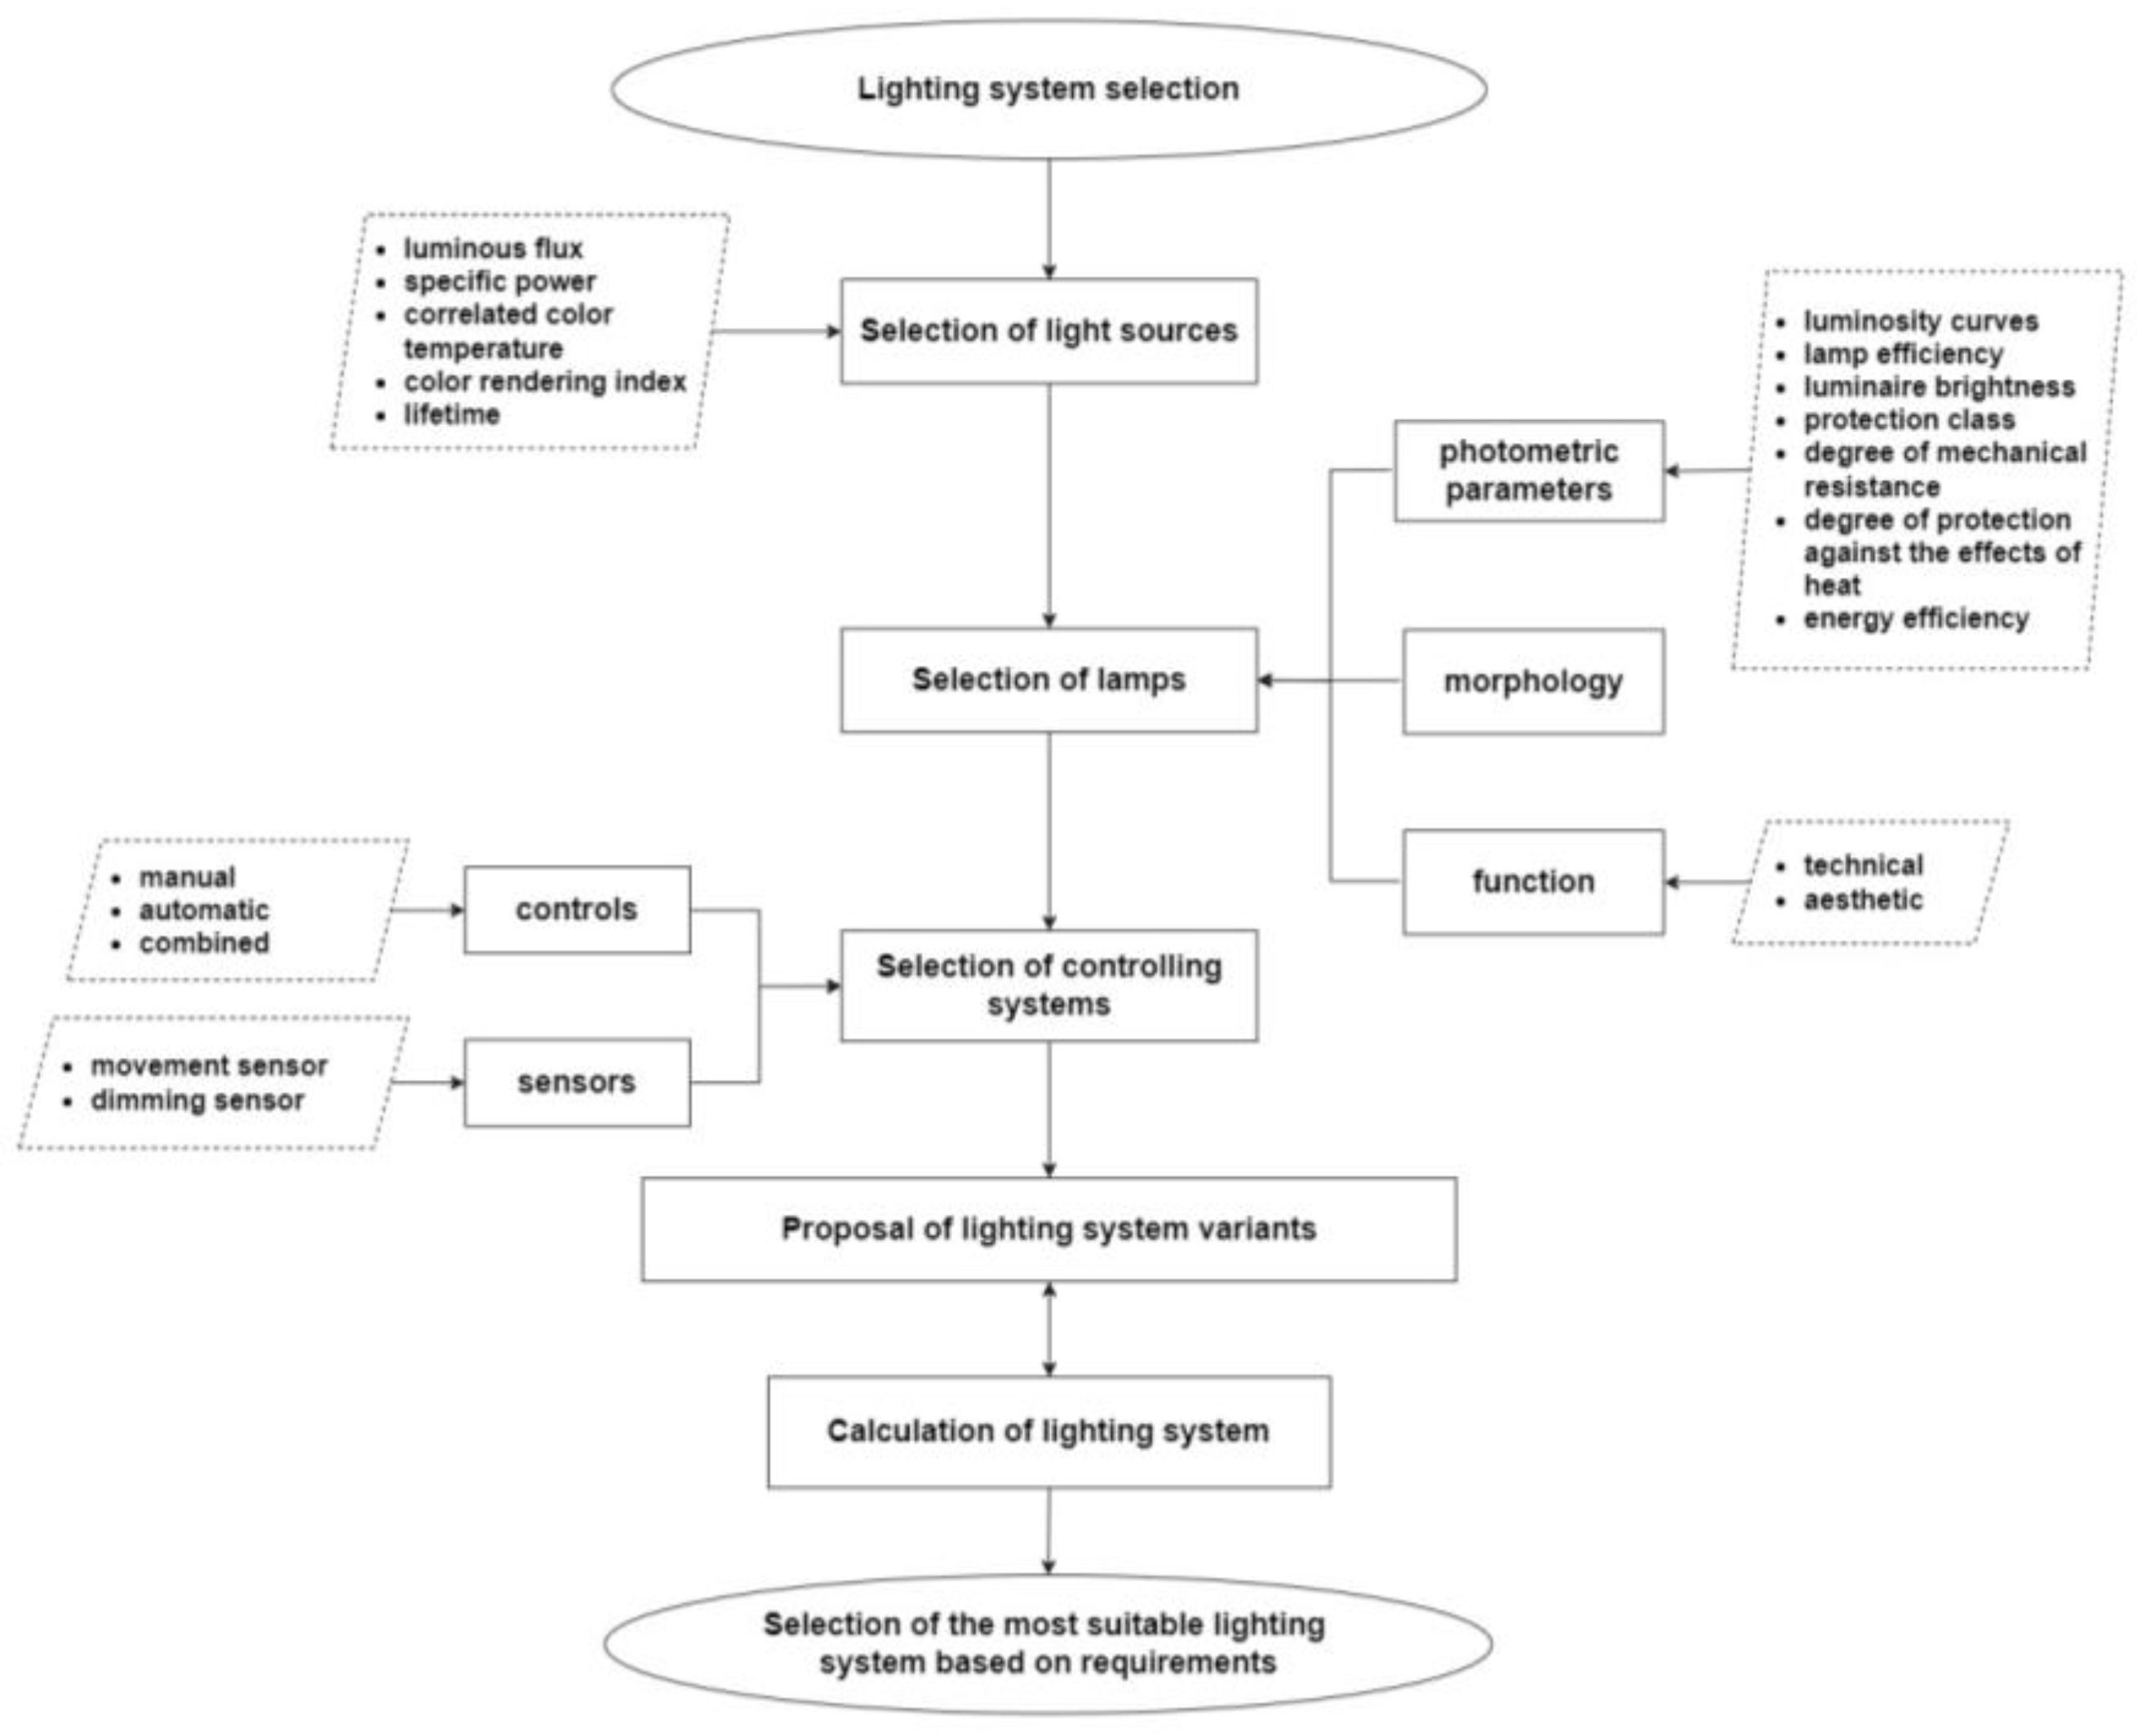
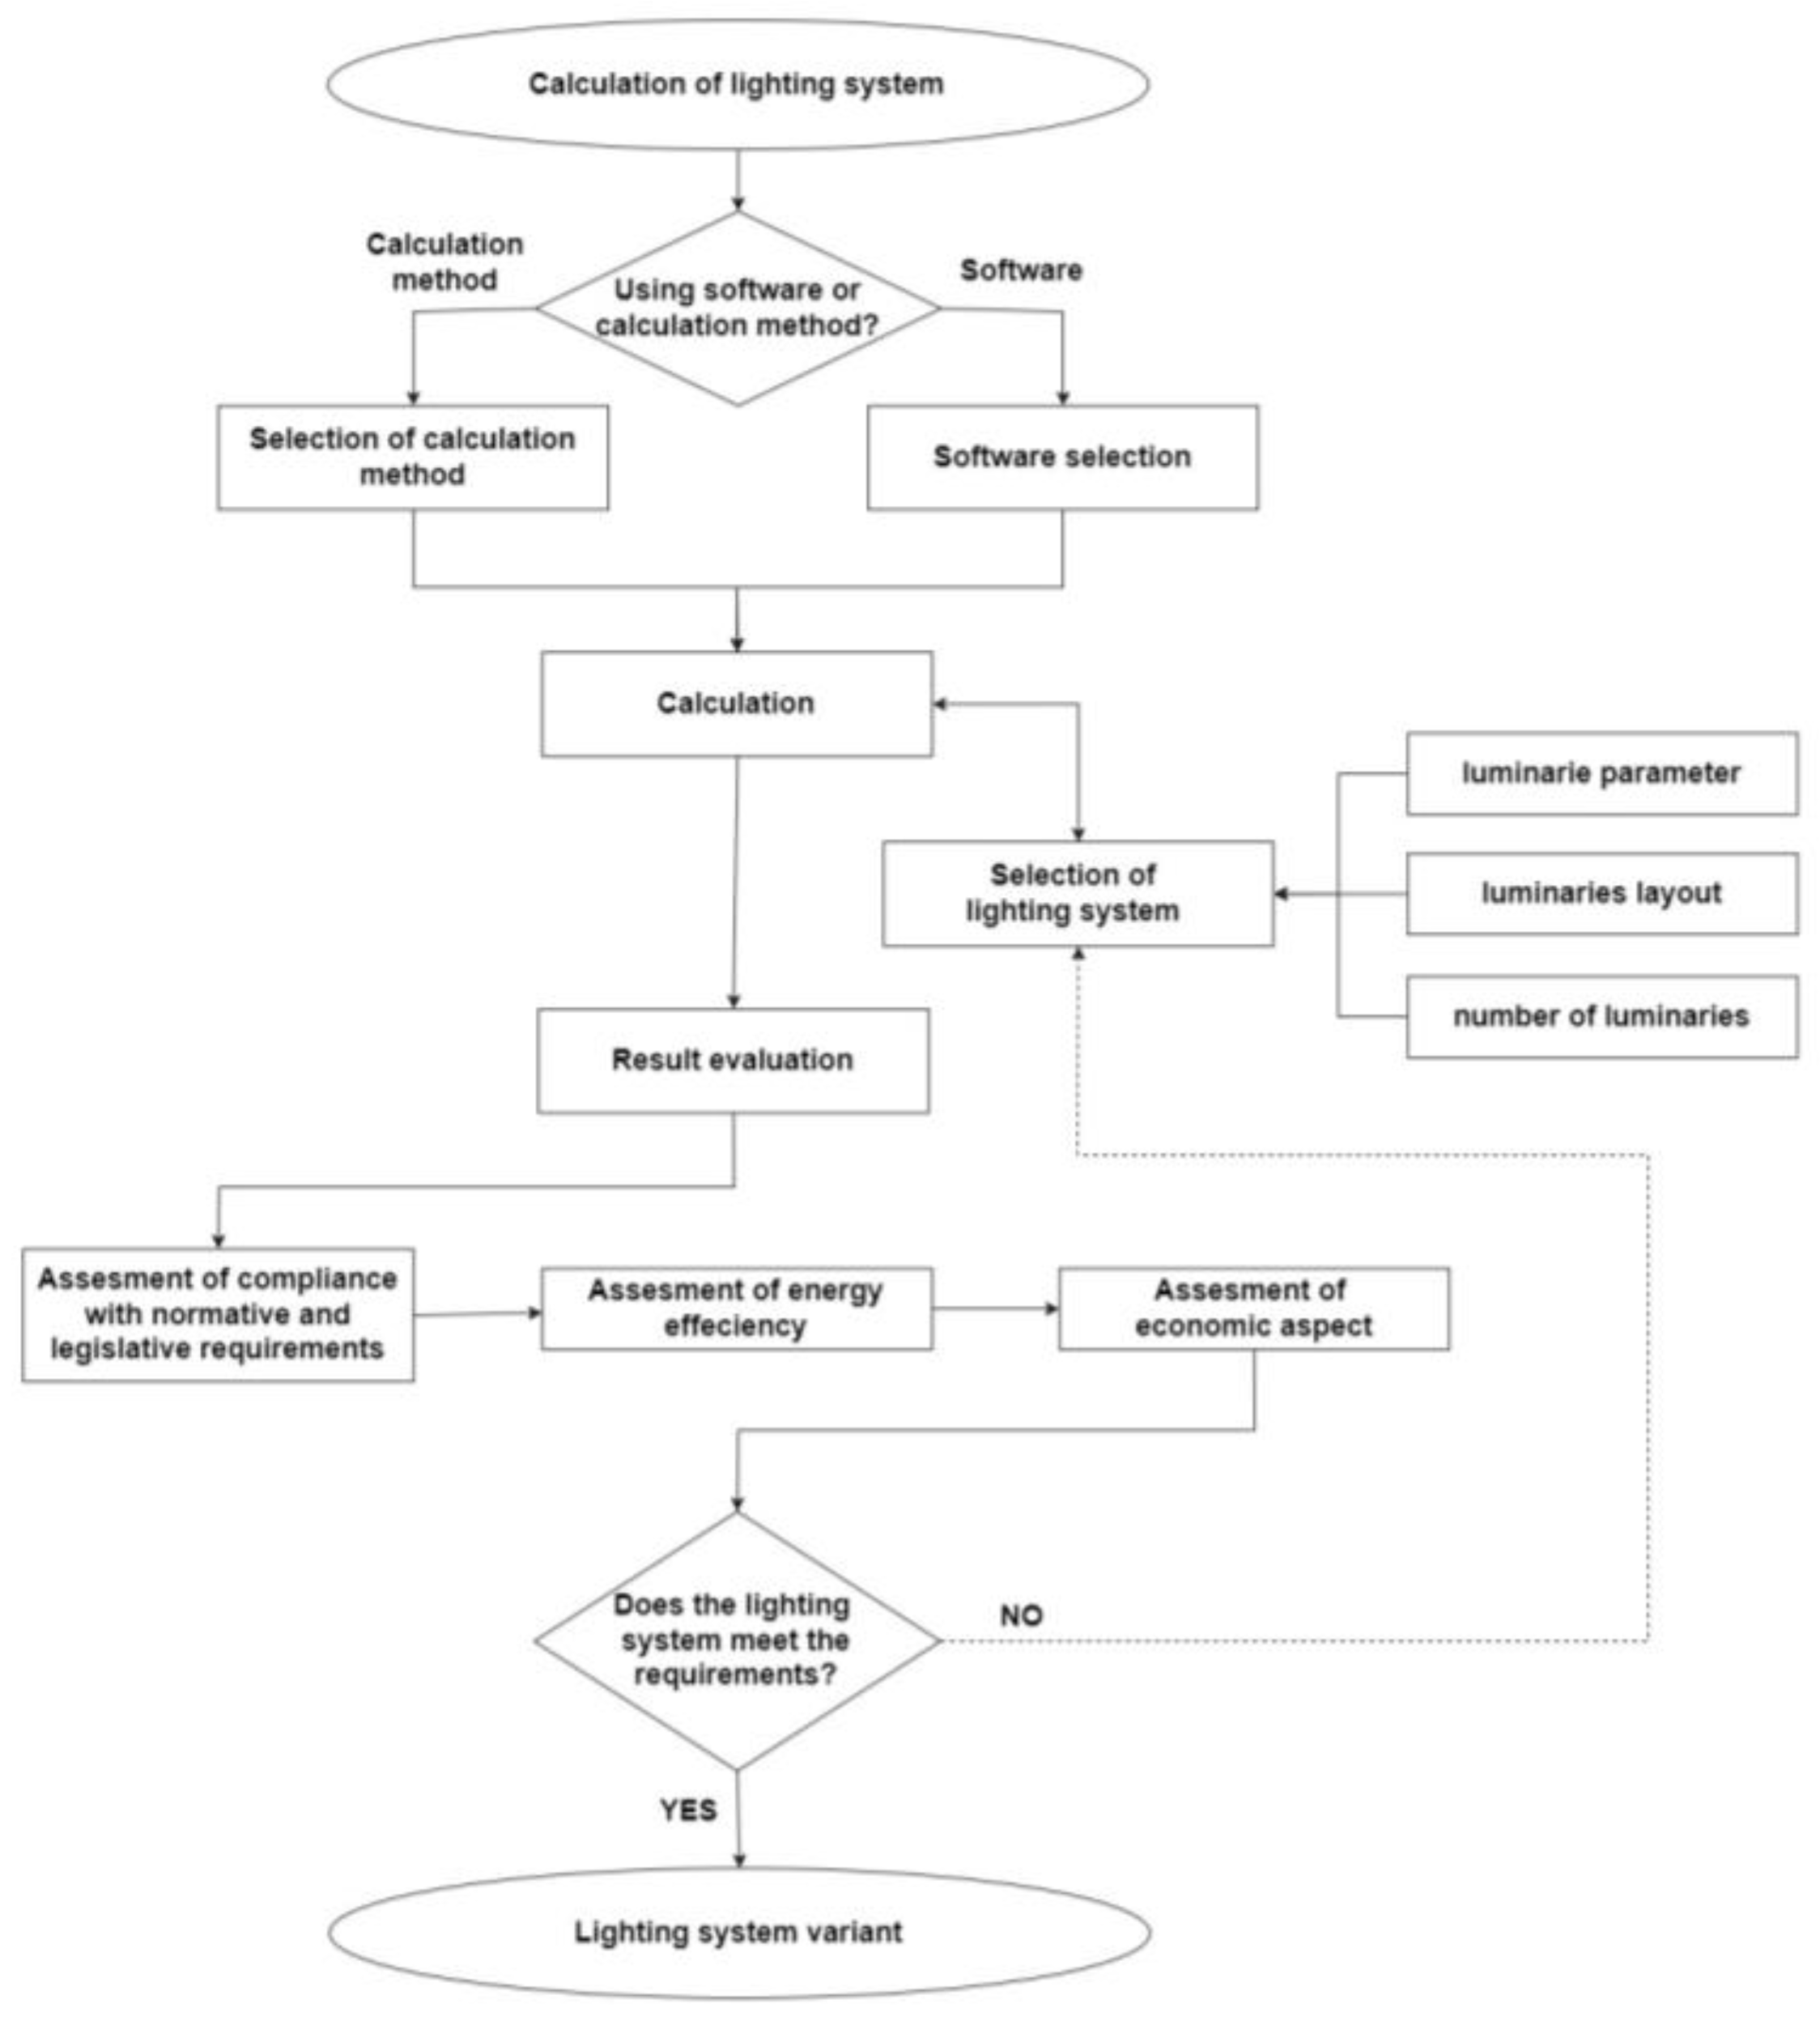
2. Materials and Methods
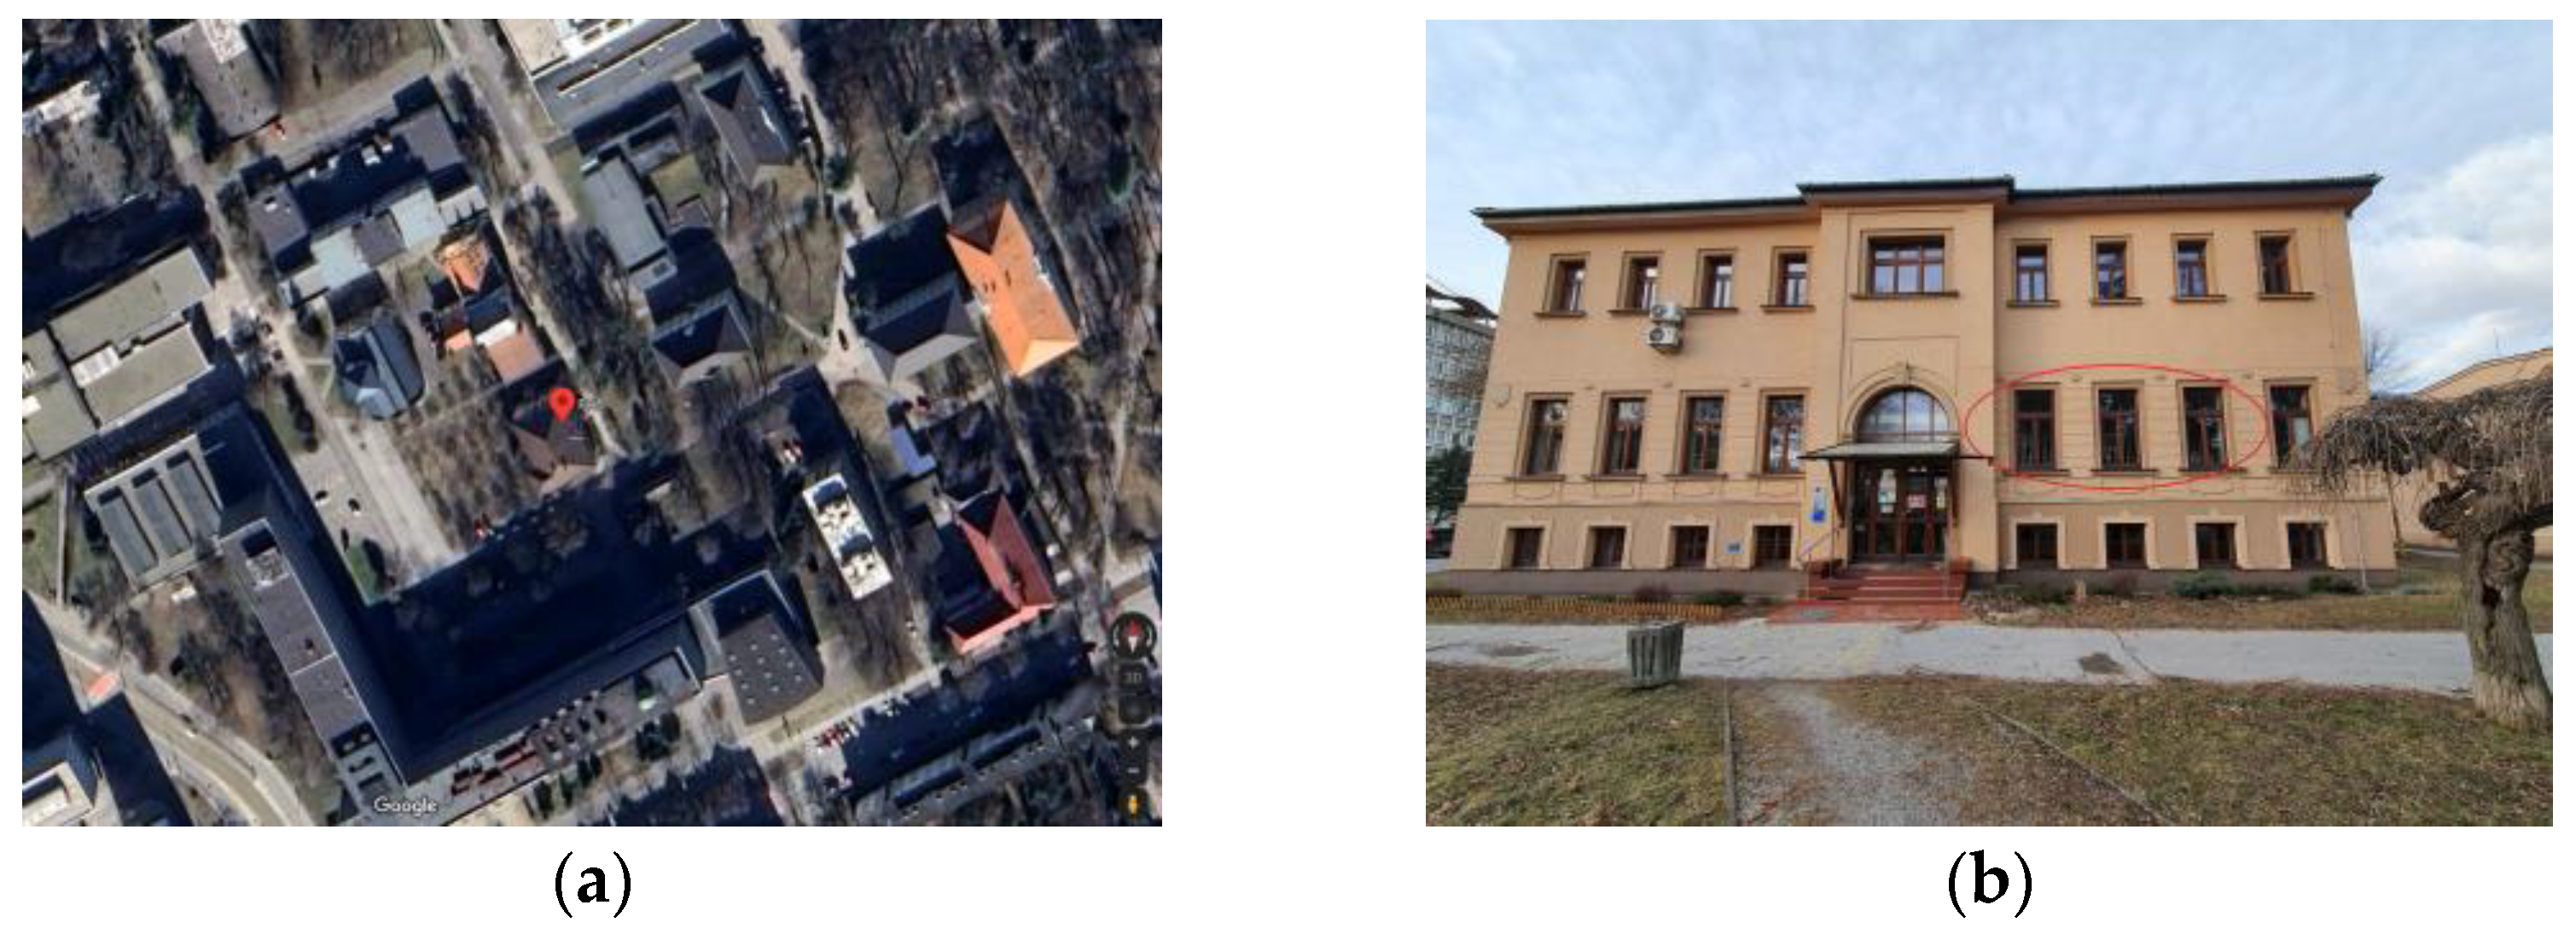
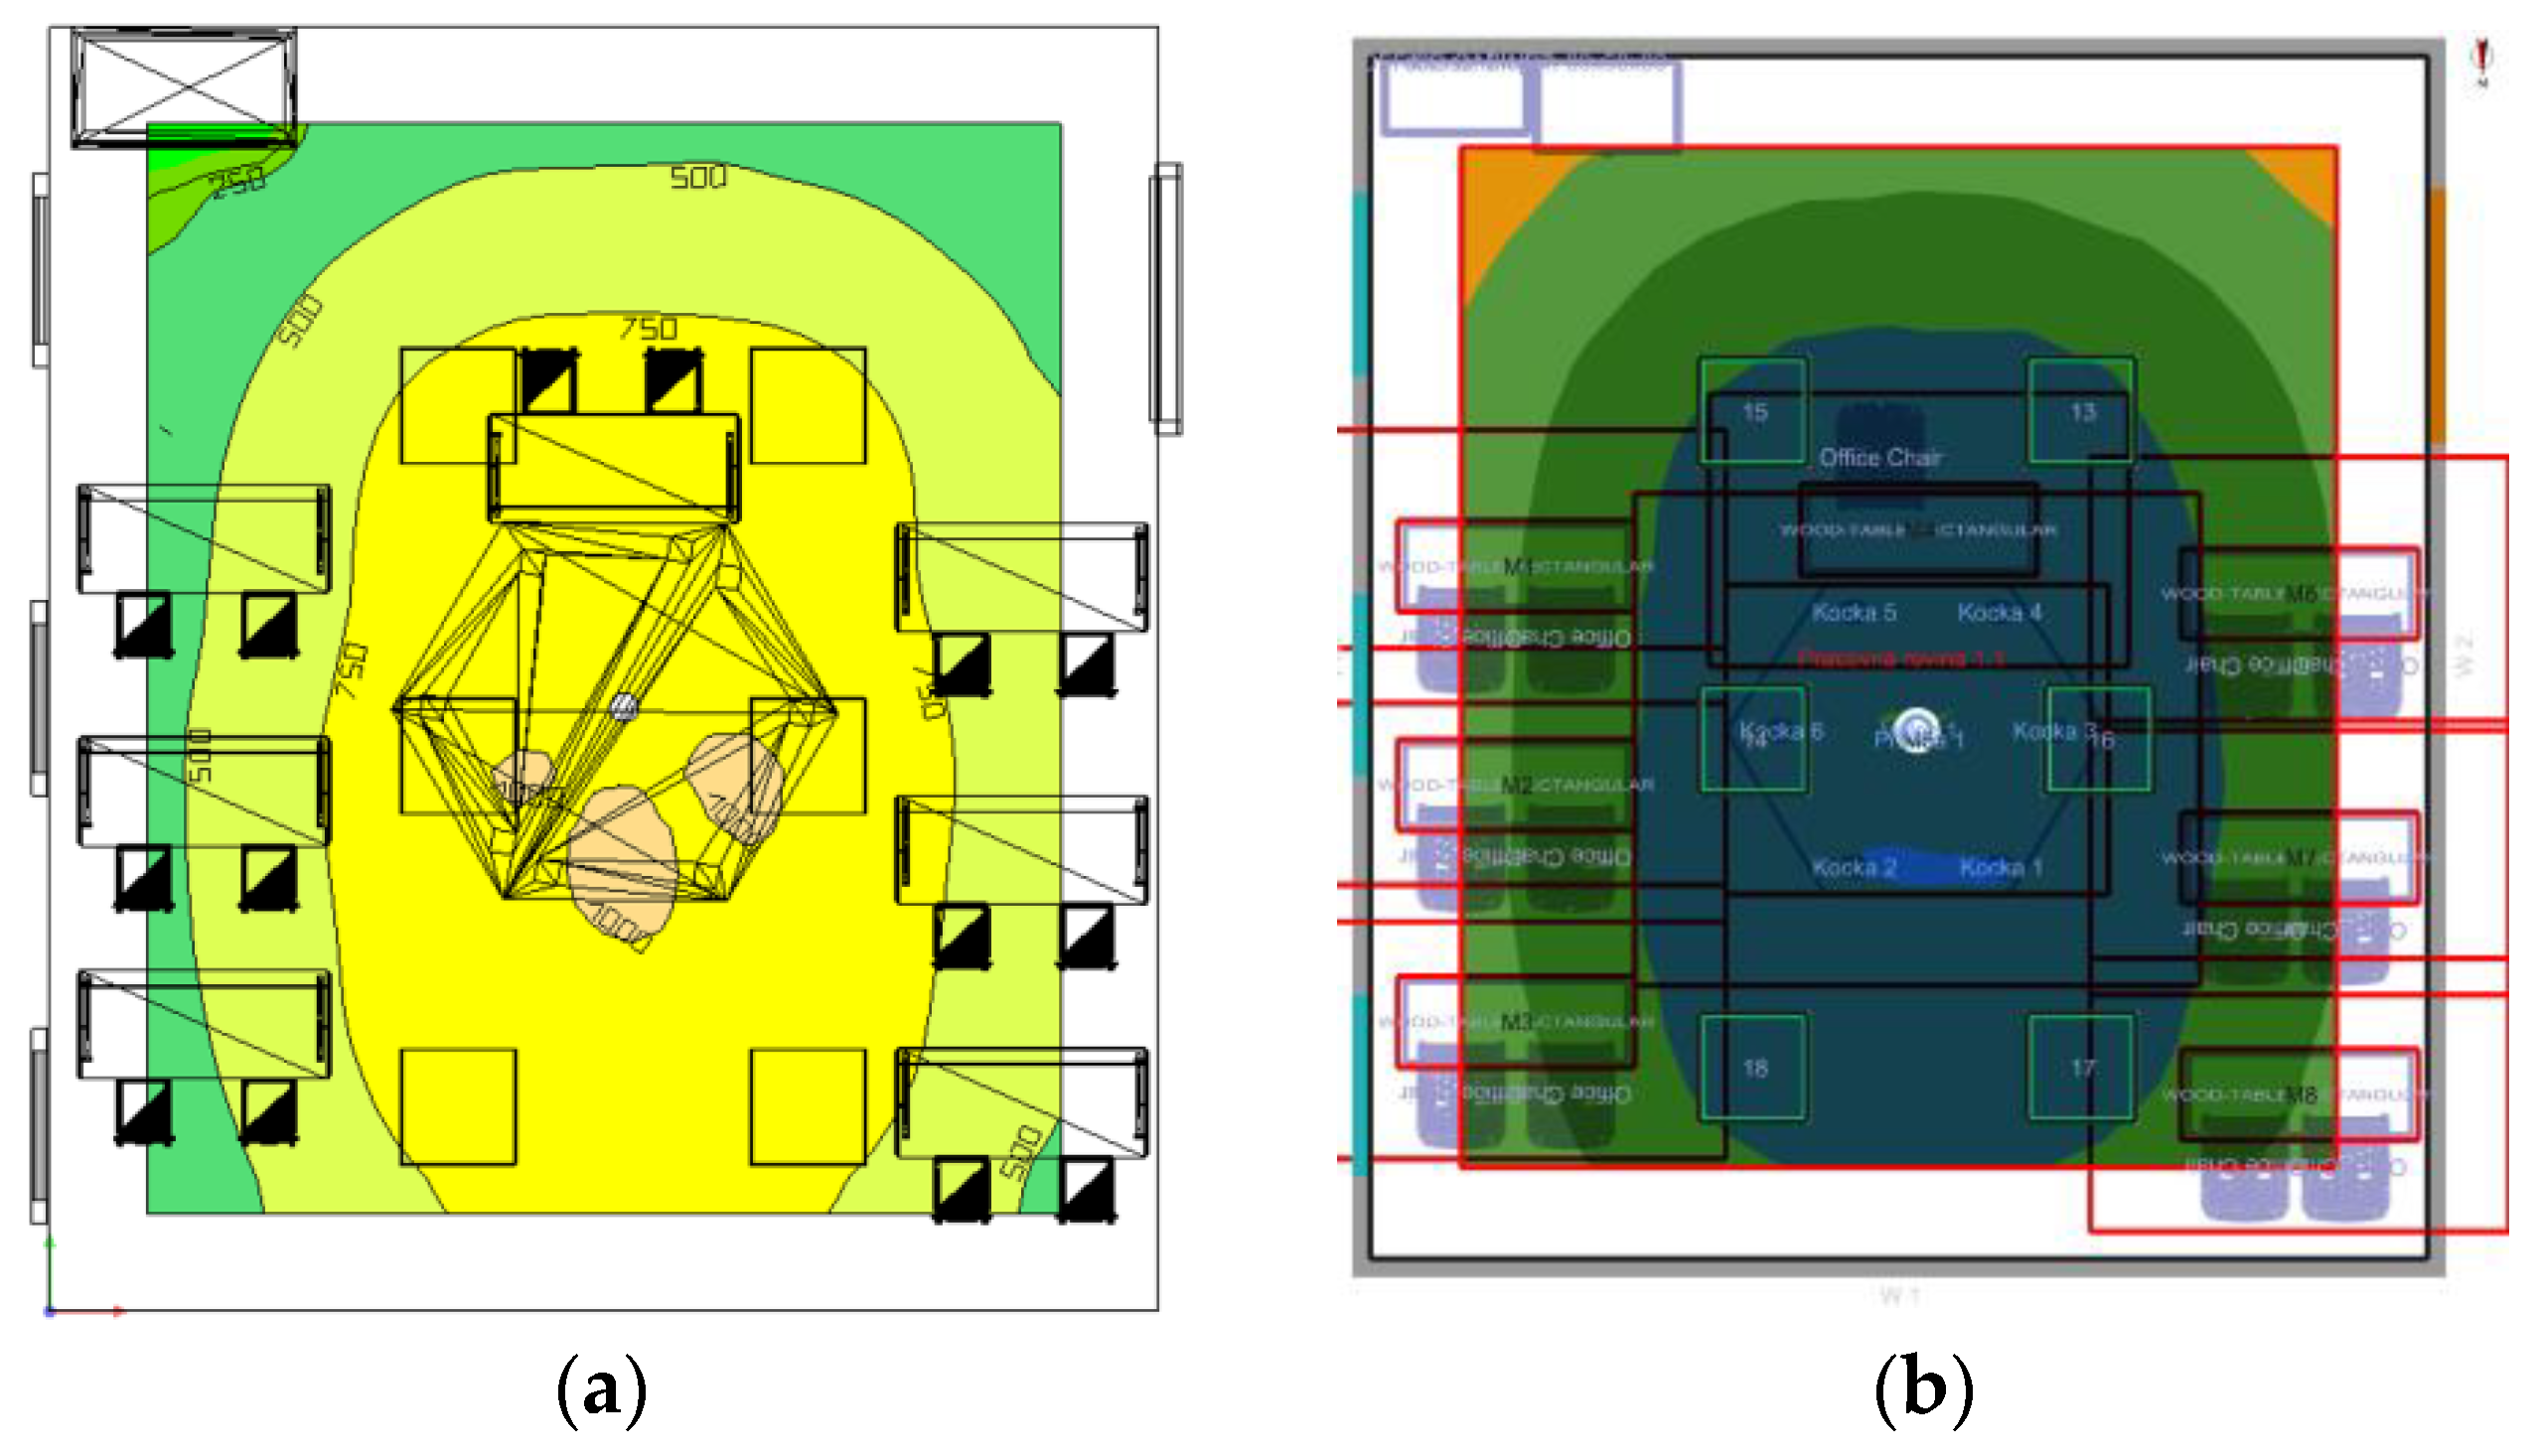
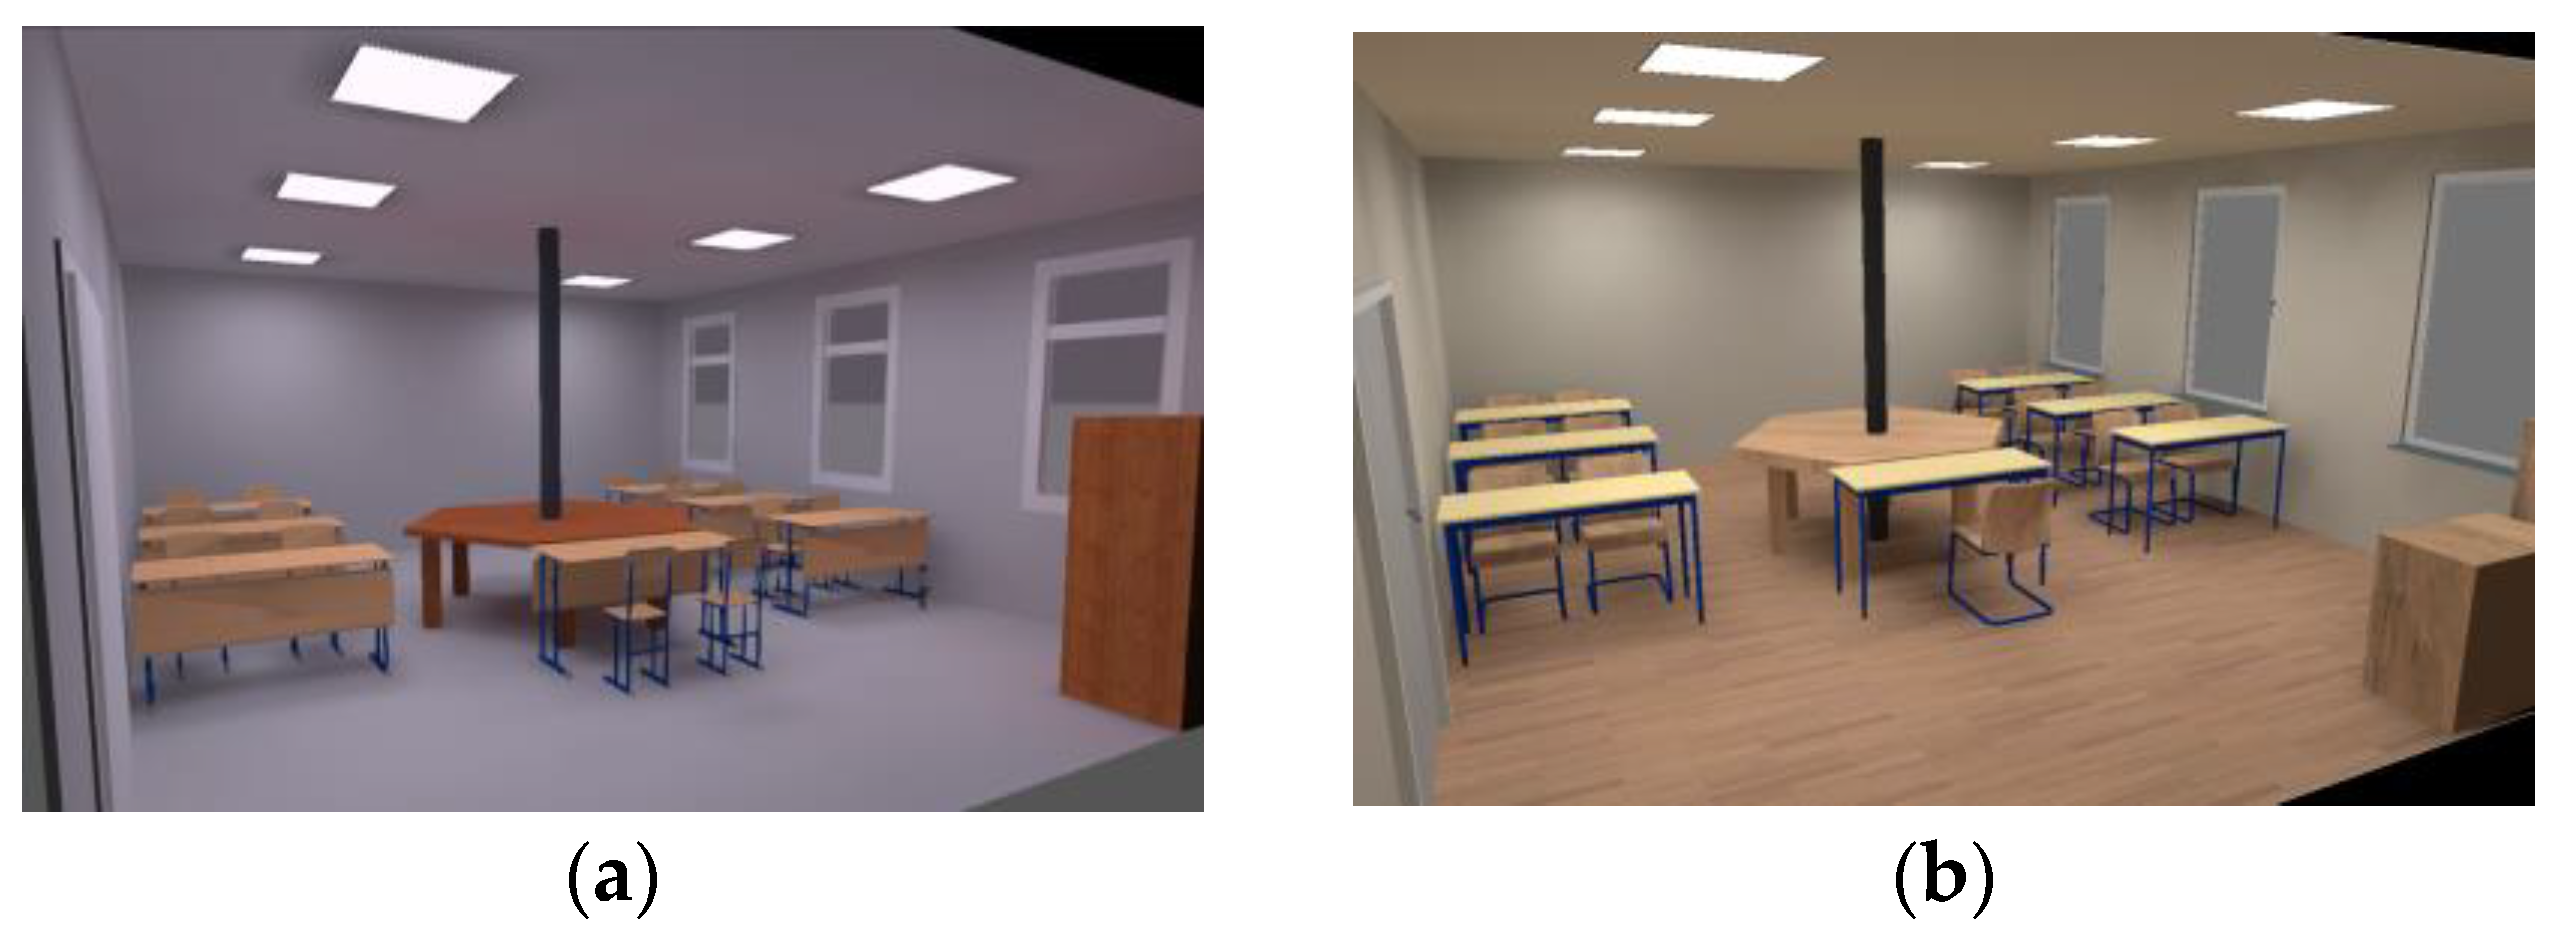
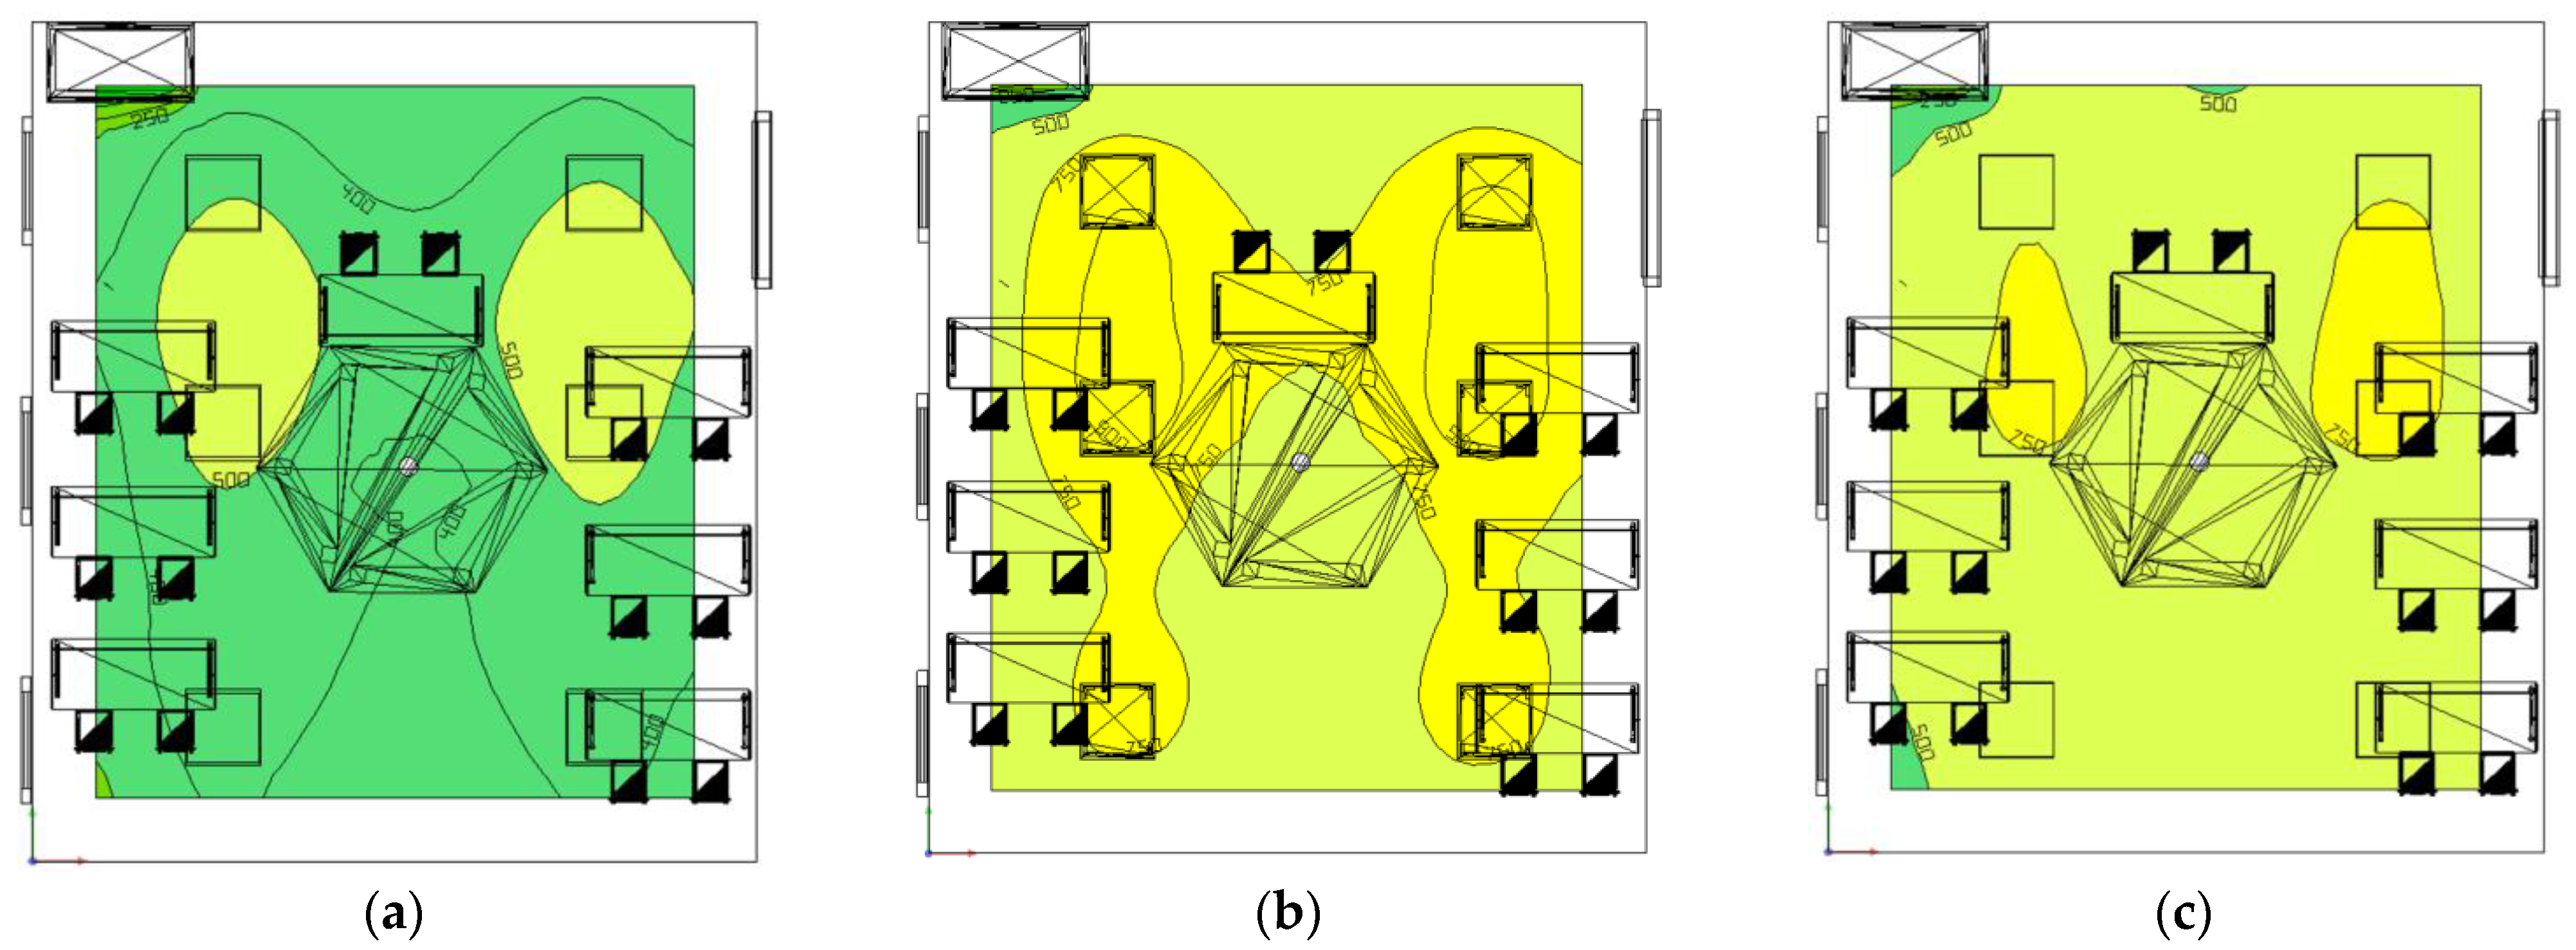
Evaluation of Illuminance in the University Classroom
3. Results
4. Conclusions
- For routine projecting (Light-in-Night, WinELSO, etc.);
- For the general design of lighting systems of any level (DIALux, Relux, etc.);
- For designing the most complex lighting systems, which requires the output of high-quality realistic displays (3D Studio Max, Lightscape, etc.).
Author Contributions
Funding
Informed Consent Statement
Data Availability Statement
Conflicts of Interest
References
- Figueiro, M.G.; Nagare, R.; Price, L. Non-visual effects of light: How to use light to promote circadian entrainment and elicit alertness. Light. Res. Technol. 2018, 50, 38–62. [Google Scholar] [CrossRef] [PubMed]
- Sunde, E.; Pedersen, T.; Mrdalj, J.; Thun, E.; Grønli, J.; Harris, A.; Bjorvatn, B.; Waage, S.; Skene, D.J.; Pallesen, S. Alerting and Circadian Effects of Short-Wavelength vs. Long-Wavelength Narrow-Bandwidth Light during a Simulated Night Shift. Clocks Sleep 2020, 2, 502–522. [Google Scholar] [CrossRef]
- Finger, A.; Kramer, A. Mammalian circadian systems: Organization and modern life challenges. Acta Physiol. 2021, 231, 13548. [Google Scholar] [CrossRef]
- Papatsimpa, C.; Linnartz, J.-P. Personalized Office Lighting for Circadian Health and Improved Sleep. Sensors 2020, 20, 4569. [Google Scholar] [CrossRef]
- Harrison, E.M.; Schmied, E.A.; Easterling, A.P.; Yablonsky, A.M.; Glickman, G.L. A Hybrid Effectiveness-Implementation Study of a Multi-Component Lighting Intervention for Hospital Shift Workers. Int. J. Environ. Res. Public Health 2020, 17, 9141. [Google Scholar] [CrossRef] [PubMed]
- Zhang, R.; Campanella, C.; Aristizabal, S.; Jamrozik, A.; Zhao, J.; Porter, P.; Ly, S.; Bauer, B.A. Impacts of Dynamic LED Lighting on the Well-Being and Experience of Office Occupants. Int. J. Environ. Res. Public Health 2020, 17, 7217. [Google Scholar] [CrossRef]
- Fukumura, Y.E.; Gray, J.M.; Lucas, G.M.; Becerik-Gerber, B.; Roll, S.C. Worker Perspectives on Incorporating Artificial Intelligence into Office Workspaces: Implications for the Future of Office Work. Int. J. Environ. Res. Public Health 2021, 18, 1690. [Google Scholar] [CrossRef] [PubMed]
- Lee, H.; Zhao, X.; Seo, J. A Study of Optimal Specifications for Light Shelves with Photovoltaic Modules to Improve Indoor Comfort and Save Building Energy. Int. J. Environ. Res. Public Health 2021, 18, 2574. [Google Scholar] [CrossRef]
- Juda, M.; Liu-Ambrose, T.; Feldman, F.; Suvagau, C.; Mistlberger, R.E. Light in the Senior Home: Effects of Dynamic and Individual Light Exposure on Sleep, Cognition, and Well-Being. Clocks Sleep 2020, 2, 557–576. [Google Scholar] [CrossRef] [PubMed]
- Schlangen, L.; Price, L. The Lighting Environment, Its Metrology, and Non-visual Responses. Front. Neurol. 2021, 12, 624861. [Google Scholar] [CrossRef]
- Durak, A.; Olguntürk, N.C.; Yener, C.; Güvenç, D.; Gürçınar, Y. Impact of lighting arrangements and illuminances on different impressions of a room. Build. Environ. 2007, 42, 3476–3482. [Google Scholar] [CrossRef]
- Leccese, F.; Salvadori, G.; Rocca, M.; Buratti, C.; Belloni, E. A method to assess lighting quality in educational rooms using analytic hierarchy process. Build. Environ. 2019, 168, 106501. [Google Scholar] [CrossRef]
- Moazzen, N.; Ashrafian, T.; Yilmaz, Z.; Karagüler, M.E. A multi-criteria approach to affordable energy-efficient retrofit of primary school buildings. Appl. Energy 2020, 268, 115046. [Google Scholar] [CrossRef]
- Stabile, L.; Buonanno, G.; Frattolillo, A.; Dell’Isola, M. The effect of the ventilation retrofit in a school on co2, airborne particles, and energy consumptions. Build. Environ. 2019, 156, 1–11. [Google Scholar] [CrossRef]
- Baloch, R.M.; Maesano, C.N.; Christoffersen, J.; Mandin, C.; Csobod, E.; de Oliveira Fernandes, E.; Annesi-Maesano, I.; On Behalf of the SINPHONIE Consortium. Daylight and School Performance in European Schoolchildren. Int. J. Environ. Res. Public Health 2021, 18, 258. [Google Scholar] [CrossRef]
- Peña-García, A.; Salata, F. Indoor Lighting Customization Based on Effective Reflectance Coefficients: A Methodology to Optimize Visual Performance and Decrease Consumption in Educative Workplaces. Sustainability 2021, 13, 119. [Google Scholar] [CrossRef]
- Michael, A.; Heracleous, C. Assessment of natural lighting performance and visual comfort of educational architecture in Southern Europe: The case of typical educational school premises in Cyprus. Energy Build. 2017, 140, 443–457. [Google Scholar] [CrossRef]
- Doulos, L.T.; Kontadakis, A.; Madias, E.N.; Sinou, M.; Tsangrassoulis, A. Minimizing energy consumption for artificial lighting in a typical classroom of a Hellenic public school aiming for near Zero Energy Building using LED DC luminaires and daylight harvesting systems. Energy Build. 2019, 194, 201–217. [Google Scholar] [CrossRef]
- Wan, S.; Ding, G.; Runeson, G.; Liu, Y. Sustainable Buildings’ Energy-Efficient Retrofitting: A Study of Large Office Buildings in Beijing. Sustainability 2022, 14, 1021. [Google Scholar] [CrossRef]
- Ahn, B.-L.; Jang, C.-Y.; Leigh, S.-B.; Yoo, S.; Jeong, H. Effect of LED lighting on the cooling and heating loads in office buildings. Appl. Energy 2014, 113, 1484–1489. [Google Scholar] [CrossRef]
- Khan, N.; Abas, N. Comparative study of energy saving light sources. Renew. Sustain. Energy Rev. 2011, 15, 296–309. [Google Scholar] [CrossRef]
- Ahmad, A.; Kumar, A.; Prakash, O.; Aman, A. Daylight availability assessment and the application of energy simulation software–A literature review. Mater. Sci. Energy Technol. 2020, 3, 679–689. [Google Scholar] [CrossRef]
- Zauner, J.; Plischke, H. Designing Light for Night Shift Workers: Application of Nonvisual Lighting Design Principles in an Industrial Production Line. Appl. Sci. 2021, 11, 10896. [Google Scholar] [CrossRef]
- Dupláková, D.; Hatala, M.; Duplák, J.; Knapčíková, L.; Radchenko, S. Illumination simulation of working environment during the testing of cutting materials durability. Ain. Shams Eng. J. 2019, 10, 161–169. [Google Scholar] [CrossRef]
- Roy, S.; Majumder, S.; Bhattacharya, S.; Sardar, I.H. Simulation and analysis of the effects of room surface reflectance combinations on a proposed retrofit illumination system of an office. J. Eng. Des. Technol. 2020, 19, 1620–1647. [Google Scholar] [CrossRef]
- Tabaka, P. Influence of Replacement of Sodium Lamps in Park Luminaires with LED Sources of Different Closest Color Temperature on the Effect of Light Pollution and Energy Efficiency. Energies 2021, 14, 6383. [Google Scholar] [CrossRef]
- Rusu, A.V.; Galatanu, C.D.; Livint, G.; Lucache, D.D. Average Luminance Calculation in Street Lighting Design, Comparison between BS-EN 13201 and RP-08 Standards. Sustainability 2021, 13, 10143. [Google Scholar] [CrossRef]
- Sielachowska, M.; Tyniecki, D.; Zajkowski, M. Measurements of the Luminance Distribution in the Classroom Using the SkyWatcher Type System. In Proceedings of the 2018 VII. Lighting Conference of the Visegrad Countries (Lumen V4), Trebic, Czech Republic, 18–20 September 2018; pp. 1–5. [Google Scholar] [CrossRef]
- Perdahci, C.; Akin, H.C.; Cekic, O. A comparative study of fluorescent and LED lighting in industrial facilities. IOP Conf. Ser. Earth Environ. Sci. 2018, 154, 012010. [Google Scholar] [CrossRef]
- Decree No. 206/2011 Coll. and Decree No. 541/2007 Coll. on Details of Lighting Requirements at Work. Ministry of the Health of the Slovak Republic. Available online: https://www.slov-lex.sk/pravne-predpisy (accessed on 19 October 2021).
- Dialux Software Website. Available online: https://www.dial.de/en/dialux/ (accessed on 20 October 2021).
- Relux Software Website. Available online: https://reluxnet.relux.com/en/ (accessed on 21 October 2021).
- UNI EN 12464-1:2011; The Lighting of Work Places—Part 1: Indoor Work Places. UNI: Milan, Italy, 2011. Available online: https://www.ahjzu.edu.cn/_upload/article/files/50/b5/4e0248ef47278e4dead0447bd16a/89a6cb4c-2303-42e6-97a3-34d8adc7a5eb.pdf (accessed on 19 October 2021).
- Odiyur Vathanam, G.S.; Kalyanasundaram, K.; Elavarasan, R.M.; Hussain Khahro, S.; Subramaniam, U.; Pugazhendhi, R.; Ramesh, M.; Gopalakrishnan, R.M. A Review on Effective Use of Daylight Harvesting Using Intelligent Lighting Control Systems for Sustainable Office Buildings in India. Sustainability 2021, 13, 4973. [Google Scholar] [CrossRef]
- Llinares, C.; Castilla, N.; Higuera-Trujillo, J.L. Do Attention and Memory Tasks Require the Same Lighting? A Study in University Classrooms. Sustainability 2021, 13, 8374. [Google Scholar] [CrossRef]


| DIALux Evo 10.1 | ReluxDesktop v. 2021.1.1.0 | |
|---|---|---|
| Operating system | Windows 8.1/10 (32/64 bit) | Windows 10 |
| Graphics Cards | Minimum 1 GB Optimum 2 GB and more | Minimum 1 GB Optimum 4 GB and more |
| OpenGL | Version 3.2 | Version 4.5 |
| RAM | Minimum: 4 GB Optimum: 8 to 16 GB | Minimum: 8 GB Optimum: 16 GB |
| Processor (CPU) | Optimum: 4 cores and more | Minimum: 4 cores, 2 GHz Optimum: 8 cores and more |
| Type of Area, Task or Activity | Ēm [lx] | UGRL [-] | Uo [-] |
|---|---|---|---|
| Classrooms for evening classes and adult education | 500 | 19 | 0.60 |
| Measuring Points | Measured Illuminance E [lx] | Measuring Points | Measured Illuminance E [lx] | ||||||||
|---|---|---|---|---|---|---|---|---|---|---|---|
| M 1 | 338.1 | 338.3 | 338.2 | 338.9 | 338.8 | M 7 | 672.1 | 671.3 | 671.1 | 672 | 672.6 |
| M 2 | 364.1 | 343.2 | 363.8 | 363.4 | 363.3 | M 8 | 572.3 | 573.4 | 572.9 | 575.3 | 572.5 |
| M 3 | 366.8 | 367.1 | 367.6 | 368 | 368.2 | M 9 | 345.1 | 345.7 | 345.8 | 345.5 | 345.4 |
| M 4 | 345.6 | 445.1 | 345.8 | 345.7 | 341.1 | M 10 | 497.3 | 497.2 | 496.2 | 496.4 | 495.7 |
| M 5 | 463.6 | 464.4 | 464 | 464.8 | 468.7 | M 11 | 481.3 | 481.2 | 480.9 | 482 | 481.6 |
| M 6 | 626.1 | 625.4 | 626.3 | 626.4 | 625.9 | M 12 | 387.9 | 387.3 | 387.5 | 387.9 | 387.2 |
| Task Area | Measured Illuminance E [lx] | Task Area | Measured Illuminance E [lx] | ||||||||
|---|---|---|---|---|---|---|---|---|---|---|---|
| TA 1 | 397 | 396.8 | 395.9 | 396.5 | 396.4 | 628.3 | 628.1 | 628.5 | 629.3 | 629.4 | |
| 310.1 | 310.3 | 310 | 310.2 | 309.8 | TA 5 | 678.5 | 678.9 | 677.8 | 677.5 | 678.2 | |
| 258.7 | 259.2 | 258.4 | 259.3 | 258.1 | 657.2 | 657.8 | 658.4 | 658.6 | 657.9 | ||
| TA 2 | 260.2 | 260.1 | 260.3 | 260.8 | 260.9 | 436.5 | 436.6 | 436.2 | 435.9 | 435.8 | |
| 317.8 | 317 | 316.7 | 316.9 | 317.5 | TA 6 | 357.5 | 357.1 | 356.8 | 356.6 | 357.3 | |
| 400.9 | 401.4 | 400.4 | 401.2 | 400.9 | 284.1 | 284.4 | 284.6 | 283.8 | 283.9 | ||
| TA 3 | 254.2 | 254.1 | 254.3 | 254.7 | 253.9 | 445.2 | 445.8 | 446.1 | 445.3 | 445 | |
| 315.5 | 315.4 | 315.8 | 316.1 | 316.2 | TA 7 | 365.9 | 366.3 | 366.4 | 365.8 | 367 | |
| 392.5 | 392.8 | 393.3 | 393.2 | 392.7 | 294.8 | 294.9 | 295.1 | 295 | 294.5 | ||
| TA 4 | 611.8 | 612.4 | 611.8 | 611.9 | 612.3 | 397.8 | 397.5 | 397.9 | 398.1 | 397.3 | |
| 608.1 | 607.6 | 607.2 | 607.1 | 608.2 | TA 8 | 317 | 317.8 | 318.4 | 318.2 | 318.1 | |
| 593.7 | 593.5 | 593.8 | 593.5 | 592.9 | 249.9 | 249 | 249.1 | 249.2 | 249.5 | ||
| Luminaire Data | Sylvania Octa Satinized Louvre | LICHT + RAUM Rho-Rho Direkt |
|---|---|---|
| Electric power-P [W] | 104 | 98 |
| Luminous flux-Φ [lm] | 3475 | 3338 |
| Luminous efficacy [lm/W] | 33.4 | 34.1 |
| CCT [K] | 4000 | 4000 |
| CRI | 83 | >90 |
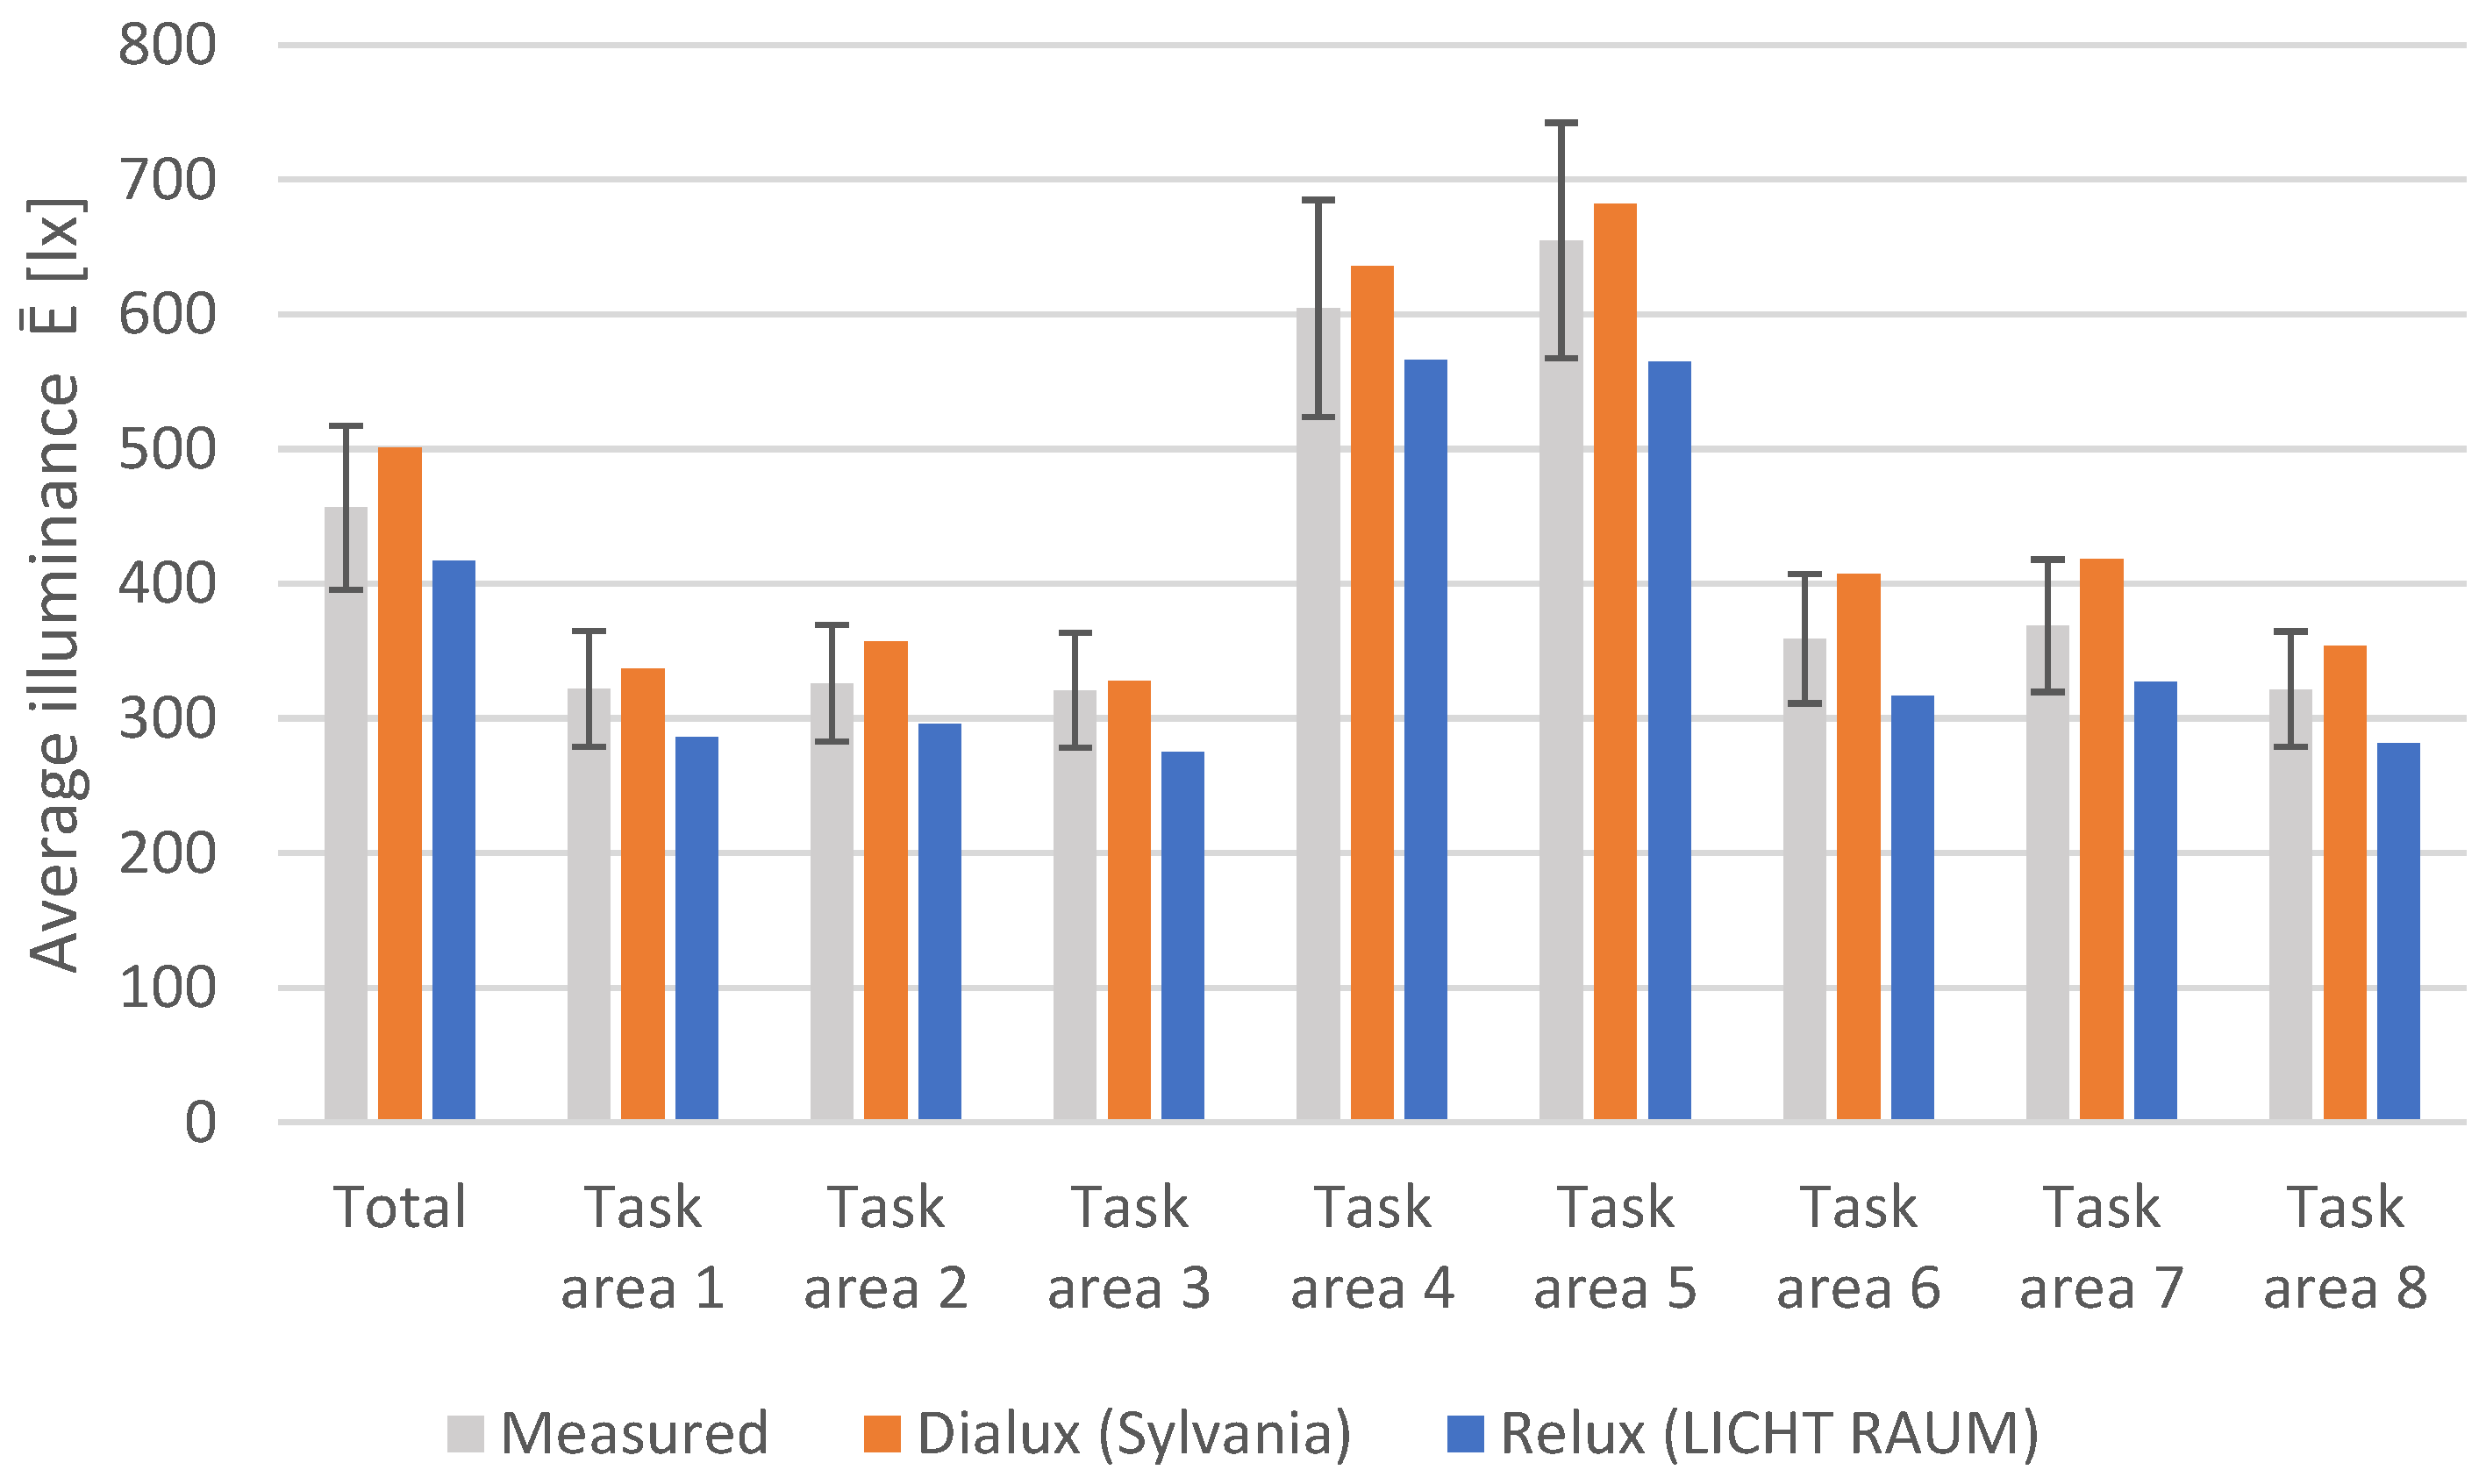
| Illuminance | Measurement | DIALux Sylvania | Relux LICHT RAUM |
|---|---|---|---|
| Ē ± U * [lx] | Ē [lx] | Ē [lx] | |
| Total | 456.46 ± 60.89 | 501 | 417 |
| Task area 1 | 321.78 ± 42.93 | 337 | 286 |
| Task area 2 | 326.20 ± 43.52 | 357 | 296 |
| Task area 3 | 320.98 ± 42.82 | 328 | 275 |
| Task area 4 | 604.39 ± 80.63 | 636 | 566 |
| Task area 5 | 654.96 ± 87.37 | 682 | 565 |
| Task area 6 | 359.14 ± 47.91 | 407 | 317 |
| Task area 7 | 368.87 ± 49.21 | 418 | 327 |
| Task area 8 | 321.65 ± 42.91 | 354 | 282 |
| Luminaire Data | Glamox C63-R | RZB Parledo |
|---|---|---|
| Electric power-P [W] | 46 | 40 |
| Luminous flux-Φ [lm] | 5913 | 5600 |
| Luminous efficacy [lm/W] | 128.5 | 140 |
| CCT [K] | 4000 | 4000 |
| CRI | >80 | 80 |
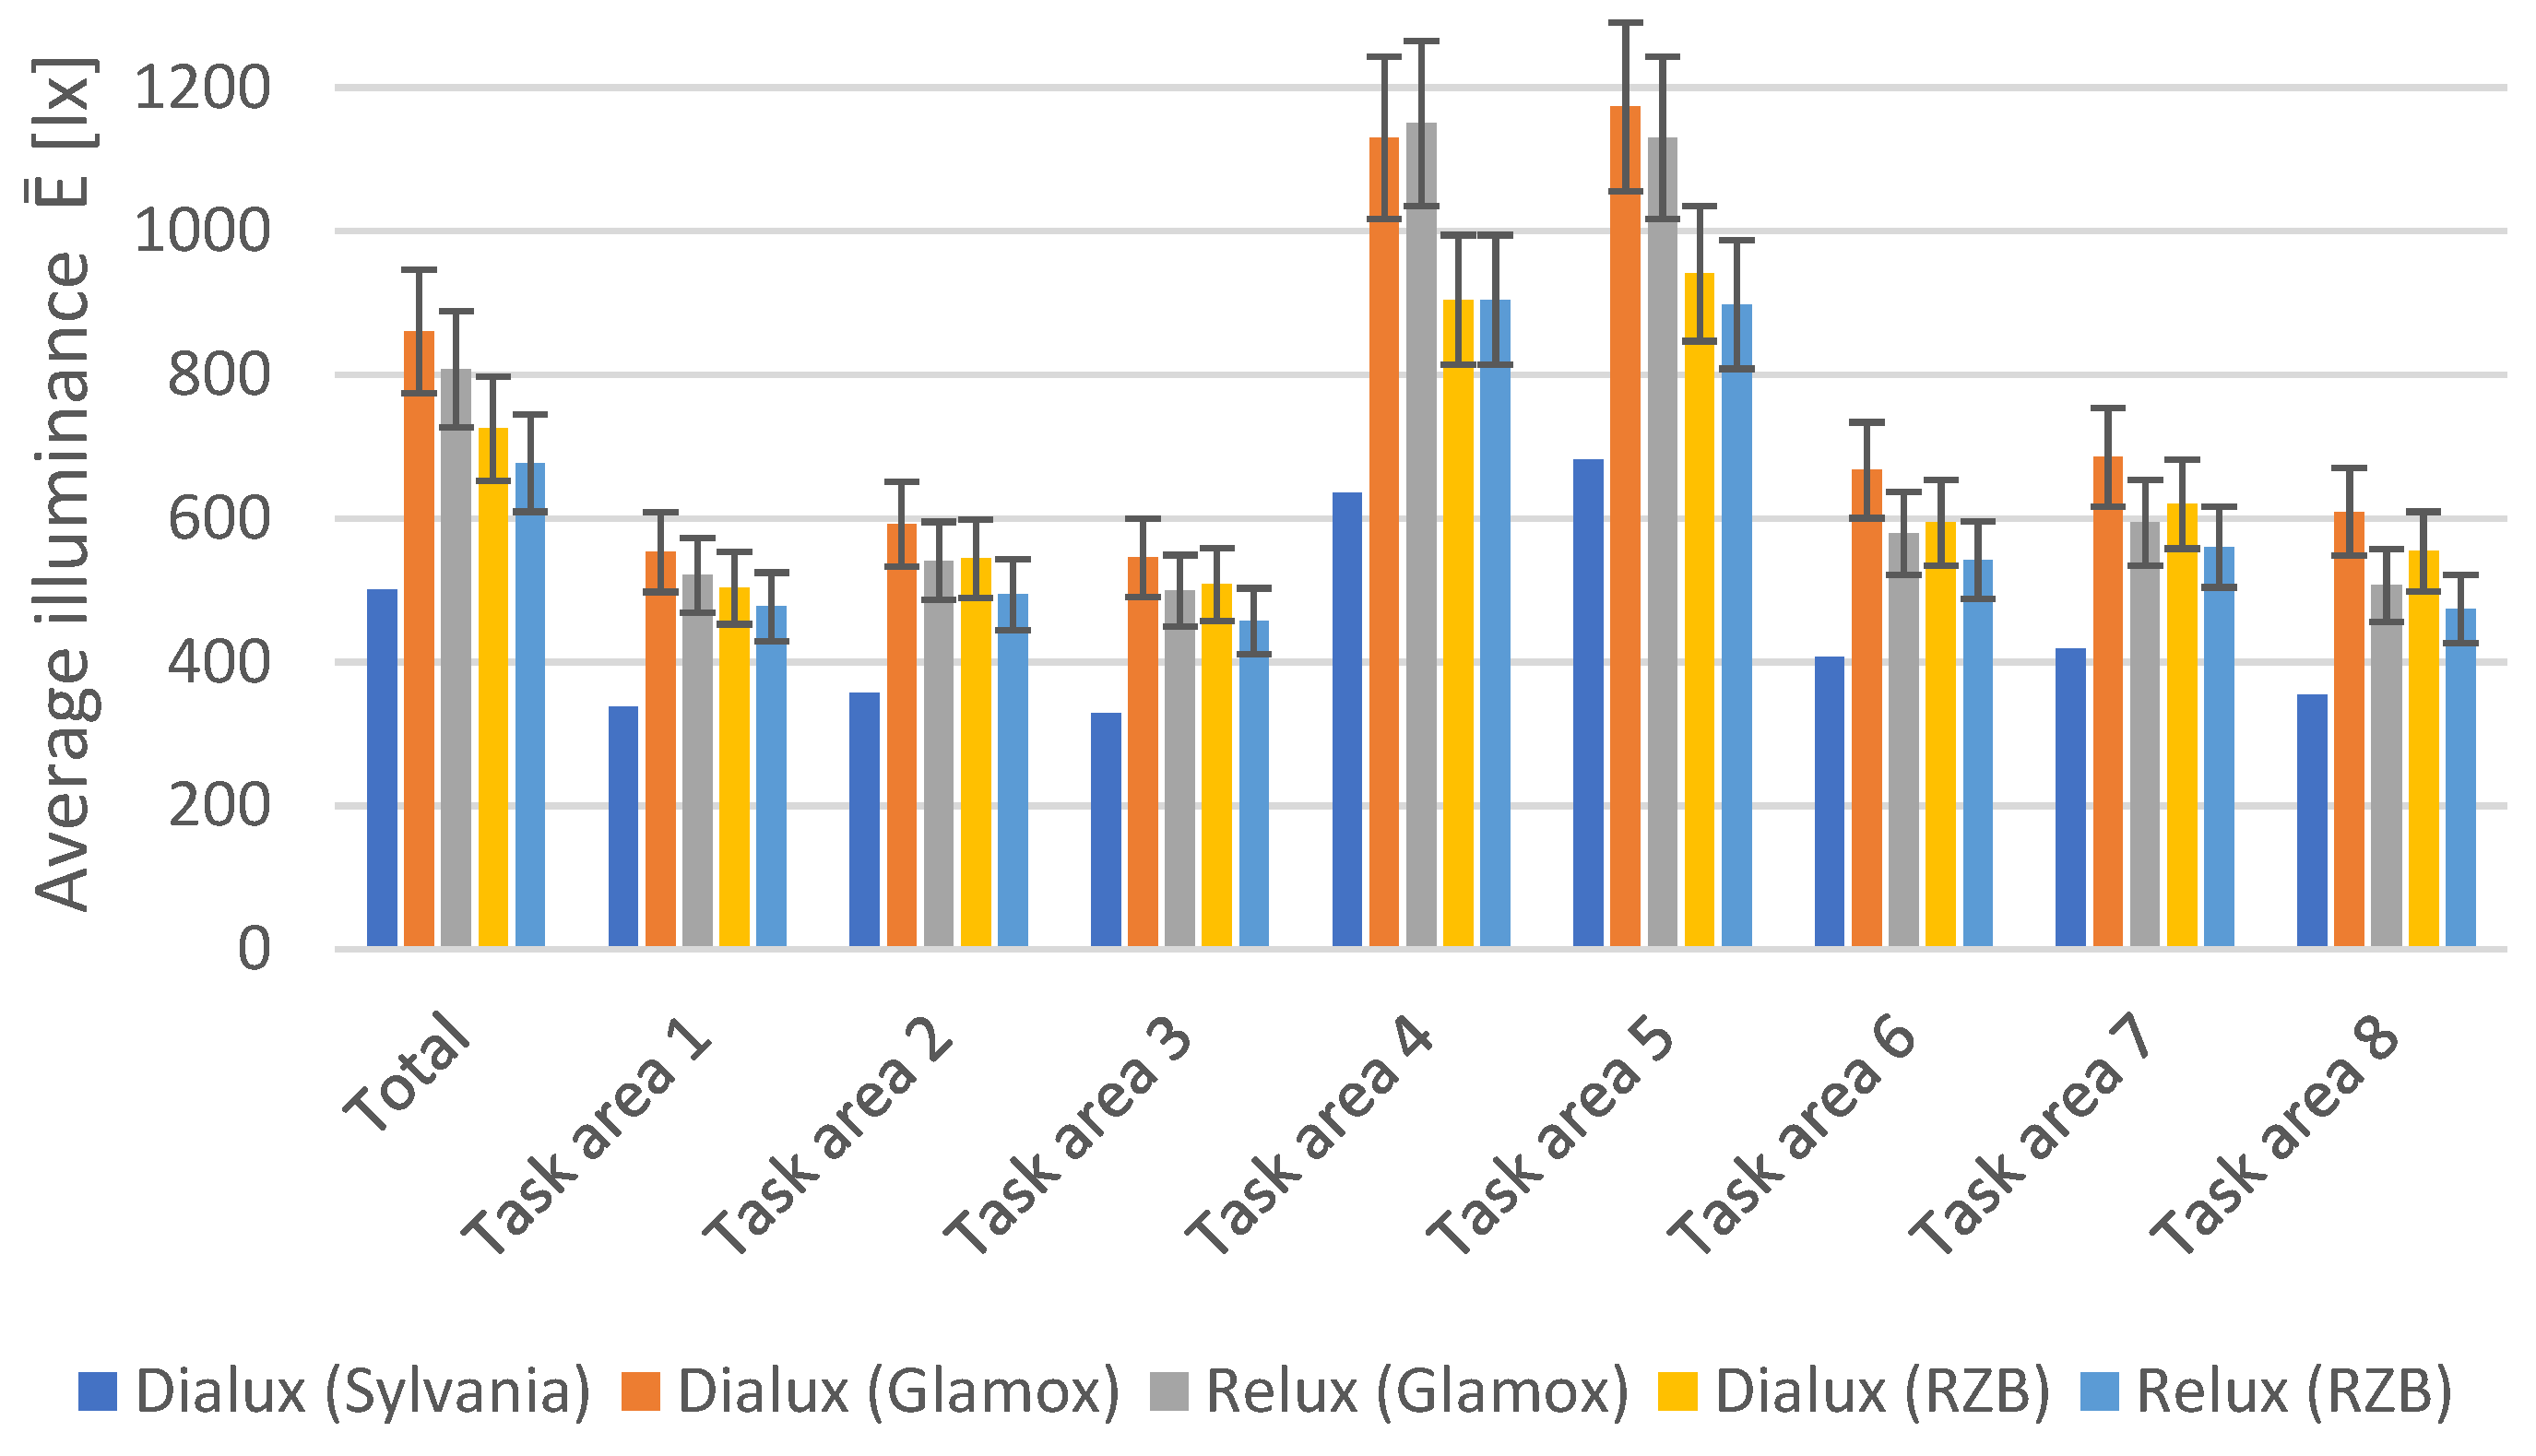
| Illuminance | DIALux Sylvania | DIALux Glamox | Relux Glamox | DIALux RZB | Relux RZB |
|---|---|---|---|---|---|
| Ē * [lx] | Ē [lx] | Ē [lx] | Ē [lx] | Ē [lx] | |
| Total | 501 | 860 | 808 | 725 | 677 |
| Task area 1 | 337 | 553 | 521 | 503 | 477 |
| Task area 2 | 357 | 592 | 541 | 544 | 494 |
| Task area 3 | 328 | 545 | 499 | 508 | 457 |
| Task area 4 | 636 | 1130 | 1150 | 904 | 904 |
| Task area 5 | 682 | 1173 | 1130 | 941 | 898 |
| Task area 6 | 407 | 667 | 579 | 594 | 542 |
| Task area 7 | 418 | 685 | 594 | 620 | 560 |
| Task area 8 | 354 | 609 | 507 | 554 | 474 |
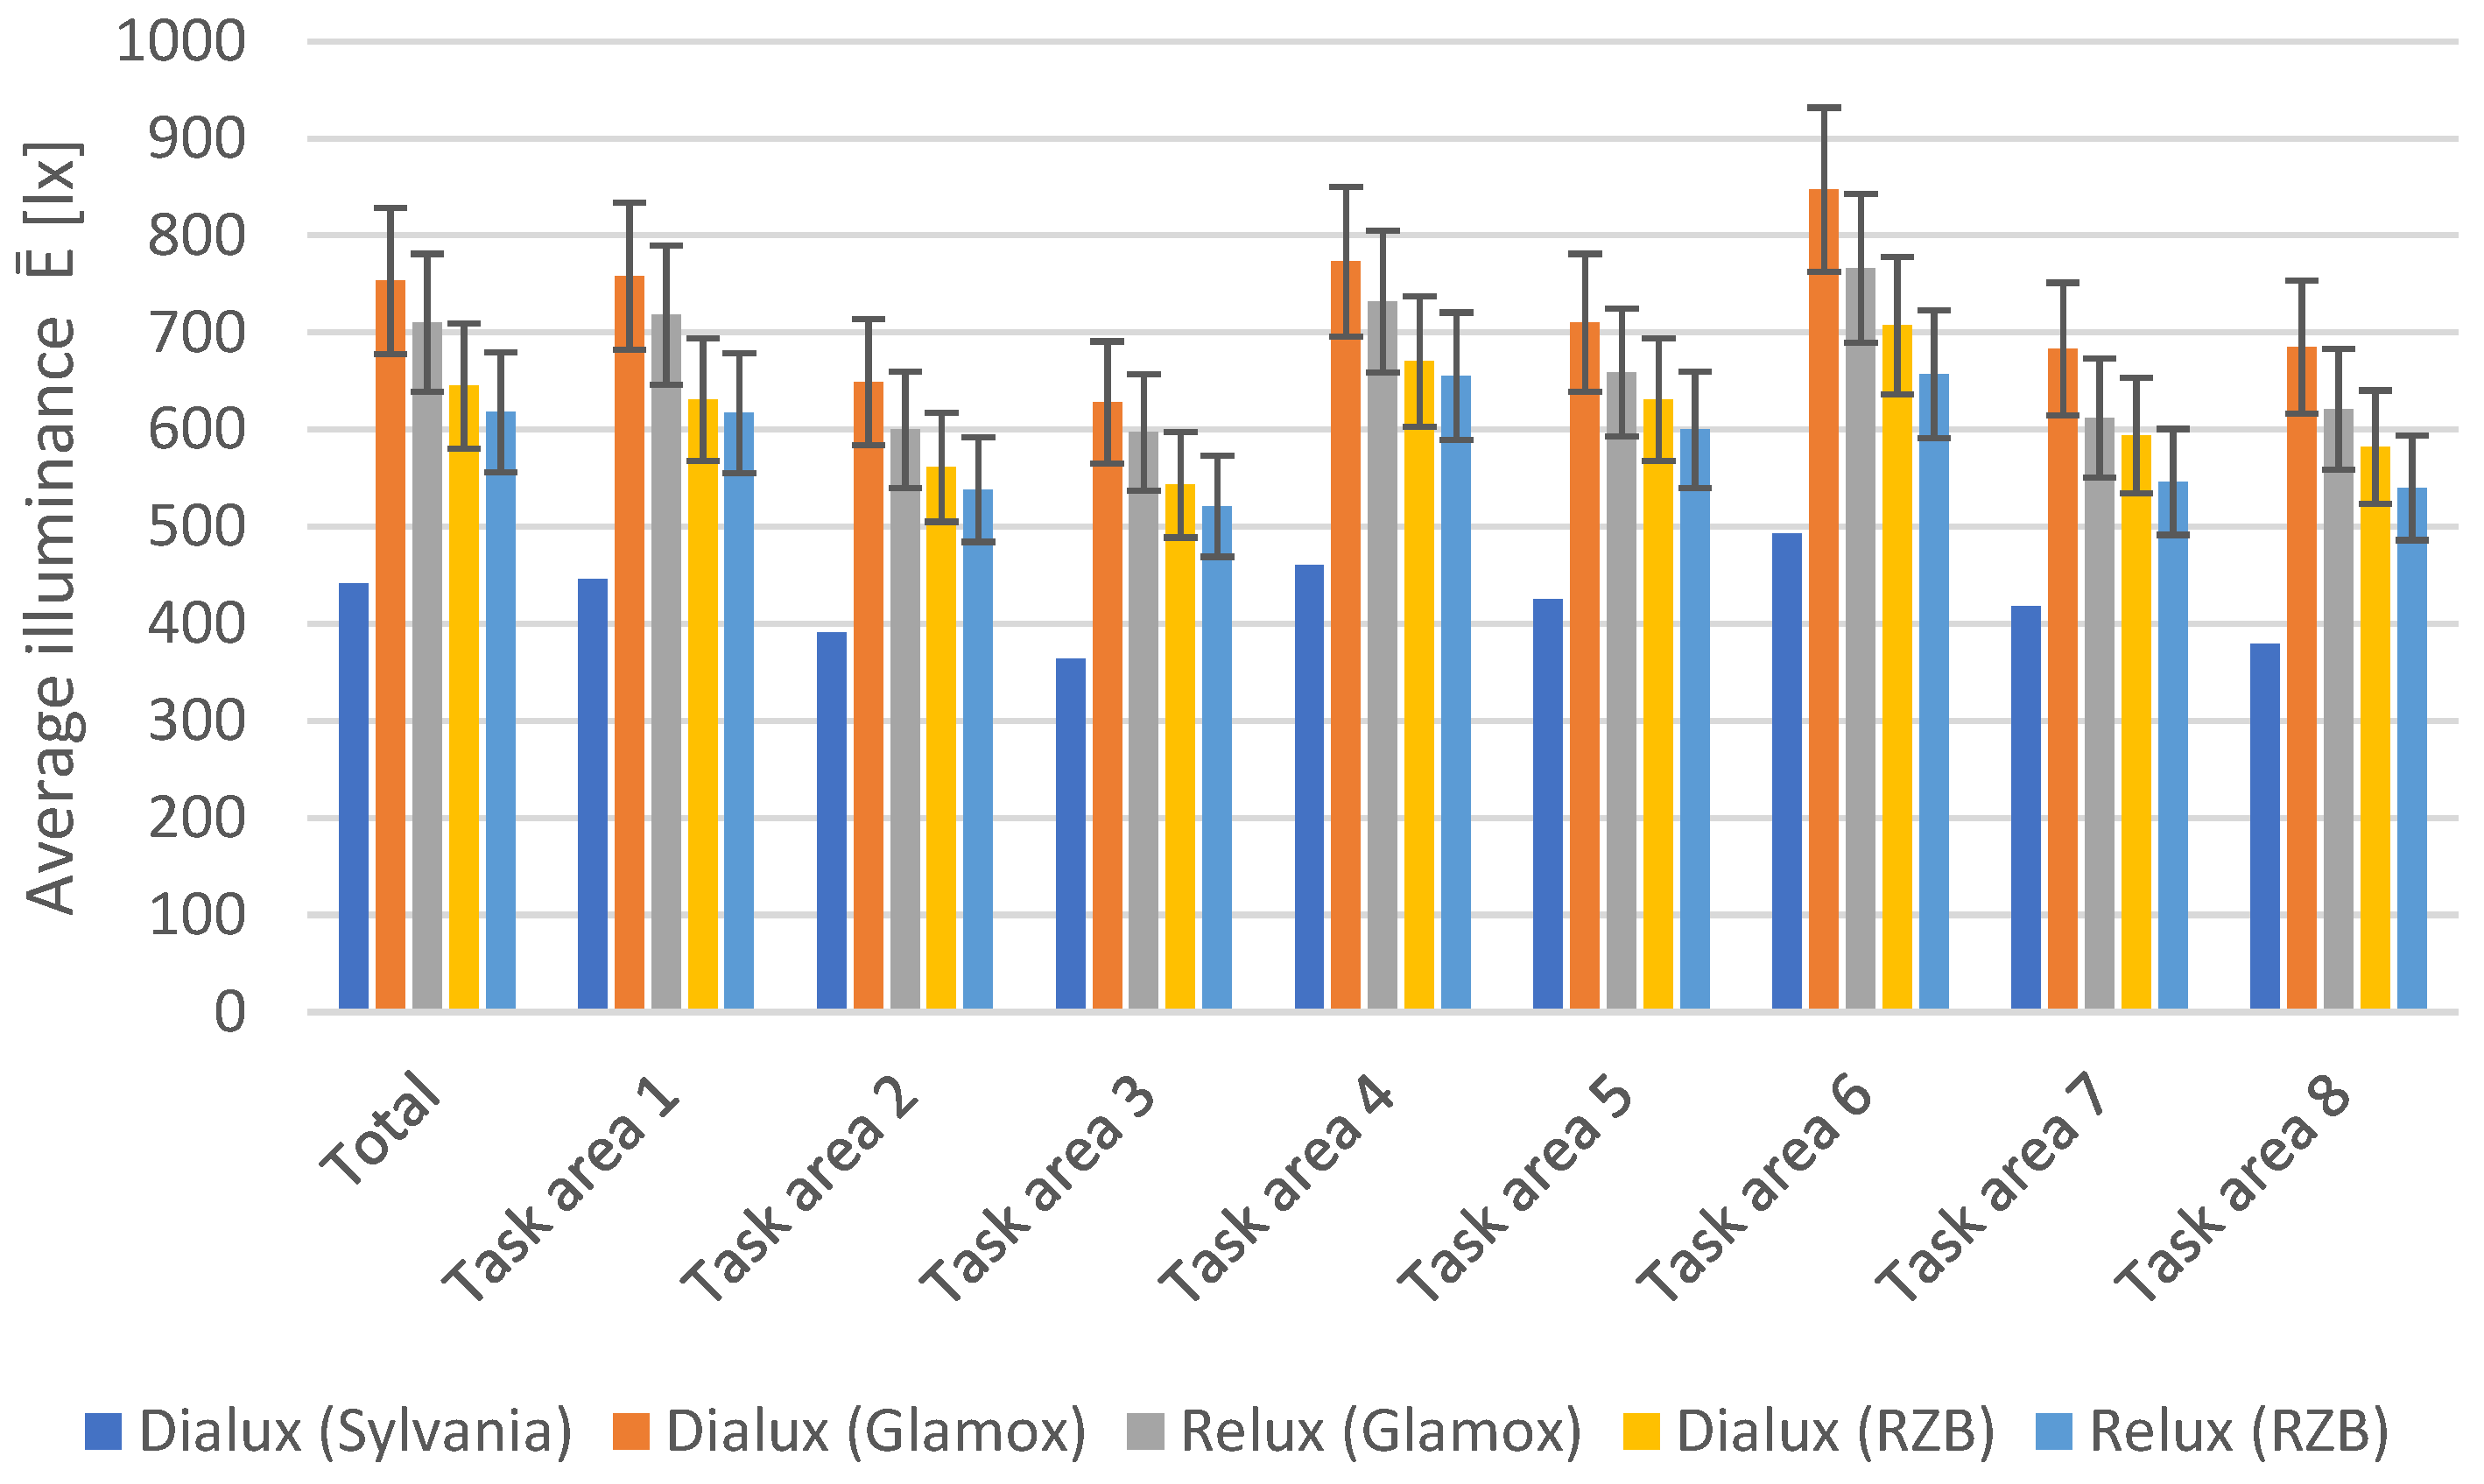
| Illuminance | DIALux Sylvania | DIALux Glamox | Relux Glamox | DIALux RZB | Relux RZB |
|---|---|---|---|---|---|
| Ē * [lx] | Ē [lx] | Ē [lx] | Ē [lx] | Ē [lx] | |
| Total | 441 | 753 | 710 | 645 | 618 |
| Task area 1 | 446 | 758 | 718 | 631 | 617 |
| Task area 2 | 391 | 649 | 600 | 561 | 538 |
| Task area 3 | 364 | 628 | 597 | 543 | 521 |
| Task area 4 | 460 | 773 | 732 | 670 | 655 |
| Task area 5 | 425 | 710 | 659 | 631 | 600 |
| Task area 6 | 493 | 847 | 766 | 707 | 657 |
| Task area 7 | 418 | 683 | 612 | 594 | 546 |
| Task area 8 | 379 | 685 | 621 | 582 | 540 |
| Energy Consumption [kWh/a] | LENI [kWh/a/m2] | Estimated Costs [€/a] | |
|---|---|---|---|
| Sylvania | 500–830 | 13–22 | 150–249 |
| Glamox | 220–370 | 6–10 | 66–110 |
| RZB | 190–320 | 5–8 | 58–96 |
Publisher’s Note: MDPI stays neutral with regard to jurisdictional claims in published maps and institutional affiliations. |
© 2022 by the authors. Licensee MDPI, Basel, Switzerland. This article is an open access article distributed under the terms and conditions of the Creative Commons Attribution (CC BY) license (https://creativecommons.org/licenses/by/4.0/).
Share and Cite
Králiková, R.; Džuňová, L.; Lumnitzer, E.; Piňosová, M. Simulation of Artificial Lighting Using Leading Software to Evaluate Lighting Conditions in the Absence of Daylight in a University Classroom. Sustainability 2022, 14, 11493. https://doi.org/10.3390/su141811493
Králiková R, Džuňová L, Lumnitzer E, Piňosová M. Simulation of Artificial Lighting Using Leading Software to Evaluate Lighting Conditions in the Absence of Daylight in a University Classroom. Sustainability. 2022; 14(18):11493. https://doi.org/10.3390/su141811493
Chicago/Turabian StyleKráliková, Ružena, Laura Džuňová, Ervin Lumnitzer, and Miriama Piňosová. 2022. "Simulation of Artificial Lighting Using Leading Software to Evaluate Lighting Conditions in the Absence of Daylight in a University Classroom" Sustainability 14, no. 18: 11493. https://doi.org/10.3390/su141811493
APA StyleKráliková, R., Džuňová, L., Lumnitzer, E., & Piňosová, M. (2022). Simulation of Artificial Lighting Using Leading Software to Evaluate Lighting Conditions in the Absence of Daylight in a University Classroom. Sustainability, 14(18), 11493. https://doi.org/10.3390/su141811493