Abstract
To reveal the overburden failure characteristics during backfill mining, theoretical analysis based on the theory of plates and shells and field measurements were combined. Based on the theory of plates and shells, a mechanical model for the overburden failure mechanism during backfill mining was established, through which the fracture conditions of overburden during backfill mining were judged. By analyzing the fracture process and revealing the fracture mechanism, the fractured zone in overburden during backfill mining was found not to develop uniformly, but changed in a leaping manner. Field measurement was conducted taking the 1327 working face in Xima Coal Mine (Shenyang City, Liaoning Province, China) as an example to monitor and analyze the roof-to-floor convergence (RFC), strata behaviors at the working face, and overburden failure during backfill mining. Monitoring results show that the distance between the monitoring points and the working face was highly consistent with the periodic weighting interval when the RFC increased in a leaping manner; the RFC grew in a leaping manner after each roof weighting, as well as the fractured zone. By monitoring and analyzing overburden failure, it was determined that the maximum height of the fractured zone was 10.7 m and a leaping phenomenon was present in the development process of the fractured zone. The conclusions of theoretical analysis were completely consistent with those of the field measurements, thus confirming the leaping development of the fractured zone in overburden during backfill mining.
1. Introduction
Deformation failure of overburden and rock movement are of great importance for coal mining [1,2,3]. Existing research mainly focuses on overburden deformation and failure characteristics during caving mining [4,5,6,7,8,9], while there is little research on the topic during backfill mining. Backfill mining refers to backfilling the goaf behind support in the working face, which is equivalent to shrinking the subsidence space of the roof behind the working face [10,11,12]. The filling rate is large in backfill mining, so the overburden deformation, failure, and movement are less violent [13,14,15]. Compared to caving mining, the overburden deformation and failure characteristics during backfill mining show significantly different results [5]. Backfill mining in the goaf mainly aims to relieve the stope pressure and decrease deformation and failure of the overburden and the ground [16,17,18]. Therefore, the overburden deformation and failure mechanism during backfill mining warrant further research.
There have been more studies on the deformation and damage characteristics of the overburden rock for the mining of an open area. Sun et al. [19] accurately determined the characteristics of the overburden damage by the distributed optical fiber sensing (DOFS) test, and this technique has good application prospects. Furthermore, based on the study of Sun et al., a vertical borehole observation system was established based on the stress characteristics and the migration model of the rock beam [20]. The spatiotemporal information of overburden migration was determined to guide the work in preventing water damage to the roof. Meanwhile, a regional division method based on overburden critical failure was proposed and applied in engineering by using surface movement monitoring [21]. However, there is little research on the topic during backfill mining, for example, large mining height [22] and mining through fault [23]. Backfill mining can control overburden movement, reduce surface subsidence, and protect surface structures, which is a “green” and environmentally friendly mining process. Scholars have conducted a lot of research on the process of infill mining [24,25,26,27,28,29], the nature of infill materials, the theory of infill support roof, etc. The research results have effectively guided the production practice and promoted the development of infill mining technology and theory. Obviously, the overburden deformation and failure characteristics during backfill mining differ greatly from those during caving mining. In summary, there is an urgent need to study the overburden damage and deformation under infill mining conditions.
Therefore, the overburden deformation failure analysis model of infill mining was constructed first, followed by the analysis of overburden deformation failure characteristics, and finally, the overburden activity characteristics of the working face retrieval process were measured and analyzed. This study provides a reference for overburden failure characteristics.
2. Establishment of the Analysis Model for Overburden Deformation and Failure during Backfill Mining
The hard stratum in the overlying rock layer on the working face was separated from the weak stratum below. However, the weak stratum above was not separated from the hard stratum below. The hard stratum was bent under the overburden load. However, due to the limited separation space, the hard stratum and the strata borne thereby directly acted on the underlying strata, while the underlying strata provided the supporting force, thus limiting the bending deformation of the hard stratum [30,31].
2.1. Determination of Hard Strata
Deflection is the linear displacement of the plate and shell midplane in the direction perpendicular to the midplane when the force is applied. A hard stratum refers to a stratum that has a deflection lower than its underlying strata. In this case, the hard stratum is not deformed in agreement with the lower stratum. At the same time, the hard stratum controls the deformation and failure of overlying strata. When a hard stratum is fractured and deformed, the weak strata borne thereby have compatible deformation with the hard stratum. According to the function of hard strata in the overburden deformation and failure process, the locations of the hard strata in overburden need to be determined first.
The composite beam theory is used to determine the location of, and load on, a hard stratum [32]. Supposing that the first stratum is a hard stratum; if the mth stratum above has compatible deformation while the (m + 1)th stratum does not have compatible deformation with the stratum, then the (m + 1)th stratum is regarded as the second hard stratum. The overburden load on the first hard stratum is
where represents the load applied by the mth stratum on the first hard stratum (MPa); and separately denote the thickness (m) and bulk weight (kN/m3) of the ith stratum; represents the elastic modulus of the ith stratum (MPa).
The load applied by the (m + 1)th stratum on the first stratum is calculated using the same method in Equation (1). If the (m + 1)th stratum is a hard stratum, the following equation needs to be satisfied:
The following Equation (3) is obtained by substituting Equation (1) into Equation (2):
When determining the hard stratum, it is calculated upward from the first stratum layer by layer and the computation stops when Equation (3) is satisfied. In this case, the (m + 1)th stratum is judged as a hard stratum. Then, the same method is used to determine hard strata above the (m + 1)th stratum until the last stratum.
2.2. Critical Load and Ultimate Displacement of Hard Strata
For nearly half a century, the theory of plates and shells has developed apace and found increasingly wide applications in fields including structural mechanics and engineering mechanics. It also has been more and more frequently used to solve practical problems. The theory was used below to analyze the stress state of hard strata in the overburden of working faces.
A cuboid is used to represent a hard stratum in overburden (Figure 1), in which the middle plane is taken as the xy plane and the z axis is vertical to the xy plane. The side with z > 0 is the upper surface while that with z < 0 is the lower surface. Supposing that the thickness h of the stratum is uniformly distributed in the analysis process, stress is also uniformly distributed on the surfaces of the hard stratum [33,34,35].
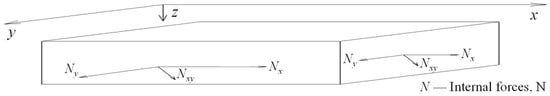
Figure 1.
Diagram for internal forces of a hard stratum.
The equilibrium equation for the deformation of the hard stratum under forces in the x and y directions is shown in Equation (4):
where and denote the shear forces (N) on the xz and yz planes, respectively.
Assuming that the shear stresses and are uniformly distributed and Qx and Qy represent the total transverse shear forces in the hard stratum, then the following is obtained according to the assumption:
According to the Hooke’s law, the corresponding strain is
where Gc represents the shear modulus (MPa) in the xz and yz planes; , , and denote the displacements (m) of the hard stratum in the x, y, and z directions, respectively.
Through integral operation on Equation (6), there is
where
Equation (8) can be rewritten as
where C represents the shear rigidity (N/m) of the hard stratum.
The shear rigidity (N/m) of the hard stratum can be expressed as follows:
supposing that a linear segment vertical to the middle plane is still a straight line after deformation. Letting and separately represent the angles of rotation in the xz and yz planes, and represent displacements of multiple points on the upper surface in the x and y directions, and and represent displacements of multiple points on the middle plane of the lower surface in the x and y directions, respectively, then there is
Letting , , and represent stress components on the upper and lower surfaces, the following is obtained according to the Hooke’s law:
where and refer to the elastic modulus (MPa) and Poisson’s ratio of the hard stratum, respectively.
The total bending moments and and total torque of the hard stratum are as follows:
By substituting Equations (11)–(13), the following is obtained after simplification:
where D represents flexural rigidity (N/m) of the hard stratum.
D can be expressed as follows:
When considering the lateral balance, the total transverse shear forces Qx and Qy, total bending moments and , and total torque are generally expressed.
Internal forces on the plane of the hard stratum include Nx, Ny, and Nxy, so the balance equation in the z direction is expressed as [36,37]
where q denotes the transverse load (MPa) per unit area of the hard stratum.
Then, the balance equations represented by are obtained:
Because Equations (17)–(19) are relatively complicated, they are simplified. Letting and be represented by two other functions w and f, the equation is as follows:
After defining and , w and f have solutions by solving Equation (20). This is because the following homogeneous equation has solutions, which is a characteristic of the Cauchy–Riemann equation:
The solution to Equation (21) can be expressed as follows using a function of complex variables [38]:
By substituting Equation (20) in Equations (17) and (18), there is
where
Equation (23) is another Cauchy–Riemann equation, the solution to which can be expressed by a function of complex variable as
The function is a nonhomogeneous differential equation of , , and , the solution to which can be expressed as the sum of solutions to homogeneous equations corresponding to any particular solution. Because the real and imaginary parts of are both harmonic functions, the corresponding homogeneous functions of , , and are as follows:
The following is obtained according to Equation (27):
By substituting Equations (20) and (28) into Equation (19), the following equation is obtained [39]:
As shown in Figure 2, x is the advance direction of the working face and y is the direction parallel to the working face. The working face has a length of L. For such a plate, the displacement and load need to meet the following equation when the load Q is uniformly applied thereon:
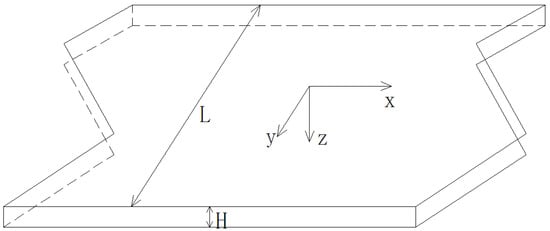
Figure 2.
Diagram for force analysis of a hard stratum in coal seam roof.
Because the backfill body supports the roof behind the working face during backfill mining, the overburden can be regarded as always supported at two ends in the whole advance process of the working face. Under this condition, the following two boundary conditions are obtained:
The critical load and the ultimate displacement in the z direction in different support states can be calculated using Equations (20), (30) and (31). The critical load Q1 under the condition is
The ultimate displacement in the z direction is
In accordance with the physical meanings and calculation methods of the shear rigidity C and flexural rigidity D, the calculation models of the critical load and the ultimate displacement are obtained:
2.3. Roof Subsidence
Subsidence refers to the maximum distance that the roof strata move downward after mining, and it is related mainly to the bulking coefficient of the underlying strata and calculated using the following equation:
where Z and separately represent the strata subsidence (m) and the equivalent mining height (m); hj and kj represent the thickness and bulking coefficient of the jth stratum, respectively.
The bulking coefficient of the strata is valued according to the practical situation. If a stratum is in the fractured zone, the bulking coefficient is used, while if the stratum is located in the caving zone, the residual bulking coefficient is taken due to influences of the overburden pressure after bulking.
2.4. Fracture Step Length of Hard Strata
After mining the coal seam out, the hard stratum will form a support plate that is fractured when reaching the critical load. The force borne by the hard stratum is the total weight of the strata controlled thereby. When the length of a working face is fixed, the load on hard strata is only related to the length of the unsupported roof in the advance direction. The load on hard strata is calculated using the following equation:
where , L, , x, and t represent the bulk weight of the ith stratum (kN/m3), working face length (m), thickness of the ith stratum (m), advance distance of the working face (m), and the number of strata from a hard stratum to the nearest hard stratum, that is, the number of strata under its control.
By substituting the critical load calculated using Equation (32) into Equation (36), the fracture step length of the hard stratum when reaching the critical load is calculated as
where represents the fracture step length (m) of the hard stratum.
According to Equation (37), the fracture step length of the hard stratum is positively proportional to the critical load of the stratum while negatively proportional to the working face length and the total weight of strata under control of the stratum.
3. Overburden Deformation and Failure Characteristics
The development process of a fractured zone in overburden during backfill mining is mainly controlled by whether the hard strata are fractured or not, which is influenced by the critical load, ultimate displacement, and subsidence. At the position of the working face, if the ultimate displacement is smaller than the height of free space and the ultimate load is lower than the load borne by the hard stratum, then the hard stratum is fractured. Likewise, whether the upper hard stratum is fractured or not is analyzed in a same way until reaching a hard stratum that is not fractured, then the fractured zone stops growing further upwards. The concrete analysis flowchart is shown in Figure 3 [39,40]. The mining thickness determines the free space height below the critical layer, and the free space height determines whether the key layer will fracture or not. As the mining thickness increases, the free space height below the key layer increases. When the accumulation of the free space height reaches the ultimate displacement, it will fracture, and then the fracture zone will suddenly develop upward. Accordingly, it is concluded that the fracture zone develops upward layer by layer with the increase of mining thickness.
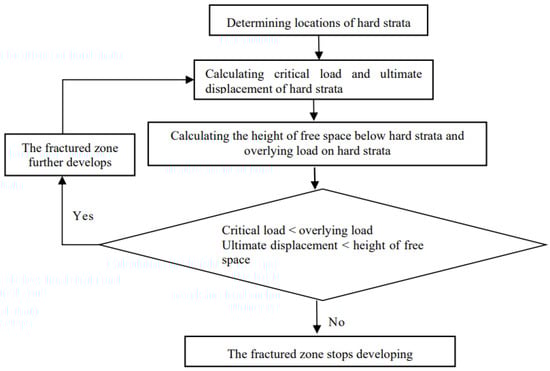
Figure 3.
Flowchart of judging the height of the fractured zone.
It is determined according to the above analysis that the overburden deformation and failure during backfill mining occur layer by layer and the fractured zone does not develop at a uniform speed but shows a leaping phenomenon.
4. Field Measurement of Overburden Movement Characteristics in the Mining Process of a Working Face
The overburden deformation and failure characteristics during backfill mining were measured and analyzed in the field by taking the 1327 working face of Xima Coal Mine (Shenyang City, Liaoning Province, China) as an example. The 1327 working face is located in the No. 1 south mining field at the level of −350 m in order to mine the 13# coal seam to the inner side of the protective coal pillar. The average elevation of the ground is +18.5 m; the elevation and average burial depth of the coal seam in the working face are −397 m~−497 m and 447 m, respectively. The working face is 137.4 m long on average with an inclined advance length of 501.9 m and an area of 70,255 m2. The thickness of the coal seam is in the range of 1.4~2.2 m and the average mining thickness is 1.811 m, with the filling rate of 81%, average filling height of 1.465 m, and equivalent mining height of 0.399 m. The working face is advanced at a rate of 3 m/d on average. The recoverable reserve of the working face, extraction rate, and production capacity of the coal seam are 9.27 × 10⁴ tons, 97%, and 1.36 t/m2, respectively. The working face is a monoclinal structure with a dip angle of 3°.
4.1. Roof-to-Floor Convergence Characteristics in the Goaf
As shown in Figure 4, three measuring lines were arranged along the working face at positions 187.0, 229.0, and 259.0 m from the open-off cut and five dynamic alarm apparatuses for roof-to-floor convergence (RFC) were installed on each measuring line. The positions of each group of measuring stations were determined by engineering technicians just after roof weighting to avoid damage to the apparatuses in the installation process. The measuring points were set at positions of intact roof and the goaf was backfilled after installation of apparatuses.

Figure 4.
Layout of measuring points.
As shown in Figure 4, measuring points 1#~5# were arranged on measuring line 1# and they separately have distances of 13.0, 37.0, 77.0, 97.0, and 125.0 m from the haulage gateway. Measuring points 6#~10# were arranged on measuring line 2# and they separately have distances of 22.0, 58.0, 82.5, 106.5, and 130.5 m from the haulage gateway. Measuring points 11#~15# were set on the measuring line 3# at the distances of 22.0, 49.5, 94.0, 119.5, and 131.5 m from the haulage gateway.
The dynamic alarm apparatuses for RFC were used to measure the roof subsidence in the filled goaf. According to the strain measurement technology, props were contracted under compression and the strain gauges converted subsidence to voltage signals, which were transformed to digital signals by the transmitter circuit and then output. The subsidence was recorded twice an hour.
After installing the dynamic alarm apparatuses for RFC, the displacement and stress changes of the roof and floor were recorded in real time. Due to geological conditions during construction and the quality of the apparatuses, only apparatuses at measuring points 4#, 5#, 6#, 7#, and 12# worked normally. There was an enormous amount of data because these apparatuses recorded data twice an hour, and the stress remained basically unchanged in a period of time, which were unconducive to analysis. To more intuitively analyze the relationship between the RFC and the distance from the working face, the monitoring data were retrieved every time that the working face was advanced forward.
Taking the distances from measuring points 4# and 5# to the working face as the independent variable and the RFC and stress as dependent variables, relationship curves for the distances from measuring points to the working face and the RFC were drawn (Figure 5). As shown in the figure, the RFC increases in a leaping manner when the distances from the measuring points to the working face are 17.2 m. This is because the overburden of the goaf fractured in a large area. The RFC tends to stabilize when the distances from the measuring points to the working face grow to 22 m.
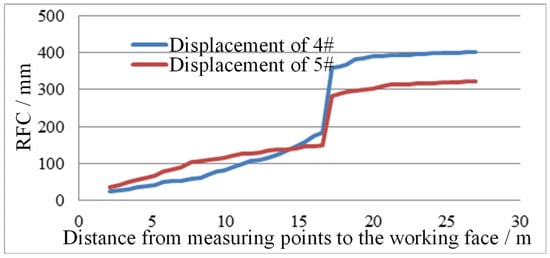
Figure 5.
Relationships between distances from measuring points 4# and 5# to the working face and RFC.
Relationship curves for the distances from measuring points to the working face and the RFC were drawn by taking the distances from measuring points 6# and 7# to the working face as the independent variable and the RFC as the dependent variable (Figure 6). It can be seen from the figure that the RFC grows in a leaping manner when the distances from the measuring points to the working face are 19.3 m, which is caused by the large areas of fracture of overburden of the goaf. The RFC tends to stabilize after the distances from measuring points to the working face increase to 23 m.
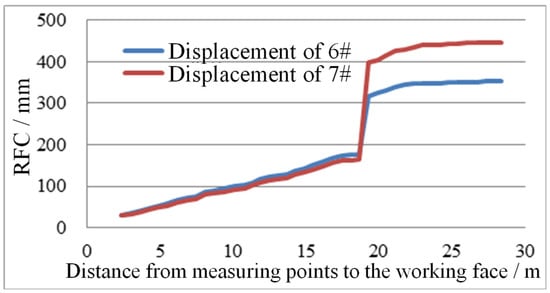
Figure 6.
Relationships between distances from measuring points 6# and 7# to the working face and RFC.
The relationship curve for the distance from a measuring point to the working face and the RFC was drawn by taking the distance from measuring point 12# to the working face as the independent variable and the RFC as the dependent variable (Figure 7). As displayed in the figure, the RFC increases in a leaping manner when the distance from the measuring point to the working face is 16.4 m, which is caused by large areas of fracture of overburden of the goaf. When the distance from the measuring point to the working face lengthens to 21 m, the RFC becomes stable.
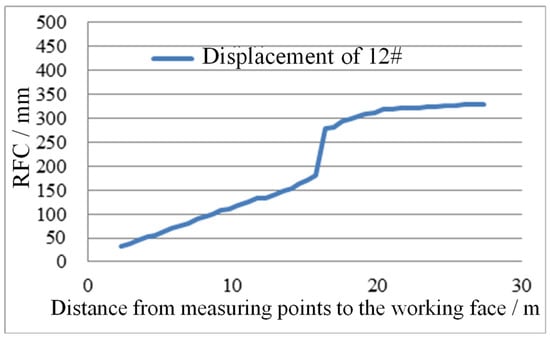
Figure 7.
Relationship between distance from measuring point 12# to the working face and RFC.
By analyzing data collected at the above five measuring points, the RFC was found to be in the range of 315~439 mm under the final stable state, with an average of 361.8 mm, which is approximate to the equivalent mining height of 399 mm in the 1327 working face. When the RFC shows a leaping increase, the distance from the measuring point to the working face is in a range of 16.4~19.3 m (17.6 m on average).
4.2. Characteristics of Strata Behaviors
To monitor weighting of the whole working face, ten monitoring points were arranged on the props of the support in the working face with an interval of about 10 m when the working face was advanced to 82 m. Layout of the monitoring points is shown in Figure 8. Direct-reading pressure gauges and digital continuous recording manometers were installed at each monitoring point to realize real-time monitoring on the ground through the stress monitoring system. In addition, stress changes at each point were also recorded.
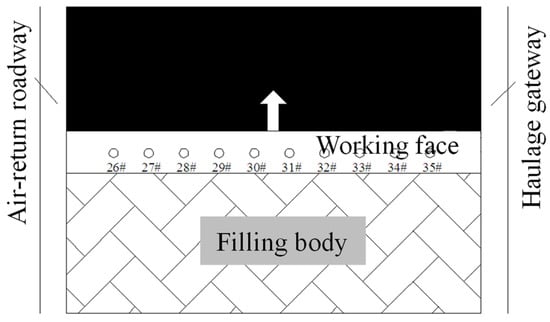
Figure 8.
Layout of stress stations in the working face.
The stress on the working face was recorded every time that the working face was advanced forward. An analysis of the monitoring results of the whole working face revealed that the monitored stress at the ten monitoring points is distributed in the range of 3.5~4.5 MPa. By integrating and analyzing the data obtained at these ten points, the relationship curve for advance distance of the working face and average stress on the working face was drawn, as shown in Figure 9.
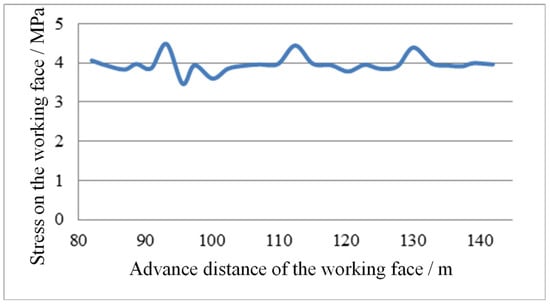
Figure 9.
Relationship between the advance distance and average stress on the working face during backfill mining.
The above figure indicates that periodic weighting was present in the mining process of the working face. Three instances of periodic weighting can be seen from the figure. The monitoring data of periodic weighting of the working face are obtained (Table 1).

Table 1.
Monitoring and analysis data of periodic weighting in the working face during backfill mining.
It can be seen from the table that the weighting intervals were separately 19.3 and 17.7 m, with an average of 18.5 m. The peak stresses during weighting were 4.48, 4.44, and 4.26 MPa. Weighting is a very short stress release process that affects a small area. The dynamic load factors in the first, second, and third weighting were 1.14, 1.13, and 1.09, respectively, so the average dynamic load factor of the whole working face was 1.12. The dynamic load factor of the mining field was in the range of 1.9~2.8 when using the caving mining method. The results indicate that backfill mining significantly decreases the dynamic load factor during periodic weighting, proving the capacity of backfill mining to relieve pressure in the working face.
When the RFC increases in a leaping manner, the distance from the measuring points to the working face is about 17.6 m (all measuring points for RFC are arranged after the first weighting), while the periodic weighting interval of the working face is about 18.5 m. The two are highly consistent, which indicates that fracture of the roof after each weighting results in the leaping increase in the RFC. It also suggests that the fractured zone enlarges in a leaping manner at the moment.
4.3. Overburden Failure Characteristics
Two sets of measuring points were arranged in the haulage gateway of the 1327 working face, each containing three measuring points, that is, a total of six boreholes were drilled to observe damage to the roof. Measuring points 1#, 2#, and 3# constituted the first set, with a distance of 135.0 m from the open-off cut. Measuring points 4#, 5#, and 6# in the second set showed a distance of 168.4 m from the open-off cut. The distances from the working face to the measuring points were also recorded in the observation. Various observation boreholes in each set were drilled from different angles. The three boreholes in the first set had angles of 47°, 42°, and 38° with the roof and their depths were 23, 22, and 24 m, respectively. The three boreholes in the second set had angles of 65°, 59°, and 54° with the roof and were at depths of 19, 23, and 18 m, respectively. The schematic diagram for the angles of each borehole is shown in Figure 10.

Figure 10.
Borehole layout.
Observation was carried out immediately after drilling each borehole in the working face, followed by observation once a day thereafter. The position of the working face and the locations of the maximum damage to the roof at each borehole were recorded in each observation.
4.3.1. Observation Results of the First Set of Boreholes
Observation was conducted at boreholes 1#, 2#, and 3# in the advance process of the working face. As the working face was advanced constantly, data recorded in the whole observation process at these boreholes were arranged. The maximum depth was converted into the maximum height of the fractured zone in overburden. Then, by taking distances from the boreholes to the working face as the independent variable and the height of the fractured zone in overburden as the dependent variable, the relationship curve for the distance from boreholes to the working face and the height of the fractured zone was drawn (Figure 11).

Figure 11.
Development process of the height of the fractured zone based on the first set of boreholes.
Analysis of the above figure reveals that when the distance from the boreholes to the working face is smaller than 16 m, the height of the fractured zone develops slowly, while the height increases abruptly when the distance from the boreholes to the working face grows to 19 m. As the working face continues to advance forward, its distance from boreholes constantly enlarges. The location of the largest depth of fractures remains stable thereafter and the fractured zone stops developing upwards. The maximum height of the fractured zone as observed from the three boreholes is 10.7 m.
4.3.2. Observation Results of the Second Set of Boreholes
In the advance process of the working face, observation was carried out at boreholes 4#, 5#, and 6#. As the working face was constantly advanced, data recorded in the whole observation process at these boreholes were arranged. Likewise, the maximum depth was converted into the maximum height of the fractured zone in overburden. The relationship curve for the distance from boreholes to the working face and the height of the fractured zone in overburden was drawn (Figure 12) by taking the distances from the boreholes to the working face as the independent variable and height of the fractured zone as the dependent variable.

Figure 12.
Development process of the height of the fractured zone based on the second set of boreholes.
By analyzing the above figure, the height of the fractured zone is found to develop slowly when the distances from boreholes to the working face are smaller than 15 m. As the distance increases to 17 m, the height of the fractured zone grows abruptly. With the further advance of the working face, the distances from the boreholes to the working face constantly enlarge, followed by a small increment in the height of the fractured zone as observed from each borehole. Afterwards, the height of the fractured zone remains stable and does not develop any more. The maximum height of the fractured zone in the overburden observed from the three boreholes is 10.5 m.
According to the monitoring results of the two sets of boreholes, the maximum height of the fractured zone was 10.7 m. The leaping phenomenon was also observed in the development process of the fractured zone. The results of the field tests verified the conclusions obtained from the theoretical analysis.
5. Conclusions
The overburden deformation failure analysis model of infill mining was constructed first, followed by the analysis of overburden deformation failure characteristics, and finally, the overburden activity characteristics of the workface retrieval process were measured and analyzed. The main conclusions are as follows.
- 1)
- The analysis model for overburden failure during backfill mining was established based on the theory of plates and shells, which revealed the overburden failure mechanism in the mining process. The leaping phenomenon of overburden failure during backfill mining was explored.
- 2)
- Taking the 1327 working face of Xima Coal Mine as an example, the RFC, strata behaviors at the working face, and overburden failure were monitored during the backfill mining. Analysis revealed that there is a leaping phenomenon in the overburden failure during backfill mining.
- 3)
- The results of the theoretical analysis completely conformed to those of the field measurements, which proves the presence of the leaping characteristics in the development of the fractured zone in overburden during backfill mining.
Author Contributions
H.Q. and J.Z. conceived the experiment and analyzed the results; Z.C., Z.O., L.C., H.Y., X.Z., Y.L. and H.L. coordinated the study and helped draft the manuscript. All authors gave final approval for publication. All authors have read and agreed to the published version of the manuscript.
Funding
The work was supported by the National Natural Science Foundation of China (Grant No. 52074120 and 51704148) and the Fundamental Research Funds for the Central Universities (3142019005 and 3142017107).
Data Availability Statement
The data presented in this study are available on request from the corresponding author.
Conflicts of Interest
The authors declare that there are no conflicts of interest regarding the publication of this article.
References
- Zou, Q.L.; Zhang, T.C.; Cheng, Z.H.; Jiang, Z.B.; Tian, S.X. A method for selection rationality evaluation of the first-mining seam in multi-seam mining. Geomech. Geophys. Geo-Energy Geo-Resour. 2022, 8, 17. [Google Scholar] [CrossRef]
- Liang, Y.P.; Ran, Q.C.; Zou, Q.L.; Zhang, B.C.; Hong, Y. Experimental study of mechanical behaviors and failure characteristics of coal under true triaxial cyclic loading and unloading and stress rotation. Nat. Resour. Res. 2022, 31, 971–991. [Google Scholar] [CrossRef]
- Zou, Q.L.; Zhang, T.C.; Ma, T.F.; Tian, S.X.; Jia, X.Q.; Jiang, Z.B. Effect of water-based SiO2 nanofluid on surface wettability of raw coal. Energy 2022, 254, 124228. [Google Scholar] [CrossRef]
- Chen, X.; Shi, X.Z.; Zhou, J.; Li, E.M.; Qiu, P.Y.; Gou, Y.G. High strain rate compressive strength behavior of cemented paste backfill using split Hopkinson pressure bar. Int. J. Min. Sci. Technol. 2021, 31, 387–399. [Google Scholar] [CrossRef]
- Zou, Q.L.; Liu, H.; Jiang, Z.B.; Wu, X. Gas flow laws in coal subjected to hydraulic slotting and a prediction model for its permeability-enhancing effect. Energy Sources Part A-Recovery Util. Environ. Eff. 2021, 1–15. [Google Scholar] [CrossRef]
- Le, Z.H.; Yu, Q.L.; Zhu, W.C.; Liu, H.Y.; Yang, T.H. Experimental study on the effect of granular backfill with various gradations on the mechanical behavior of rock. Int. J. Min. Sci. Technol. 2021, 31, 889–899. [Google Scholar] [CrossRef]
- Li, Y.; Ren, Y.Q.; Peng, S.S.; Cheng, H.Z.; Wang, N.; Luo, J.B. Measurement of overburden failure zones in close-multiple coal seams mining. Int. J. Min. Sci. Technol. 2021, 31, 43–50. [Google Scholar] [CrossRef]
- Zou, Q.L.; Liu, H.; Zhang, Y.J.; Li, Q.M.; Fu, J.W.; Hu, Q.T. Rationality evaluation of production deployment of outburst-prone coal mines: A case study of nantong coal mine in Chongqing, China. Saf. Sci. 2020, 122, 104515. [Google Scholar] [CrossRef]
- Qin, J.H.; Zheng, J.; Li, L. An analytical solution to estimate the settlement of tailings or backfill slurry by considering the sedimentation and consolidation. Int. J. Min. Sci. Technol. 2021, 31, 463–471. [Google Scholar] [CrossRef]
- Ran, H.Y.; Guo, Y.X.; Feng, G.R.; Qi, T.Y.; Du, X.J. Creep properties and resistivity-ultrasonic-AE responses of cemented gangue backfill column under high-stress area. Int. J. Min. Sci. Technol. 2021, 31, 401–412. [Google Scholar] [CrossRef]
- Zhang, B.C.; Sun, H.T.; Liang, Y.P.; Wang, K.Q.; Zou, Q.L. Characterization and quantification of mining-induced fractures in overlying strata: Implications for coalbed methane drainage. Nat. Resour. Res. 2019, 29, 2467–2480. [Google Scholar] [CrossRef]
- Zhang, T.C.; Zou, Q.L.; Jia, X.Q.; Liu, T.; Jiang, Z.B.; Tian, S.X.; Jiang, C.Z.; Cheng, Y.Y. Effect of cyclic water injection on the wettability of coal with different SiO2 nanofluid treatment time. Fuel 2022, 312, 122922. [Google Scholar] [CrossRef]
- Chi, X.L.; Yang, K.; Wei, Z. Breaking and mining-induced stress evolution of overlying strata in the working face of a steeply dipping coal seam. Int. J. Coal Sci. Technol. 2021, 8, 614–625. [Google Scholar] [CrossRef]
- Yu, H.; Jia, H.S.; Liu, S.W.; Liu, Z.H.; Li, B.Y. Macro and micro grouting process and the influence mechanism of cracks in soft coal seam. Int. J. Coal Sci. Technol. 2021, 8, 969–982. [Google Scholar] [CrossRef]
- Zhang, T.C.; Zou, Q.L.; Jia, X.Q.; Jiang, C.Z.; Niu, X.G. Effect of SiO2 nanofluid with different concentrations on the wettability of coal. Fuel 2022, 321, 124041. [Google Scholar] [CrossRef]
- Batugin, A.; Wang, Z.Q.; Su, Z.H.; Sidikovna, S.S. Combined support mechanism of rock bolts and anchor cables for adjacent roadways in the external staggered split-level panel layout. Int. J. Coal Sci. Technol. 2021, 8, 659–673. [Google Scholar] [CrossRef]
- Chang, J.C.; He, K.; Pang, D.D.; Li, D.; Li, C.M.; Sun, B.J. Influence of anchorage length and pretension on the working resistance of rock bolt based on its tensile characteristics. Int. J. Coal Sci. Technol. 2021, 8, 1384–1399. [Google Scholar] [CrossRef]
- Chen, J.H.; Zhao, H.B.; He, F.L.; Zhang, J.W.; Tao, K.M. Studying the performance of fully encapsulated rock bolts with modified structural elements. Int. J. Coal Sci. Technol. 2021, 8, 64–76. [Google Scholar] [CrossRef]
- Sun, B.Y.; Zhang, P.S.; Wu, R.X.; Guo, L.Q. Dynamic detection and analysis of overburden deformation and failure in a mining face using distributed optical fiber sensing. J. Geophys. Eng. 2018, 15, 2545–2555. [Google Scholar] [CrossRef]
- Sun, B.Y.; Zhang, P.S.; Wu, R.X.; Fu, M.R.; Ou, Y.C. Research on the overburden deformation and migration law in deep and extra-thick coal seam mining. J. Appl. Geophys. 2021, 190, 104337. [Google Scholar] [CrossRef]
- Bai, E.H.; Guo, W.B.; Tan, Y.; Guo, M.J.; Wen, P.; Liu, Z.Q.; Ma, Z.B.; Yang, W.Q. Regional Division and Its Criteria of Mining Fractures Based on Overburden Critical Failure. Sustainability 2022, 14, 5161. [Google Scholar] [CrossRef]
- Shi, X.C.; Zhang, J.X. Characteristics of Overburden Failure and Fracture Evolution in Shallow Buried Working Face with Large Mining Height. Sustainability 2021, 13, 13775. [Google Scholar] [CrossRef]
- Zeng, C.L.; Zhou, Y.J.; Zhang, L.M.; Mao, D.G.; Bai, K.X. Study on overburden failure law and surrounding rock deformation control technology of mining through fault. PLoS ONE 2022, 17, e0262243. [Google Scholar]
- Li, M.; Zhang, J.X.; Huang, P.; Gao, R. Mass ratio design based on compaction properties of backfill materials. J. Cent. South Univ. 2016, 23, 2669–2675. [Google Scholar] [CrossRef]
- Yang, K.; Zhao, X.Y.; Wei, Z.; Zhang, J.Q. Development overview of paste backfill technology in China’s coal mines: A review. Environ. Sci. Pollut. Res. 2021, 28, 67957–67969. [Google Scholar] [CrossRef]
- Li, S.; Zhao, Z.M.; Yu, H.X.; Wang, X.M. The Recent Progress China Has Made in the Backfill Mining Method, Part II: The Composition and Typical Examples of Backfill Systems. Minerals 2021, 11, 1362. [Google Scholar] [CrossRef]
- Zhu, X.J.; Guo, G.L.; Liu, H.; Chen, T.; Yang, X.Y. Experimental research on strata movement characteristics of backfill-strip mining using similar material modeling. Bull. Eng. Geol. Environ. 2019, 78, 2151–2167. [Google Scholar] [CrossRef]
- Zhu, X.J.; Guo, G.L.; Liu, H.; Yang, X.Y. Surface subsidence prediction method of backfill-strip mining in coal mining. Bull. Eng. Geol. Environ. 2019, 78, 6235–6248. [Google Scholar] [CrossRef]
- Emad, M.Z.; Mitri, H.; Kelly, C. Dynamic model validation using blast vibration monitoring in mine backfill. Int. J. Rock Mech. Min. Sci. 2018, 107, 48–54. [Google Scholar] [CrossRef]
- Gao, B.B.; Liu, Y.P.; Pan, J.Y.; Yuan, T. Detection and Analysis of Height of water flowing fractured zone in under water mining. Chin. J. Rock Mech. Eng. 2014, 33 (Suppl. S1), 3384–3390. [Google Scholar]
- Guo, W.B.; Zhao, G.B.; Bai, E.H.; Guo, M.J.; Wang, Y. Effect of overburden bending deformation and alluvium mechanical parameters on surface subsidence due to longwall mining. Bull. Eng. Geol. Environ. 2021, 80, 2751–2764. [Google Scholar] [CrossRef]
- Xu, J.L.; Qian, M.G. Method to distinguish key strata in overburden. J. China Univ. Min. Technol. 2000, 5, 21–25. [Google Scholar]
- Huang, G.; Luo, J.Y.; Deng, Y.H.; Zhang, X.; Zhang, L. Ground pressure controls of horizontal/gently inclined ore-body on the theory of plates and shells. Met. Mine 2013, 4, 4–10, 28. [Google Scholar]
- Suchowerska, A.M.; Merifield, R.S.; Carter, J.P. Vertical stress changes in multi-seam mining under supercritical longwall panels. Int. J. Rock Mech. Min. Sci. 2013, 61, 306–320. [Google Scholar] [CrossRef]
- Le, T.D.; Oh, J.; Hebblewhite, B.; Zhang, C.G.; Mitra, R. A discontinuum modelling approach for investigation of Longwall Top Coal Caving mechanisms. Int. J. Rock Mech. Min. Sci. 2018, 106, 84–95. [Google Scholar] [CrossRef]
- Qin, R. A new theory and a new method for nonlinear analysis of plates and shells. Eng. Mech. 2004, 1, 9–14. [Google Scholar]
- Zhao, Z.X.; Wang, F.C.; Liu, E.L.; Niu, J.H.; Huang, L. Reliability analysis of steel template of retaining wall based on the theory of plate and shell. J. Shaanxi Univ. Technol. (Nat. Sci. Ed.) 2015, 1, 11–16. [Google Scholar]
- Zhang, J.P. Research in the Theory and Methods about Damage Detection of Plate and Shell Structure. Ph.D. Thesis, Southwest Jiaotong University, Sichuan, China, 2015. [Google Scholar]
- Gu, Z.J. Some Research of the Fundamental Solutions Method in Plate and Shell Vibration Models and Its Application. Ph.D. Thesis, Fudan University, Shanghai, China, 2012. [Google Scholar]
- Zhang, Z.Z.; Deng, M.; Bai, J.B.; Yu, X.Y.; Wu, Q.H.; Jiang, L.S. Strain energy evolution and conversion under triaxial unloading confining pressure tests due to gob-side entry retained. Int. J. Rock Mech. Min. Sci. 2020, 126, 104184. [Google Scholar] [CrossRef]
Publisher’s Note: MDPI stays neutral with regard to jurisdictional claims in published maps and institutional affiliations. |
© 2022 by the authors. Licensee MDPI, Basel, Switzerland. This article is an open access article distributed under the terms and conditions of the Creative Commons Attribution (CC BY) license (https://creativecommons.org/licenses/by/4.0/).