Abstract
The aim of the study in this paper is to establish a prediction model of gas emission in the working face. The gas desorption variation characteristics of coal with different particle sizes were assessed using physical tests and based on the coal body of No. 2 coal seam in Wangjialing Coal Mine, Shanxi, China, to reveal the influence law of coal particle size on coal gas desorption. The gas desorption characteristics in the working face, the law of gas emission of coal cutting, coal caving, coal wall, and remnant coal in the goaf of the production process were then analyzed after establishing a gas emission prediction model based on the particle size of the coal. The accuracy of the gas emission prediction model was finally validated through actual measurement of the coal particle size distribution and gas emission in the test working face. The results of the current study show that the coal particle size is negatively correlated with the gas desorption capacity within a certain range. The initial desorption intensity of the coal gas decreased with an increase in the coal particle size. However, the initial gas desorption intensity and attenuation coefficient of gas emission were constant after a certain level of increase in the coal particle size. It was found that the average error between the gas emission prediction model and the actual gas emission data in the mining process was 5.29% based on the desorption characteristics of granular coal. Therefore, the established gas emission prediction model can characterize the law of gas emission in the actual production process more effectively. Furthermore, it provides reliable support for the prediction and control of gas emissions from the goaf under the condition of fully mechanized mining with top coal caving.
1. Introduction
Coal is one of the main energy sources in China. Safe and efficient mining of coal is a way to ensure energy security in the country [1,2]. Currently, most of the mines in China are gradually achieving a high yield and efficiency for the development of the resource. However, under the condition of high-intensity mining, a large amount of gas in coal is rapidly desorbed upon coal crushing and the gas spreads to the whole working face within the air flow in the mine. This results in an increase or over limit of gas in the working face and the corner of the return air, causing a huge potential safety hazard in the mine [3]. Therefore, the mine gas disaster control first needs to determine the gas source and the proportion of gas emission from the source [4,5]. In the production process of comprehensive caving working face, the main sources of gas emissions are coal cutting and caving, remnant coal in goaf, and the coal wall of the new burst in the mining process [6,7]. However, because of the uncertain distribution law of coal particle size in the working face and the unclear law of coal gas desorption influenced by coal particle size, it is still difficult to accurately predict the amount of gas emission in the production process. Consequently, it is difficult to smoothly carry out gas disaster prevention measures in the working face [8,9]. Therefore, there is an urgent need to study the characteristics of particle size distribution for cut and caved coal in a comprehensive caving working face, as well as the law of gas desorption of coal with different particle sizes. This allows for the establishment of a prediction model of gas emissions in the working face affected by the particle size, and hence an improvement in the effectiveness of the prevention and control measures of mine gas disasters.
Gas emissions in the working face mainly come from gas released by coal with different particle sizes. The coal particle size is hence one of the main factors affecting the capacity of gas adsorption and desorption. Based on the relationship between coal particle size and gas adsorption, as well as desorption, several research studies have been carried out by both experts and scholars through numerical and physical experiments. First, in terms of the relationship between an adsorption constant ‘a’ value and coal particle size, an experimental study conducted by Ruppel et al. showed that the adsorption constant ‘a’ does not change with the change in coal particle size [10]. Elsewhere, the results of a study carried out by Jin and Cheng et al. showed that the surface area of coal may increase with the decrease in the particle size of coal, resulting in an increase in adsorption constant ‘a’ [11,12]. In addition, some scholars have found that the change of coal particle size may cause an increase in vitrinite or a change in porosity [13], thus making it difficult to predict the adsorption constant ‘a’.
Second, research studies have also been conducted regarding the influence of coal particle size on the adsorption and desorption of the gas. An experimental study conducted by Zhao et al. tested the variation of gas adsorption and desorption under the influence of different coal particle sizes [14,15]. They studied the relationship between coal particle size and the initial speed of gas desorption. It was found that the small size of coal particles makes the coal matrix the main factor affecting gas adsorption and desorption. A separate study carried out by Li et al. evaluated the gas diffusion coefficients of coal with different particle sizes and established a dynamic evolution model of gas diffusion in coal particles of different sizes [16]. Furthermore, other scholars studied the characteristics of gas emission in the working face using mathematical methods such as statistics and grey theory to accurately predict the law of gas emission in the working face. Guo established a gas emission prediction model of excavation working face through integral methods and predicted the amount of gas emission in the excavation working face under a stable state [17]. Elsewhere, Yang et al. established a gas emission prediction model through partial correlation analysis [18]. A different study conducted by WU and Chen et al. established a prediction model of mine gas emission using the mine statistical method and gray model [19,20]. Further, FU et al. established a gas emission prediction model using methods such as neural network deep learning [21]. Other scholars have also carried out the prediction of gas emissions in the working face according to the characteristics of gas seepage in the coal seam. A series of studies were conducted by GAO et al. on the variation law of gas emission under the influence of excavation distance on the excavation face. A gas emission model with permeability changes was hence established to determine the influence of space–time step length on the accuracy of gas emissions in the coal wall [22,23]. Elsewhere, Liu studied the influence of the excavating velocity on gas emissions from the coal wall using the method of parameter non-causation and hence established a related gas prediction model [24]. In addition, Liang studied the law of coal wall gas flow in the excavation face and predicted gas emissions by establishing a gas fluid–solid coupling model [25]. Moreover, a study performed by Zhang et al. established a gas prediction model based on the variation characteristics of gas seepage in coal [26].
The described research studies have effectively improved the understanding of the law of coal gas adsorption and desorption. However, most of the studies mainly focused on the law of coal gas desorption with the standard particle size. In addition, there are few related research studies on the gas emission law of the comprehensive caving working face under the influence of the particle size of coal. In summary, despite the above advances, we still have a highly insignificant understanding of the dynamic prediction model of gas emissions.
The present study used physical experiments to evaluate the law of gas desorption of coal on different particle sizes, and hence determined the variation characteristics of the gas desorption capacity of coal with different particle sizes. Furthermore, the current study established specific prediction models of gas emission based on the granularity of coal mining, coal caving, remnant coal in goaf, and the newly burst coal wall in the working face. Finally, the field applications and effect tests for the gas emission prediction models were carried out by measuring the distribution characteristics of coal particle size and the gas emission amount in the test working face. Therefore, the results of the present research study provide a basis for the prediction and prevention of gas emissions.
2. Overview of the Experimental Area
The test mine is located in The Wangjialing Coal Mine in Xiangning County, Shanxi Province, China. The mine has three layers of coal seams and the area of the mine is 119.7 km2, where the coal seams that can be mined are in seam Nos. 2, 3, and 10. Currently, coal seam No. 2 is the main mining seam. The longwall backward mining method and fully mechanized mining with top coal caving technology are used in this mine. Coal seam No. 2 is mainly characterized by a low permeability and low gas content.
The 12,302 working face of the test mine was selected as the test working face for the current study. The basic conditions of the test working face is shown in Figure 1. The elevation of the working face was +570~+640 m, the strike length was 2604 m, and the inclination length was 310 m. Furthermore, the working face caving ratio was 1:1 with a bulk density of 1.44 t/m3 and recovery ratio of 88%. In addition, the selected working face belonged to coal seam No. 2, with an average thickness of 6 m. The average gas content of the No. 2 coal seam was 3.01 m3/t and hence the overall gas content of the working face was relatively low. However, there are unusual gas emissions in the mining process because of the high intensity of mining on the working face. During normal production, the absolute volume of gas emissions is between 4 and 8 m3/min. However, when the coal cutting and drawing speed of the working face is too fast and is encountered in the production process, the maximum volume of gas emission increased to 11 m3/min, which threatens the safety of the coal mine.
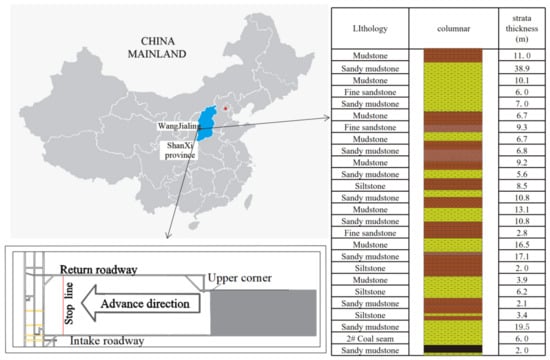
Figure 1.
Basic conditions of the test working face.
3. Experimental Study on Gas Desorption from Coal with Granularity
3.1. Introduction of Experimental System
The “coal desorption experimental system” was independently developed for testing the desorption variation of coal with different particle sizes. The experimental system design is shown in Figure 2. The experimental system is mainly composed of a gas supply system, a gas extraction system, a coal sample bin, and a monitoring and control system. The gas supply system is mainly composed of a gas cylinder and buffer tank, and its main function is to provide a gas source for the experimental system. The gas extraction system is composed of a program-controlled adjustable vacuum pump, which is mainly used to fully discharge the original gas from coal in the coal sample bin. The coal sample bin is mainly used to place coal of different particle sizes, which has an excellent air tightness. The monitoring and control system is composed of a pressure/flow sensor, solenoid valve, data collector, and monitor host, whose main function is to automatically monitor and control the system.
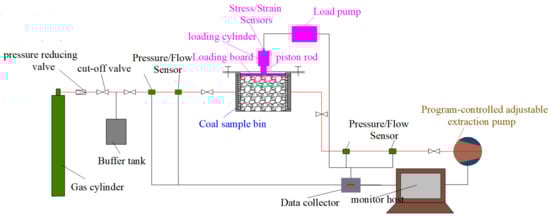
Figure 2.
The overall design schematic diagram of the coal desorption experimental system.
3.2. Introduction of Experimental Steps and Scheme
The experiment mainly studied the gas desorption variation of coal with different particle sizes under the same adsorption conditions (Figure 3).
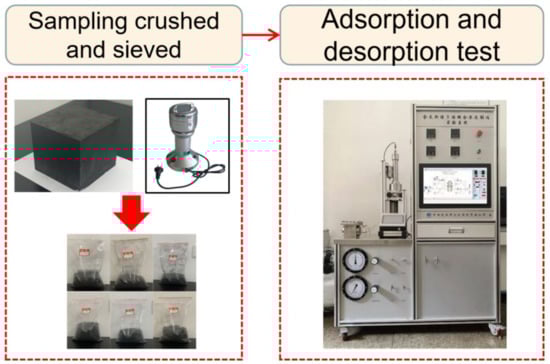
Figure 3.
Diagram of the desorption experiment process of coal with different particle sizes.
The desorption experiments on coal with different particle sizes are mainly divided into the following steps: (1) Large coal samples were taken at the working face on site, and then crushed and screened in the laboratory to separate 350 g coal bodies with different particle sizes, such as below 0.5 mm, 0.5–1 mm, 1–2 mm, 2–5 mm, 5–10 mm, and 10–20 mm. (2) Connect the experimental system, check the air tightness of the system, and start the experiment after the air tightness is qualified. (3) Take 70 g of coal sample below 0.5 mm into the coal sample bin, and the negative pressure of the experimental system is set to 0.8 Mpa and maintained for 1 h, so that the original gas in the coal body is fully discharged. (4) Open the gas cylinder, set the adsorption pressure to 0.2 MPa, and the coal samples begin to absorb gas automatically and continuously under constant pressure through monitoring the feedback in the system. (5) After the adsorption equilibrium is established, the desorption experiment is carried out. (6) Repeat the adsorption and desorption experiments of coal with different particle sizes according to steps (3), (4), and (5).
According to the principle of “the bigger the coal particle size is, the bigger the distribution interval is”, the coal samples were taken from the experimental working face of the test mine for crushing and screening, and the coal samples were pretreated. A desorption test was carried out to study the gas desorption law on coal with particle sizes below 0.5, 0.5–1, 1–2, 2–5, 5–10, and 10–20 mm. The adsorption and desorption tests were carried out separately for coal with different particle sizes. During the experiment, the pressure changes in the coal sample bin and the flow changes in the pipeline were continuously monitored, and the experimental results were analyzed after the experiment.
3.3. Coal Gas Desorption Law
The experimental system was used to adsorb methane at high pressure on the same quality coal. Desorption experiments were then carried out on the coal after adsorption. The curve of the desorption intensity of the samples of coal with different particle sizes with time was drawn, as shown in Figure 4. Therefore, the influence law of coal particle size on the desorption intensity was obtained.
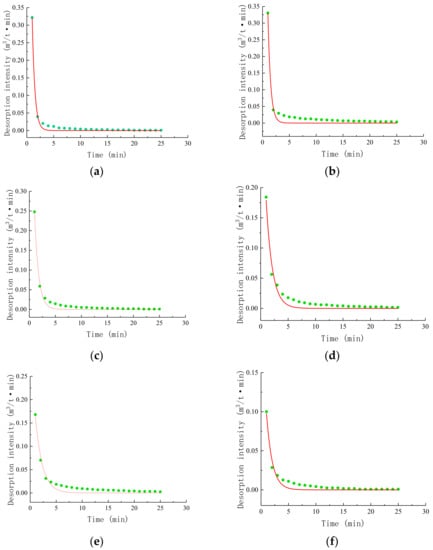
Figure 4.
Curve of the desorption intensity of granular coal with time; (a) below 0.5 mm, (b) 0.5–1 mm, (c) 1–2 mm, (d) 2–5 mm, (e) 5–10 mm, (f) 10–20 mm.
As shown in Figure 4, there is a significant difference in the curve shape of the gas desorption intensity of coal with different particle sizes against time. This indicates that the law of gas desorption of coal samples with different particle sizes is different. However, the overall trend of change is in the form of the exponential function V = V0·e−nt. In this formula, V represents the gas emission intensity, V0 represents the initial gas emission intensity, n represents the attenuation coefficient of the gas emission, and t represents desorption time. It was found that the gas desorption capacity decreased with an increase in the size of coal particles, which is an indication that coal particle size had an important effect on gas desorption. The formula for the relationship between gas desorption intensity and time of coal with various particle sizes was illustrated by fitting each curve with this exponential model, as shown in Table 1.

Table 1.
Fitting equation of the coal gas desorption intensity curve for each of the particle sizes.
It was evident that the effective desorption time of the coal sample was very short (Figure 4). The initial stage was the rapid desorption stage of gas and the duration of the high intensity desorption of gas was short. The observations could be explained by the fact that there was a large amount of free gas in the coal body at the beginning, and that a large amount of the gas was quickly desorbed out with the decrease in pressure. In the middle and later periods, the amount of free gas in the coal samples gradually decreased. Furthermore, because of the constraints of the coal body structure, part of the gas remained on the adsorption site and could not be easily desorbed.
When the coal particle size was <1 mm, the gas desorption occupied a large proportion in the first 20 min, and gradually stabilized in the later period. This was illustrated in the diagram of the gas desorption amount changing over time. When the particle size increases to more than 1 mm, more than 70% of the gas could then be desorbed in the coal in the first 10 min. To quantitatively compare the difference of the gas desorption intensity of coal with different particle sizes, the data of desorption intensity of coal with different particle sizes within 20 min against time were selected for a comparative analysis. It was noted that a decrease in the particle size of the coal sample increased the initial gas desorption intensity, increased the decay rate of the desorption intensity, and accelerated the speed of the desorption equilibrium.
The present study analyzed the initial desorption intensity and gas emission attenuation coefficient of coal with different particle sizes. The fitting curve was hence drawn as shown in Figure 5. It was found that when the particle size was larger than 10 mm, the initial gas desorption intensity and gas emission attenuation coefficient of coal had little change with the increase in particle size and gradually tended to balance.
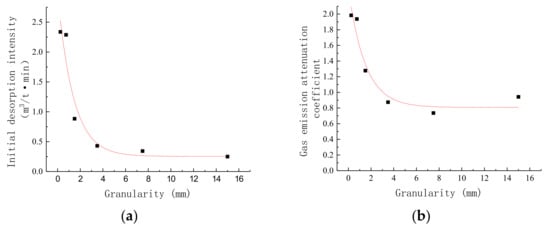
Figure 5.
Relationship between gas desorption parameters and coal particle size. (a) Relationship between initial desorption intensity and particle size. (b) Relationship between gas emission attenuation coefficient and particle size.
4. Research on Prediction Model of Gas Emission
4.1. Coal Gas Desorption Law
According to the results obtained from the desorption experiment, it was evident that the change law of coal gas emission intensity is affected by the initial emission intensity, exposed time, and gas emission attenuation coefficient. Furthermore, it was found that it has the following exponential relationship:
where Vc represents the gas emission intensity at time t when the mined coal stays at the working face, m3/(t·min); V0 represents initial gas emission intensity of mined coal, m3/(t·min); t represents residence time of mined coal on working face, min; and nc represents attenuation coefficient of gas emission from coal mining.
Considering the distribution law of coal particle size during production, the comprehensive gas emission intensity of coal with different particle sizes can be obtained as shown in the Equation (2):
where represents the distribution ratio of coal with different particle sizes; Vi represents initial gas emission intensity of coal with different particle sizes, m3/(t·min); t represents the residence time of cut coal on working face, min; and ni represents the attenuation coefficient of the gas emissions from coal with different particle sizes.
4.1.1. Prediction Model of Gas Emission during Coal Cutting
The total quality of cut-off coal is as follows:
In the formula, Mc represents the total quality of coal cut during production, t; hc represents the coal cutting height, m; ρ represents the coal density, t/m3; d represents the shearer cutting depth, m; vc represents the coal cutting speed, m/min; and tc represents the total coal cutting time of 1 day, min.
Therefore, the total amount of gas emission from coal cut during production is as follows:
In the formula, Qc represents the total amount of gas emission in cutting coal, m3, and t0 represents the retention time of the cut-off coal in the working face, min;
By combining Equations (2)–(4) and integrating t, it can be obtained that the amount of gas emission by coal cutting in the coal mining process of working face is:
4.1.2. Prediction Model of Gas Emission during Coal Caving
The total mass of coal caved in 1 day is as follows:
where Mp represents the total mass of coal during caving coal, t; hp represents the coal caving height, m; Rp represents the recovery rate of caving coal, %; ρ represents the coal density, t/m3; d represents the shearer cutting depth, m; vp represents the coal caving speed, m/min; and tp represents the total coal caving time of 1 day, min.
Therefore, the total amount of gas emission from coal caving during production is as follows:
In the formula, Qp represents the total amount of caving coal gas emission, m3; represents the distribution ratio of coal with different particle size during coal caving; and t1 represents residence time of caving coal on working face, min.
By bringing Equation (6) into Equation (7) and integrating Equation (7) along t, the amount of gas emissions in the coal caving can be obtained.
4.2. The Model of Gas Emission Form Coal Wall
The fresh coal wall was constantly exposed during the mining process of the working face. The gas in the coal seam flowed to the working face and the intensity of gas emission continued to decrease under the influence of the pressure gradient. Therefore, it is evident that the intensity of gas emissions from the coal wall is related to the time of gas emissions from the coal wall, the initial intensity of gas emissions from the coal wall, and the area of the coal wall, and they have the following exponential relationship:
where Vw represents gas emission intensity per unit area of coal wall at moment t, m3/(m2·min); Vr represents gas emissions intensity per unit area of coal wall at the initial moment, m3/(t·min); t represents coal wall exposure time, min; and nw represents coal wall gas emissions attenuation coefficient, min−1.
Therefore, the cumulative gas emission per unit area of coal wall in one day is:
where Q′w represents the total amount of gas emission per unit area of coal wall, m3, and t2 represents coal wall exposure time, min;
The exposed area of the coal wall of working face is as follows:
In the formula, S represents effective exposed area of coal wall of working face, m2; l represents the length of the working face, m; hw represents the height of the working face, m; and w represents the width of the working surface, m.
By multiplying Equations (10) and (11) and integrating their products along time t, the amount of gas emission by the exposed area of coal wall can be found by:
4.3. Prediction Model of Gas Emission in Goaf
The main source of gas emission in goaf is the gas released by remnant coal within a periodic pressure. The total amount of remnant coal in the goaf is calculated by the following:
where R represents the total rate of recovery, %.
It was evident that the law of gas emission intensity of remnant coal in the goaf is the same as that of the cutting and caving coal. However, the law of particle size distribution is different. Therefore, the total amount of gas emission in the goaf within a periodic pressure is:
In the formula, Ql represents the gas emissions from the goaf in 1 day, m3; represents the distribution ratio of remnant coal in goaf with different particle size; and t3 represents the total time of gas emission in goaf, min.
Therefore, the amount of gas emission from the remnant coal in goaf can be obtained:
4.4. Absolute Volume of Gas Emission of Working Face during Production
The absolute gas emission quantity of the working face is as follows:
In the formula, q represents the absolute gas emission quantity of working face during production, m3/min, and t represents 1 day (1440 min in total), min.
By combining Equations (5), (8), (12), (15) and (16), it can be found that the absolute volume of gas emissions of the working face is as follows:
5. Field Engineering Verification
5.1. Distribution Characteristics of Coal Particle Size during Cutting and Caving
Cutting and caving coal samples were separately collected from 60, 120, 180, 240, and 300 m of the working face. The obtained coal samples were screened in the laboratory and the coal samples with particle size ranges below 0.5, 0.5–1, 1–2, 2–5, 5–10, 10–20, 20–30, and above 30 mm were weighed, and the proportion of coal with different particle sizes was separately calculated. Five field coal particle size tests were carried out in five periods to avoid the error of single measurement. The average results value of the five tests was taken to draw the particle size distribution of coal cutting and caving, as shown in Figure 6.
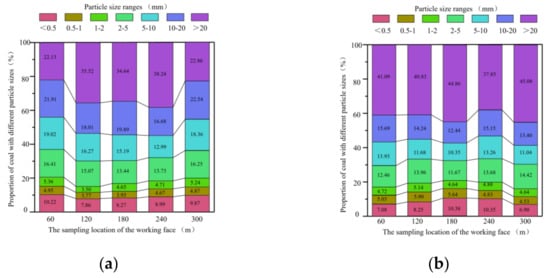
Figure 6.
Coal particle size distribution during production. (a) Particle size distribution during coal cutting. (b) Particle size distribution during coal caving.
It was found that the recovery ratio of the test working face was 88%. Furthermore, it was statistically found that the recovery ratio of cut coal and coal caving were 95 and 81%, respectively. Therefore, in the remnant coal in the goaf, the cut coal and caving coal accounted for 21 and 79% of the total amount, respectively. According to the test results of the particle size distribution of coal cutting and coal caving, the average particle size distribution of coal cutting, coal caving, and remnant coal in the goaf was as shown in Table 2.
Table 2.
Coal particle size distribution in the working face.
5.2. Validation of Prediction Model
The gas concentration data of 12,302 working face in three time periods were selected to calculate the actual gas emission quantity, and the coal particle size test results were put into the gas emission prediction model. The predicted value of the gas emission was then calculated and the results are shown in Figure 7. It was found that the measured minimum and maximum value of the gas emission in the actual production process were 5.42 and 10.47 m3/min, respectively. In addition, the minimum and maximum gas emission predicted by the gas emission prediction model based on the law of particle size coal desorption were 5.52 and 12.07 m3/min, respectively, and the correlation analysis between the predicted value of gas emission and the measured value shows that the correlation between the two groups of data reached 97%. Therefore, the prediction results could effectively reflect the variation law of gas emissions in the actual mining process of the working face.
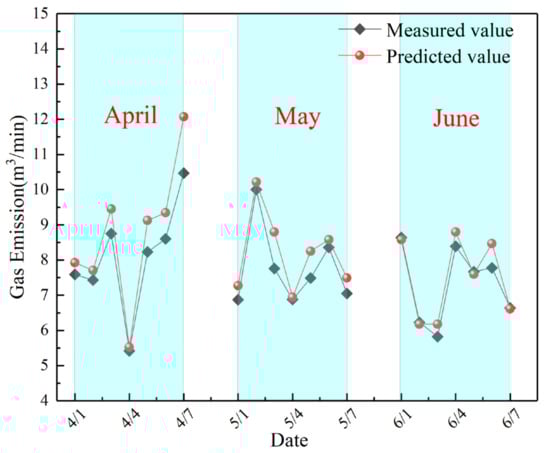
Figure 7.
Comparison between the measured and predicted gas emissions.
Further statistical comparison and verification of the results (field data and the model calculation results) showed that the prediction error of gas emission was between 0.37 and 15.30% (average error 5.29%). Therefore, it was evident that the prediction model of gas emission established in the current study, based on the distribution law of particle size, had good reliability and accuracy.
6. Discussion
6.1. Model Accuracy Conditions and Error Causes Analysis
A comparative study of the gas emissions predicted by the established model with the actual gas emission in the production process of the working face showed that the average error was 5.29%. It was evident that the model could effectively predict the amount of gas emissions, but there was still a need for further optimization. Therefore, it is necessary to find out the key factors affecting the prediction accuracy of the model and to provide a reference for further optimization of the subsequent gas emission prediction model.
A comparative analysis of the relationship between daily mining speed and the prediction error of the working face is shown in Figure 8. It was evident that at the daily mining speed of the working face between 4.5–7 m/d, the average error of the gas emission prediction model was 3.13%. However, when the daily mining speed of the working face increased by between 7–9 m/d, the average error reached 7.03% and the error further increased with the continued increase in the daily mining speed of working face. Therefore, it was noted that the prediction of the daily mining speed of the working face less than 9 m/d by this model was relatively accurate.
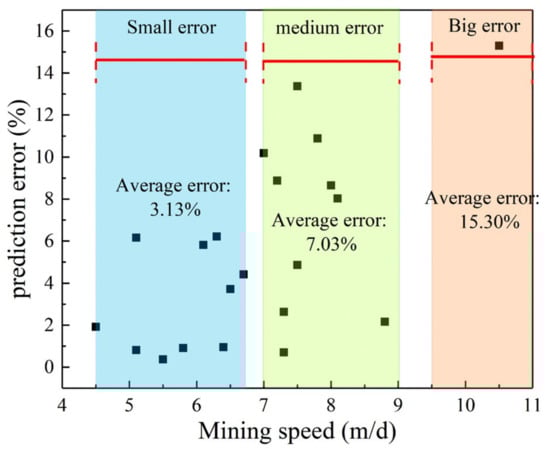
Figure 8.
Relationship between the prediction error of the gas emission amount and mining speed.
The daily mining speed of the working face directly affects the coal cutting and coal caving speed. This leads to a change in the coal particle size distribution law and affects the recovery ratio, which leads to an increase in remnant coal in the goaf.
6.2. Further Research Ideas
The current study analyzed the variation law of the gas desorption of coal with different particles through experiments and based on the desorption change law of coal with particle sizes. The prediction model of the gas emissions from coal was hence established. In addition, through random sampling on the site, the particle size distribution law of coal cutting and coal caving was tested to predict gas emissions.
First, the existing particle size distribution could be further subdivided to carry out more accurate research studies on the desorption law of the particle size the coal. The effect of coal particle size on its gas adsorption and desorption and a more accurate variation law of gas desorption in coal with different particle sizes was obtained.
Second, it was noted that predicting gas emission based on the distribution characteristics of coal particle size, the accuracy of the particle size distribution law of the working face directly affected the gas emissions. However, in the actual production process, the mining speed affected the particle size distribution of the coal at the working face and the effect of the mining speed on the particle size distribution was not considered in the model. Therefore, there was a need to test for the accuracy of the particle size distribution of coal. Nevertheless, the current testing method for coal particle size distribution in the working face was not efficient. In the current study, the random sampling method was applied for the test and, to a certain extent, it reflected the particle size distribution in the process of coal cutting and coal caving. However, there are certain limitations in characterizing the distribution law of coal particle size in the whole production face because of the large randomness of the samples. It is recommended that the future development of intelligent mine, real-time statistics, and the identification analysis of coal particle size in the process of coal cutting and caving should be carried out using a computer vision identification method.
Finally, in the process of establishing a gas emission model, more consideration should be placed on the influence law of mining speed on the amount of remnant coal in the goaf. The variation characteristic parameters of remnant coal in the goaf under the influence of mining speed should also be added to increase the accurate prediction of gas emissions in the working face production process.
7. Conclusions
(1) Coal particle size directly affects the gas desorption capacity. Increased coal particle size reduces the initial desorption intensity and the attenuation coefficient of gas emissions. When the coal particle size is smaller than 1 mm, the gas desorption occupies a large proportion in the first 20 min. When the particle size increases to more than 1 mm, more than 70% of the gas could then be desorbed in coal in the first 10 min. However, when the coal particle size increases to a certain level, especially when the coal particle size is greater than 10 mm, the initial desorption intensity and attenuation coefficient of gas emissions gradually maintain a constant value. This shows that the gas desorption capacity of coal stabilizes with the increase in coal particle size.
(2) The particle size test of the coal body during coal cutting and caving was separately carried out in the present study and the size distribution law of coal body was quantitatively analyzed. The obtained results showed that the particle sizes of coal cut and caved were between 2–5, 5–10, and 10–20 mm under the fully mechanized mining with top-coal caving process, each of which accounts for about 15% of the total amount, respectively. However, the particle size over 20 mm accounted for more than 30%, whereas the size below 2 mm accounted for only about 5%. Furthermore, it was found that the proportion of large particle size during caving coal was higher than that during cutting coal.
(3) The prediction models of gas emission during coal cutting, during coal caving, from coal wall, and from residual coal in the goaf were established separately according to the gas source in the working face and the desorption characteristics of the coal with different particle sizes. The correlation coefficient between the predicted and actual values was 0.97. In addition, the minimum and maximum errors of the established prediction model were 0.37% and 15.3%, respectively (the overall average error is 5.29%). When the daily mining speed of a working face was lower than 9 m/d, the average error of the gas emission prediction model was 5.08%.
Author Contributions
Conceptualization, C.C.; methodology, C.C.; validation, C.C., X.-Y.C. and H.G.; formal analysis, C.C.; investigation, C.C.; resources, H.G.; data curation, C.C.; writing—original draft preparation, X.-Y.C.; writing—review and editing, C.C.; visualization, C.C.; supervision, C.L.; project administration, W.-P.Y.; funding acquisition, C.C. All authors have read and agreed to the published version of the manuscript.
Funding
This research was funded by the National Natural Science Foundation of China, grant number 51874233.
Informed Consent Statement
Informed consent was obtained from all subjects involved in the study.
Data Availability Statement
The data used to support the findings of this study are available from the corresponding author upon request.
Conflicts of Interest
The authors declare no conflict of interest.
References
- Yuan, L. Scientific conception of precise coal mining. J. China Coal Soc. 2017, 42, 1–7. [Google Scholar]
- Shang, Y.; Hei, P.; Lu, S.; Shang, L.; Li, X.; Wei, Y.; Jia, D.; Jiang, D.; Ye, Y.; Gong, J.; et al. China’s energy-water nexus: Assessing water conservation synergies of the total coal consumption cap strategy until 2050. Appl. Energy. 2018, 210, 643–660. [Google Scholar] [CrossRef]
- Kai, W.; Feng, D. Coal-gas compound dynamic disastersin China: A review. Process Saf. Environ. Prot. 2020, 133, 1–17. [Google Scholar]
- Liu, T.; Lin, B.; Yang, W.; Liu, T.; Zhai, C. An integrated technology for gas control and green mining in deep mines based on ultra-thin seam mining. Environ. Earth Sci. 2017, 76, 243–259. [Google Scholar] [CrossRef]
- Zhang, X.; Shan, J.; Peng, S. Mathematical geology technique and method for prediction of gas content and emission. China Coal Soc. 2009, 34, 350–354. [Google Scholar]
- Du, F.; Wang, K.; Zhang, X.; Zhang, X.; Xin, C.; Shu, L.; Wang, G. Experimental study of coal-gas outburst: Insights from coal-rock structure, gas pressure and adsorptivity. Nat. Resour. Res. 2020, 29, 2481–2493. [Google Scholar] [CrossRef]
- Dong, D. Mine gas emission prediction based on Gaussian process model. Procedia Eng. 2012, 45, 334–338. [Google Scholar] [CrossRef]
- Yang, D.; Chen, Y.; Tang, J.; Jiang, C. Comparative experimental study of methods to predict outburst risk when uncovering coal in crosscuts. Fuel 2021, 288, 119851. [Google Scholar] [CrossRef]
- Liang, C.; Wang, E.; Feng, J.; Kong, X.; Li, X.; Zhang, Z. A Dynamic Gas Emission Prediction Model at the Heading Face and its Engineering Application. J. Nat. Gas Sci. Eng. 2016, 30, 228–236. [Google Scholar]
- Ruppel, T.C.; Grein, C.T.; Bienstock, D. Adsorption of methane on dry coal at elevated pressure. Fuel 1974, 53, 152–162. [Google Scholar] [CrossRef]
- Jin, K.; Cheng, Y.; Liu, Q.; Zhao, W.; Wang, L.; Wang, F.; Wu, D. Experimental investigation of pore structure damage in pulverized coal: Implications for methane adsorption and diffusion characteristics. Energy Fuels 2016, 30, 10383–10395. [Google Scholar] [CrossRef]
- Cheng, Y.; Pan, Z. Reservoir properties of Chinese tectonic coal: A review. Fuel 2020, 260, 116350. [Google Scholar] [CrossRef]
- Busch, A.; Gensterblum, Y.; Krooss, B.M.; Littke, R. Methane and carbon dioxide adsorption–diffusion experiments on coal: Upscaling and modeling. Coal Geo. 2004, 60, 151–168. [Google Scholar] [CrossRef]
- Zhao, W.; Cheng, Y.; Jiang, H.; Jin, K.; Wang, H.; Wang, L. Role of the rapid gas desorption of coal powders in the development stage of outbursts. J. Nat. Gas Sci. Eng. 2016, 28, 491–501. [Google Scholar] [CrossRef]
- Zhao, W.; Wang, K.; Liu, S.; Cheng, Y. Gas transport through coal particles: Matrix-flux controlled or fracture-flux controlled? J. Nat. Gas Sci. Eng. 2020, 76, 103216. [Google Scholar] [CrossRef]
- Li, C.W.; Xue, H.L.; Liu, W.B. Experimental study on gas diffusion in coal under stress. J. China Coal Soc. 2018, 43, 717–723. [Google Scholar]
- Guo, X.; Cai, W.; Ma, S. Continuity prediction of gas emission during drivage in coal seam based on stable percolation. China Coal Soc. 2010, 35, 932–936. [Google Scholar]
- Yang, L.; Liu, C.C. Prediction of Gas emission based on partial correlation analysis and SVR. Appl. Math. Inf. Sci. 2013, 7, 1671–1675. [Google Scholar] [CrossRef][Green Version]
- Wu, L.; Liu, S.; Chen, D.; Yao, L.; Cui, W. Using gray model with fractional order accumulation to predict gas emission. Nat. Hazards 2014, 71, 2231–2236. [Google Scholar] [CrossRef]
- Chen, Y.; Zheng, L.; Huang, J.; Zou, Z.; Li, C. Prediction of gas emission based on grey-generalized regression neural network. IOP Conf. Series Earth Environ. Sci. 2020, 467, 012056. [Google Scholar] [CrossRef]
- Fu, H.; Jiang, W.; Shan, X. Study on coupling algorithm on coal mine gas emission forecast model. J. China Coal Soc. 2012, 37, 654–658. [Google Scholar]
- Gao, J.L.; Hou, S.Z. Dynamic distribution of gas pressure and emission around a diving roadway. J. China Coal Sci. 2007, 32, 1127–1131. [Google Scholar]
- Gao, J.L.; Wu, J.G. Determination of time step and space interval in numerical simulation of gas flow in coal seams. China Saf. Sci. J. 2006, 16, 9–12. [Google Scholar]
- Liu, W.; Song, H.T.; Li, X.F. Dimensionless analysis on gas emission law around tunneling face. J. China Coal Sci. 2015, 40, 882–887. [Google Scholar]
- Liang, B.; Liu, J.N.; Sun, W.J. Numerical simulation of flowing gas on heading face during coal mining. Chin. J. Geo. Hazard Control 2011, 22, 46–51. [Google Scholar]
- Zhang, H.J.; Zhang, L.; Liu, Y.Q.; Sun, J.H. Prediction of gas emission volume from driving face based on seepage mechanics. Coal Sci. Technol. 2015, 43, 82–86. [Google Scholar]
Publisher’s Note: MDPI stays neutral with regard to jurisdictional claims in published maps and institutional affiliations. |
© 2022 by the authors. Licensee MDPI, Basel, Switzerland. This article is an open access article distributed under the terms and conditions of the Creative Commons Attribution (CC BY) license (https://creativecommons.org/licenses/by/4.0/).