


Research on the Pounding Response and Pounding Effect of a Continuous Rigid-Frame Bridge with Fabricated Super-High Piers Connected by Grouting Sleeves

 ,
,
Abstract
:1. Introduction
2. Experimental Design
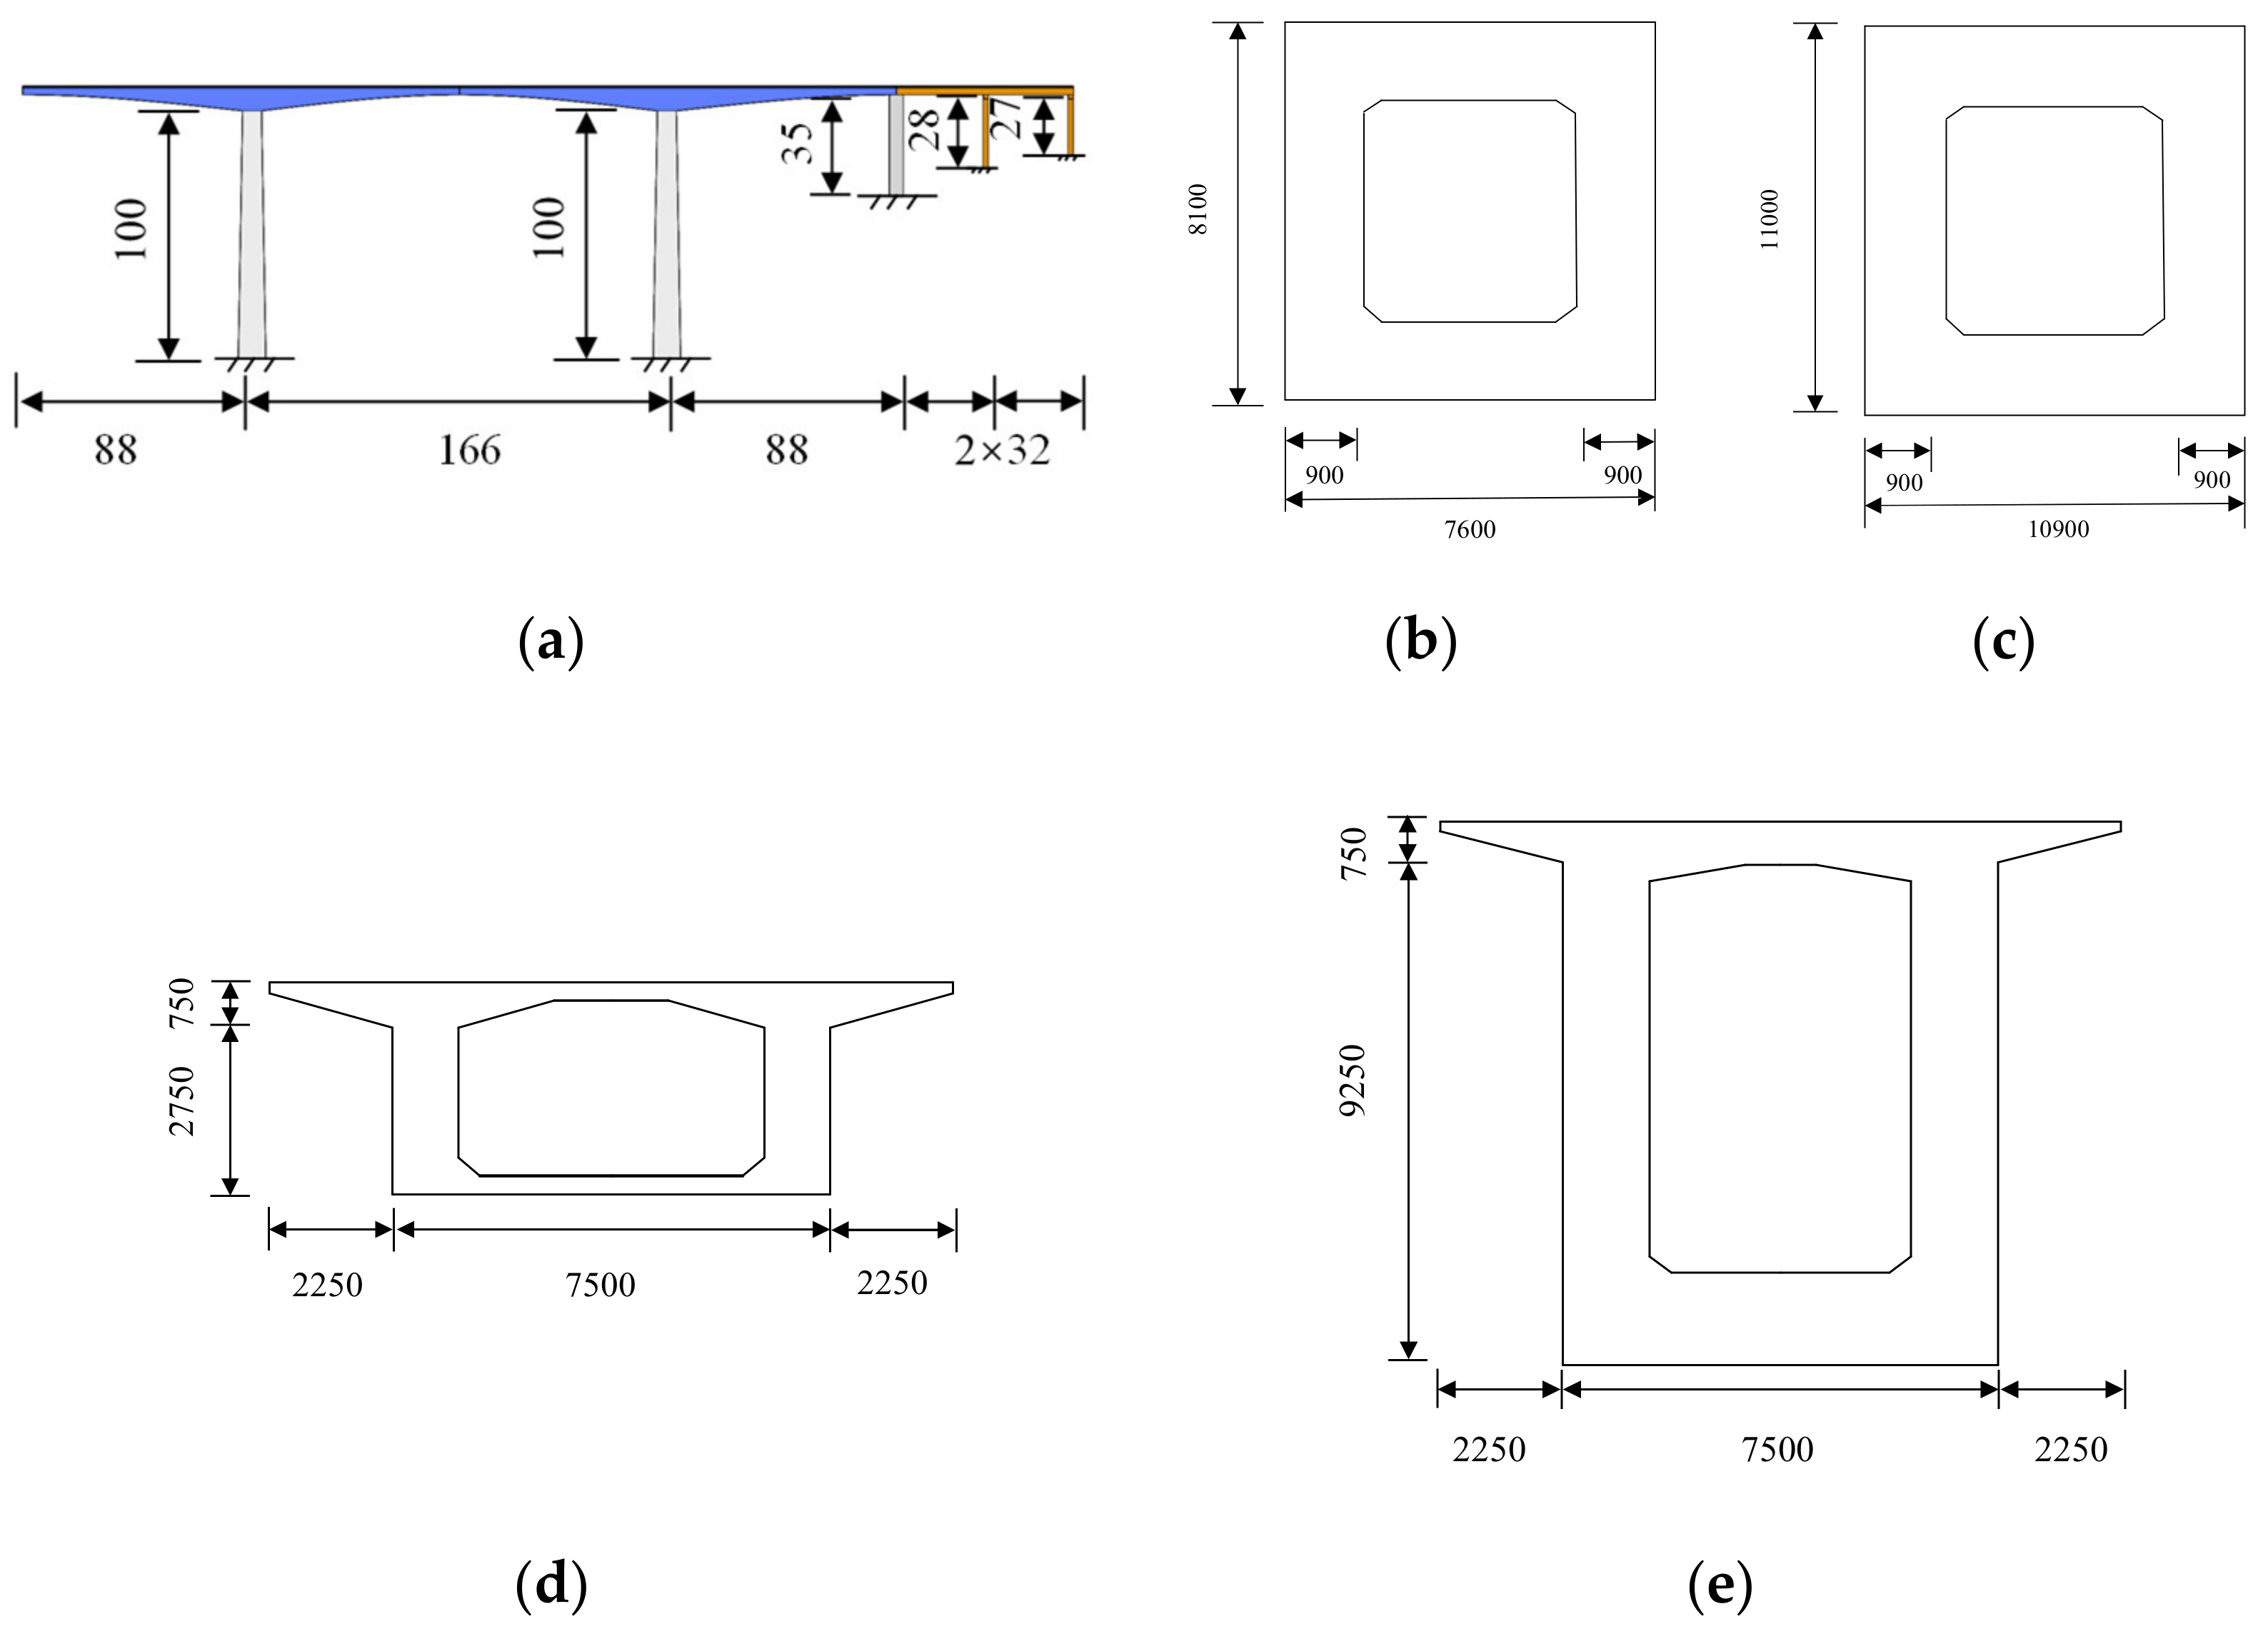
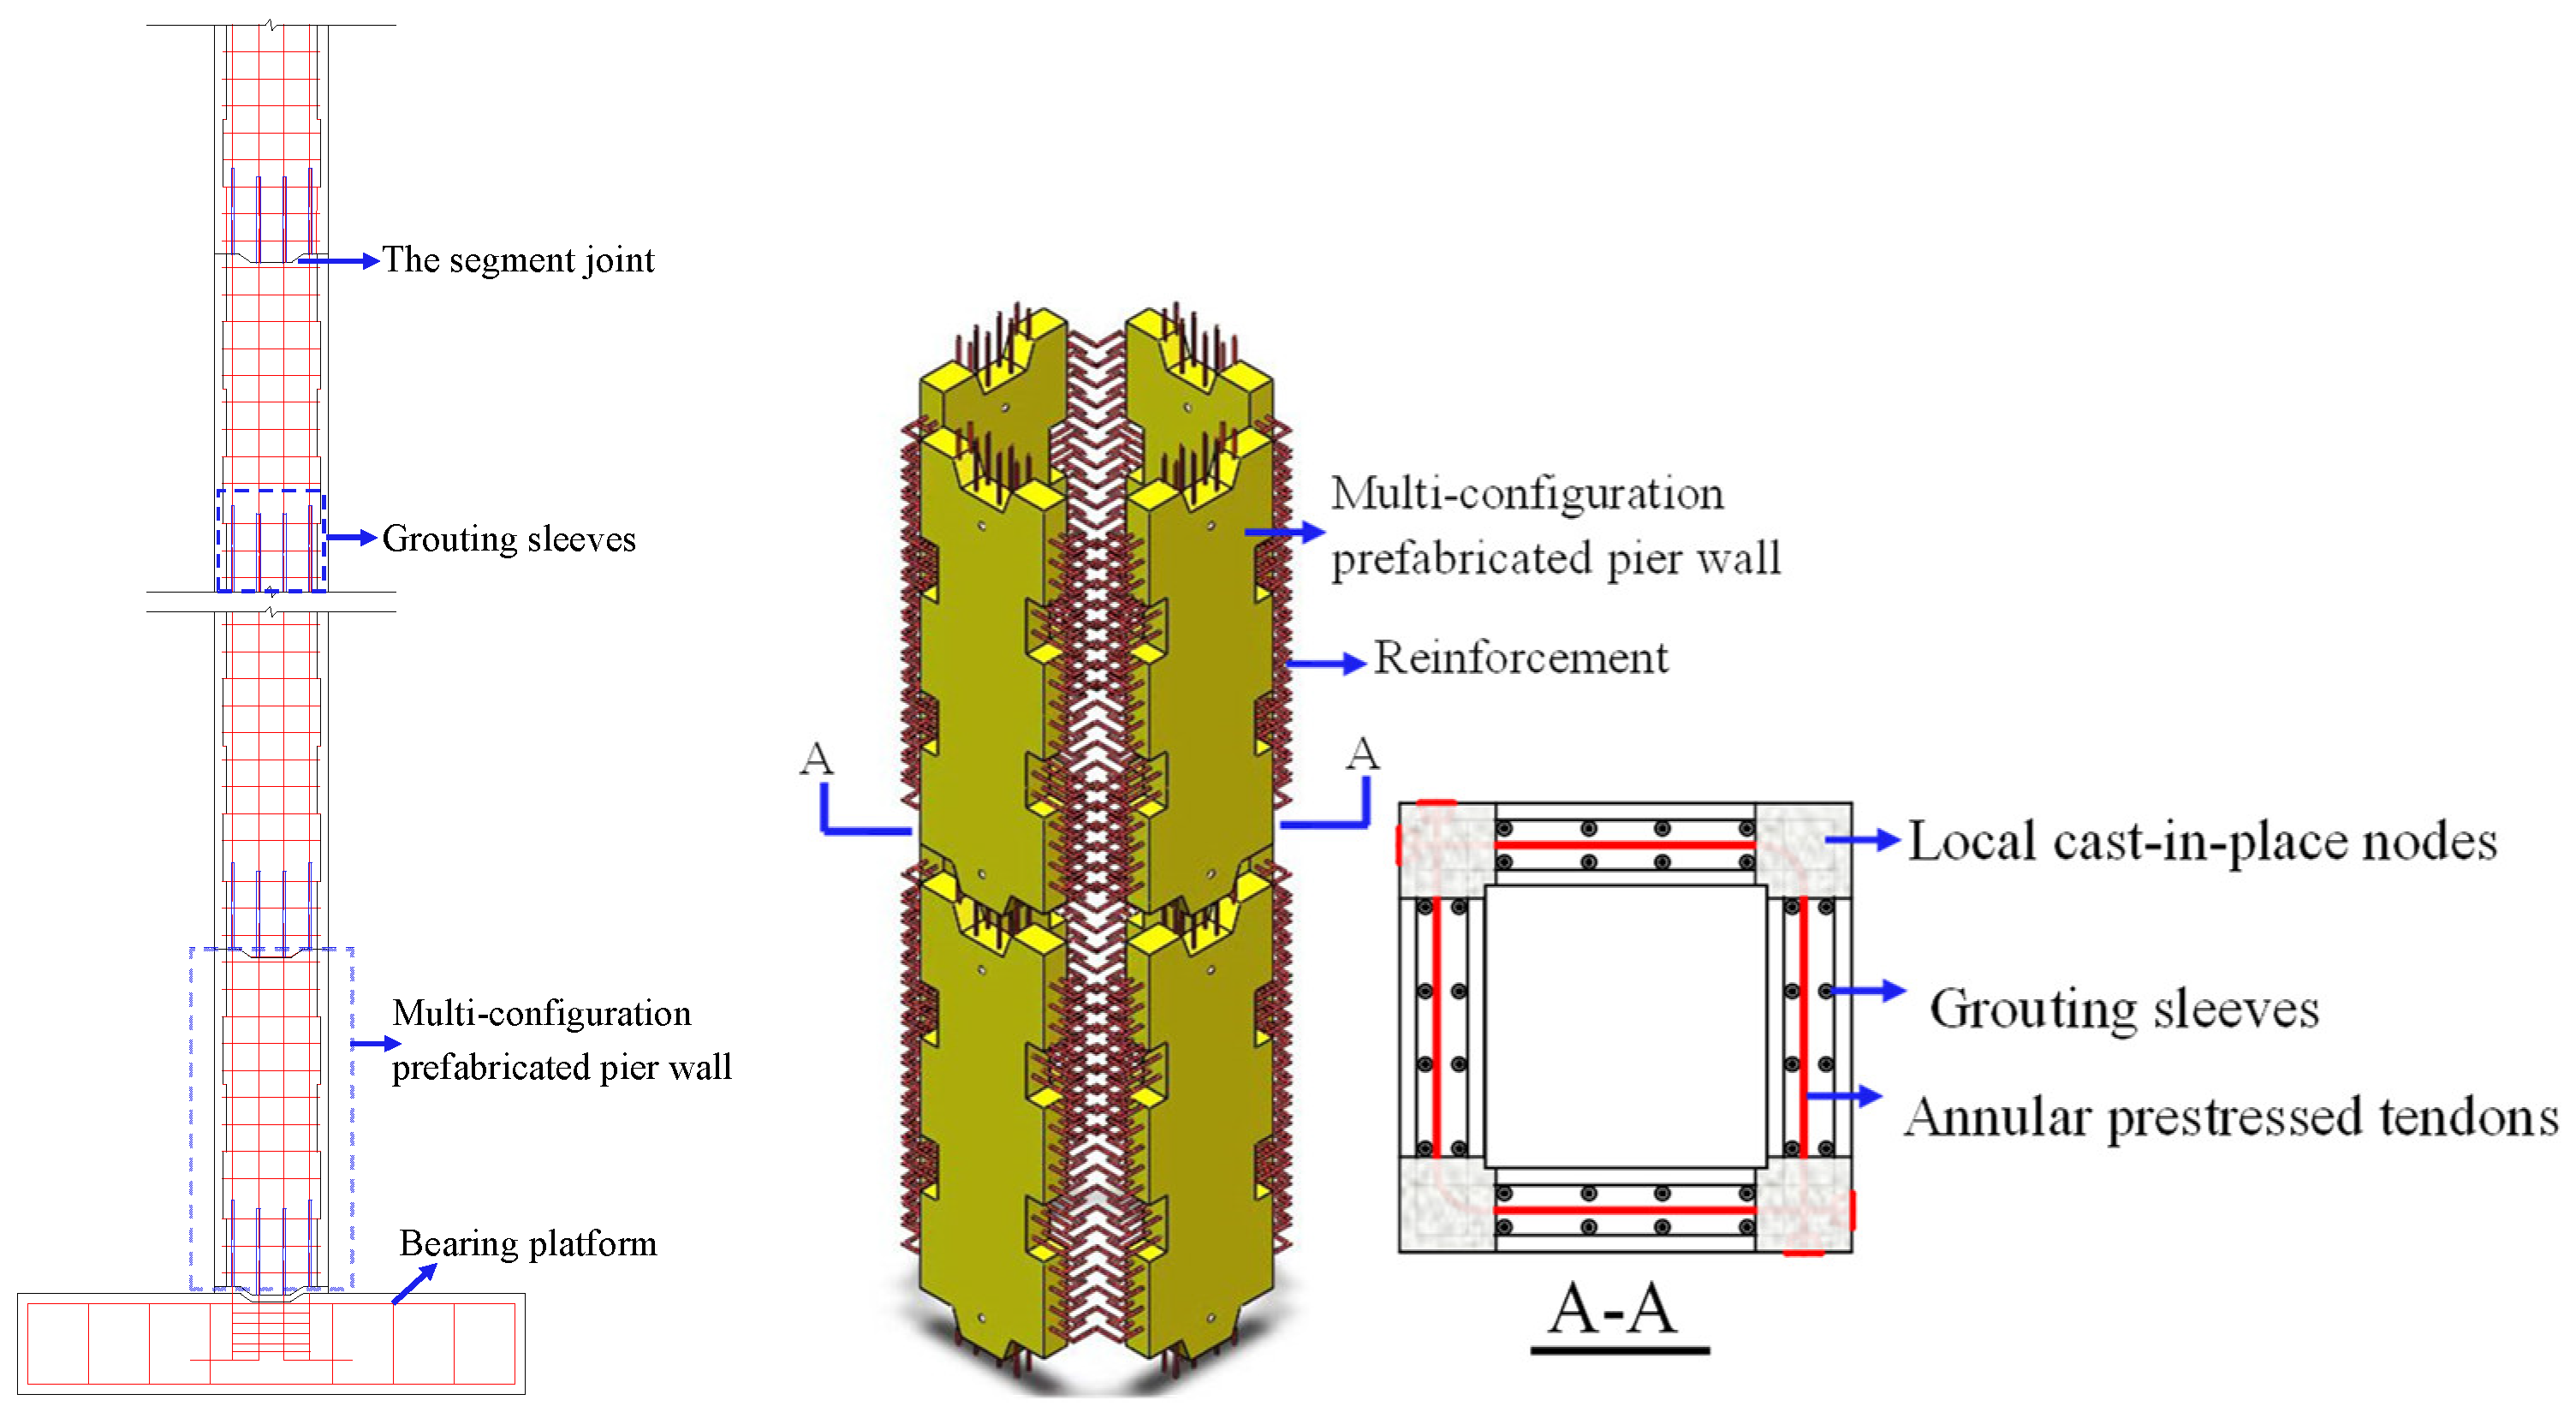
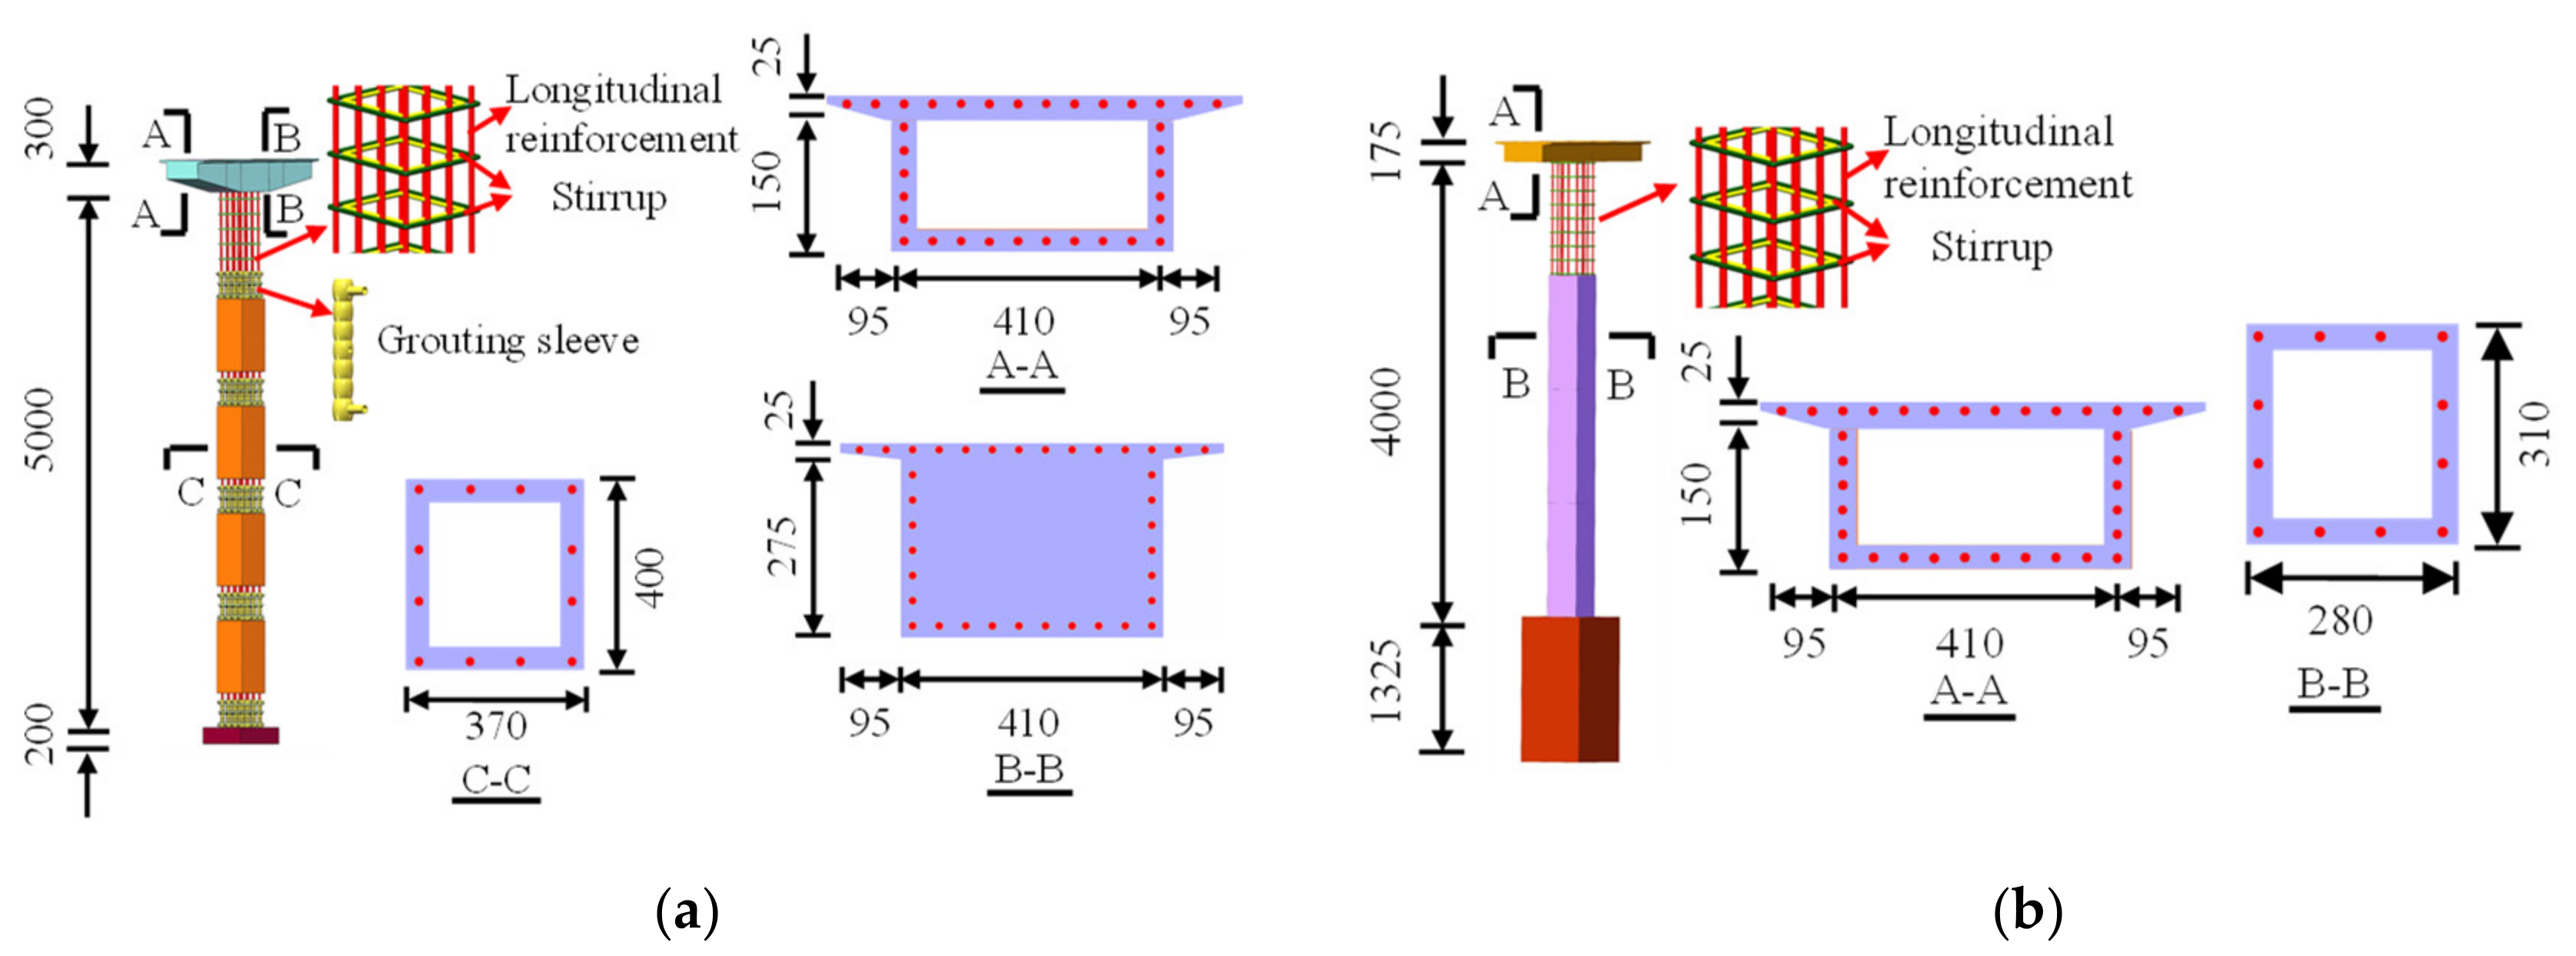
2.1. Bridge Model Design
- (1)
- CRFB-FSP models
- (2)
- Adjacent bridge model
2.2. Material Properties
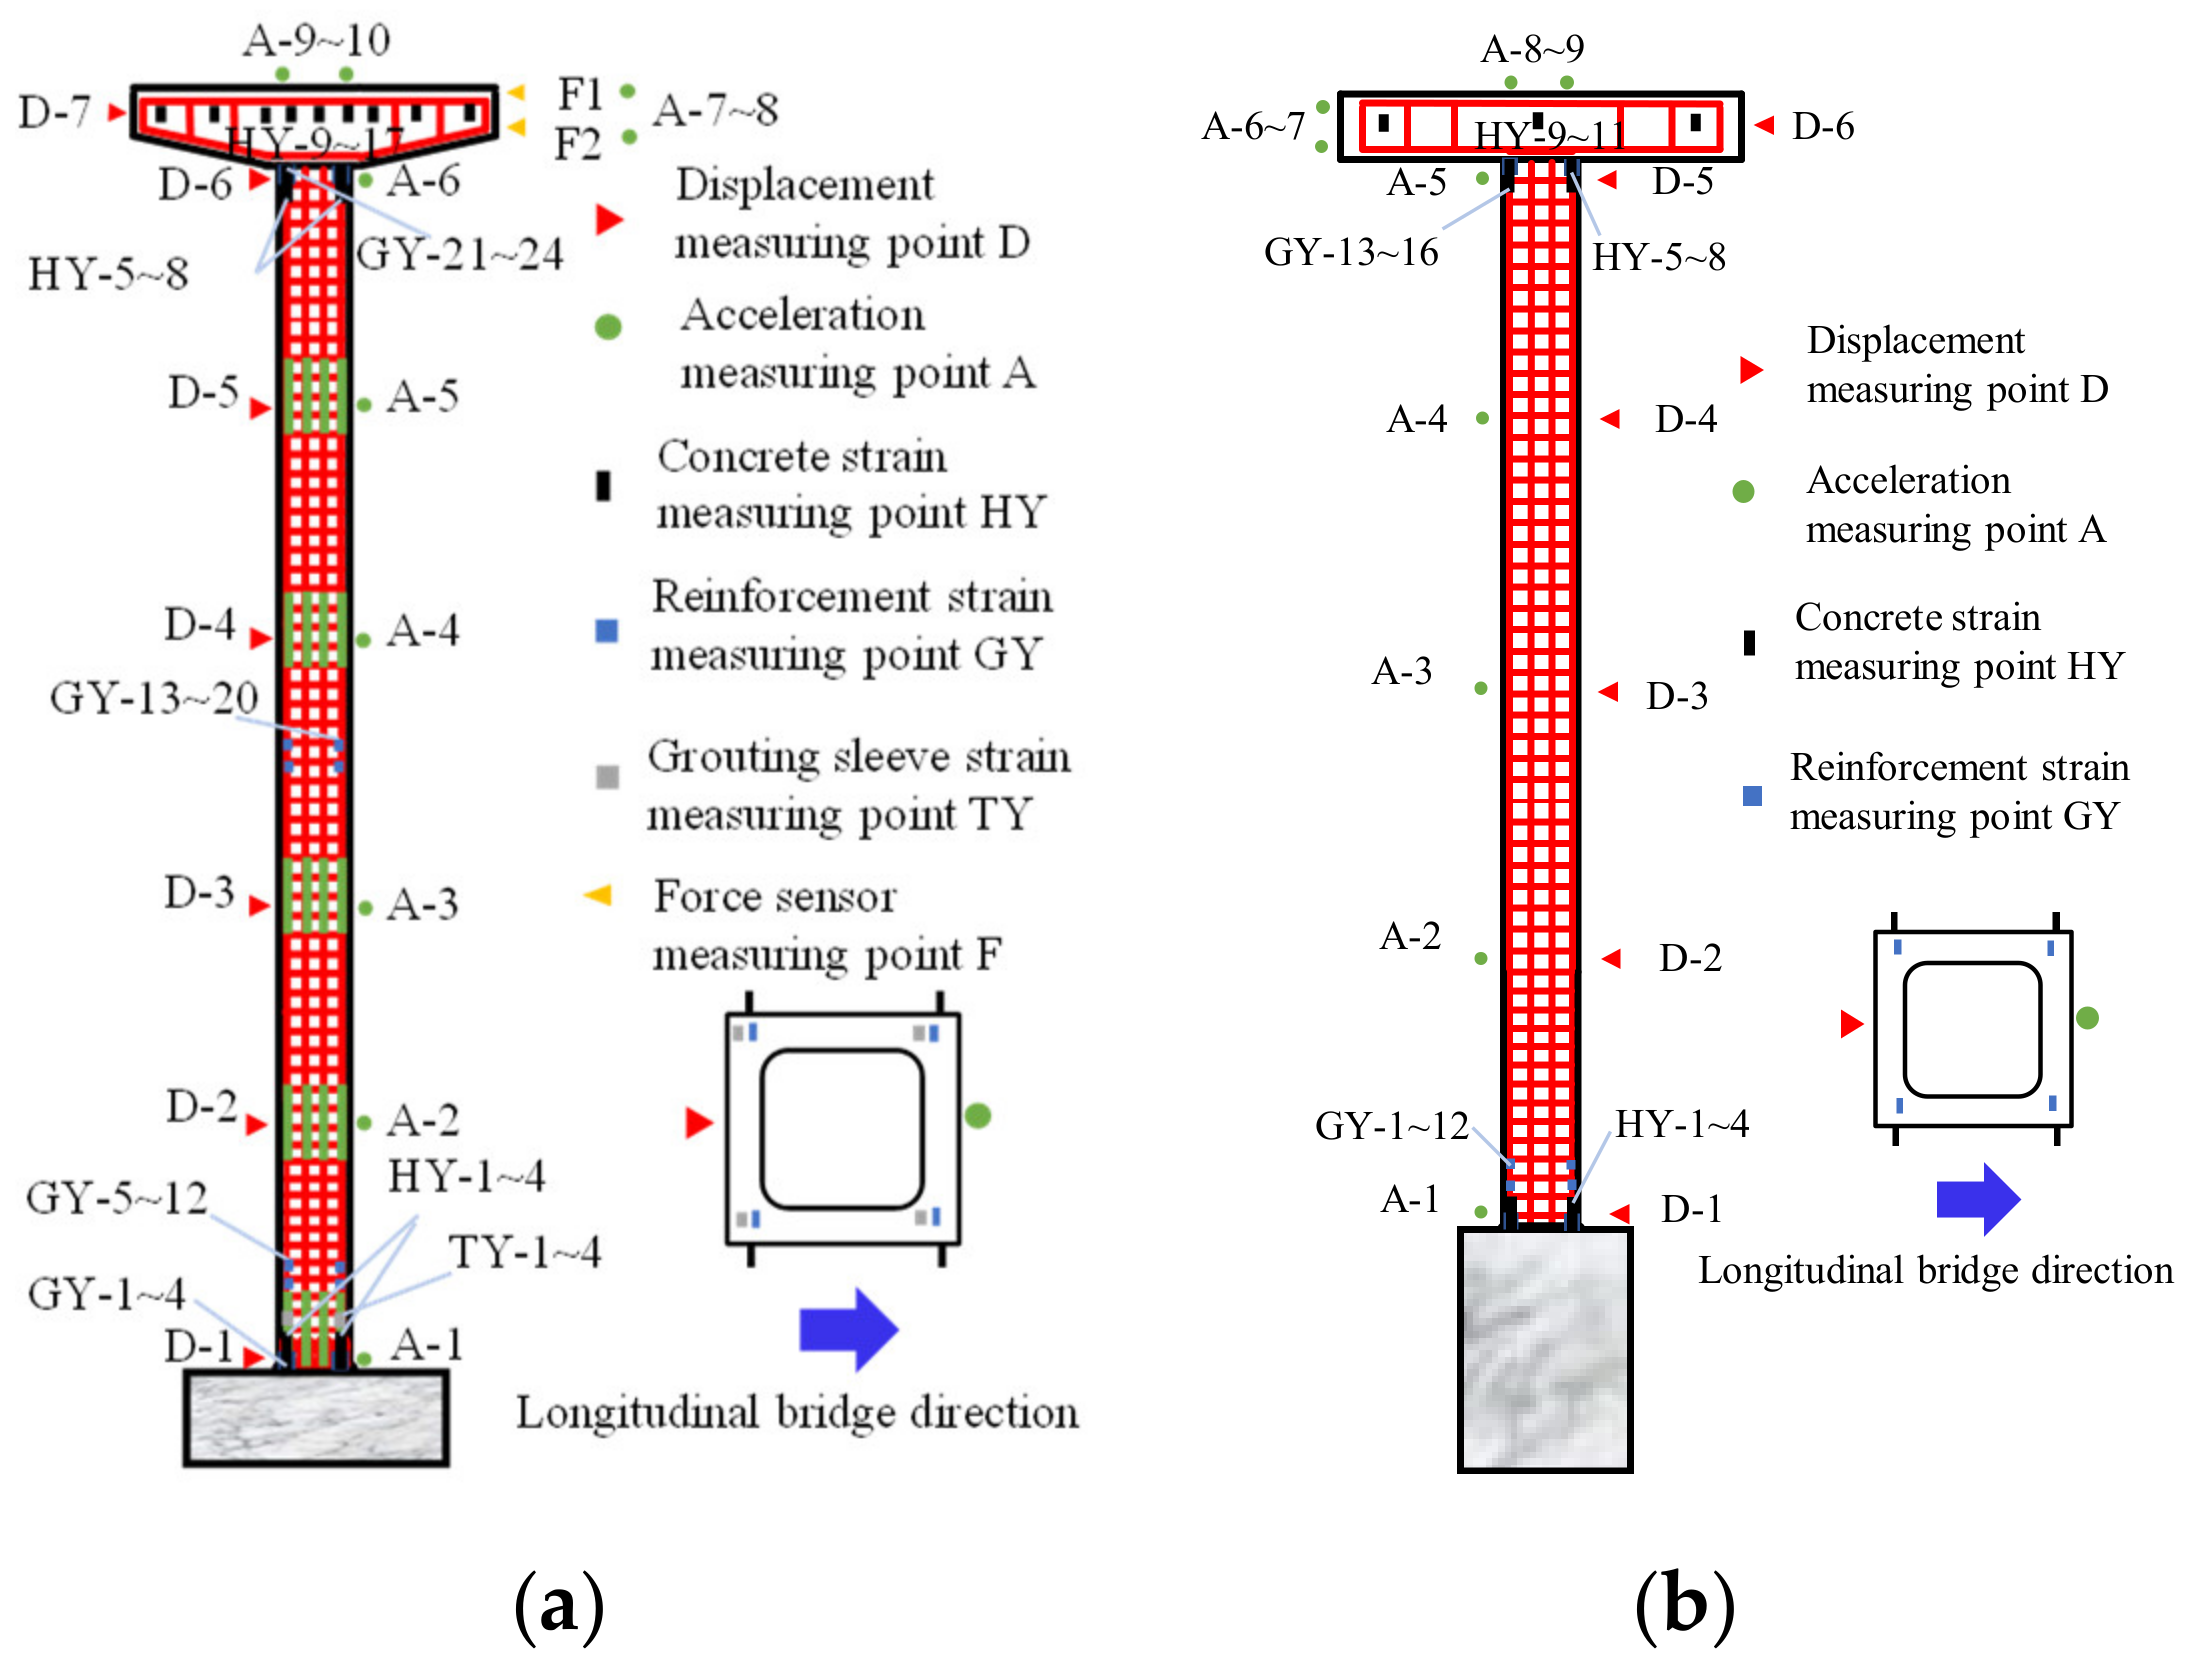
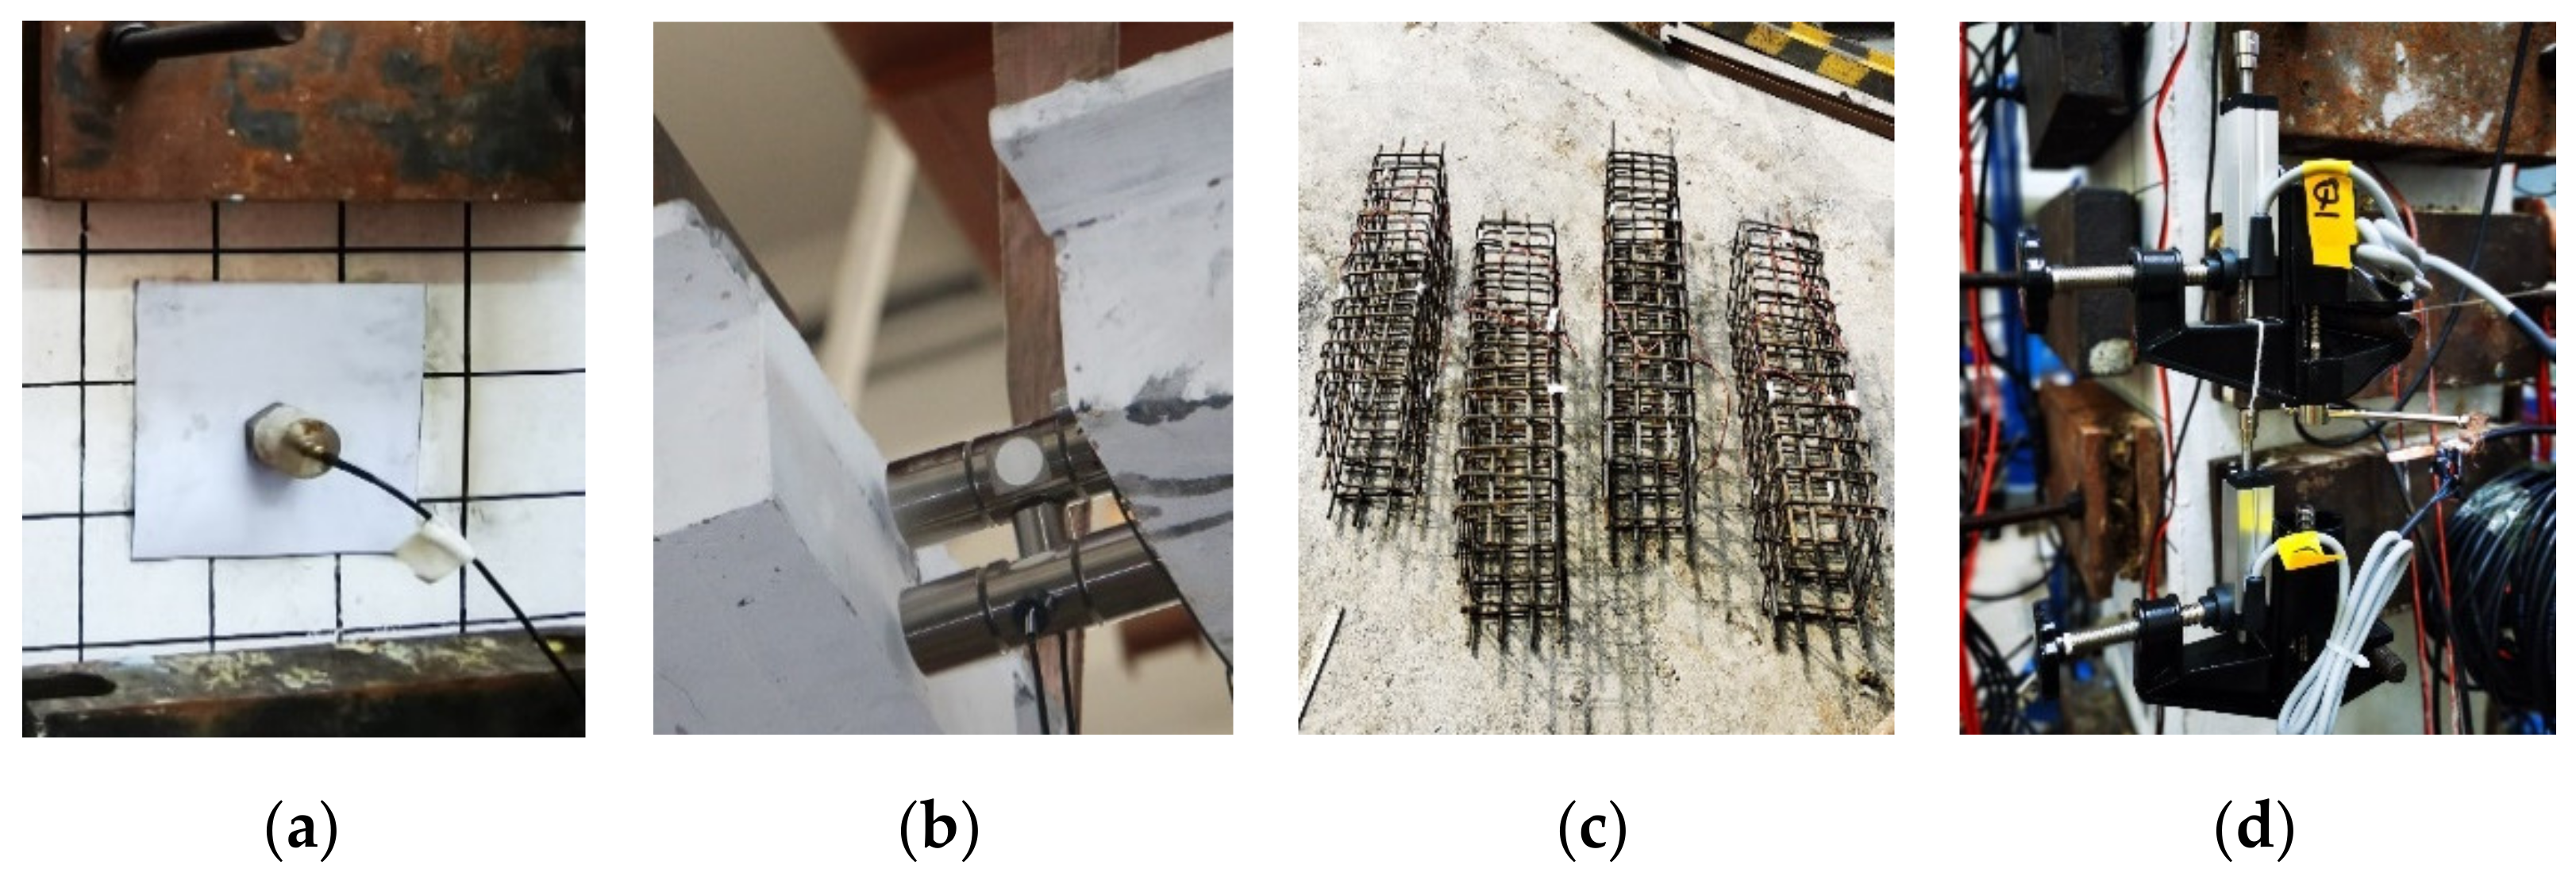
2.3. Layout of Measurement Points
2.4. Test Cases
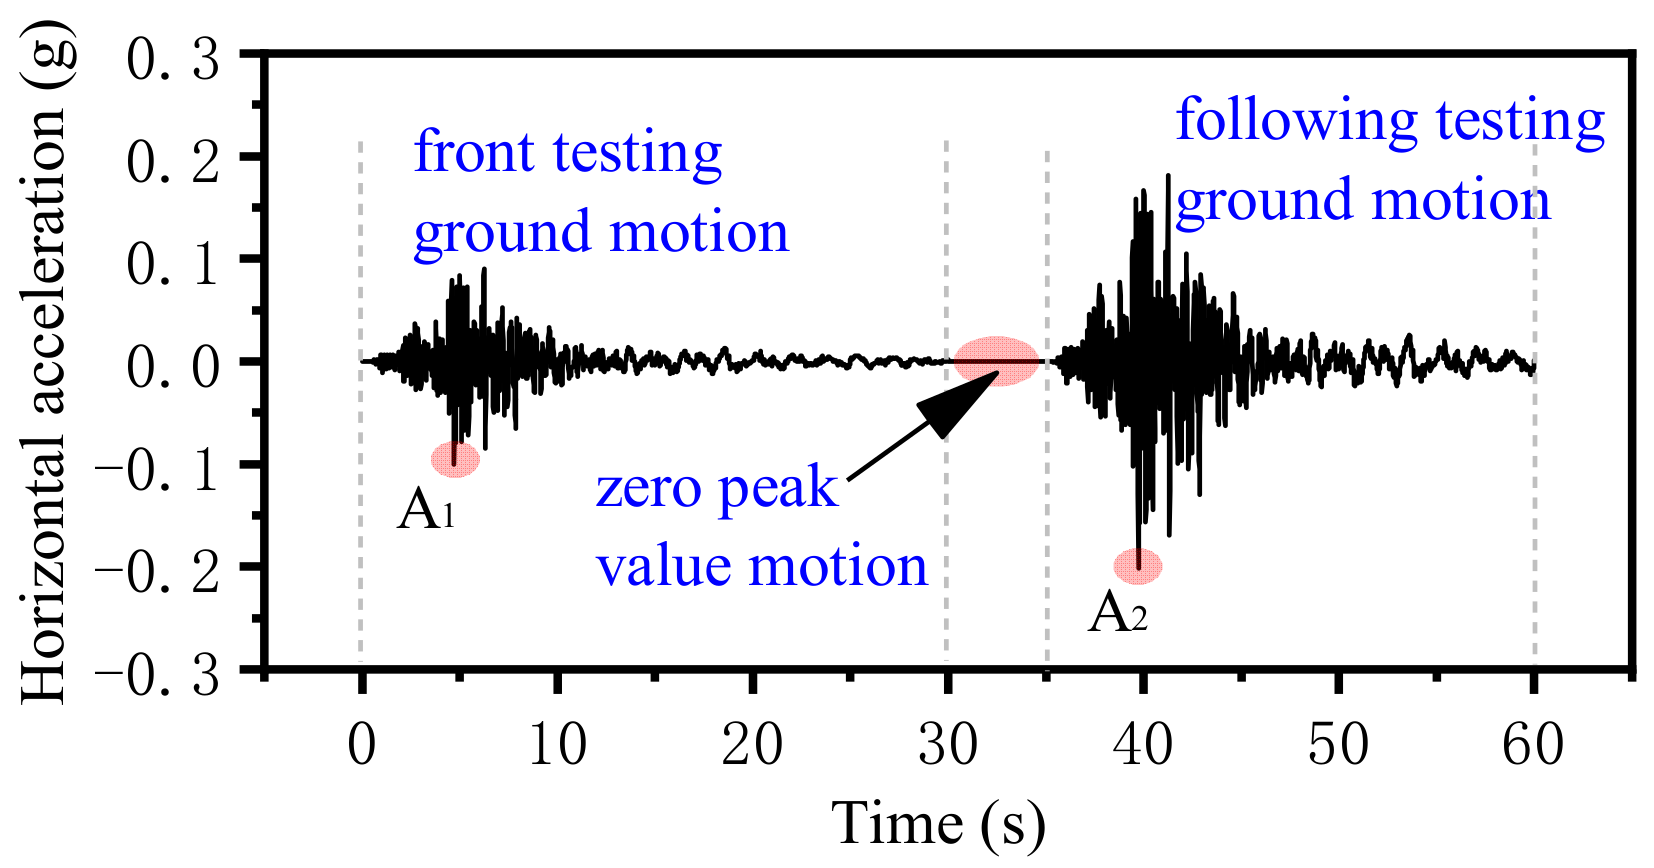
2.5. Test Condition Design
3. Test Results
3.1. Pounding Force
3.2. Displacement
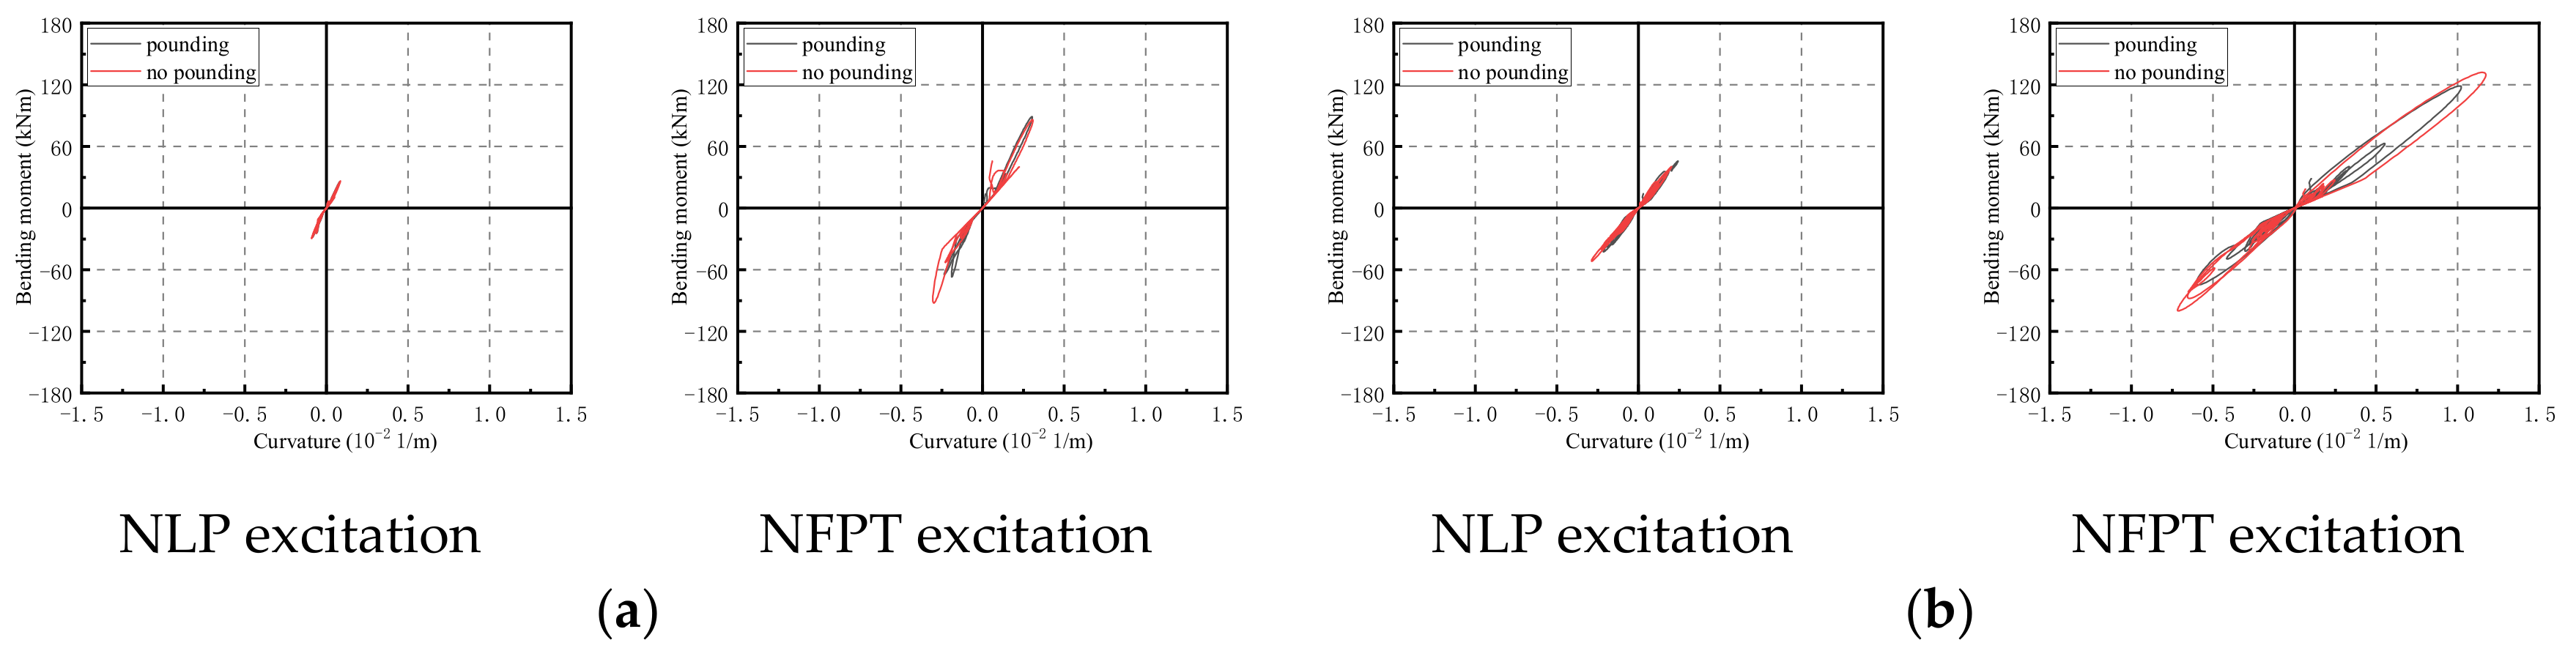
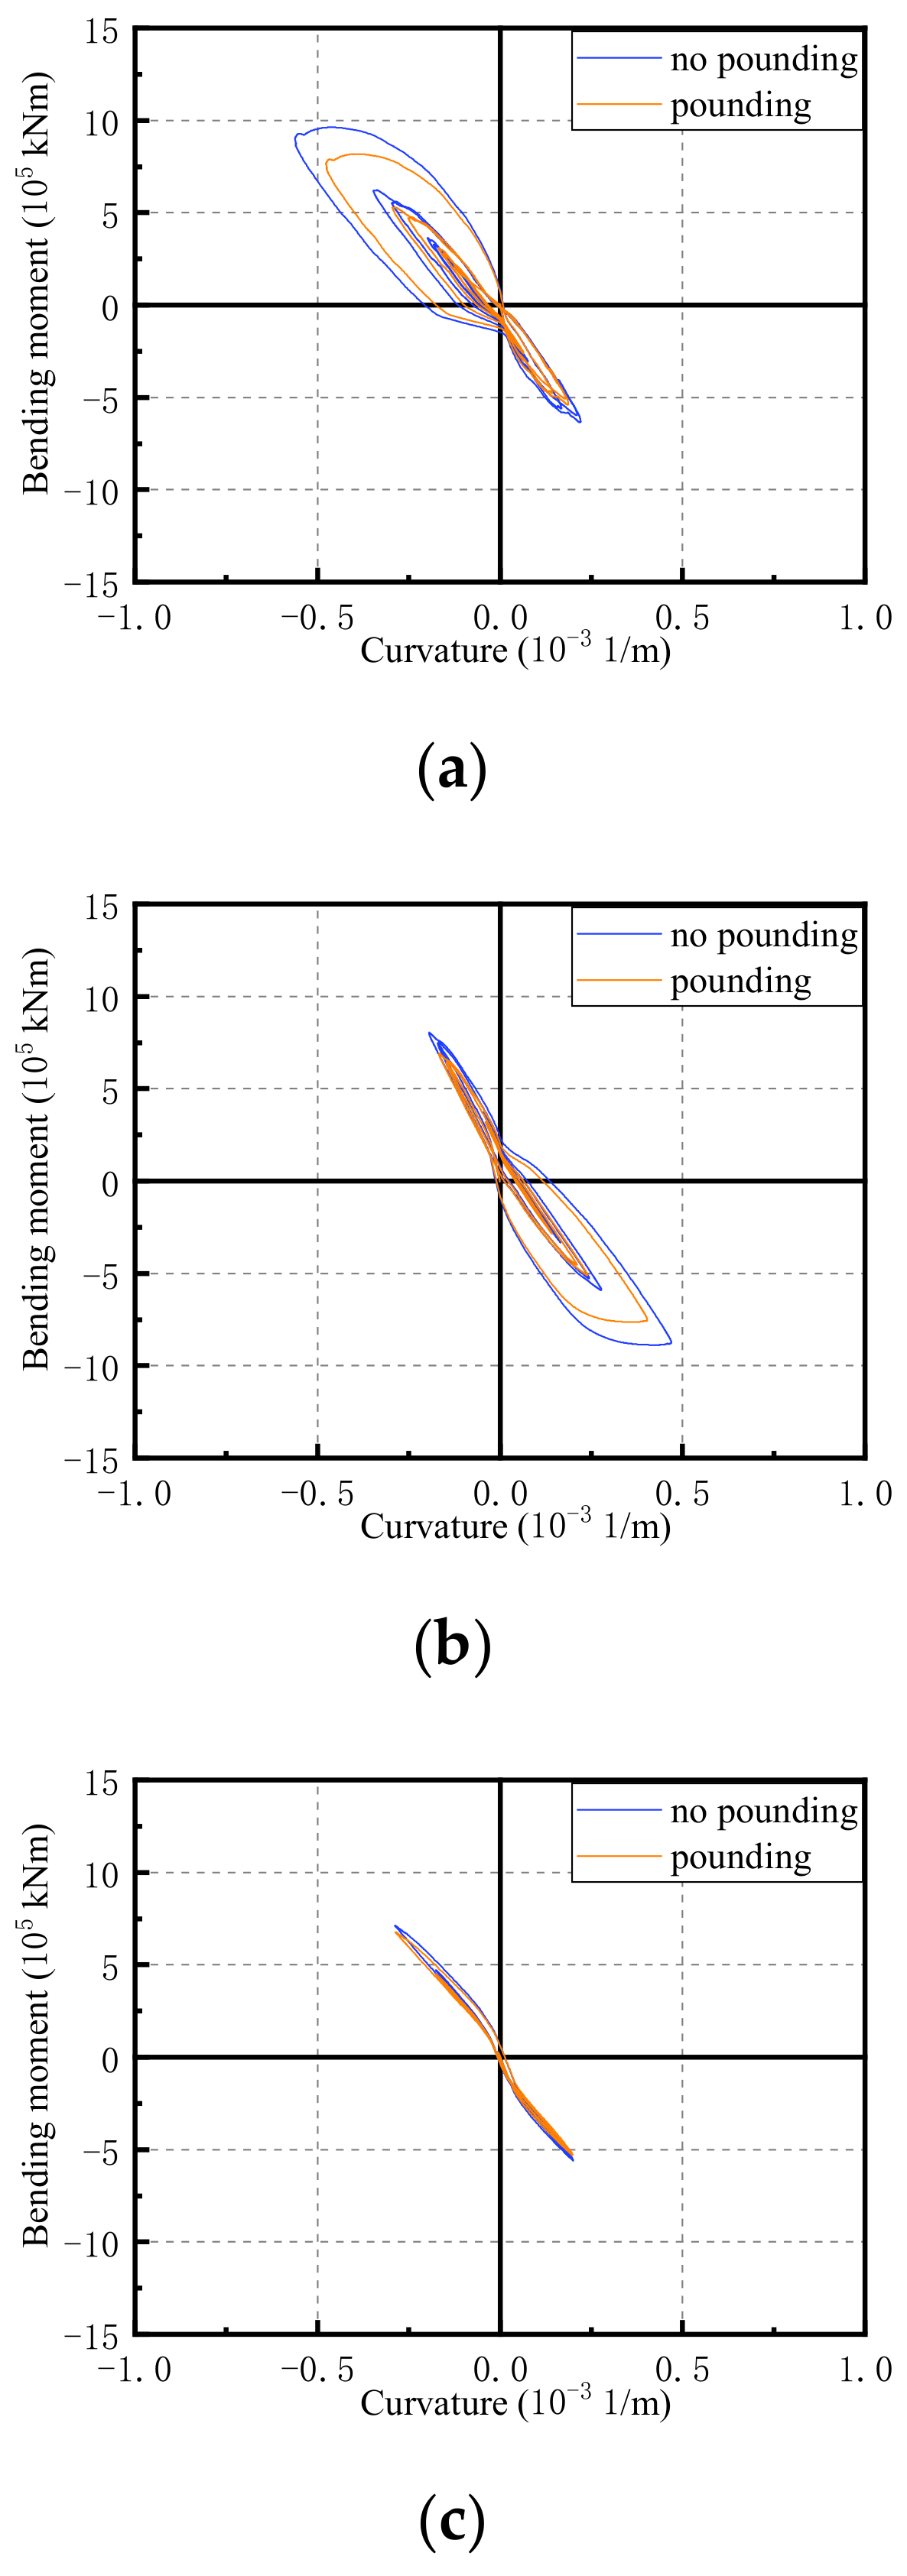
3.3. Bending Moment Curvature
4. Finite Element Analysis (FEA)
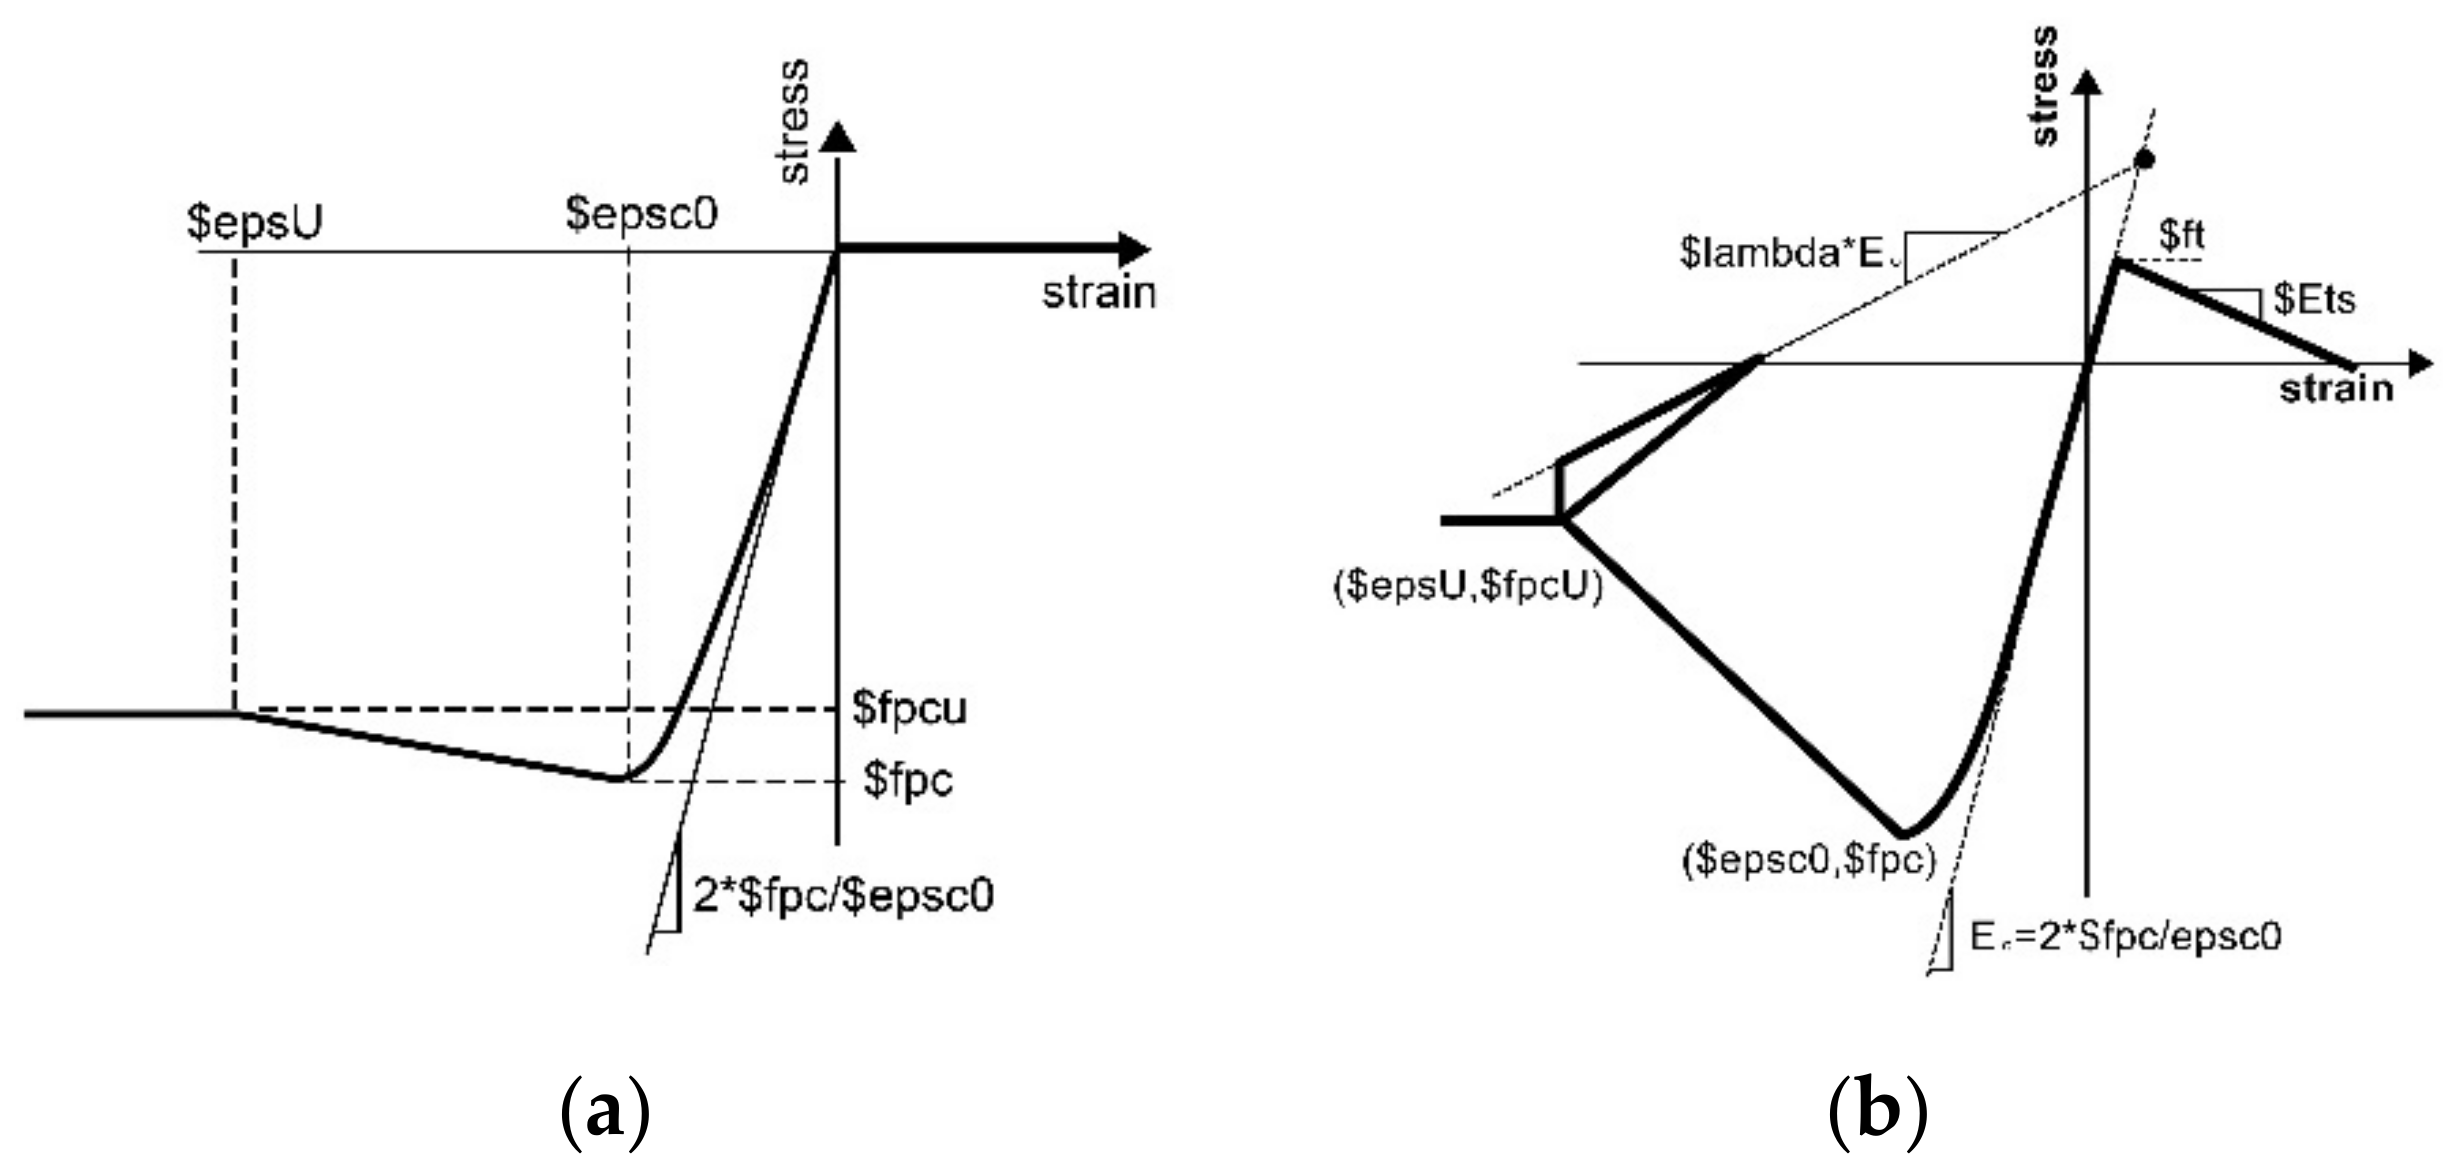
4.1. Finite Element Model (FEM)
4.2. Test Condition and Test Cases
4.3. FEM Verification
4.3.1. Frequency
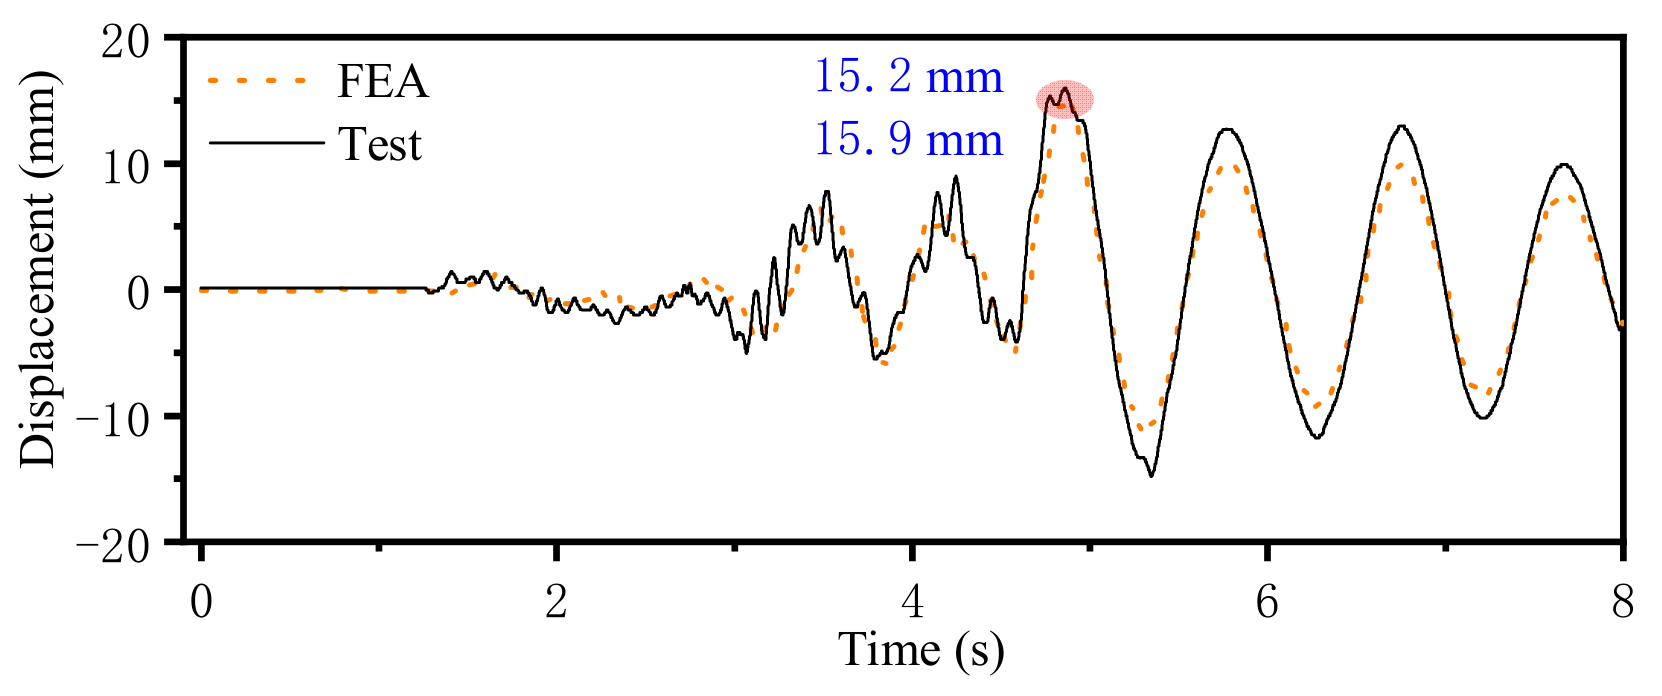
4.3.2. Displacement
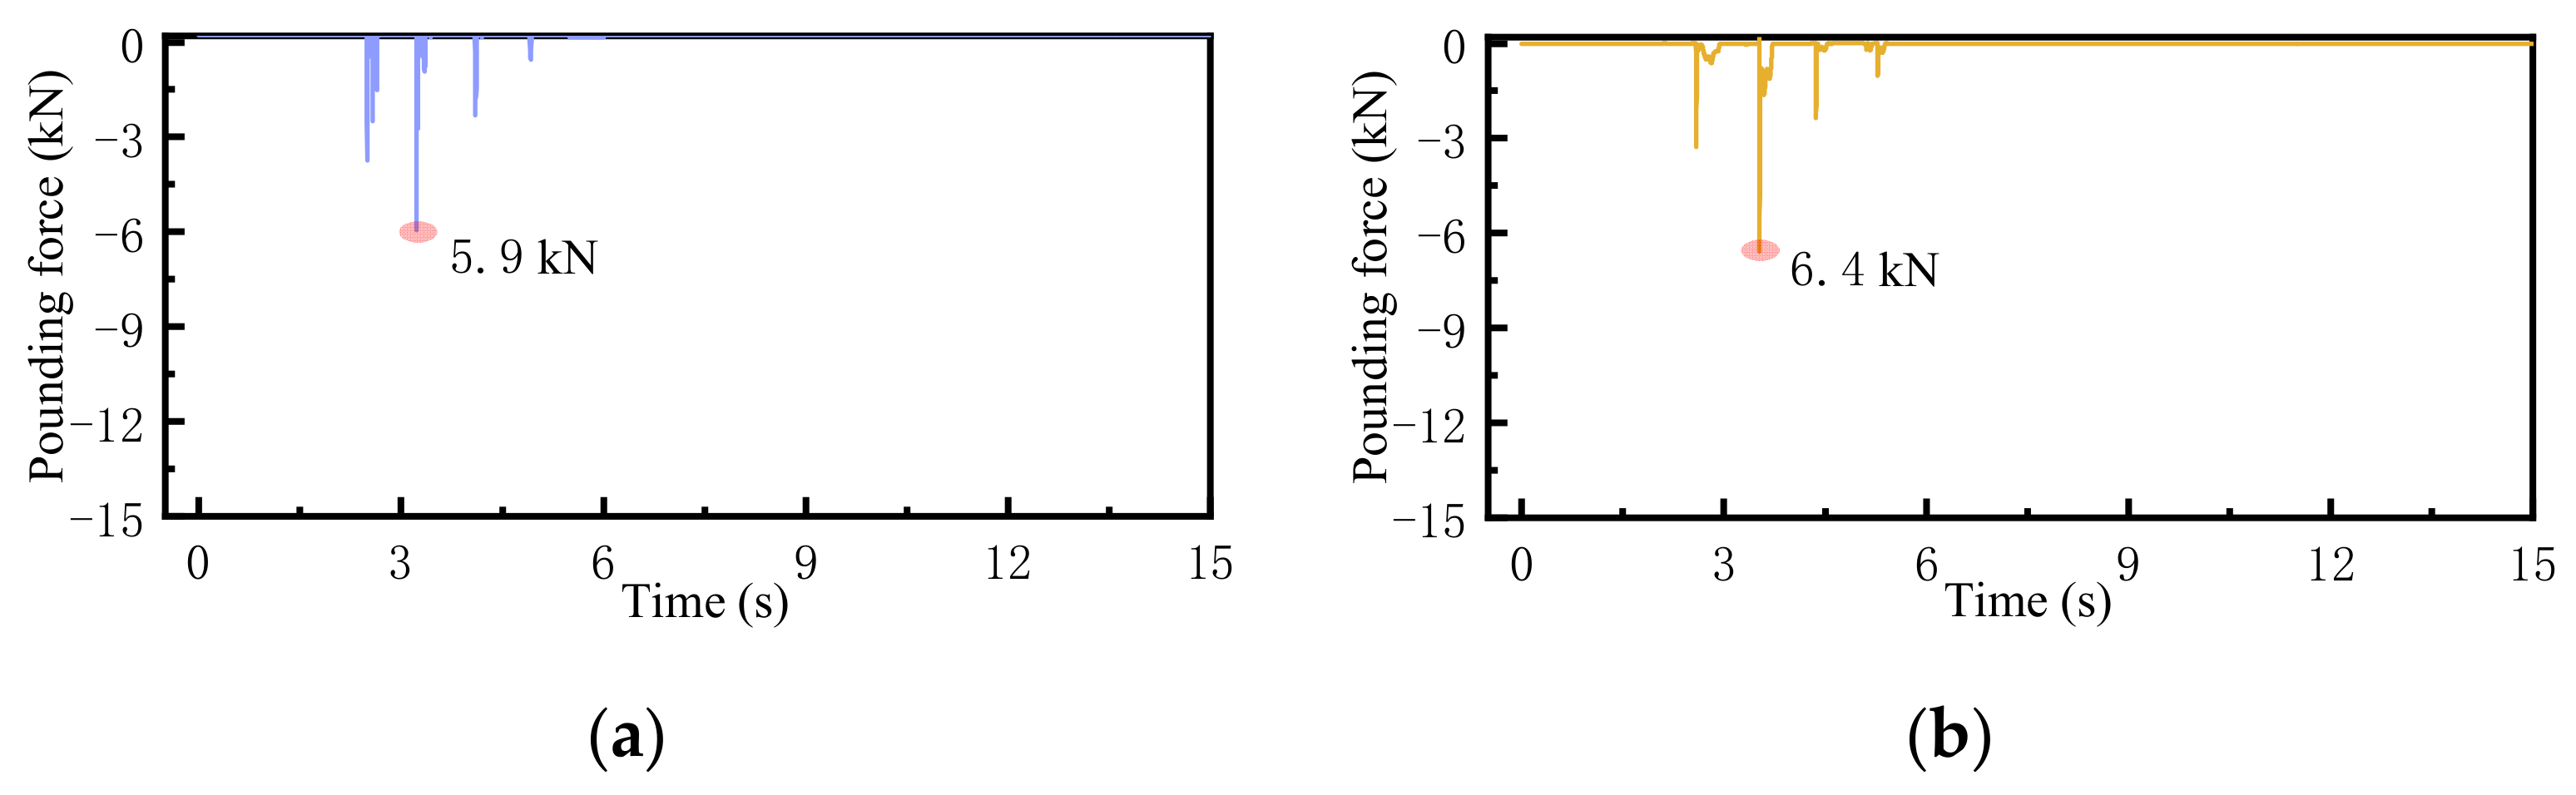
4.3.3. Pounding Force
4.4. FEA Results
4.4.1. Initial Gap and Pounding Stiffness
- (1)
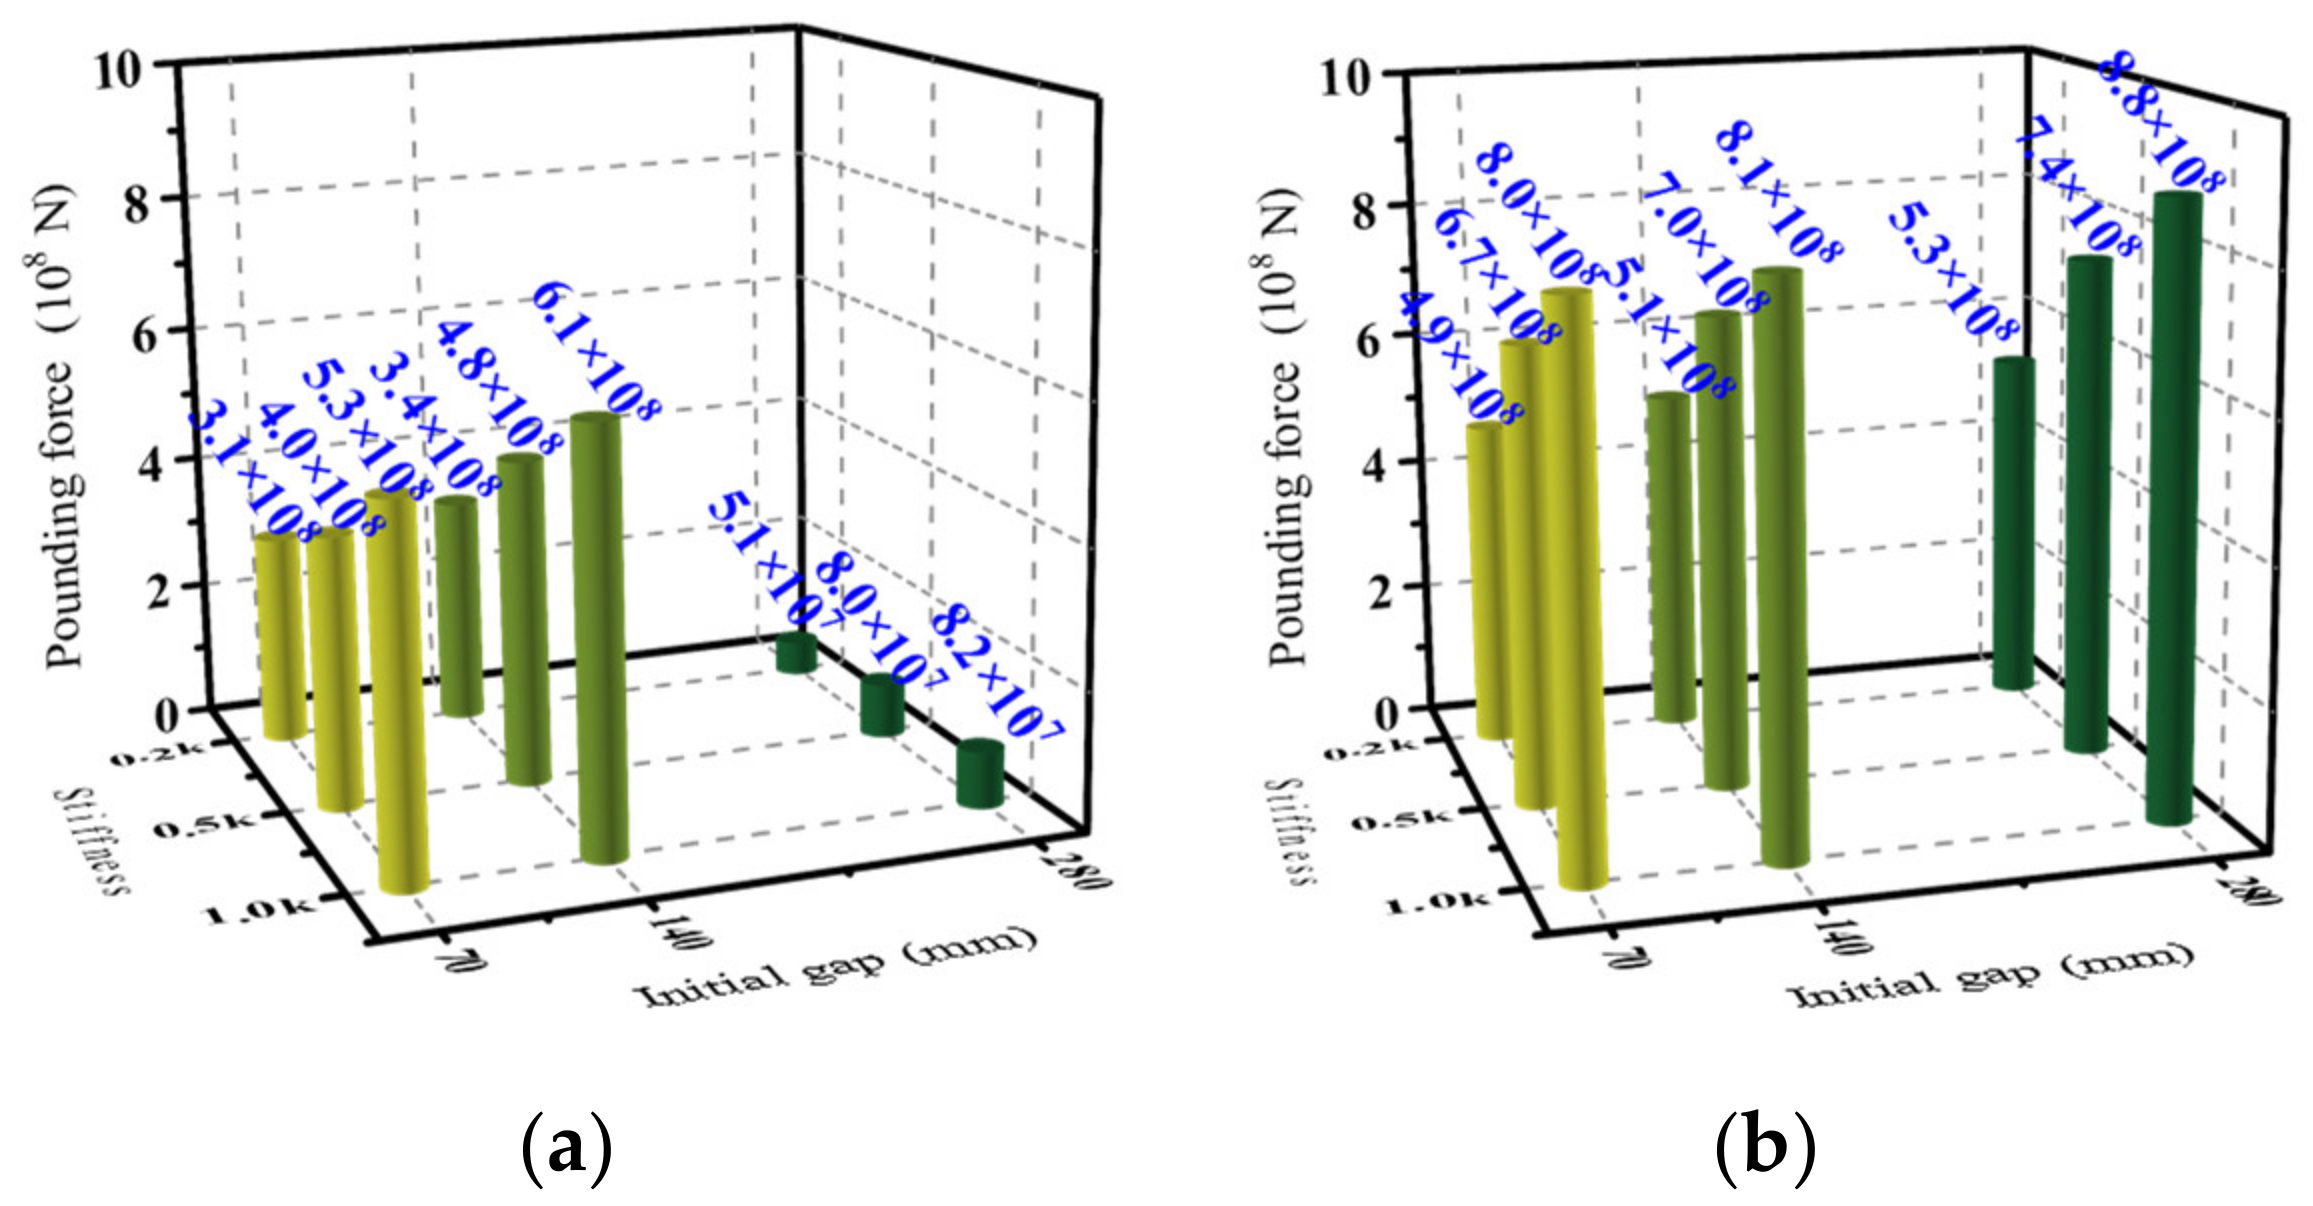
- Pounding force
- (2)
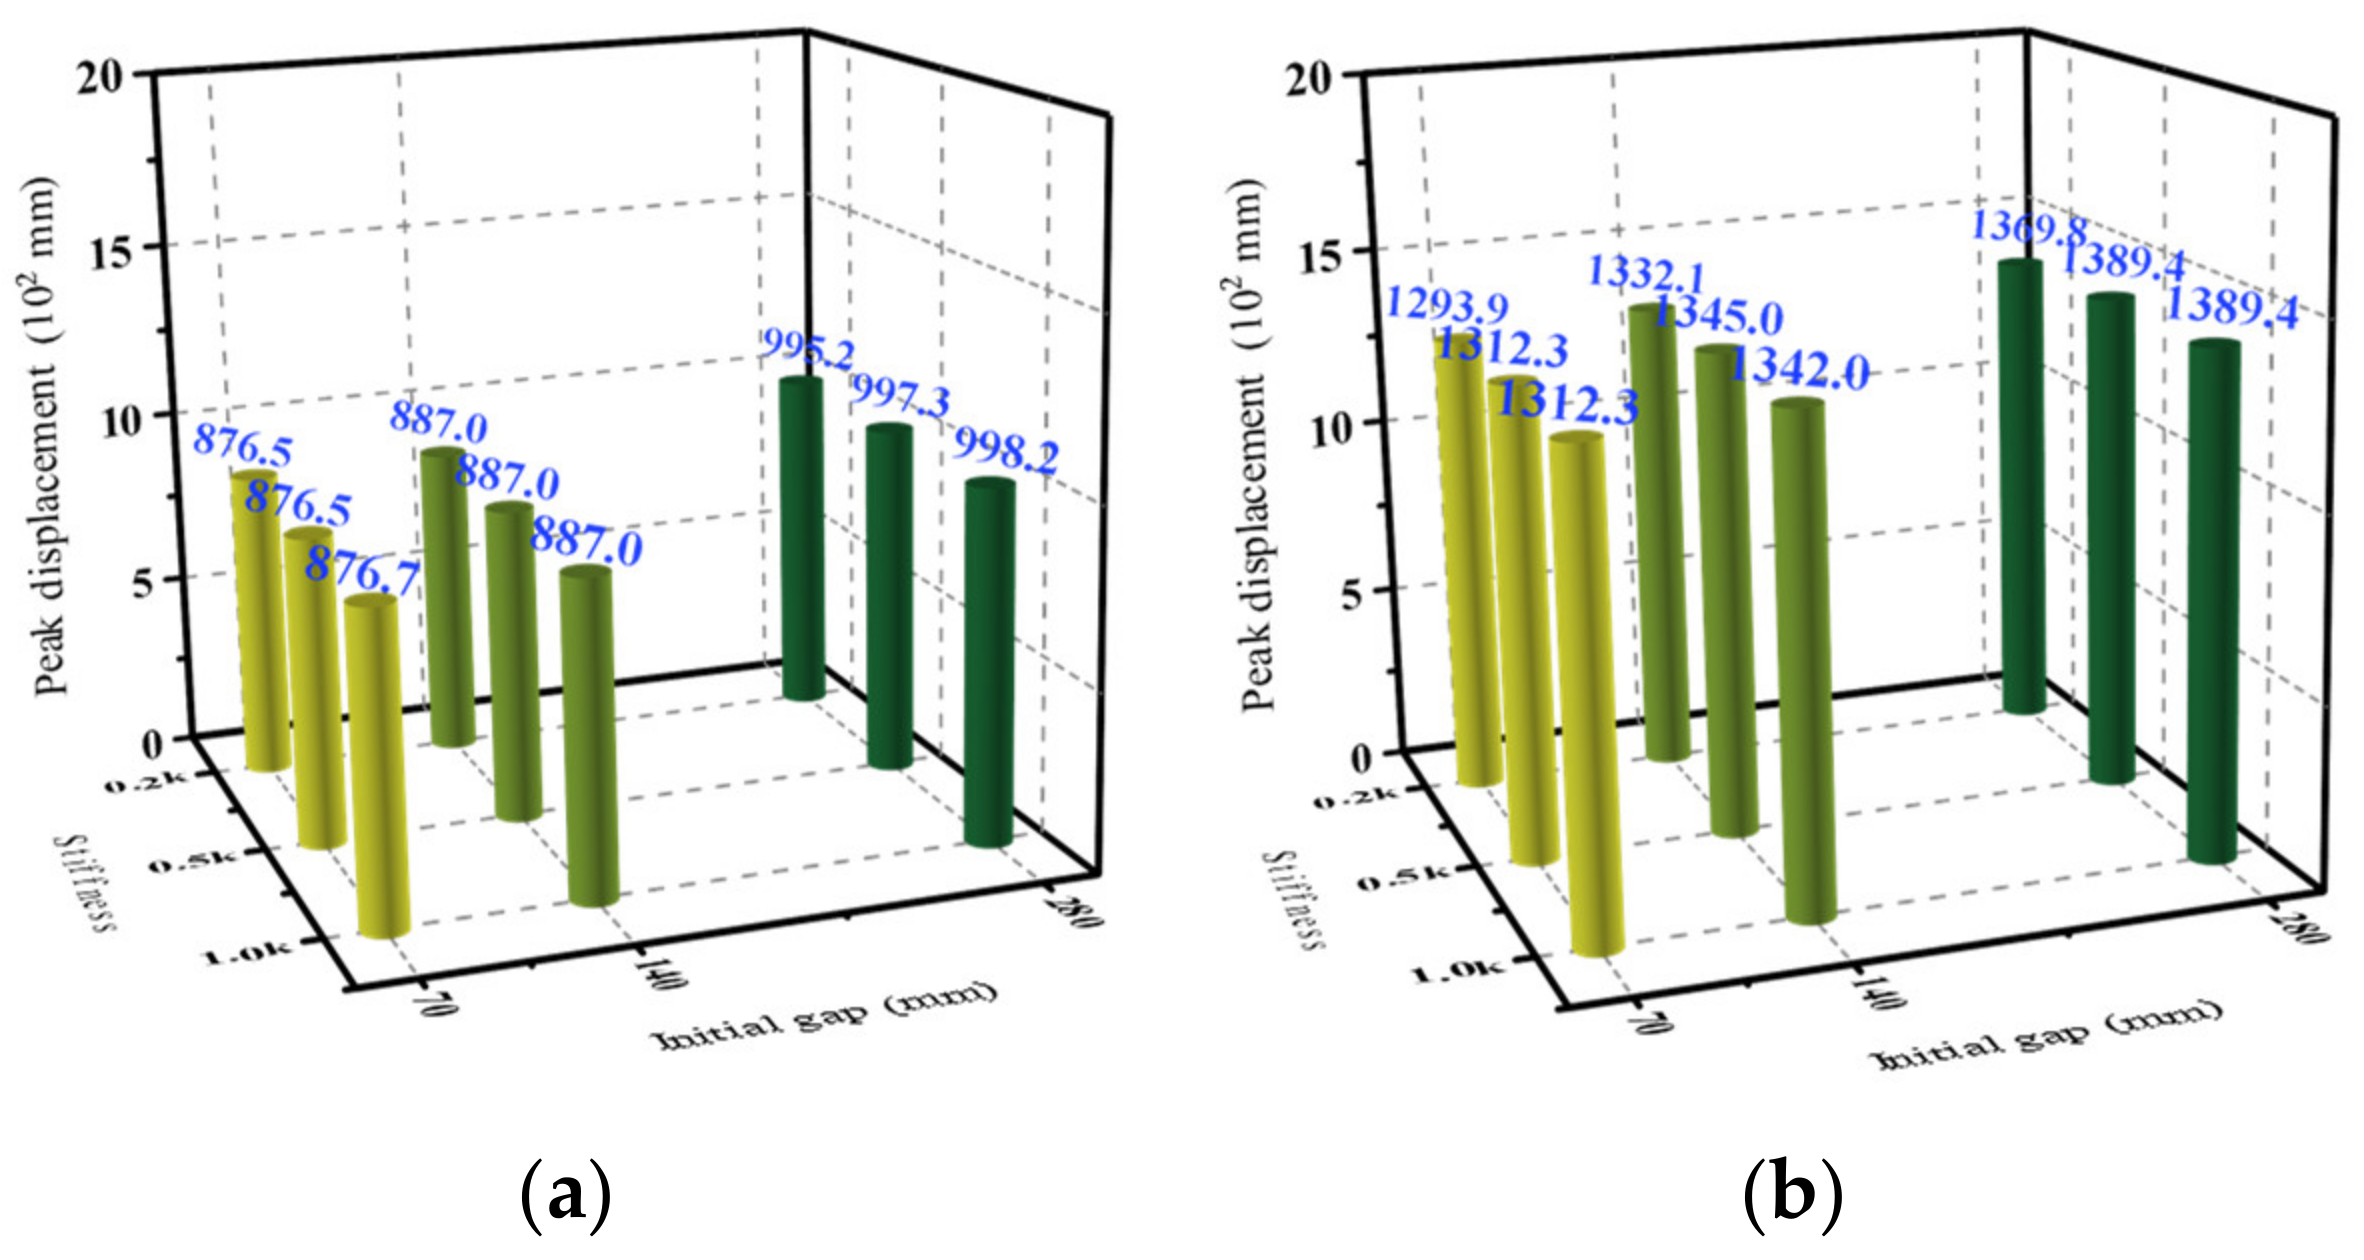
- Displacement
- (3)
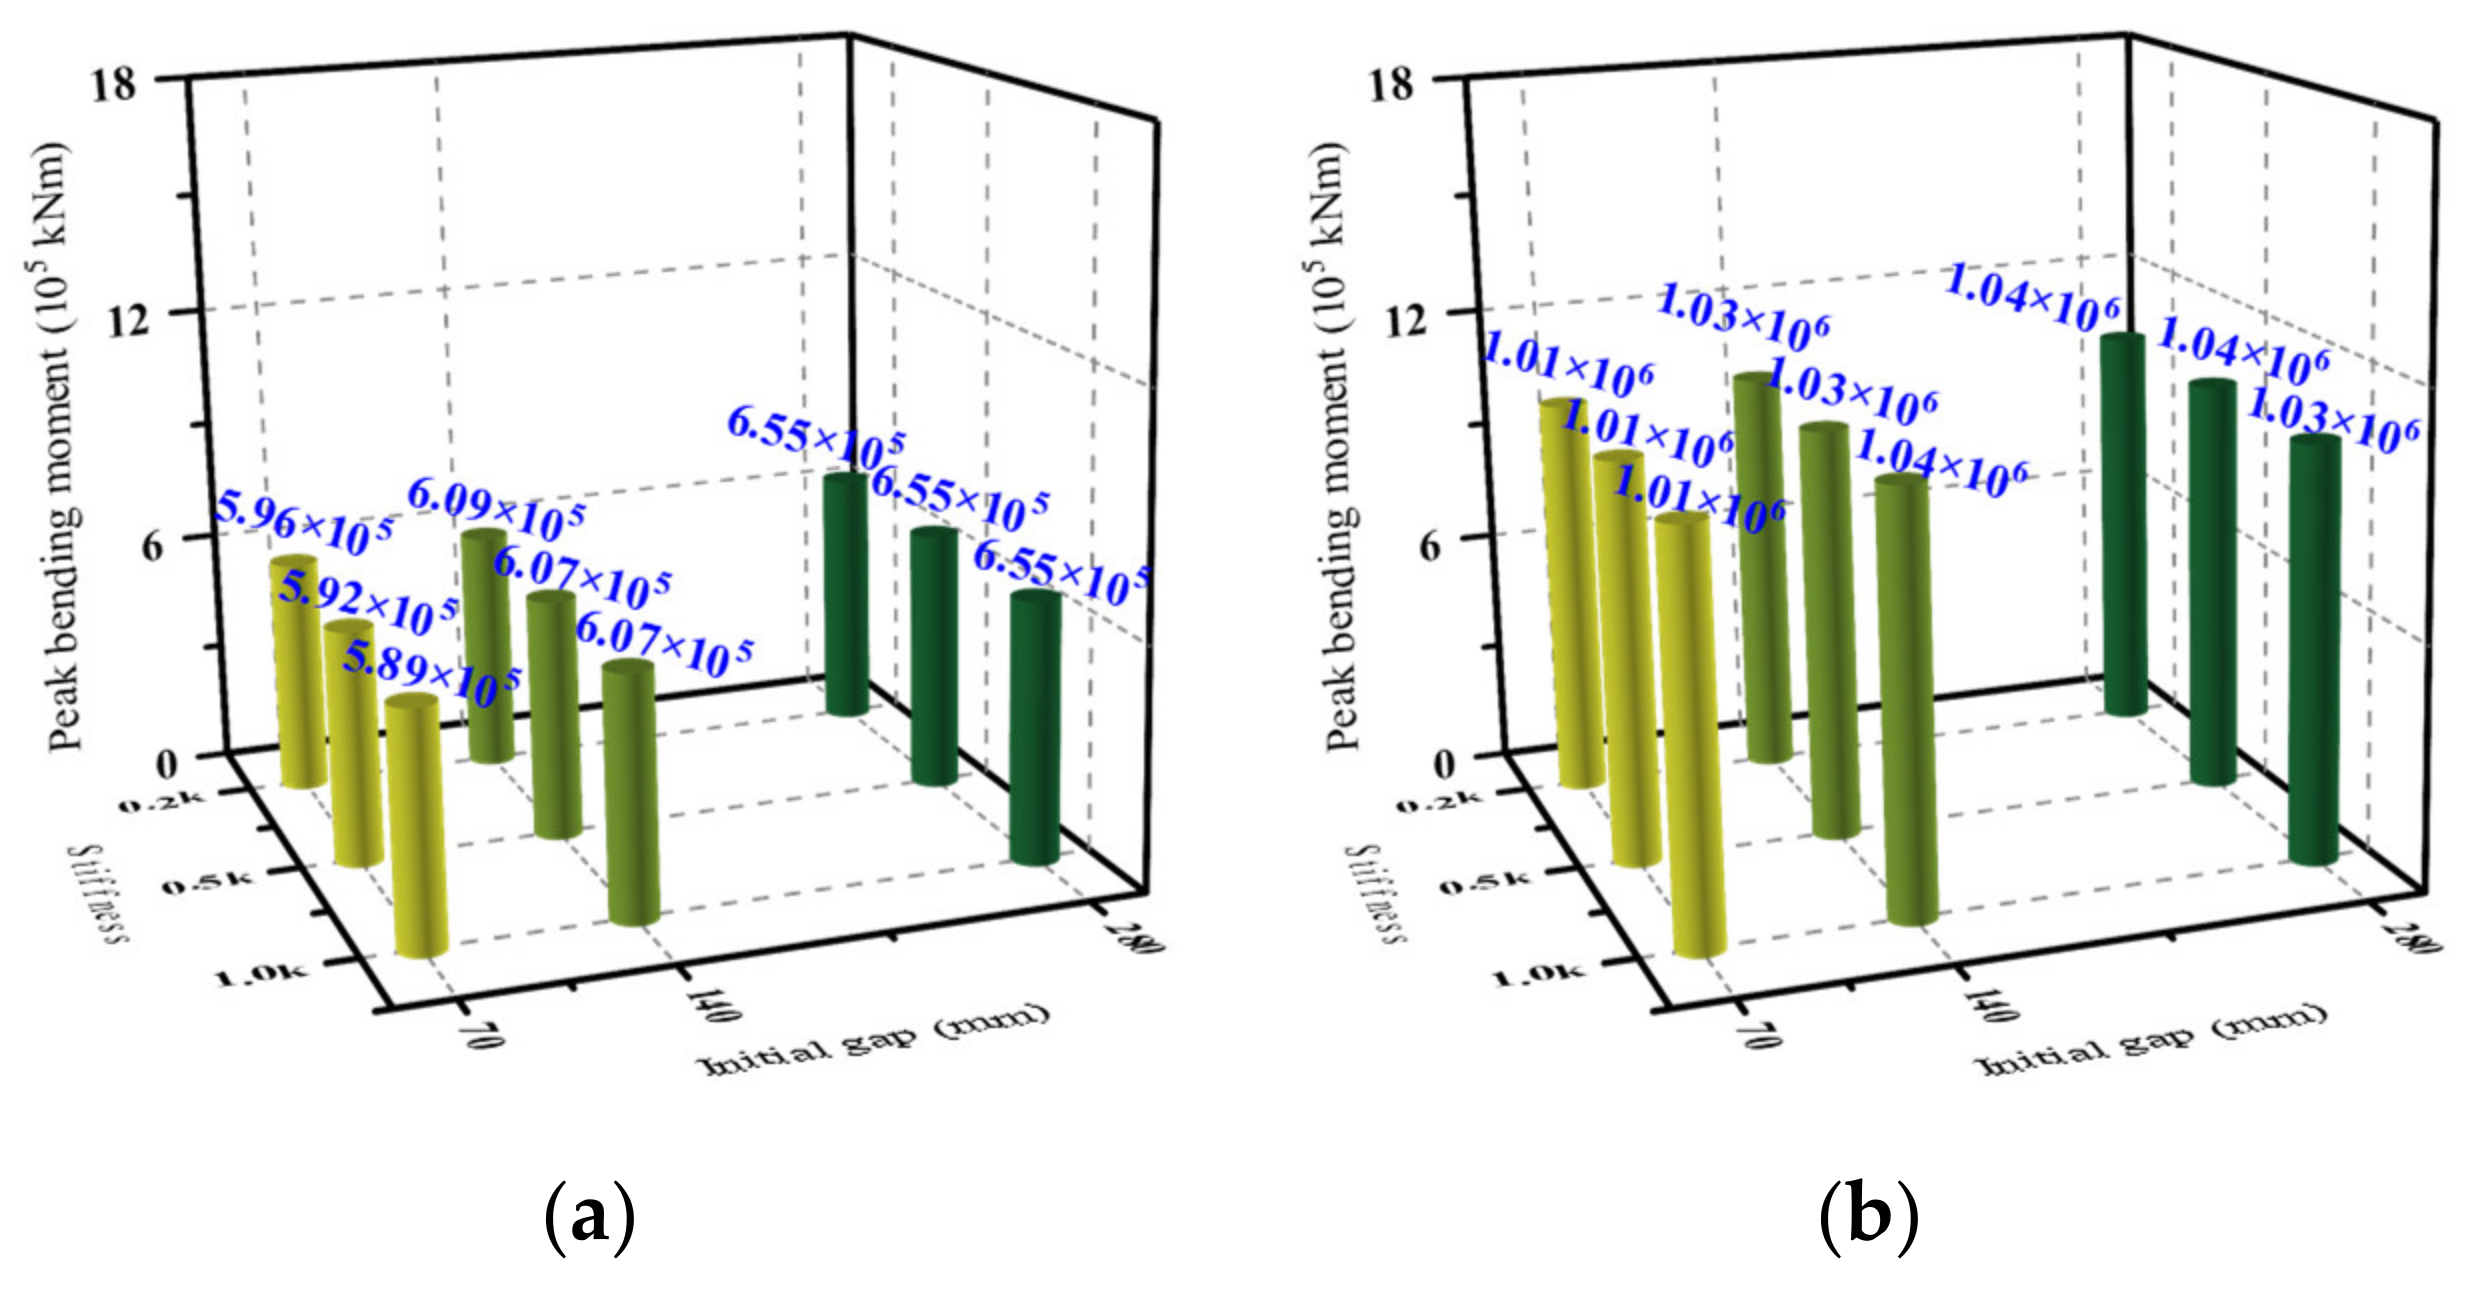
- Bending moment
4.4.2. Span and Pier Height
- (1)
- Pounding force
- (2)
- Displacement
- (3)
- Bending moment
5. Conclusions
- The peak pounding force under different ground motions was satisfied: PfNLP < PfNFPT. However, the pounding number under the NFPT excitation was relatively small. The peak pounding force increased with the increase in the initial gap, pounding stiffness, span, and pier height. In addition, the CRFB-FSP was prone to persistent pounding, which may increase the damage risk of the prefabricated super-high pier.
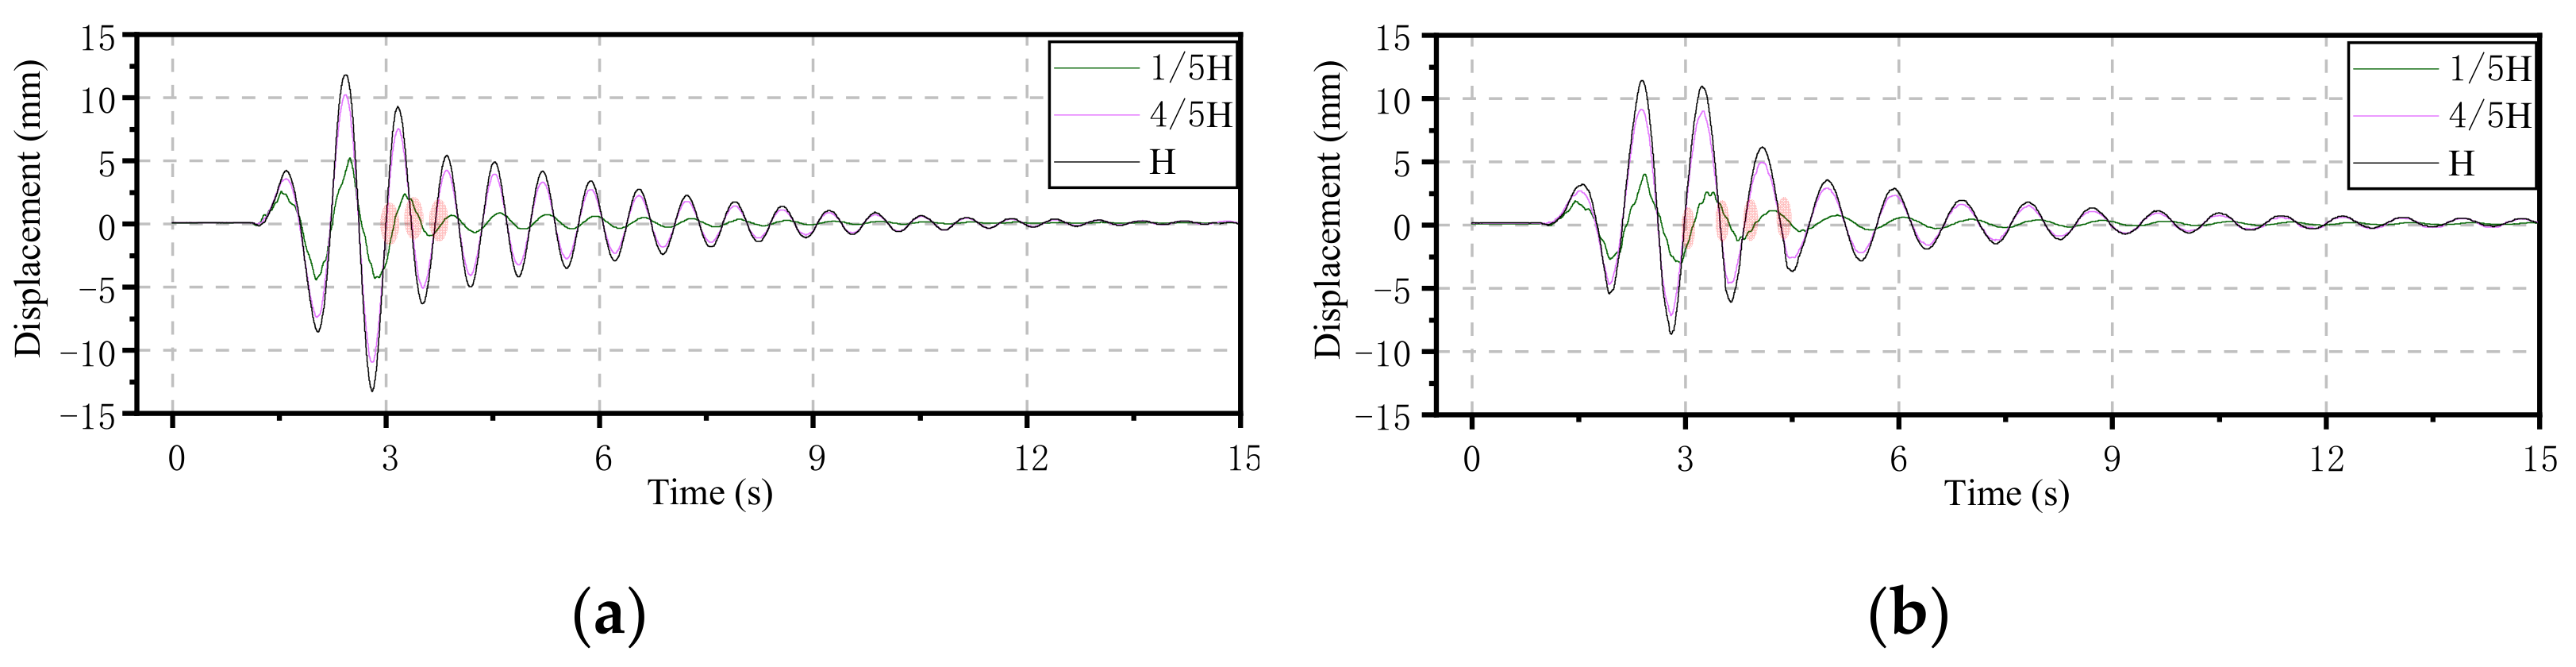
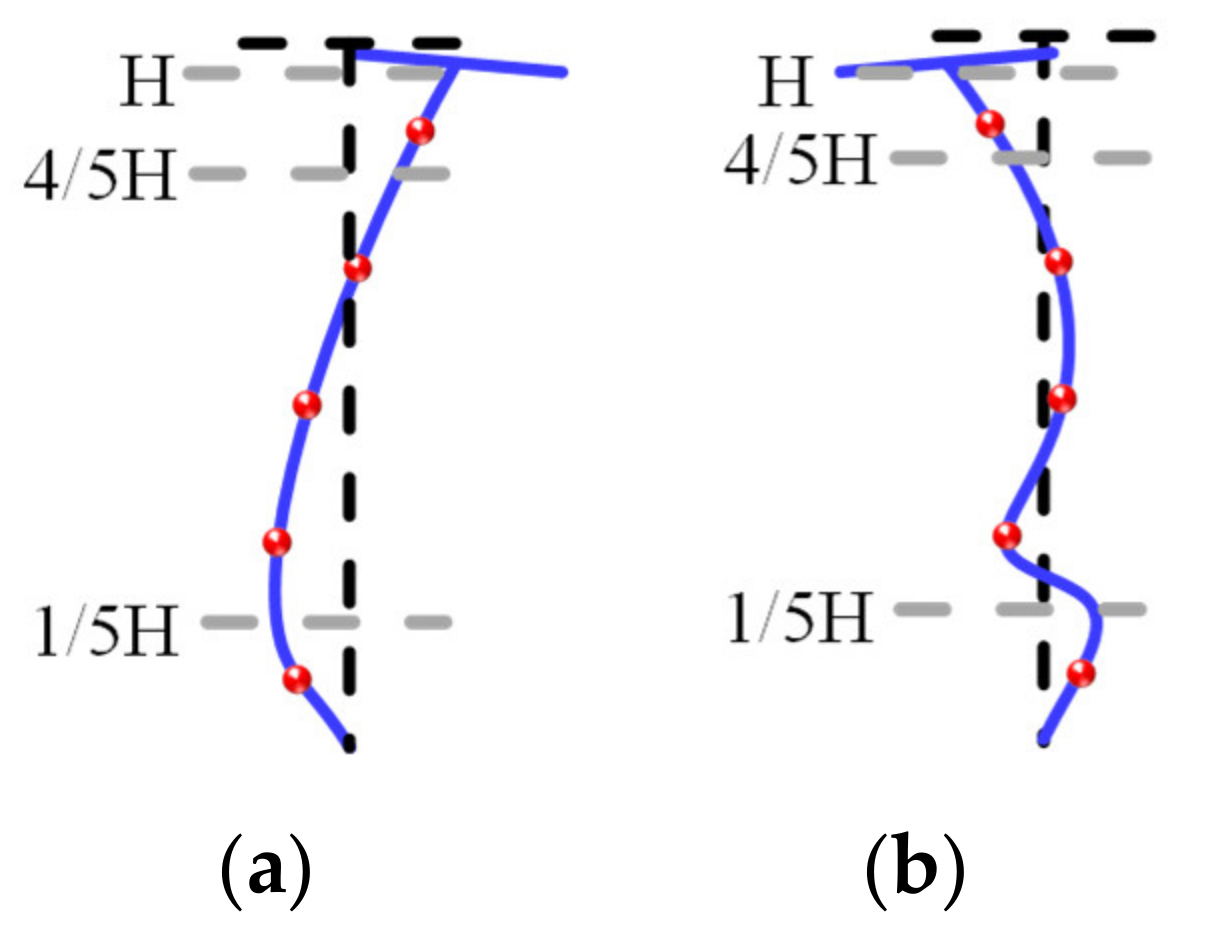
- With and without poundings, the CRFB-FSP reflected higher-order mode participation (HMP) characteristics, and the HMP under the NFPT excitation was larger than that under the NLP excitation. When considering the pounding, under the NFPT excitation, the HMP contribution increased significantly compared with that of the without pounding condition, while this effect under the NLP excitation was smaller. When the high-order mode significantly participates the dynamic response of the pier, the displacements at different pier heights will be on different sides of the center line of the pier.
- The peak displacement of the pier top and peak bending moment of the pier bottom of the CRFB-FSP slightly increased with the increase in the initial gap. However, the pounding stiffness had no obvious effect on them. The peak displacement of the main beam (pier top) of the CRFB-FSP increased with the increase in the main beam span and pier height. The peak bending moment of the pier bottom increased with the increase in the main beam span but decreased with the increase in the pier height. After pounding, the peak displacement of the pier top and the peak bending moment of the pier bottom of the CRFB-FSP were reduced, especially when the span and pier height increased and under the NFPT ground motions. In contrast, the corresponding seismic response of the AB increased under the same conditions.
Author Contributions
Funding
Institutional Review Board Statement
Informed Consent Statement
Data Availability Statement
Conflicts of Interest
Nomenclature
| CRFB-SP | continuous rigid-frame bridge with super-high piers |
| CRFB-FSP | continuous rigid-frame bridge with fabricated super-high piers |
| AB | adjacent continuous beam bridge (approach bridge) |
| MB | main bridge |
| NLP | non-long-period |
| NFPT | near-fault pulse-type |
| FEA | finite element analysis |
| FEM | finite element model |
| PGA | peak ground acceleration |
| HMP | higher-order mode participation |
| GT | grouting sleeve |
| PEER | Pacific Earthquake Engineering Research Center |
| Pf | pounding force |
| Ld | longitudinal displacement |
| Mp | main span |
References
- Huang, J.; Tan, P.; Zhang, Y.; Zhou, F. Endurance time analysis of seismic performances of long-span continuous rigid-frame bridges with corrugated steel webs. Structures 2022, 43, 990–1001. [Google Scholar] [CrossRef]
- Li, X.; Li, L. Research on Green Evaluation of Mountainous Highway Construction. In International Symposium on Advancement of Construction Management and Real Estate; Springer: Singapore, 2020; pp. 727–745. [Google Scholar] [CrossRef]
- Dong, X.M. Instability Analysis of High Pier of Continuous Rigid Frame Bridges. Appl. Mech. Mater. 2012, 178, 1989–1993. [Google Scholar] [CrossRef]
- Tavares, V.; Gregory, J.; Kirchain, R.; Freire, F. What is the potential for prefabricated buildings to decrease costs and contribute to meeting EU environmental targets? Build. Environ. 2021, 206, 108382. [Google Scholar] [CrossRef]
- Miari, M.; Choong, K.K.; Jankowski, R. Seismic Pounding Between Bridge Segments: A State-of-the-Art Review. Arch. Comput. Methods Eng. 2020, 28, 495–504. [Google Scholar] [CrossRef]
- Shrestha, B.; Hao, H.; Bi, K. Devices for protecting bridge superstructure from pounding and unseating damages: An overview. Struct. Infrastruct. Eng. 2017, 13, 313–330. [Google Scholar] [CrossRef]
- Chen, J.; Han, Q.; Liang, X.; Du, X. Effect of pounding on nonlinear seismic response of skewed highway bridges. Soil Dyn. Earthq. Eng. 2017, 103, 151–165. [Google Scholar] [CrossRef]
- Zheng, Y.; Wang, J.; Xu, W.; Li, N.; Zhang, W.; Chen, Y. Impact of Near-Fault Ground Motions on Longitudinal Seismic Response of CHRF Bridges. Sustainability 2022, 14, 3591. [Google Scholar] [CrossRef]
- Zhao, L.; Hao, H.; Bi, K.; Li, X. Numerical study of the seismic responses of precast segmental column bridge under spatially varying ground motions. J. Bridge Eng. 2018, 23, 04018096. [Google Scholar] [CrossRef]
- Zhao, L.; Bi, K.; Hao, H.; Li, X. Numerical studies on the seismic responses of bridge structures with precast segmental columns. Eng. Struct. 2017, 151, 568–583. [Google Scholar] [CrossRef]
- Shen, Y.; Li, J.; Freddi, F.; Igarashi, A.; Zhou, J. Numerical investigation of transverse steel damper TSD seismic system for suspension bridges considering pounding between girder and towers. Soil Dyn. Earthq. Eng. 2022, 155, 107203. [Google Scholar] [CrossRef]
- Guo, W.; Li, J.; Guan, Z.; Chen, X. Pounding performance between a seismic-isolated long-span girder bridge and its approaches. Eng. Struct. 2022, 262, 114397. [Google Scholar] [CrossRef]
- Wang, H.; Zhao, K.; Qin, S. Seismic Performance Assessment of a Pin-bearing Restraint System for Curved Bridge. Period. Polytech. Civ. Eng. 2022, 1–10. [Google Scholar] [CrossRef]
- Jiao, C.; Lu, J.; Wang, C.; Long, P.; Sun, Z. Experimental and numerical investigations on the effects of radius of curvature and longitudinal slope on the responses of curved bridges subject to seismic pounding. Meas. Control 2021, 54, 519–537. [Google Scholar] [CrossRef]
- Khakzand, L.; Jalali, R.S.; Veisi, M. Near-fault ground motion effects on pounding and unseating using an example of a three-span, simply supported bridge. Earthq. Eng. Resil. 2022, 1, 164–195. [Google Scholar] [CrossRef]
- Jia, H.Y.; Lan, X.L.; Zheng, S.X.; Li, L.P.; Liu, C.Q. Assessment on required separation length between adjacent bridge segments to avoid pounding. Soil Dyn. Earthq. Eng. 2019, 120, 398–407. [Google Scholar] [CrossRef]
- Zhou, L.; Wang, X.; Ye, A. Low cycle fatigue performance investigation on Transverse Steel Dampers for bridges under ground motion sequences using shake-table tests. Eng. Struct. 2019, 196, 109328. [Google Scholar] [CrossRef]
- Saiidi, M.S.; Vosooghi, A.; Nelson, R.B. Shake-table studies of a four-span reinforced concrete bridge. J. Struct. Eng. 2013, 139, 1352–1361. [Google Scholar] [CrossRef]
- Kun, C.; Jiang, L.; Chouw, N. Influence of pounding and skew angle on seismic response of bridges. Eng. Struct. 2017, 148, 890–906. [Google Scholar] [CrossRef]
- Li, B.; Chouw, N. Experimental investigation of inelastic bridge response under spatially varying excitations with pounding. Eng. Struct. 2014, 79, 106–116. [Google Scholar] [CrossRef]
- Li, N.; Xu, W.; Chen, Y.; Yan, W. Experimental research on adjacent pounding effect of midspan curved bridge with longitudinal slope. Eng. Struct. 2019, 196, 109320. [Google Scholar] [CrossRef]
- Yang, Z.; Meng, D.; Chouw, N. Effect of pier height and support flexibility on seismic response of bridges including poundings. Adv. Struct. Eng. 2022, 25, 1449–1468. [Google Scholar] [CrossRef]
- Ding, M.; Xu, W.; Wang, J.; Chen, Y.; Du, X.; Fang, R. Seismic performance of prefabricated concrete columns with grouted sleeve connections, and a deformation-capacity estimation method. J. Build. Eng. 2022, 55, 104722. [Google Scholar] [CrossRef]
- Liu, Y.; Zhou, B.; Cai, J.; Lee, D.S.; Deng, X.; Feng, J. Experimental study on seismic behavior of precast concrete column with grouted sleeve connections considering ratios of longitudinal reinforcement and stirrups. Bull. Earthq. Eng. 2018, 16, 6077–6104. [Google Scholar] [CrossRef]
- Xin, G.; Xu, W.; Wang, J.; Yan, X.; Chen, Y.; Yan, W.; Li, J. Seismic performance of fabricated concrete piers with grouted sleeve joints and bearing-capacity estimation method. Structures 2021, 33, 169–186. [Google Scholar] [CrossRef]
- Ding, Y.; Xu, W.; Chen, Y.; Wang, J.; Yan, W. Experimental research on seismic performance of precast cogging high-strength bolt composite joint and influence of its arrangement location. Eng. Struct. 2020, 225, 111294. [Google Scholar] [CrossRef]
- Liu, H.; Chen, J.; Xu, C.; Du, X. Seismic performance of precast column connected with grouted sleeve connectors. J. Build. Eng. 2020, 31, 101410. [Google Scholar] [CrossRef]
- Lu, Z.; Huang, J.; Dai, S.; Liu, J.; Zhang, M. Experimental study on a precast beam-column joint with double grouted splice sleeves. Eng. Struct. 2019, 199, 109589. [Google Scholar] [CrossRef]
- Xu, T.; Li, Q.; Zhao, R.; Ding, J.; Zhan, Y. On the early-age bond-slip behavior of an eccentric bar embedded in a grouted sleeve. Eng. Struct. 2019, 190, 160–170. [Google Scholar] [CrossRef]
- Wang, S.; Xu, W.; Wang, J.; Xin, G.; Chen, Y.; Zhao, Z.; Bai, Y. Experimental research on anti-seismic reinforcement of fabricated concrete pier connected by grouting sleeve based on CFRP and PET materials. Eng. Struct. 2021, 245, 112838. [Google Scholar] [CrossRef]
- Chen, X.; Guan, Z.; Li, J.; Spencer, B.F., Jr. Shake table tests of tall-pier bridges to evaluate seismic performance. J. Bridge Eng. 2018, 23, 04018058. [Google Scholar] [CrossRef]
- GB 50010-2010; Code for Design of Concrete Structures. Architecture & Building Press: Beijing, China, 2015.
- Shen, B.; Xu, W.; Wang, J.; Chen, Y.; Yan, W.; Huang, J.; Tang, Z. Seismic control of super high-rise structures with double-layer tuned particle damper. Earthq. Eng. Struct. Dyn. 2021, 50, 791–810. [Google Scholar] [CrossRef]
- Zhang, C.; Lu, J.B.; Jia, H.Y.; Lai, Z.C.; Li, X.; Wang, P.G. Influence of near-fault ground motion characteristics on the seismic response of cable-stayed bridges. Bull. Earthq. Eng. 2020, 18, 6375–6403. [Google Scholar] [CrossRef]
- Xin, L.; Li, X.; Zhang, Z.; Zhao, L. Seismic behavior of long-span concrete-filled steel tubular arch bridge subjected to near-fault fling-step motions. Eng. Struct. 2019, 180, 148–159. [Google Scholar] [CrossRef]
- Zhang, X.; Wang, Q.; Ren, Q.; Liu, W.; Ding, W. Finite element analysis of prefabricated concrete box structure system on OpenSees software. In IOP Conference Series: Earth and Environmental Science; IOP Publishing: Bristol, UK, 2021; Volume 791, p. 012036. [Google Scholar] [CrossRef]
- Yang, Z.; Li, C.; Liu, L.; Yang, H.; Zhong, T. Study on modeling method of reinforced concrete pier based on OpenSees. J. Phys. Conf. Ser. 2021, 18381, 012034. [Google Scholar] [CrossRef]
- Scott, B.D.; Park, R.; Priestley, M. Stress-Strain Behavior of Concrete Confined by Overlapping Hoops at Low and High Strain Rates. ACI J. 1982, 79, 13–27. [Google Scholar] [CrossRef]
- Sarkar, N.; Dasgupta, K. Comparative study of concrete models in OpenSEES for performing nonlinear analysis. In International Conference on Structural Engineering and Construction Management; Springer: Cham, Switzerland, 2021; pp. 1135–1143. [Google Scholar] [CrossRef]
- Lu, J.Y.; Lin, G. OpenSees Documentation FRP Confined Concrete02. In OpenSeesPy Documentation; Oregon State University: Corvallis, OR, USA, 2020; pp. 122–127. Available online: https://www.researchgate.net/publication/340915532_OpenSees_Documentation_FRPConfinedConcrete02 (accessed on 19 July 2022).


| Physical Quantity | Dimension | Similarity Coefficient |
|---|---|---|
| Length | [L] | SL = 1/20 |
| Linear displacement | [L] | Sδ = SL = 1/20 |
| Modulus of elasticity | [ML−1T−2] | SE = 1 |
| Density | [ρ] | Sρ = 1 |
| Equivalent mass density | [ρ0] | Sρ0 = 4 |
| Force | [MLT−2] | SF = 1/400 |
| Time | [T] | ST = 0.1 |
| Frequency | [T−1] | Sf = 1/St = 10 |
| Acceleration | [LT−2] | Sa = 5 |
| Quality | [M] | Sm = SF/Sa = 0.0005 |
| Bridge Model | Component | Concrete | Longitudinal Reinforcement | Stirrup | ||
|---|---|---|---|---|---|---|
| Reinforcement | Reinforcement Ratio (%) | Standard Stirrup (Encrypted within 1.0 m from the Bearing Platform) | Stirrup Ratio (%) | |||
| Main bridge (MB) | Main beam | C55 | 6 | 3.1 | Φ6@135 | 1.2 |
| Pier body | C40 | 14 | 2.1 | Φ6@80 (Φ6@70) | 1.9 (2.1) | |
| Adjacent bridge (AB) | Main beam | C55 | 6 | 3.1 | Φ6@135 | 1.2 |
| Pier body | C40 | 14 | 2.9 | Φ6@80 (Φ6@70) | 2.3 (2.5) | |
| Material Category | Grade | d (mm) | fc, fy (MPa) | ft, fu (MPa) | E (MPa) |
|---|---|---|---|---|---|
| Concrete | C40 | / | 46.7 | 2.6 | 34,300 |
| C55 | / | 55.1 | 3.8 | 34,400 | |
| Reinforcement | HRB400 | 6 (14) | 455.1 (459.5) | 589.3 (597.1) | 208,000 |
| HPB300 | 6 | 418.3 | 580.2 | 206,000 | |
| Grouting sleeve | GT14 | 40 | / | 557.2 | / |
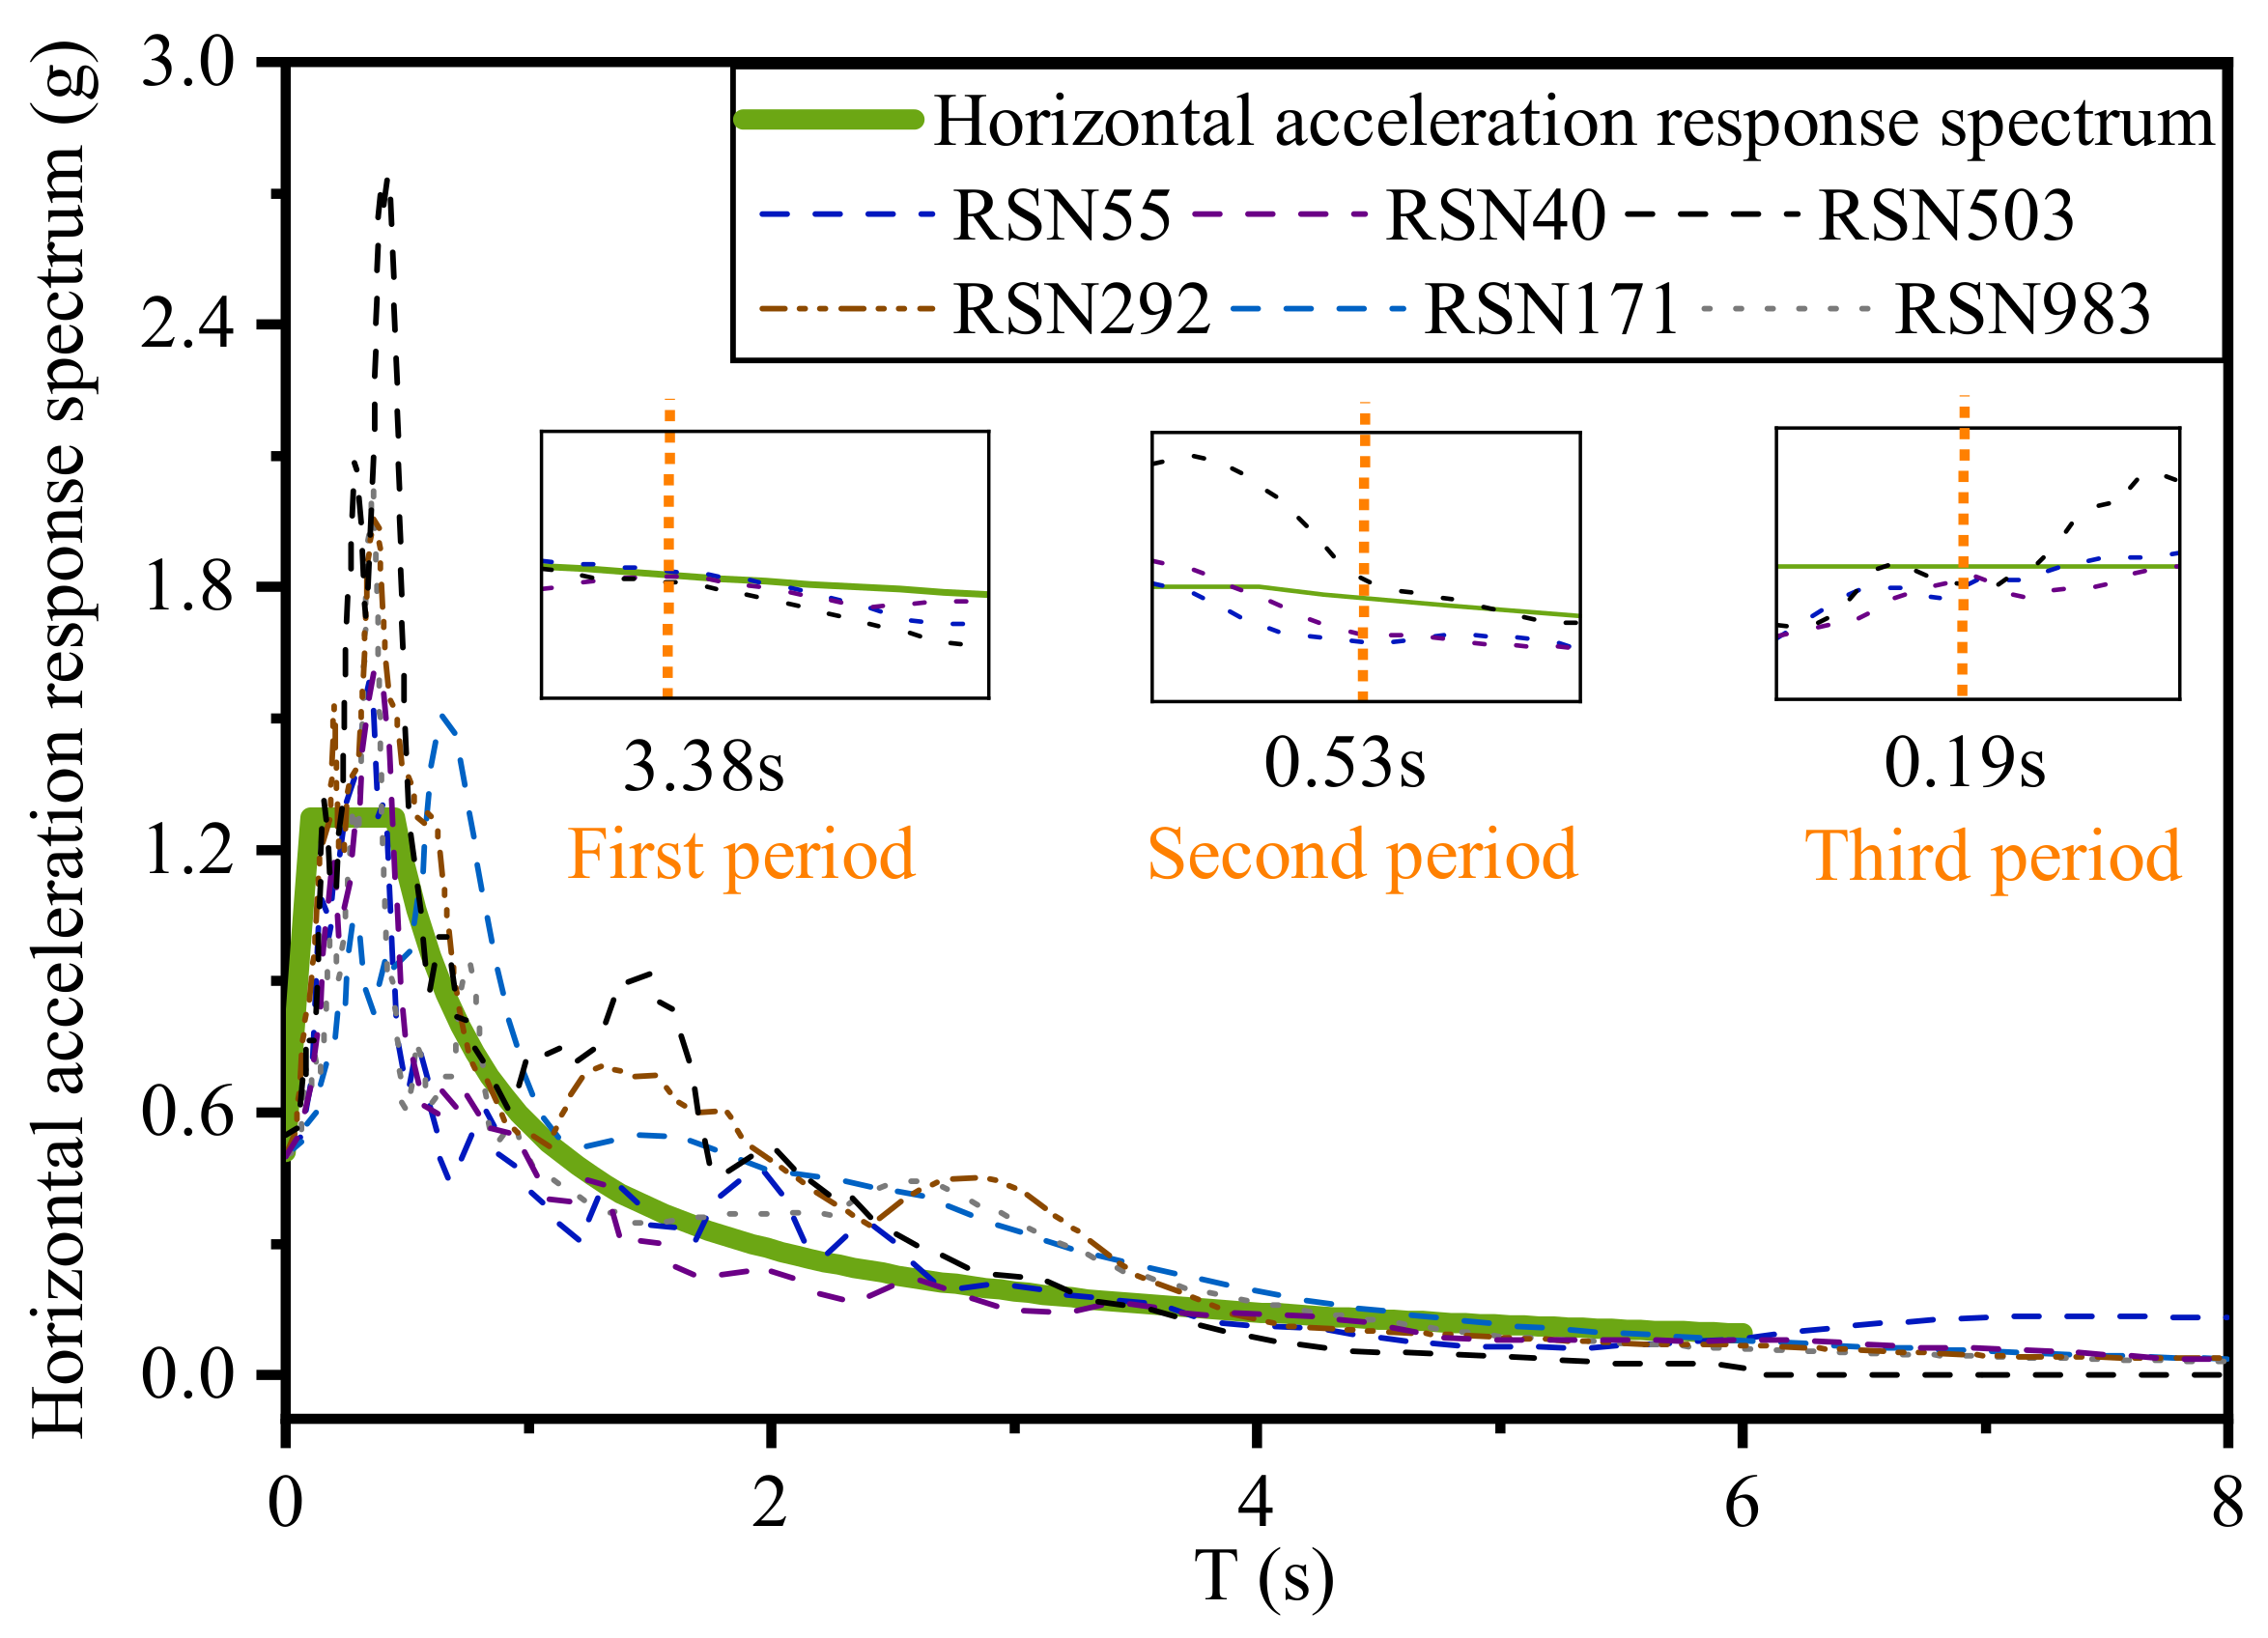
| Site Category | Ground Motion Type | Ground Motion | Fault Distance (km) | Tp (s) | PGA (g) |
|---|---|---|---|---|---|
| B | NLP | RSN503 | 56.7 | - | 0.037 |
| RSN40 | 129.1 | - | 0.041 | ||
| RSN55 | 111.3 | - | 0.012 | ||
| NFPT | RSN171 | 0.07 | 3.42 | 0.317 | |
| RSN292 | 6.7 | 3.27 | 0.227 | ||
| RSN983 | 0.1 | 3.53 | 0.571 |
| Ground Motion Type | Ground Motion | PGA (g) |
|---|---|---|
| White noise | White noise | 0.05 |
| NLP | RSN503, RSN40, RSN55 | 0.5, 1.0, 1.5 |
| NFPT | RSN292, RSN983, RSN171 | |
| White noise | White noise | 0.05 |
| Ground Motion | PGA/g | Characteristic Time Segments | |
|---|---|---|---|
| CRFB-FSP | |||
| Without Pounding | With Pounding | ||
| Cumulative Duration/s | Cumulative Duration/s | ||
| NLP (RSN55) | 1.5 | 0.38 | 0.51 |
| NFPT (RSN171) | 0.66 | 1.04 | |
| Concrete of C40 | fpc/MPa | epsc0 | fpcu/MPa | epscu | ft/MPa | Ets/MPa | |
|---|---|---|---|---|---|---|---|
| Concrete01 | cover concrete | −21.2 | −0.0020 | −4.2 | −0.0035 | - | - |
| confined concrete | −26.2 | −0.0025 | −5.2 | −0.0190 | - | - | |
| Concrete02 | cover concrete | −21.2 | −0.0020 | −4.2 | −0.0035 | 2.4 | 1625 |
| confined concrete | −26.2 | −0.0025 | −5.2 | −0.0190 | 2.6 | 1625 | |
| PGA/g | Parameter Type | Condition | Pier Height/m | Mp-/m | Initial Gap/mm | Pounding Stiffness |
|---|---|---|---|---|---|---|
| 0.5 | Pounding parameters | 1 | 100 | 166 | 70 | 0.2 k |
| 2 | 140 | 0.5 k | ||||
| 3 | 280 | 1.0 k | ||||
| Structural parameters | 4 | 100 | 70 | 140 | 0.5 k | |
| 5 | 120 | |||||
| 6 | 166 | |||||
| 7 | 130 | 70 | ||||
| 8 | 120 | |||||
| 9 | 166 | |||||
| 10 | 160 | 70 | ||||
| 11 | 120 | |||||
| 12 | 166 |
| Bridge | Mode Order | Test Bridge Model (1/20) (Hz) | FEA (Hz) | |
|---|---|---|---|---|
| Bridge Model (1/20) | Prototype Bridge (1/1) | |||
| CRFB-FSP MB (RC AB) | 1 | 2.83 (4.05) | 2.91 (4.25) | 0.295 (0.423) |
| 2 | 18.68 (30.13) | 19.05 (31.55) | 1.901 (3.152) | |
| 3 | 51.03 (57.80) | 51.59 (59.93) | 5.202 (5.997) | |
| Ground Motion | PGA/g | Test Bridge Model (1/20)/mm | FEA/mm | |
|---|---|---|---|---|
| Bridge Model (1/20) | Prototype Bridge (1/1) | |||
| NLP | 0.5 | 5.3 | 5.5 | 114.0 |
| 1.0 | 7.8 | 7.9 | 162.1 | |
| 1.5 | 13.5 | 13.2 | 278.1 | |
| NFPT | 0.5 | 13.4 | 12.7 | 262.1 |
| 1.0 | 21.8 | 20.5 | 422.2 | |
| 1.5 | 38.8 | 37.6 | 790.4 | |
| Ground Motion | PGA/g | Test Bridge Model (1/20)/kN | FEA/kN | |
|---|---|---|---|---|
| Bridge Model (1/20) | Prototype Bridge (1/1) | |||
| NLP | 0.5 | 1.5 | 1.6 | 639.5 |
| 1.0 | 2.7 | 2.5 | 1009.4 | |
| 1.5 | 5.7 | 6.0 | 2419.1 | |
| NFPT | 0.5 | 2.9 | 2.7 | 1050.3 |
| 1.0 | 4.8 | 5.1 | 2060.8 | |
| 1.5 | 11.2 | 12.3 | 4901.5 | |
Publisher’s Note: MDPI stays neutral with regard to jurisdictional claims in published maps and institutional affiliations. |
© 2022 by the authors. Licensee MDPI, Basel, Switzerland. This article is an open access article distributed under the terms and conditions of the Creative Commons Attribution (CC BY) license (https://creativecommons.org/licenses/by/4.0/).
Share and Cite
Wang, S.; Xu, W.; Huang, X.; Yan, X.; Ma, J.; Sun, H.; Wang, J.; Chen, Y. Research on the Pounding Response and Pounding Effect of a Continuous Rigid-Frame Bridge with Fabricated Super-High Piers Connected by Grouting Sleeves. Sustainability 2022, 14, 11334. https://doi.org/10.3390/su141811334
Wang S, Xu W, Huang X, Yan X, Ma J, Sun H, Wang J, Chen Y. Research on the Pounding Response and Pounding Effect of a Continuous Rigid-Frame Bridge with Fabricated Super-High Piers Connected by Grouting Sleeves. Sustainability. 2022; 14(18):11334. https://doi.org/10.3390/su141811334
Chicago/Turabian StyleWang, Shaojian, Weibing Xu, Xiaomin Huang, Xiaoyu Yan, Jun Ma, Hang Sun, Jin Wang, and Yanjiang Chen. 2022. "Research on the Pounding Response and Pounding Effect of a Continuous Rigid-Frame Bridge with Fabricated Super-High Piers Connected by Grouting Sleeves" Sustainability 14, no. 18: 11334. https://doi.org/10.3390/su141811334
APA StyleWang, S., Xu, W., Huang, X., Yan, X., Ma, J., Sun, H., Wang, J., & Chen, Y. (2022). Research on the Pounding Response and Pounding Effect of a Continuous Rigid-Frame Bridge with Fabricated Super-High Piers Connected by Grouting Sleeves. Sustainability, 14(18), 11334. https://doi.org/10.3390/su141811334