Article

Risk of Poverty Returning to the Tibetan Area of Gansu Province in China

College of Tourism, Northwest Normal University, Lanzhou 730070, China
*
Author to whom correspondence should be addressed.
Sustainability 2022, 14(18), 11268; https://doi.org/10.3390/su141811268
Submission received: 10 August 2022 / Revised: 31 August 2022 / Accepted: 4 September 2022 / Published: 8 September 2022

Abstract

:
Based on the comprehensive analysis framework of the risk of returning to poverty, this study constructed an evaluation index system for the risk of returning to poverty to tourism villages in Tibetan areas of Gansu Province. Principal component analysis and K-means clustering algorithm were adopted to analyze the risk of returning to poverty for characteristic tourism villages in Tiantang Village, Gaxiu Village, and Cirina Village. The results show that tourism villages in Tibetan areas of Gansu are at a moderate risk of returning to poverty, but a few poverty-stricken households still face a high risk of returning to poverty; in addition, financial capital and human capital are the main components of the risk of poverty alleviation. Income level is the most important factor influencing the risk of returning to poverty. Fixed assets, skill training, distance of scenic spots, income source and housing structure also have an important impact on the risk of returning to poverty. Finally, an early warning mechanism consisting of risk assessment, determination of warning signs, identification of warning degree, warning source search, and risk prevention is necessary. To prevent the risk of tourism villages in Gansu Tibetan areas returning to poverty, it is necessary to protect livelihoods, resist the impact of risk, and improve the developmental environment.

1. Introduction and Literature Review

The international community attaches great importance to social problems, such as poverty. Poverty is also an intractable problem. In 2000, the United Nations placed poverty eradication at the top of its eight Millennium Development Goals and vowed to eliminate extreme poverty by 2015. China has made a huge contribution to the cause of poverty reduction around the world. China has adopted a path of poverty alleviation from relief to development, and from regional to targeted poverty reduction. Remarkable results in China have been achieved, with the number of people living in poverty dropping from 770 million at the end of 1978 to 5.51 million at the end of 2019; the incidence of poverty decreased from 97.5% to 0.6% [1,2]. At the end of the 13th Five-Year Plan (2016–2020), China’s fight against poverty came to a perfect end: the elimination of poverty. However, the alleviation of poverty coexists with the return to poverty. During the same period, the return to poverty rate in rural China was around 20%, and exceeded 30% in some areas. Approximately two million rural residents are at risk of returning to poverty.
On 20 March 2020, the Poverty Alleviation Office of the State Council issued the Guiding Opinions on the Establishment of a Monitoring and Helping Mechanism to Prevent the Return to Poverty. It stressed that the prevention of returning to poverty must be given greater priority. On 25 February 2021, at the National Poverty Alleviation Summary and Commendation Conference, General Secretary Xi Jinping recommended that the government strengthen its monitoring of people most likely to return to poverty. In addition, early detection, intervention, and assistance should be offered, and the bottom line of preventing a large-scale return to poverty should be maintained. At the same time, the 14th Five-Year Plan advised linking poverty alleviation to rural vitalization; this would solve the problem of poverty and create beautiful villages. Therefore, reducing the likelihood of returning to poverty is essential for poverty alleviation and rural revitalization.
In the past five years, experts and scholars in China and abroad have paid increasing attention to the problem of returning to poverty. Some scholars study the causes and treatment of returning to poverty. The causes are presented from the disciplinary perspectives of economics, management, sociology, political science, tourism, ethics, and education. The causes of returning to poverty are not only natural environmental [3], social, and economic [4,5,6], but also institutional and policy factors [7,8] and residents’ own factors [9,10,11,12]. The prevention of returning to poverty is through institutional building and policy innovation at the macro level [13,14,15,16], intervention of external resources and capital support at the medium level [17,18,19], and routine assistance at the micro level [20,21,22]. Other scholars focus on the risk assessment of returning to poverty, including the construction of index systems and the application of evaluation methods. The evaluation index system of risk of returning to poverty is constructed from theoretical perspectives such as sustainable livelihood capital [23,24], poverty vulnerability [25], multidimensional returning to poverty [26], whole-region tourism [27], policy and institution perspective [28,29], and comprehensive perspective [30,31]. In addition to qualitative research methods, methods of economics, statistics, mathematics, and other disciplines have been introduced to assess the risk of returning to poverty. Examples include logistic regression [32,33], Bayesian regularization algorithm [34], grey correlation analysis [24], A-F double-boundary method [35], statistical inference of sampling survey [36], comprehensive index method [37], and fuzzy comprehensive evaluation [38].
Many academic studies have identified and evaluated the factors in returning to poverty: the establishment of an early warning mechanism and the implementation of government policies. However, in China, there are more qualitative than empirical analyses. The scope of research is limited to countries or regions at the macro level; less attention has been paid to villages or residents. The Tibetan areas of Gansu Province are the main site of poverty alleviation in China. Villages that use tourism as a means of poverty alleviation are more sensitive to fluctuations in tourism. Therefore, it is necessary to carry out research on the risk assessment and early warning mechanism of returning to poverty in characteristic tourist villages in Tibetan areas of Gansu. At the same time, it is also important to determine the risk of returning to poverty and identify risk factors. In addition, the government should strengthen monitoring of the population that meets the conditions, provide timely assistance, prevent the return to poverty, and consolidate the results.

2. Research Design and Research Methods

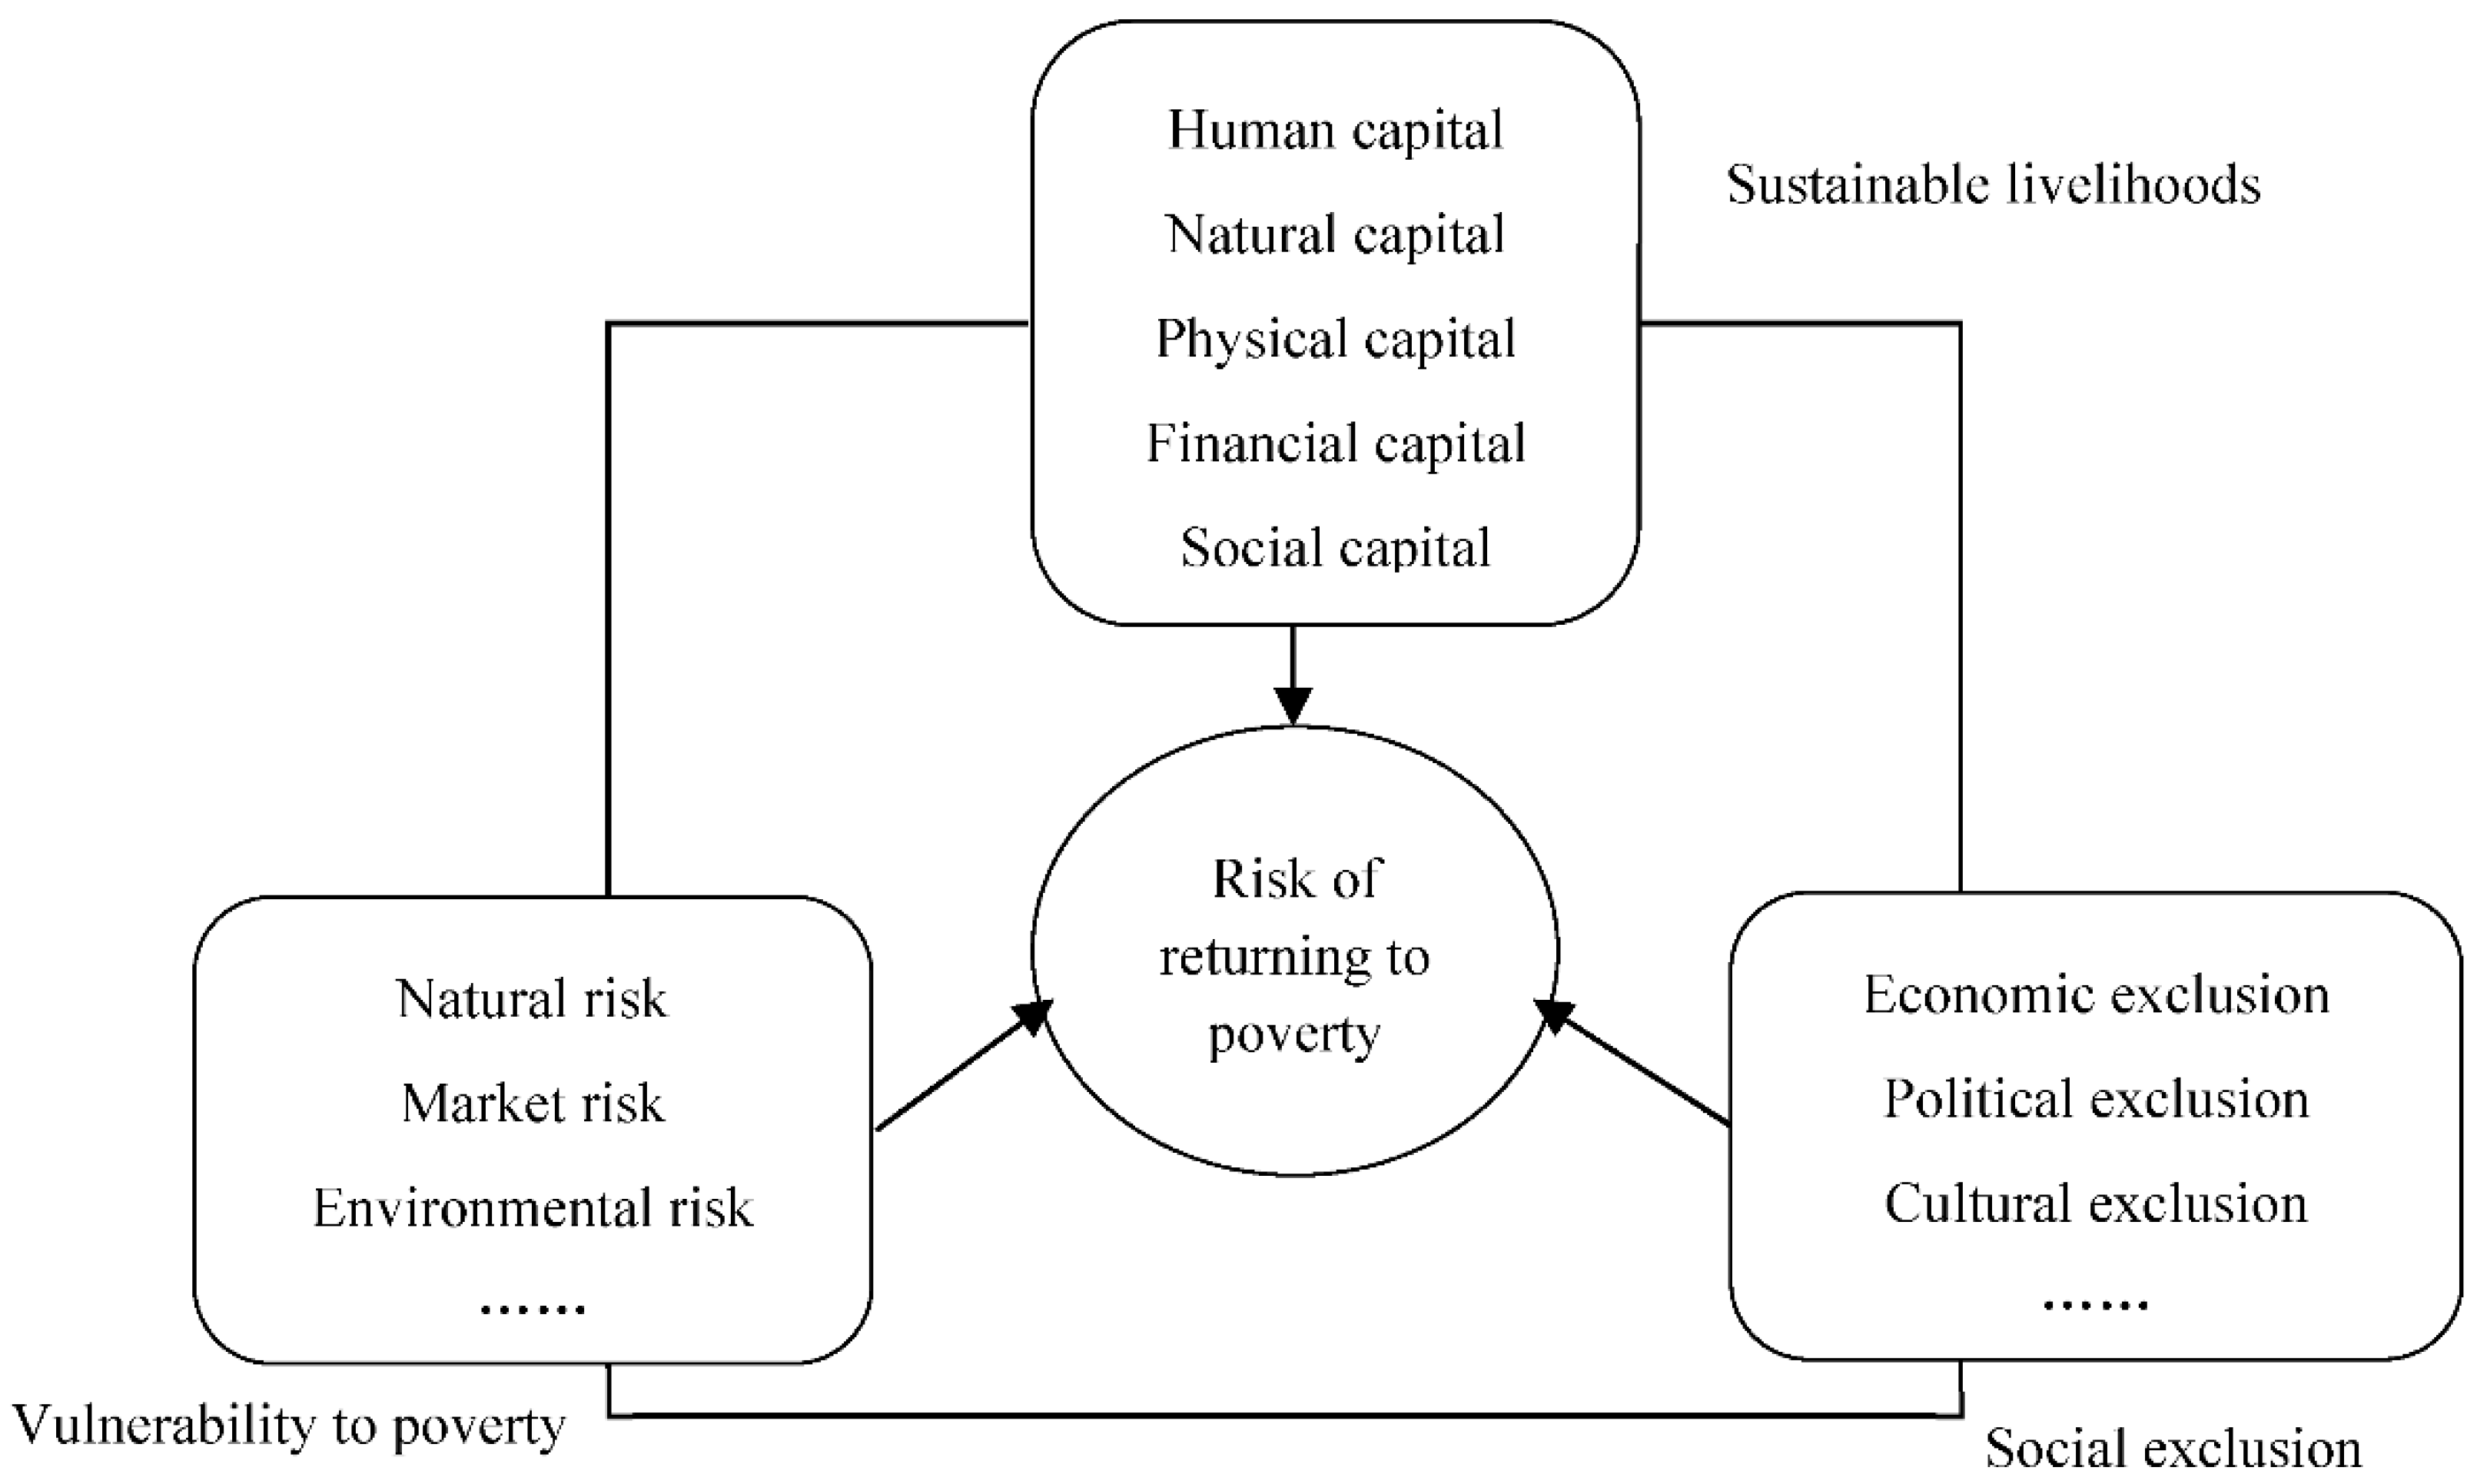
2.1. Establishment of a Risk Assessment Index System

2.1.1. Construction Basis

The index system of the study is based on three analytical frameworks used in micro poverty research: sustainable livelihoods, vulnerability to poverty and social exclusion. The framework of sustainable-livelihood analysis focuses on the livelihood capital of peasant households, from human, natural, physical, financial and social capital. The lack of livelihood capital will limit the livelihood strategies of farmers and increase their probability of returning to poverty. Vulnerability to poverty is the potential risk impact and the ability to resist risks faced by poor groups, and the vulnerability of different groups. Studies have concluded that livelihood capital, income inequality, natural disasters, market risks and other factors have different effects on farmers’ vulnerability. Therefore, reducing farmers’ vulnerability is conducive to keeping them out of poverty. Social exclusion has been used to study unemployment, poverty and polarization; special attention should be paid to people with disabilities, dependent children, elderly people who are unable to work, and people who are unemployed, unskilled, low-income, sick, or living with breakdown. The comprehensive analysis framework of the risk of returning to poverty is shown in Figure 1.

2.1.2. Evaluation Index System

Based on the comprehensive analysis framework of sustainable livelihood–poverty vulnerability–social exclusion, combined with the natural environment, social and economic conditions and actual research situation of the study area, the evaluation index system of the risk of returning to poverty of tourism villages in Gansu Tibetan region was constructed. The evaluation index system (Table 1) includes 7 first- and 23 second-level indicators: human, natural, physical, financial and social capital, risk impact and external exclusion.
(1) Select human capital indicators. The labor force is a very important source of a family’s human capital. When the family labor population is insufficient, the risk of returning to poverty increases. The degree of education is the embodiment of an individual’s cultural level. Farmers with less education lack rich knowledge and a high level of cognition; they cannot timely identify and adjust various risk factors, which may lead to the risk of returning to poverty. This index needs to calculate the average educational level of the family working population on the basis of the assigned value, and then the education level is divided. Villagers can be trained to improve their vocational skills; this will help keep them from falling back into poverty. In addition, people with low awareness of self-development and deep-rooted ideas of “waiting, relying and wanting” are liable to fall into poverty again.
(2) Select natural capital indicators. Cultivated land is a reflection of family capital. The amount of cultivated land can also affect the risk of returning to poverty. The distance of scenic spots is the distance between peasant households and the core scenic spots. Farmers who are far from scenic spots have less access to tourism resources and tourist reception. Road distance, the distance between a villager’s family house and the main road can be indicative of the family’s ease of transportation. Villagers who are far from a highway find travel, production and operation more difficult.
(3) Select physical capital indicators. Housing structure is the main measure of a family’s housing condition. As a kind of private property, livestock is a manifestation of farmers’ material. Fixed assets are the durable goods owned by peasant households, which can reflect their living conditions. The more durable goods the household has, the less likely they are to fall back into poverty. Infrastructure refers to the convenience facilities newly built or improved in the process of local rural-tourism development. The more infrastructure items villagers can enjoy, the more convenient their daily life is.
(4) Select financial capital indicators. Income is an important index of villagers’ quality of life. As income increases, quality of life improves. Tourism is the main source of income for many families. Compared with those who do not manage Zangjiale, the income level of those families who do will increase. Their quality of life improves and their risk of returning to poverty is reduced. A household can have one or more sources of income. Diversification of income source also has an important impact on the risk of returning to poverty. Credit channels can reflect a household’s ability to borrow. When they get into trouble, households with limited access to credit may be at greater risk of falling back into poverty.
(5) Select social capital indicators. A social network is the number of relatives and friends serving the village or other cadres. The larger the social network, the more abundant the channels and quantity of information will be, and the easier it is to engage in production activities conducive to family development. Social mutual assistance is the number of the people who can help villagers when they are in trouble. The availability of such assistance helps to keep villagers out of poverty.
(6) Select risk impact indicators. The impact of weaker policies on poverty alleviation is obvious. Preferential policies play an important role in subsidies and incentives, vocational skills training, infrastructure construction and other aspects. Once preferential policies are weakened after comprehensive poverty alleviation, follow-up might be insufficient. The frequency of natural disasters will not only cause property losses, but also harm the regional ecology. The attack of natural disasters may increase the risk of returning to poverty. Emergencies are public health or social security incidents. Emergencies affect villagers’ productivity, life, and development. For example, the coronavirus pandemic stabilized the markets, depressed local tourism, and reduced the income of villagers. Health status is another potential risk. People diagnosed with serious diseases or disabilities who lose their ability to work will have no source of income.
(7) Select external exclusion indicators. Unemployment probability reflects the likelihood of future unemployment. The more likely the villagers are to be unemployed, the less likely they are to participate in production, exchange, and consumption and the more likely they are to be economically marginalized. The right to participate refers to whether villagers usually attend meetings and engage in activities organized by the village. The low rate of participation indicates that the right of political participation is insufficient, and the possibility of political exclusion is greater, which may also increase the risk of returning to poverty.

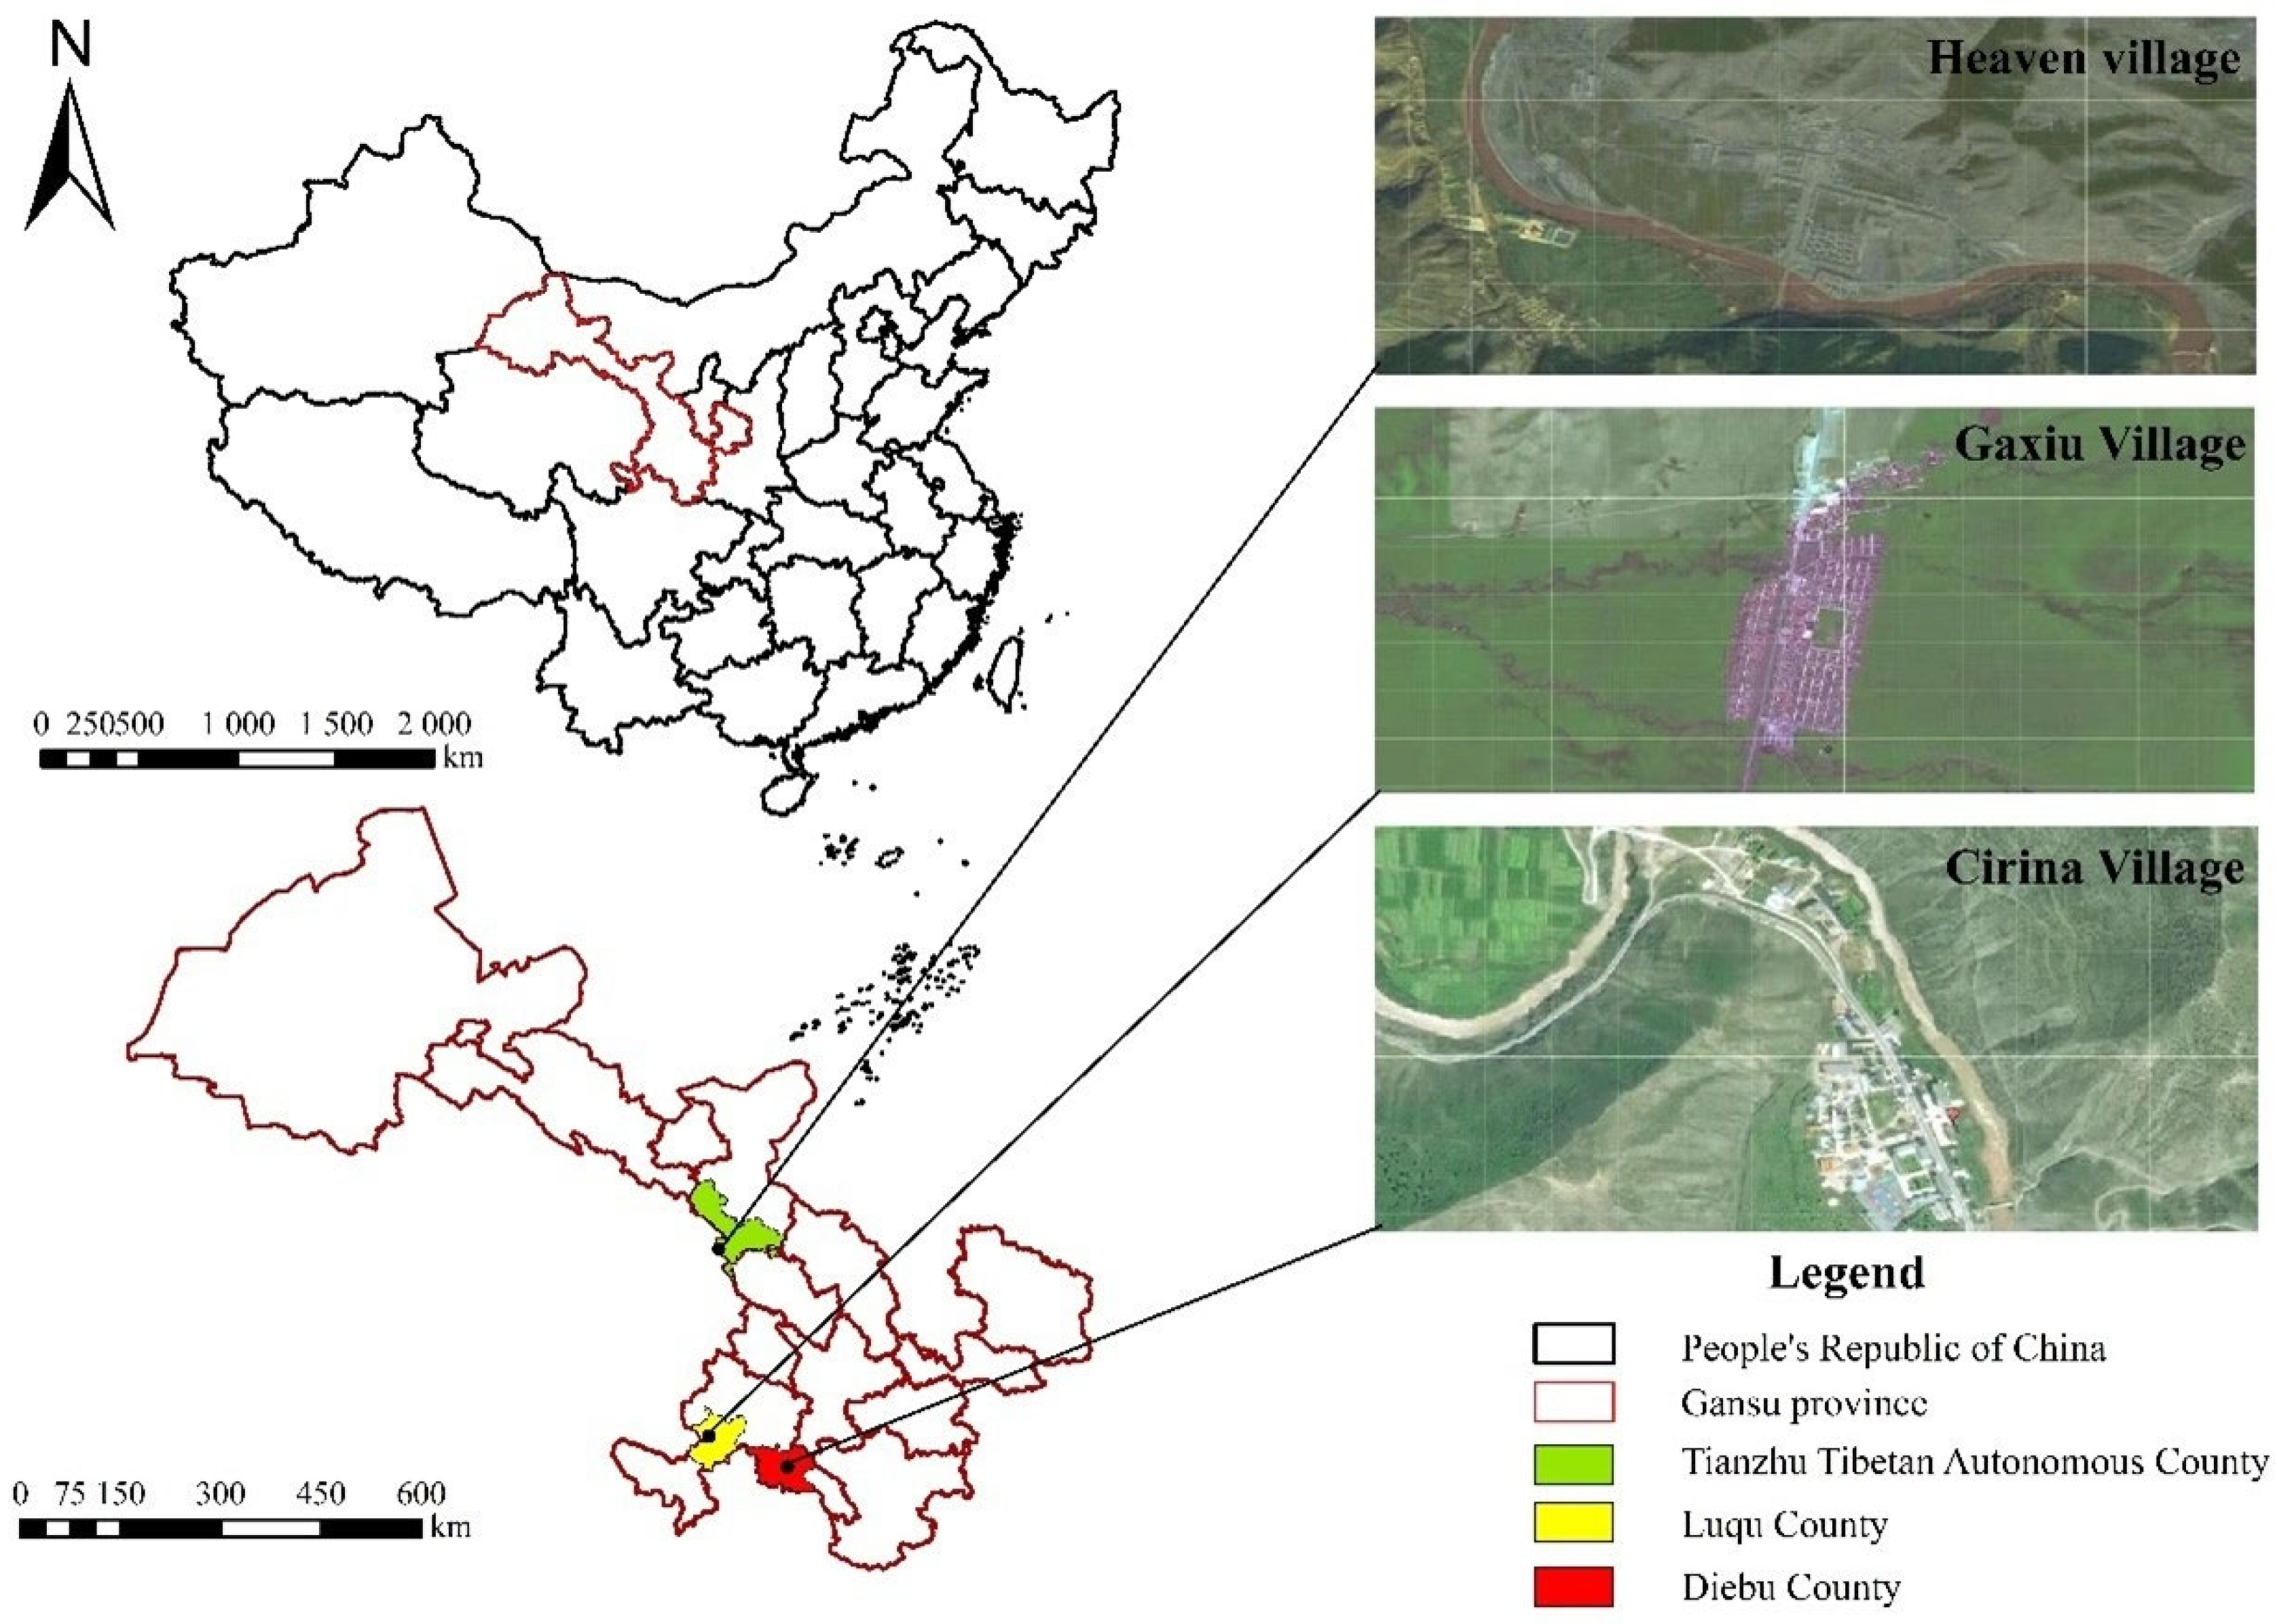
2.2. Overview and Data Source of the Study Area

2.2.1. Overview of the Study Area

(1) Tiantang Village is about 56 km to the west of Tianzhu Tibetan Autonomous County, Gansu Province, with an altitude of about 2200 m. It is located on the north bank of Datong River at the junction of Gansu and Qinghai provinces in China. It is named after a famous Tibetan Buddhist temple. Tiantang Village is a Tibetan-dominated minority village. Tibetans accounts for about 56% of the population of the village. It is in the second batch of “Villages with Chinese Ethnic Characteristics.” Tiantang Village is one of the poorest areas in China and a “National Key Village for Rural Tourism Poverty Alleviation.” It has, therefore, always been a key object of national poverty alleviation. Before targeted poverty alleviation, there were 457 people in the village’s 128 households. Tiantang Village has made great efforts to develop rural tourism, and was selected as the “National Key Village for Rural Tourism” in 2019. At present, more than 50% of the villagers are engaged in tourism, and the whole village has committed to poverty alleviation and prosperity.
(2) Gaxiu Village is about 23 km to the west of the south of Luqu County, Gannan Tibetan Autonomous Prefecture, Gansu Province, with an altitude of about 3000 m. Gaxiu Village and its surrounding areas are rich in tourism resources, integrating natural landscapes such as snow-capped mountains, grasslands, forests, stone forests and rivers with cultural landscapes featuring Tibetan Buddhism culture. Gaxiu Village is one of the first batch of “National Key Rural Tourism Villages”. It is a pastoral village on the plateau dominated by Tibetans. Gaxiu Village is a “National Key Village for Rural Tourism Poverty Alleviation.” Before targeted poverty alleviation, 369 people in 82 households were living in poverty. Most of them were nomads who inhabited the nearby grasslands. Preferential policies have been extended to local people. With the help of the local government, the herdsmen moved to the first Tibetan ecotourism village in Gaxiu Village, and most of them joined the tourism service industry. Their income increased significantly and their living standards continued to improve.
(3) Cirina Village is located along the Bailong River in the southeast of Wangzang Town, Dibu County, Gannan Tibetan Autonomous Prefecture, Gansu Province. It is 48 km away from the county seat and about 1900 m above sea level. It is named after the location of Mao Zedong’s residence. As one of the four groups of villagers under the jurisdiction of Wangzang Village, Cirina Village is a pure Tibetan Village with a long history. The village has been selected as one of the first batch of “Villages with Chinese Ethnic Characteristics.” Cirina Village belongs to the national deep-poverty area and is also the “National Key Village for Rural Tourism Poverty Alleviation”. Before targeted poverty alleviation, 84 people in 20 households lived in poverty. Since then, Cirina Village has made great strides in building rural tourism and ecological leisure agriculture. The geographic location and satellite map of the study area are shown in Figure 2.

2.2.2. Data Source

The research team conducted an investigation on the risk of returning to poverty in Tiantang Village, Tiantang Town, Tianzhu Tibetan Autonomous County, Wuwei City, Gaxiu Village, Gahai Township, Luqu County, Gannan Tibetan Autonomous Prefecture, and Cirina Village, Wangzang Township, Dibu County, Gannan Tibetan Autonomous Prefecture during the period of 21–29 August 2021. Relevant data were obtained from questionnaires and in-depth household interviews. With the guidance and help of village cadres, the research team distributed 288 questionnaires door-to-door to poverty-stricken households. Of the 288 questionnaires distributed, 215 were returned and 184 were determined to be valid: 97 from Tiantang Village, 67 from Gaxiu Village and 20 from Cirina Village. The recovery rate was 94.3% and the effective rate was 85.6%; the overall effective rate was 84.4%. Sample size matters because it affects the outcome of the risk assessment of poverty return. The sample size of the three villages was mainly determined by the number of poor households in each village. Based on field research, after reasonable screening of questionnaire samples, the samples with meaningless or missing information were eliminated, and the final 184 samples were meaningful and could explain the problem.
Males comprised 51.6% of the sample and females comprised 48.4%; this was a balanced proportion of males and females. People aged 50 and above accounted for 59.8% of the sample; only 1.6% were under 18. Most of the respondents (87.5%) had no more than a junior high school education; only 3.3% had at least a junior college education. In terms of occupation, 52.2% of households were self-employed, 22.8% were farmers and herdsmen, and other occupations accounted for less than 10%. In addition, non-heads-of-household accounted for 65.8% and 34.2%, respectively.

2.3. Evaluation Methods

2.3.1. Principal Component Analysis

Principal component analysis (PCA) transforms several original vectors into linear and unrelated comprehensive variables through orthogonal transformation, and uses fewer variables to explain most of the variables in the research problem, so as to achieve dimensionality reduction and simplify the problem. Based on the comprehensive and systematic selection of indicators, it is inevitable that some indicators have little impact on the evaluation results. PCA can explain most of the variables in the research question with fewer variables, which can not only reduce the dimension and simplify the calculation process, but also improve the reliability of the results. The steps of comprehensive evaluation by using PCA are as follows:
(1) Standardize processing data. To eliminate the influence of dimension, it is necessary to standardize the data of various indicators. If the value of an index is larger, the effect will be better, then it is a positive indicator, and if it is smaller, it is a negative indicator. In this study, the lower the risk of returning to poverty, the better the effect; the higher the risk of returning to poverty, the worse the effect. In view of the positive and negative nature of risk indicators for returning to poverty, two methods were adopted to standardize and for forward processing. If the value of index x i is larger, the risk of returning to poverty is smaller; it is a positive index, which is treated by Formula (1). The higher the value of index x i is, the greater the risk of returning to poverty; it is a negative indicator, treated by Formula (2). The expression is as follows:
y i j = ( x j ) max x i j ( x j ) max ( x j ) min
y i j = x i j ( x j ) min ( x j ) max ( x j ) min
In Equations (1) and (2), x i j is the actual value of the i th index for the j th sample, i = 1 , 2 , , n , j = 1 , 2 , , p ; ( x j ) max represents the maximum value of all samples of the j th indicator; ( x j ) min represents the minimum value in the actual values of all samples of the j th indicator; and y i j is the value after standardized treatment, and its range is (0, 1).
(2) Calculate the correlation coefficient matrix. According to the standardized data, the correlation coefficient matrix is calculated as R = ( r i j ) p × p , R is the symmetric matrix of order P, and r i j is the correlation coefficient between variables y i and y j .
(3) Calculate eigenvalues and eigenvectors. The eigenvalue λ i and eigenvector μ i of correlation coefficient matrix R are obtained by calculation, and μ i = 1 is satisfied:
j = 1 p μ i j 2 = 1 ( i , j = 1 , 2 , , p )
In Formula (3), μ i j represents the j th component of vector μ i . In the correlation coefficient matrix R , the variance of the feature vector reflects the variability. The larger the variance of a single feature vector is, the larger the contribution rate to the overall information is, and the eigenvalue reflects the overall information amount.
(4) Determine the principal components. The proportion of a single eigenvalue in the sum of all eigenvalues is the variance contribution rate, which can be obtained by sorting them from large to small and summing them up. According to the number of λ i > 1 and the proportion of the corresponding cumulative variance contribution rate, the principal component can be determined.
g i = λ i / i = 1 p λ i × 100 %
In Formula (4), g i is the variance contribution rate; λ i is the eigenvalue. i = 1 p g i ( i = 1 , 2 , , p ) is the contribution rate of cumulative variance.
(5) Calculate the principal component coefficient. First, determine the principal component model:
{ F 1 = a 11 X 1 + a 21 X 2 + + a p 1 X p F 1 = a 11 X 1 + a 22 X 2 + + a p 2 X p F m = a 1 m X 1 + a 2 m X 2 + + a p m X p
In Formula (5), F 1 , F 2 ,…, F m is a definite principal component; a i j is the coefficient in the linear combination.
It should be pointed out that the value of coefficient a i j cannot be obtained directly in statistical analysis software, and is generally calculated by the value of initial factor load. The relationship between the two is as follows:
a i j = f i j / λ j , j = 1 , 2 , , m
In Formula (6), f i j is the initial factor load; λ j is the eigenvalue corresponding to the j principal component.
(6) Comprehensive evaluation. Through principal component information, the risk of villagers returning to poverty is comprehensively evaluated. The variance contribution rate of each principal component g i is multiplied by the score of each principal component F i , and added to obtain the comprehensive score model:
F = g 1 F 1 + g 2 F 2 + + g m F m

2.3.2. K-Means Clustering Algorithm

Cluster analysis divides data into categories. The k-means clustering algorithm is an iterative clustering analysis method. It has been widely used because of its simple and efficient calculation and its ability to handle the clustering of many numerical samples. The k-means algorithm can better classify the risk levels of poverty return, so as to achieve the purpose that things of the same kind have similarities and different categories have differences, and make the evaluation results of poverty return risk more convincing. The steps of cluster analysis using the k-means clustering algorithm are as follows:
(1) Determine the clustering number K value, and randomly select K initialization cluster centers a 1 , a 2 , , a k .
(2) Using the Euclidean distance method, calculate the distance from each sample value x i to K cluster centers, and divide the samples to the nearest cluster center.
(3) Calculate the mean of all samples divided into each category and use this mean as the clustering center for each new category.
(4) Steps (2) and (3) are repeated until the clustering center does not change, and the final clustering result is determined.
Excel software is used for data standardization processing and matrix calculation, and SPSS 22.0 statistical software is used for PCA and K-means clustering analysis.

3. Results and Analysis

3.1. Evaluation Results

PCA was performed on the standardized data matrix of 23 evaluation indexes from 184 samples in three cases by SPSS software. The calculated value of the KMO test was 0.898, greater than 0.6, indicating a good effect. The significance coefficient of Bartlett’s sphericity test was 0.000 (sig), less than 0.05, indicating high significance and meeting the requirements of PCA. The characteristic value, variance contribution rate and cumulative variance contribution rate corresponding to each principal component are shown in Table 2. Based on the criterion of characteristic value greater than 1, the first six principal components can be identified as the principal components, and the cumulative variance contribution rate of the first six principal components reached 73.72%, indicating that these six principal components can reflect the information of the original indicator. It can also be seen from the principal component macadam diagram (Figure 3) that the trend in the graph begins to flatten after the sixth principal component. Therefore, it is reasonable to select six principal components, which can be used to evaluate the risk of returning to poverty in cases on behalf of the original indicators.
The initial factor load matrix shows the correlation coefficient between the original index and the extracted principal component. The coefficient of each original index in each principal component represents the load size of this index in the corresponding principal component. The following can be concluded from Table 2 and Table 3:
The variance contribution rate of the first principal component reaches 42.657%, which contains the most information among the six principal components. The first principal component includes income level, fixed assets, skills training, emergencies, distance of scenic spots, income source, housing structure, credit channels, weakening of policies, ideology, participation rights, road distance, labor force, social network, tourism operation, and education level. It also covers livelihood and development information and plays a major role in the comprehensive assessment of risk of returning to poverty. The first principal component is also the primary cause of risk of returning to poverty. Income level has the largest load value, reaching 0.914, which is the first level to analyze the risk of returning to poverty. The load values of fixed assets, skills training, emergencies, scenic distance, income source and housing structure are 0.898, 0.860, −0.848, 0.833, 0.823 and 0.816, respectively, all of which are higher than 0.8. Fixed assets, skills training, emergencies, scenic distance, income source and housing structure are the second level for analyzing the risk of returning to poverty. The load values of credit channel, policy weakening, ideology and participation right are all higher than 0.7: 0.794, −0.746, 0.739, 0.722 and 0.705, respectively. Credit channel, policy weakening, ideology and participation right are the third level for analyzing the risk of returning to poverty. The load values of labor force and social network are 0.624 and 0.608, respectively, both exceeding 0.6, which are the fourth level for analyzing the risk of returning to poverty. The load values of tourism business and education level are 0.559 and 0.525, respectively, both exceeding 0.5, which are the fifth level for analyzing the risk of returning to poverty. The variance contribution rate of the second principal component is 9.997%, which includes cultivated land area and natural disaster, reflecting agricultural production conditions. The variance contribution rate of the third principal component is 7.040%, which includes infrastructure and livestock quantity, reflecting the village environment. The variance contribution rate of the fourth principal component is 5.016%, which includes health indicators and reflects personal physical conditions. The variance contribution rate of the fifth principal component is 4.655%, which mainly includes the probability of unemployment and social mutual assistance, reflecting the plight assistance situation. The variance contribution rate of the sixth principal component is 4.356%, which mainly includes education level and social mutual assistance, covering culture and access to help.
According to the principal component coefficient (Table 4) and formula (5), the principal component model for risk assessment of returning to poverty is as follows:
{ F 1 = 0.199 X 1 + 0.168 X 2 + 0.275 X 3 + + 0.136 X 22 + 0.231 X 23 F 2 = 0.318 X 1 + 0.098 X 2 + 0.110 X 3 + 0.051 X 22 + 0.039 X 23 F 3 = 0.250 X 1 0.245 X 2 0.074 X 3 + + 0.192 X 22 + 0.035 X 23 F 4 = 0.117 X 1 0.034 X 2 0.083 X 3 + + 0.050 X 22 0.019 X 23 F 5 = 0.156 X 1 0.124 X 2 + 0.003 X 3 + 0.573 X 22 + 0.215 X 23 F 6 = 0.097 X 1 + 0.469 X 2 0.037 X 3 + + 0.296 X 22 + 0.213 X 23
According to variance contribution rate (Table 2) and Formula (7), the comprehensive scoring model for risk assessment of returning to poverty can be concluded as follows:
F = 0.427 F 1 + 0.100 F 2 + 0.070 F 3 + 0.050 F 4 + 0.047 F 5 + 0.044 F 6
The principal component score, comprehensive score and ranking of the risk of returning to poverty of all samples are calculated. The higher the comprehensive score of risk of returning to poverty, the higher the ranking and the lower the risk of returning to poverty. The specific score is as follows: the average value of F is 0.877, F ∈ [−0.118, 1.566]; the average value of F1 is 1.931, F 1 ∈ [−0.426, 3.538]; the average value of F 2 is −0.113, F 2 ∈ [−0.969, 1.208]; F 3 is 0.283, F 3 ∈ [−0.591, 1.294]; the average value of F 4 is 0.128, F 4 ∈ [−0.932, 0.749]; the average value of F 5 is −0.019, F 5 ∈ [−0.769, 0.769]; the average value of F 6 is 0.913, F 6 ∈ [0.254, 1.619].
Based on the risk assessment results of returning to poverty, K-means clustering is carried out and the cluster number is determined to be 5, which is consistent with the classification standard of risk grade of returning to poverty by most experts and scholars. Therefore, this study divides the risk of returning to poverty into five categories: significant (class i), high (class ii), moderate (class iii), low (class iv), and no risk of returning to poverty (class v). The clustering centers determined by the K-means clustering algorithm for the comprehensive score of risk of returning to poverty are 0.004, 0.560, 0.824, 1.097 and 1.384, respectively. The specific classification range of the comprehensive score of risk of returning to poverty is as follows: −0.118 ≤ F ≤ 0.237 belongs to class i, 0.380 ≤ F ≤ 0.683 belongs to class ii, 0.707 ≤ F ≤ 0.952 belongs to class iii, 0.970 ≤ F ≤ 1.236 belongs to class iv, and 1.246 ≤ F ≤ 1.566 belongs to class v. All samples are numbered from 1 to 184 and 1 to97 in Tiantang Village, 98 to 164 in Gaxiu Village and 165 to 184 in Cirina Village. The comprehensive score of risk of returning to poverty of each sample is classified as follows: 15 samples belong to class i, 40 to class ii, 47 to class iii, 46 to class iv, and 36 to class v. Among the samples from Tiantang Village, 8 belong to class i, 23 belong to class ii, 19 belong to class iii, 25 belong to class iv, and 22 belong to class v. In Gaxiu Village, 2 belong to class i, 10 belong to class ii, 25 belong to class iii, 18 belong to class iv, and 12 belong to class v. In the Cirina Village sample, 5 belong to class i, 7 belong to class ii, 3 belong to class iii, 3 belong to class iv, and 2 belong to class v.

3.2. Result Analysis

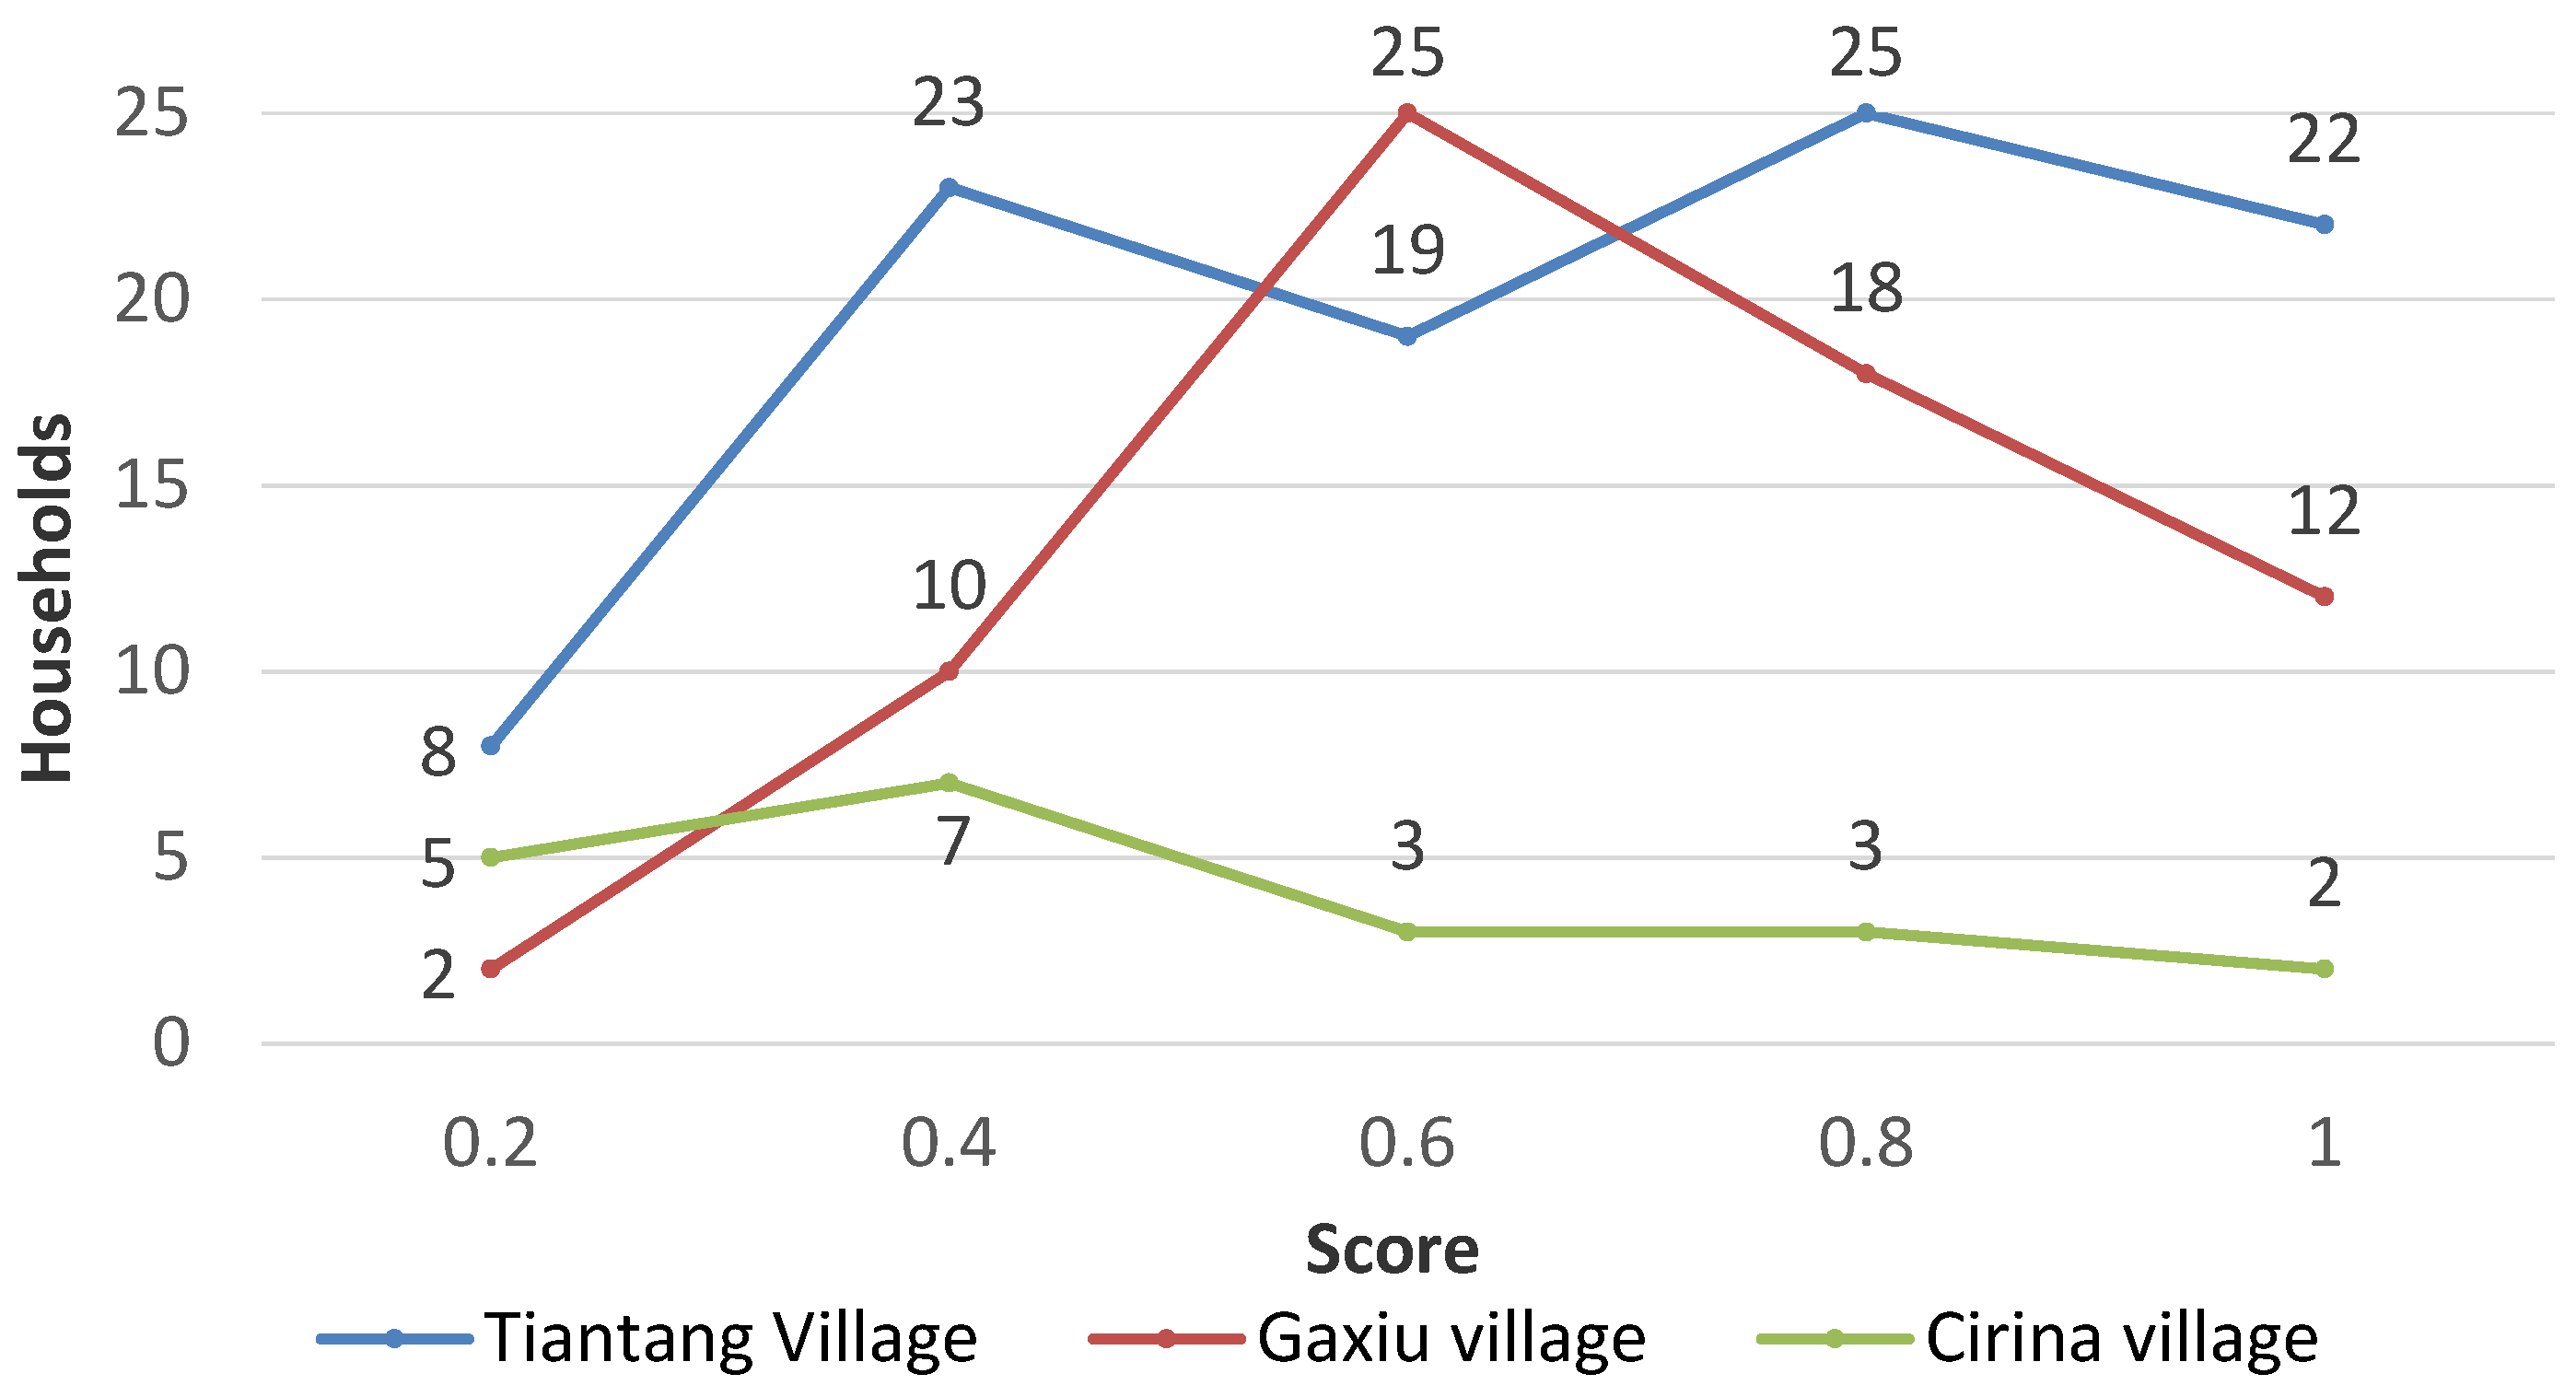
3.2.1. Overall Analysis of Risk Assessment Results of Returning to Poverty

(1) At the present stage, the case area is at a moderate risk of returning to poverty, but a few poverty-stricken households are still at high risk. In total, 15 households are at significant risk of returning to poverty, 40 households are at high risk, 47 households are at moderate risk, 46 households are at low risk, and 36 households are at no risk. Approximately 30% of households that have exited poverty are at significant or high risk of returning to poverty.
To calculate the risk of returning to poverty in case areas, scores are assigned to the poverty-stricken households. The score of households with significant risk of returning to poverty is 0.2, the score of households at high risk is 0.4, the score of households at moderate risk is 0.6, the score of households at low risk is 0.8, and one household is at no risk. Therefore, the formula for calculating the overall risk score of returning to poverty is:
R = ( 0.2 a + 0.4 b + 0.6 c + 0.8 d + 1 e ) s
In Formula (10), R is the score; a , b , c , d , e are the number of households with significant, high, moderate, low and no risk of returning to poverty, respectively; and s is the total number of households. The overall risk score of returning to poverty is 0.652, slightly higher than 0.6, indicating that the risk is moderate. After the implementation of targeted poverty alleviation and targeted poverty alleviation through tourism policies, some poor people respond to these policies to pursue their own development in the hope of leaving poverty permanently. Some people are restricted by a lack of education and development conditions. They cannot improve the conditions in which they are living, so they face a certain risk of returning to poverty. Some people who are at a high risk of returning to poverty depend on national policies for protection. As a result, families who have exited poverty are still at moderate risk of returning to poverty.
(2) Financial capital and human capital are the main constituents of the risk of returning to poverty. Income is the most important factor influencing the risk of returning to poverty. Fixed assets, skill training, distance from scenic spots, income source and housing structure also affect the risk of returning to poverty. The risk composition and influencing factors of households with significant risk of returning to poverty are typical and representative. Table 5 shows the scores of 15 households with significant risk of returning to poverty. It is not difficult to find that the score range of the first principal component F 1 is [−0.426, 0.334], far lower than the average of 1.931. The first principal component clearly plays a leading role in the significant risk of returning to poverty faced by these 15 households.
After further analysis of the sample index information, the author found that these 15 households at risk of returning to poverty share several characteristics. All of them have a lower income and a small number of household durable goods, and no household members completed any skills training. In addition, the household members are far from scenic spots, and depend on a single source of income and have a poor housing structure. All of them also lack access to loans and the ideology of continuing to get rid of poverty and become rich, and they are greatly affected by the weakening of policies. They are unable to participate and social networks, are far from a highway or main road and have a small labor force. None are engaged in the tourism business, and their family members are poorly educated and in poor health. It can, therefore, be concluded that financial and human capital are the main components of the risk of returning to poverty. At the same time, by comparing the load values of indicators belonging to these features (see Table 3), the main factors influencing the risk of returning to poverty can be ranked in order of importance as income level, fixed assets, skill training, distance from scenic spots, source of income, and housing structure. The reason is that human capital is directly related to the livelihood capacity of farmers, which is decisive in the development of individuals and families. For example, lack of vocational skills and lack of labor force will increase the risk of returning to poverty. Financial capital is the most definitive indicator of poverty alleviation. It is also the most active factor in sustainable development and a family’s most visible capital; inadequate income will increase financial risks and result in a return to poverty.

3.2.2. Comparative Analysis of Risk Assessment Results of Returning to Poverty

(1) The overall risk of returning to poverty in the three cases is lower in Gaxiu Village (medium) than in Tiantang Village (medium) and lower than in Cirina Village (medium–high). Figure 4 shows the score distribution of poverty alleviation households. According to Formula (10), the overall risk score of returning to poverty in the three cases is calculated. The scores of Tiantang Village, Gaxiu Village and Cirina Village are 0.662, 0.675 and 0.500, respectively. The score of Gaxiu Village is slightly higher than that of Tiantang Village, and both are moderate risk of returning to poverty. Cirina Village has the lowest score and is lower than the average, placing it at medium–high risk of returning to poverty.
(2) The difference of the risk of returning to poverty in Gaxiu Village is smaller than that in Tiantang Village and Cirina Village. Standard deviation can better reflect the dispersion of a data set. In this study, the degree of difference internal returning to poverty risk in different cases can be measured. The smaller the standard deviation, the smaller the difference of internal returning to poverty risk. The formula for calculating standard deviation is:
σ = i = 1 n ( x i x ¯ ) 2 n
In Formula (11), σ is the standard deviation, x i is the sample value, x ¯ is the average value of the sample, and n is the sample size.
The standard deviations of the scores of poverty alleviation households in the three cases are calculated according to the scores of poverty alleviation households in each risk category of returning to poverty. The standard deviations of Tiantang Village, Gaxiu Village and Cirina Village are 0.256, 0.215 and 0.257, respectively. The variance of Gaxiu Village is the smallest, indicating that the difference in the risk of returning to poverty within Gaxiu Village is the smallest, and that the difference in the risk of returning to poverty within Tiantang Village is slightly lower than that of Cirina Village.
(3) The stability and poverty alleviation situation of Gaxiu Village is superior to those of Tiantang Village and Cirina Village. By comparing the overall and internal risk of returning to poverty in the three cases, it is not difficult to conclude that Gaxiu Village has the best effect on poverty alleviation, followed by Tiantang Village and Cirina Village. The reason is that under the influence of the relocation of Gaxiu Village, the previously nomadic villagers have become rooted in both sides of the 213 National Road. With the help of unique cultural tourism resources and good location, they are not active in rural tourism. The development is good. Tiantang Village’s landscape and Tibetan Buddhist attract large numbers of tourists. Many villagers take advantage of rural tourism and development. A few villagers who cannot participate in rural tourism engage in by farming, working and relief. Therefore, the development is better and the internal differences are larger. Although Cirina Village has precious red tourism resources, the benefits to the villagers are limited. The villagers whose homes are close to the scenic spots are at an advantage. Some villagers make a living by farming, which has greater development potential and great differences in internal development.

3.3. Early Warning Mechanism for Returning to Poverty

The early warning mechanism for returning to poverty constructs in this study consist of risk assessment, warning signs determination, identification of warning degree, warning source search and risk prevention (Figure 5). Among them, the risk assessment of returning to poverty is the premise, the determination of warning signs is the core, the identification of warning degree is the standard, the search for a warning source is the emphasis, and the prevention of risk is the key. The early warning mechanism operates as follows.
(1) Assess the risk of returning to poverty. The comprehensive score of the risk of returning to poverty is the direct basis of the risk level of returning to poverty. The corresponding data are obtained strictly according to the evaluation index system of risk of returning to poverty, and the comprehensive score of risk of returning to poverty is calculated.
(2) Determine warning signs. Determine the “critical value” of the comprehensive score of the risk of returning to poverty, which is the dividing line for whether there is a risk of returning to poverty. This step determines whether the early warning mechanism of returning to poverty can operate. Combined with the comprehensive score range [−0.118, 1.566] of the poverty-stricken households’ returning to poverty, 1.246 is determined as a warning value according to the classification results of risk categories. If this value is reached, poverty-stricken households have good development status and have sustained hematopoietic ability. It is necessary to assess the risk of returning to poverty. If the value is less than this value, it means that the poor households are at risk of returning to poverty.
(3) Identify alertness. For households below the warning value, risk warnings of corresponding levels will be issued according to the comprehensive score of their risk of returning to poverty and the value range of the warning level, which further refines the risk level faced by the households with the risk of returning to poverty. According to the results of cluster analysis, the comprehensive score of returning to poverty between 0.970 and 1.246 belongs to the low risk level of returning to poverty, and the blue risk warning is issued. The comprehensive score of the risk of returning to poverty is between 0.707 and 0.970, which belongs to the moderate risk level, and a yellow risk warning is issued. When the comprehensive score of the risk ranges from 0.380 to 0.707, it belongs to the higher risk level, and an orange risk warning is issued. If the comprehensive score of risk of returning to poverty is lower than 0.380, it is classified as a major risk and a red risk warning is issued. Poverty alleviation households with a blue risk warning should be provided with assistance when needed to promote development and cross the warning line and become households without risk. Appropriate preventive measures should be taken for the poverty-stricken households with yellow risk warning, and they should be encouraged to create conditions to pursue their own development, thus reducing their risk of returning to poverty. For the poverty-stricken households with red and orange risk warnings, the source of alarm needs to be further determined.
(4) Look for a police source. After the classification of risk levels and the issuance of risk warnings, it is necessary to identify the police source for the poverty-stricken households at high and major risk. The first principal component is the main component and source of the risk of returning to poverty. Therefore, the score of the first principal component is taken as the evaluation standard, and the judgment is made according to the score of the first principal component of the poverty-stricken households. Referring to the determination standard of alarm value, the critical value of the first principal component score is 1.494. If this value is reached, it indicates that the first principal component is not the main reason for the high risk of returning to poverty, so routine prevention should be carried out. If the value is lower than this value, it indicates that the first principal component is the main reason for the high risk of returning to poverty, and closer analysis of influencing factors is needed.
(5) Prevent risks. Poverty alleviation households at a high risk of returning to poverty due to the first principal component usually face numerous risks. Therefore, there are seven ways to clarify the direction of prevention and formulate preventive measures. For this group of people, the analysis of their financial capital and human capital should be focused on. At the same time, it is necessary to analyze physical, natural, and social capital, risk impact and external exclusion, identify influencing factors, and prescribe the appropriate remedy. In addition to strengthening preventive measures, dynamic monitoring, continuous attention and timely adjustment of prevention measures are needed to ensure that the poverty-stricken households remain above the poverty line.

4. Conclusions and Discussion

Based on the comprehensive analysis framework of the risk of returning to poverty, the evaluation index system of the risk of returning to poverty of tourism villages in Gansu Tibetan region with seven dimensions was constructed. Based on the investigation of three villages in Tibetan area of Gansu Province, PCA and the K-means clustering algorithm were applied to calculate the evaluation results of the risk of returning to poverty. According to the results, a scientific early warning mechanism for returning to poverty was established. The conclusions are as follows.
(1) The tourism villages in Gansu Tibetan areas are at moderate risk of returning to poverty, but a few of these households remain at high risk. Gaxiu Village has the lowest risk, followed by Tiantang Village, and Cirina Village. The difference of the risk of returning to poverty within Gaxiu Village is the lowest, followed by Tiantang Village and Cirina Village. Gaxiu Village has been most successful at poverty alleviation, followed by Tiantang Village and Cirina Village.
(2) The risk of returning to poverty is the result of many factors. Among them, financial capital and human capital are the main components of the risk of poverty alleviation. Specifically, income level is the most important factor influencing the risk of returning to poverty, while fixed assets, skill training, scenic distance, income source and housing structure also have an important affect the risk of returning to poverty.
(3) A pre-warning mechanism for returning to poverty should be established, including risk assessment, determining the warning signs, alert degree of the identification, looking for an alert source and risk prevention. Risk prevention is based on improving livelihood capacity, resisting risk impact and improving the development environment. It is carried out at the subject, village and regional levels to prevent the risk of returning to poverty.
Combining these research conclusions with previous research conclusions, the following points are drawn. First, education level, health status and labor force have a significant impact on the risk of returning to poverty, which is in line with the poverty ability theory of Amartya Sen and the conclusion put forward by Li, indicating that improving personal education level, maintaining physical health and cultivating professional skills are extremely important in preventing the return to poverty. Second, the weakening of the benefit-oriented policies has a significant impact on the risk of poverty-stricken households returning to poverty. The benefit-oriented policies are related to people’s livelihood, and it is necessary to further consolidate the benefit-oriented policies after poverty alleviation. The research of Yang also drew similar conclusions. Third, natural disasters have a significant impact on the risk of returning to poverty of poverty-stricken households, which is consistent with Zhuang’s research findings. As the ability of poverty-stricken people to withstand disaster losses is weak, it is urgent to formulate emergency assistance measures, and timely provide funds and materials to residents in case of emergency. Fourth, the income level and the ideology of getting rich have a significant impact on the risk of returning to poverty. Bao, Li and others also put forward the same view. The reason is that the livelihood ability of farmers is directly related to their income level, and residents with low ideological awareness of getting rid of poverty will lose their independent development ability. Therefore, it is also critical to guide residents to form the active ideological awareness of self-reliance and getting rid of poverty while improving the income level of poverty-stricken households. Fifth, this study concludes that the distance of scenic spots, tourism operation, income sources, emergencies, unemployment probability and so on have significant impacts on the risk of returning to poverty. Current relevant studies have paid little attention to these factors, and the applicability of the conclusion needs to be further verified.
Most of the previous studies focused on the risk assessment of returning to poverty in a certain region, as well as the macro analysis of the early warning of returning to poverty, and few focused on the micro research objects. In addition, the current research on the evaluation index system of the risk of returning to poverty is uneven, and there are few studies specifically on the evaluation index system of the risk of returning to poverty in characteristic tourism villages. This study demonstrates that sustainable livelihood theory, poverty vulnerability theory and social exclusion theory can be applied to study the risk of returning to poverty. It brings a new perspective to analyses of the risk of returning to poverty, and also provides some theoretical basis for scholars to continue studying the problem. China is consolidating the achievements of poverty alleviation and realizing rural revitalization. This study can provide new theoretical guidance for alleviating poverty in tourism villages and enriching the theoretical system of poverty management. At the same time, the combination of PCA and the K-means clustering algorithm not only improves the subjectivity caused by the qualitative evaluation, but also makes the evaluation results more accurate and practical, thereby clarifying the risk of returning to poverty in the study area and its influencing factors. In addition, the early warning mechanism established in this paper can assist departments monitoring the risk in real time and help the government to implement precise policies and measures to keep people out of poverty.

5. Countermeasures and Suggestions

The starting point of the early warning mechanism for returning to poverty is to forewarn and prevent a return to poverty. Risk prevention is the key. In Gansu Tibetan areas, this risk can be prevented by improving livelihood capacity, resisting risk impact and improving development environment at the levels of the subject, village and region.
(1) Subject level. Prevention and subsistence policy support should be provided for households at significant or high risk of returning to poverty. Risk resistance and livelihood capacity should be improved. The priorities for households at moderate and low risk of returning to poverty are to reduce policy dependence, improve the capacity for a sustainable livelihood, form a virtuous livelihood cycle and completely eliminate the risk of returning to poverty. Finally, the risk of returning to poverty should be regularly assessed for those who are not at risk, so as to prevent emergencies and eliminate the hidden worries of returning to poverty.
(2) Village level. It is necessary for the government to promote the development of the local tourism, guide them to form the ideology of self-reliance and poverty alleviation, and encourage villagers to actively participate in rural tourism development activities. The number of training sessions for villagers should be increased, their professional skills should be improved, and villagers should be encouraged to participate in vocational skills training. Finally, the distance between villagers and scenic spots should be shortened by moving the villagers to improve villagers’ access to tourism resources and tourist reception.
(3) Regional level. The government should consolidate the policy of benefiting the people after poverty alleviation, increase the support for education in rural areas, and further improve the infrastructure construction and cooperative medical system in all villages. It is important to offer timely financial and material assistance to at-risk villages and villagers who rely on the resources of the region; focus on the high-quality development of characteristic industries; and improve the income level of villagers. Finally, a scientific and applicable mechanism should be established to prevent poverty and consolidate the results of poverty alleviation.

Author Contributions

Conceptualization and methodology, Y.-b.W.; Software, formal analysis and investigation, J.-h.Z.; Writing—Original Draft, R.Y.; Writing—Review and Editing, R.-t.Z.; Visualization, Y.L. All authors have read and agreed to the published version of the manuscript.

Funding

Research on the implementation path of Rural Tourism of Gansu Rural Revitalization Strategy, Gansu Province Social Science Planning project, CNY 30,000, in December 2018. Performance Evaluation and Demonstration of Targeted Poverty Alleviation by Rural Tourism in Ethnic Areas Based on Multidimensional Poverty Theory, Natural Science Foundation of Gansu Province, CNY 50,000, in October 2020. Research on the evaluation system of Cultural Strong Province Construction Index, Social Science Planning Commissioned Project of Gansu Province, CNY 30,000, October 2021.

Informed Consent Statement

Not applicable.

Conflicts of Interest

The authors declare no conflict of interest.

References

  1. Office of Household Surveys, National Bureau of Statistics. The achievements of poverty alleviation and development have attracted worldwide attention, and decisive progress has been made in poverty alleviation--The fifth report of the series of reports on the achievements of economic and social development in the past 40 years of reform and opening up. China Information News, 4 September 2018; 1. (In Chinese) [Google Scholar]
  2. National Bureau of Statistics. Statistical Bulletin of the People’s Republic of China on National Economic and Social Development in 2019. China Information News, 2 March 2020; 2. [Google Scholar]
  3. De Silva, M.M.G.T.; Kawasaki, A. Socioeconomic Vulnerability to Disaster Risk: A Case Study of Flood and Drought Impact in a Rural Sri Lankan Community. Ecol. Econ. 2018, 152, 131–140. [Google Scholar] [CrossRef]
  4. Kuypers, S.; Marx, I. The Truly Vulnerable: Integrating Wealth into the Measurement of Poverty and Social Policy Effectiveness. Soc. Indic. Res. 2018, 142, 131–147. [Google Scholar] [CrossRef]
  5. Dong, C.; Luan, J.; Xie, B. An analysis on the phenomenon of returning to poverty. Explor. Econ. Probl. 2008, 3, 176–178. (In Chinese) [Google Scholar] [CrossRef]
  6. Zhang, X.; Mao, K. Research on educational Prevention mechanism of Poverty return in ethnic minority areas. Res. Educ. Ethn. Minor. 2018, 29, 46–51. (In Chinese) [Google Scholar]
  7. Ding, J.; Chen, B. Building sustainable poverty alleviation model to treat the persistent disease of rural poverty return. Soc. Sci. 2010, 1, 52–57. (In Chinese) [Google Scholar]
  8. Zhang, Y. “Policy to reduce poverty” calls for legislation of ecological compensation. Environ. Prot. 2011, 21, 58. (In Chinese) [Google Scholar]
  9. Erwin, S.; Hannes, M.; Anja, W. Explaining the impact of poverty on old-age frailty in Europe: Material, psychosocial and behavioural factors. Eur. J. Public Health 2017, 27, 1003–1009. [Google Scholar]
  10. Atake, E.H. Health shocks in Sub-Saharan Africa: Are the poor and uninsured households more vulnerable? Health Econ. Rev. 2018, 8, 26. [Google Scholar] [CrossRef]
  11. Zhao, Y.-C.; Chen, D.-X.; Wang, Z.; Wang, C.-S.; Shao, K.; Dong, C.-S. Prevention of Returning to poverty: Strategic change and action mode of targeted poverty alleviation through sports. J. Shenyang Inst. Phys. Educ. 2020, 39, 29–34 + 42. (In Chinese) [Google Scholar]
  12. Zhang, X.; Wang, Q. Community empowerment: An effective way to reduce the risk of returning to poverty among rural tourism destinations. China Tourism News, 5 June 2020; 3. (In Chinese) [Google Scholar]
  13. United Nations Development Programme (UNDP). Human Development Report 2003: Millennium Development Goals: A Compact Among Nations to End Human Poverty; Oxford University Press: New York, NY, USA, 2003. [Google Scholar]
  14. Wang, H. The problem that must be solved in the construction of new countryside: Peasants returning to poverty in underdeveloped areas. Spec. Area Econ. 2007, 8, 149–150. (In Chinese) [Google Scholar]
  15. Fan, H. Research on the construction of early-warning mechanism for returning to poverty. Res. Social. Chin. Charact. 2018, 1, 57–63. (In Chinese) [Google Scholar]
  16. Jiao, K.; Chen, C.; Jiao, Y. Construction of prevention mechanism for returning to poverty in deeply impoverished areas from the perspective of holistic governance: A case study of L County in Liupanshan, Northwest China. Xinjiang Soc. Sci. 2019, 1, 137–145. (In Chinese) [Google Scholar]
  17. Coady, D.; Grosh, M.; Hoddinott, J. Targeting of Transfers in Developing Countries; World Bank Publications: Washington, DC, USA, 2004. [Google Scholar] [CrossRef]
  18. He, L.; Wang, Y.; Lu, C. Rural poverty reduction and poverty reduction prevention from the perspective of public investment in human capital. Fisc. Res. 2018, 5, 15–24. (In Chinese) [Google Scholar]
  19. Zhou, D.; Wang, M. The internal logic of returning to poverty: The theory and verification of poverty alleviation by vulnerability. J. Financ. Econ. 2019, 45, 126–139. (In Chinese) [Google Scholar]
  20. Ligon, E.; Schechter, L. Measuring Vulnerability. Econ. J. 2003, 113, 95–102. [Google Scholar] [CrossRef] [Green Version]
  21. Zhuang, T.; Zhang, H.; Fu, X. Analysis on the impact of village-level development environment on poor people’s return to poverty in minority areas—Based on a survey of 67 villages in Minority areas of Sichuan, Guizhou and Chongqing. J. Agric. Technol. Econ. 2011, 2, 41–49. (In Chinese) [Google Scholar]
  22. Li, C. Study on factors of poor population returning to poverty in deep poverty area. J. Northwest Ethn. Stud. 2019, 102, 111–117. (In Chinese) [Google Scholar]
  23. Chen, C.; Luo, F. Comprehensive fuzzy evaluation on the risk of returning to poverty of residents in rural tourism destinations: Based on the perspective of sustainable livelihood capital. J. Cent. South Univ. For. Technol. 2018, 12, 100–104, 112. (In Chinese) [Google Scholar]
  24. Yang, J. Study on the Risk and Blocking Mechanism of Farmers Returning to Poverty in Ethnic Tourism Villages under Sustainable Livelihood. Master’s Thesis, Guilin University of Technology, Guilin, China, 2020. (In Chinese). [Google Scholar]
  25. Wei, X. Research on Risk Identification and Prevention and Control of Returning to Poverty: Based on an Empirical Investigation of L Township in Guizhou Province. Master’s Thesis, East China University of Science and Technology, Shanghai, China, 2019. (In Chinese). [Google Scholar]
  26. Lin, Y.; Fan, X.; Wu, Y.; Jin, H.; Qi, X. Risk and mechanism of returning to poverty in poor mountainous counties: Based on multidimensional perspective of returning to poverty. J. Fujian Agric. For. Univ. 2020, 23, 11–17, 36. (In Chinese) [Google Scholar]
  27. Yang, Y. Study on Mechanism of Anti-Poverty Return in Jinggangshan under Region-Wide Tourism. Master’s Thesis, Nanchang University, Nanchang, China, 2019. (In Chinese). [Google Scholar]
  28. Li, J.; Chen, Y. Measurement and decomposition of multidimensional return to poverty of farmers in deep poverty area. J. Arid. Land Resour. Environ. 2020, 34, 60–65. (In Chinese) [Google Scholar]
  29. Li, W. Construction of Risk Evaluation Index System for Returning to Poverty in K Town of Agricultural Area of Inner Mongolia Autonomous Region. Master’s Thesis, Beijing Forestry University, Beijing, China, 2020. (In Chinese). [Google Scholar]
  30. Gu, X.; Xue, X. Risk Assessment of Returning to poverty: Based on a survey of typical poor counties in western Henan province. J. Henan Polytech. Univ. 2021, 22, 22–30. (In Chinese) [Google Scholar]
  31. Liu, Y.; Shu, D.; Jin, C.; He, X. Risk of returning to poverty in post-Poverty Era and insurance anti-poverty countermeasures: Based on the investigation of A District in Nanjing city. Jiangsu Agric. Sci. 2020, 48, 7–13. (In Chinese) [Google Scholar]
  32. Tian, K. Prediction Model of Poverty Return Based on Logistic Regression Analysis. Master’s Thesis, Northwest Normal University, Lanzhou, China, 2018. (In Chinese). [Google Scholar]
  33. Zhang, W.; Wu, Y.; Gong, Y. Risk prediction and reason analysis of poverty return of registered poor Households: Based on field monitoring data of registered poor households in 25 provinces (autonomous regions and municipalities) in 2019. J. Beijing Univ. Technol. 2012, 22, 110–120. (In Chinese) [Google Scholar]
  34. Yan, H. Research and Application of Prediction Model for Poverty Reduction Based on Data Mining. Master’s Thesis, Shaanxi Normal University, Shaanxi, China, 2019. (In Chinese). [Google Scholar]
  35. Jiang, N.; Zheng, W. Measurement of Multidimensional Return to poverty of Migrant workers in China. Chin. Rural. Econ. 2017, 6, 58–69. (In Chinese) [Google Scholar]
  36. Huang, H.; Cai, C.; Teng, J. Research on risk assessment and long-term prevention mechanism of returning to poverty in the context of rural revitalization. J. Luoyang Inst. Sci. Technol. 2019, 34, 38–44. (In Chinese) [Google Scholar]
  37. Luo, Y.; Li, H.; Hou, L.; Zhao, Z. Risk identification and early-warning mechanism construction of returning to poverty in rural tourism destinations from the perspective of sustainable livelihood: A case study of W Village, Enshi Prefecture, Hubei Province. J. Arid. Land Resour. Environ. 2022, 36, 186–193. (In Chinese) [Google Scholar]
  38. Wang, R.; Luo, H. Early warning and evaluation of risk of returning to poverty under the background of poverty withdrawal. Stat. Decis. 2021, 37, 81–84. (In Chinese) [Google Scholar]
Figure 1. Comprehensive analysis Framework of Risk of Returning to Poverty.
Sustainability 14 11268 g001
Figure 2. Geographical Location and Village Satellite Image of the Study Area.
Sustainability 14 11268 g002
Figure 3. Main Component Lithotripsy.
Sustainability 14 11268 g003
Figure 4. Score Distribution Map of Poverty Alleviation Households in Case Areas.
Sustainability 14 11268 g004
Figure 5. Early warning Mechanism for Returning to Poverty.
Sustainability 14 11268 g005
Table 1. Risk Evaluation Index System of Returning to Poverty.
TargetLevel IndicatorsThe Secondary IndicatorsIndicator Description and AssignmentQuality
Risk of poverty returningHuman capital (H)Labor force H1The number of household workers; 0 = 1, 1 = 2, 2 = 3, 3 = 4, 4 or more = 5.Positive
Education H2The average educational level of the household working population. Not in school = 1, primary school = 2, junior high school = 3, senior high school/technical secondary school = 4, junior college or above = 5.Positive
Skill training H3The number of times a family member participates in skills training per year; 0 = 1, 1 = 2, 2 = 3, 3 = 4, 4 or more = 5.Positive
Ideology H4Family members’ willingness to continue to get rid of poverty. Very weak = 1, relatively weak = 2, average = 3, relatively strong = 4, very strong = 5.Positive
Natural capital(N)Cultivated area N1The family owns the area of farmland. Less than 1 mu = 1, 1–2 mu = 2, 2–3 mu = 3, 3–4 mu = 4, 4 mu = 5.Positive
Distance of the scenic spot N2The distance between the family house and the core scenic area. Within 1 km = 1, 1–3 km= 2, 3 km= 3.Negative
Road distance N3Distance between family house and village road. Near = 1, general = 2, far = 3.Negative
Physical capital (P)Housing structure P1Family housing structure. Hut = 1, civil = 2, brick = 3, tile = 4, concrete = 5.Positive
Livestock number P2The number of cattle, horses, sheep and other livestock raised by a family (unit: head, horse, sheep); 0 = 1, 1 = 2, 2 = 3, 3 = 4, 4 and above = 5.Positive
Fixed assets P3Number of consumer durables owned by households (mobile phones, televisions, computers, electric fans, refrigerators, air conditioners, washing machines, rice cookers, induction cookers, microwave ovens, solar/water heaters, motorcycles, cars, and others); 5 or less = 1, 6–7 = 2, 8–9 = 3, 10–11= 4, 12 or more = 5.Positive
Infrastructure P4Number of items of infrastructure available to households (safe drinking water, safe electricity, health care, compulsory education, tourist latrines, garbage removal, rural roads, sewage treatment et al.). 1 or less = 1, 2–3 = 2, 4–5=3, 6–7 = 4,8 or more = 5.Positive
Financial capital (F)Income level F1The average annual income of each family member. CNY 3000 and below = 1, CNY 3001–6000 = 2, CNY 6001–15,000 = 3, CNY 15,001–30,000 = 4, CNY 30,001 and above = 5.Positive
Tourism management F2Whether the family has run the Zangjiale. If yes = 1, if no = 0.Positive
Revenue source F3Number of main sources of family income (farming, labor, government subsidies, tourism, and others); 0 = 1, 1 = 2, 2 = 3, 3 = 4, 4 or more = 5.Positive
Credit channel F4The number of sources (banks, credit unions, relatives and friends, local governments, and others) through which households can obtain loans; 0 = 1,1 = 2,2 = 3,3 = 4,4 or more = 5.Positive
Social capital (S)Social network S1The number of family members, relatives and friends serving as village officials or other officials; 0 = 1, 1 = 2, 2 = 3, 3 = 4, 4 or more = 5.Positive
Social mutual aid S2How many trusted people in the village are willing to help your family; 0 = 1, 1–2 = 2, 3–4 = 3, 5–6 = 4, 7 or more = 5.Positive
Risk shock®Policy weakening R1Whether the government’s preferential policies for your family are weakened (poverty relief, policy subsidies, land acquisition subsidies, and special support) compared with the poverty alleviation period? If yes = 1, if no = 0.Negative
Natural disaster R2The damage caused by natural disasters to your home. Very small = 1, relatively small = 2, average = 3, relatively large = 4, very large = 5.Negative
Emergency R3The damage to your family caused by an emergency. Very small = 1, relatively small = 2, average = 3, relatively large = 4, very large = 5.Negative
Health condition R4Whether a family member has a major illness or disability. If yes = 1, if no = 0.Negative
External rejection (E)Probability of unemployment E1The possibility of a family member losing his or her job. Very small = 1, relatively small = 2, average = 3, relatively large = 4, very large = 5.Negative
Right of participation E2Whether family members normally participate in meetings and activities organized by the village. Very little = 1, relatively little = 2, average = 3, relatively much = 4, very much = 5.Positive
Table 2. Eigenvalue and Variance Contribution Rate.
Principal ComponentInitial EigenvaluesExtract The Sum of Squares and Load
EigenvalueVariance Contribution Rate/%Cumulative/%EigenvalueVariance Contribution Rate/%Cumulative/%
19.81142.65742.6579.81142.65742.657
22.2999.99752.6532.2999.99752.653
31.6197.04059.6931.6197.04059.693
41.1545.01664.7091.1545.01664.709
51.0714.65569.3641.0714.65569.364
61.0024.35673.7201.0024.35673.720
70.8523.70377.424
80.7003.04580.469
90.5762.50482.974
100.5592.43285.405
110.4672.03187.436
120.4441.92989.365
130.3891.69391.058
140.3651.58692.643
150.3311.43794.081
160.2841.23595.316
170.2491.08296.398
180.2190.95197.349
190.1850.80598.154
200.1450.63298.786
210.1220.52999.315
220.1050.45599.770
230.0530.230100.000
Table 3. Initial Factor Load Matrix.
IndexComponent Matrix
Principal Component 1Principal Component 2Principal Component 3Principal Component 4Principal Component 5Principal Component 6
Labor force0.6240.482−0.318−0.126−0.1610.097
Education0.5250.148−0.312−0.037−0.1280.496
Skills training0.8600.167−0.094−0.0890.003−0.037
Ideology0.7390.0240.1220.116−0.020−0.231
Cultivated area0.2450.909−0.0710.0260.004−0.089
Distance of the scenic spot0.833−0.08−0.053−0.2090.029−0.063
Road distance0.705−0.005−0.097−0.2810.042−0.182
Housing structure0.816−0.0230.1090.0590.042−0.018
Livestock number0.2690.1610.5600.5360.3330.053
Fixed assets0.898−0.0790.039−0.0180.05−0.051
Infrastructure0.229−0.0940.566−0.4360.0620.290
Income level0.914−0.1260.1280.0460.131−0.158
Tourism management0.559−0.415−0.400−0.196−0.037−0.132
Revenue source0.823−0.0940.2180.0470.066−0.002
Credit channel0.7940.0590.126−0.0180.0220.121
Social network0.6080.0490.0800.086−0.0400.371
Social mutual aid−0.181−0.094−0.5170.1310.5880.406
Policy weakening−0.7460.2510.087−0.237−0.0210.149
Natural disaster−0.212−0.8670.0690.005−0.0510.163
Emergencies−0.8480.2900.2090.017−0.1100.123
Health condition0.361−0.144−0.3180.619−0.3460.017
The probability of unemployment0.427−0.0780.2440.054−0.5930.296
Participatory right0.7220.0590.045−0.0200.2230.213
Table 4. Principal Component Coefficients.
IndexPrincipal Component 1Principal Component 2Principal Component 3Principal Component 4Principal Component 5Principal Component 6
Labor force0.199 0.318 −0.250 −0.117 −0.156 0.097
Education0.168 0.098 −0.245 −0.034 −0.124 0.496
Skills training0.275 0.110 −0.074 −0.083 0.003 −0.037
Ideology0.236 0.016 0.096 0.108 −0.019 −0.231
Cultivated area0.078 0.600 −0.056 0.024 0.004 −0.089
Distance of the scenic spot0.266 −0.053 −0.042 −0.195 0.028 −0.063
Road distance0.225 −0.003 −0.076 −0.262 0.041 −0.182
Housing structure0.261 −0.015 0.086 0.055 0.041 −0.018
Livestock number0.086 0.106 0.440 0.499 0.322 0.053
Fixed assets0.287 −0.052 0.031 −0.017 0.048 −0.051
Infrastructure0.073 −0.062 0.445 −0.406 0.060 0.290
Income level0.292 −0.083 0.101 0.043 0.127 −0.158
Tourism management0.178 −0.274 −0.314 −0.182 −0.036 −0.132
Revenue source0.263 −0.062 0.171 0.044 0.064 −0.002
Credit channel0.253 0.039 0.099 −0.017 0.021 0.121
Social network0.194 0.032 0.063 0.080 −0.039 0.371
Social mutual aid−0.058 −0.062 −0.406 0.122 0.568 0.406
Policy weakening−0.238 0.166 0.068 −0.221 −0.020 0.149
Natural disaster−0.068 −0.572 0.054 0.005 −0.049 0.163
Emergencies−0.271 0.191 0.164 0.016 −0.106 0.123
Health condition0.115 −0.095 −0.250 0.576 −0.334 0.017
The probability of unemployment0.136 −0.051 0.192 0.050 −0.573 0.296
Participatory right0.231 0.039 0.035 −0.019 0.215 0.213
Table 5. Score Information of Households with Significant Risk of Returning to Poverty.
NumberF1F2F3F4F5F6F
2−0.414 −0.212 0.700 −0.115 0.019 0.811 −0.118
130.243 0.163 0.796 −0.410 0.282 0.888 0.207
20−0.244 −0.358 0.303 0.399 −0.165 0.868 −0.068
22−0.426 −0.245 0.773 −0.300 0.334 0.984 −0.108
300.251 0.268 0.505 0.505 −0.397 0.888 0.215
35−0.343 −0.269 0.758 −0.414 0.206 0.937 −0.090
56−0.321 −0.152 0.869 −0.192 0.233 1.095 −0.042
68−0.241 −0.160 0.360 0.666 0.052 1.096 −0.010
117−0.418 −0.268 0.756 −0.300 0.341 0.941 −0.110
119−0.281 −0.093 0.617 −0.063 0.181 0.802 −0.046
173−0.338 −0.162 0.421 0.620 −0.086 0.872 −0.066
174−0.357 −0.194 0.657 −0.286 0.294 1.183 −0.074
1790.334 0.258 0.317 0.386 −0.244 0.887 0.237
181−0.133 0.256 0.288 0.466 −0.091 0.735 0.040
183−0.034 0.157 0.662 −0.304 0.063 1.135 0.085
Publisher’s Note: MDPI stays neutral with regard to jurisdictional claims in published maps and institutional affiliations.

