Article

Drivers and Implications of Land Cover Dynamics in Muger Sub-Basin, Abay Basin, Ethiopia

1
Institute of Environment and Sustainable Development in Agriculture (IEDA), Chinese Academy of Agricultural Sciences (CAAS), Beijing 100081, China
2
Oromia Agricultural Research Institute, Bako Agricultural Research Center, Bako P.O. Box 03, Ethiopia
3
Graduate School of Chinese Academy of Agricultural Sciences, Beijing 100081, China
4
Wondo Genet College of Forestry and Natural Resources, Hawassa University, Shashemene P.O. Box 128, Ethiopia
5
Department of Disaster Risk Management and Sustainable Development, Ambo University, Ambo P.O. Box 19, Ethiopia
6
College of Agriculture and Veterinary Sciences, Ambo University, Ambo P.O. Box 19, Ethiopia
*
Author to whom correspondence should be addressed.
Sustainability 2022, 14(18), 11241; https://doi.org/10.3390/su141811241
Submission received: 25 July 2022 / Revised: 19 August 2022 / Accepted: 20 August 2022 / Published: 8 September 2022

Abstract

:
Research on the landscape level dynamics of land cover and an understanding of the drivers responsible for these changes are useful for formulations of sustainable land management strategies and policy decisions. The pace and magnitude of the LCCs in Ethiopia are threatening the natural ecosystem and creating vulnerability to environmental hazards. This study used a combination of remotely sensed data, field interviews, and observations to examine the dynamics and identify the driving forces of LCC from 1986 to 2020 in the Muger sub-basin, Ethiopia. Multi-temporal satellite images were classified using supervised and unsupervised methods. Information from focus group discussions and the variable ranking method were used to explain the drivers of the observed changes. The study results showed a decline in forest cover from 11.80% in 1986 to 5.90% in 2020, which indicates a loss of 49.90% of the forest cover that existed in 1986. Bare land declined from 1.15% in 1986 to 0.57% in 2020. Similarly, grazing land declined from 1.52% in 1986 to 0.41% in 2020. Wetland also declined from 1.93% in 1986 to 0.31% in 2020. Conversely, during the same period, the proportions of cultivated land, built-up areas, shrubland, and water bodies have risen from 68.86% to 70.44%, from 0.03% to 1.53%, from 14.39% to 20.27%, and from 0.34% to 0.56%, respectively. Population growth and poor agricultural practices were identified as the main causes of LCC in the sub-basin. Therefore, the findings of this study suggest that implementation of comprehensive and integrated basin management policies and strategies will be indispensable to managing the risks and ensuring sustainable development in the larger Abay basin.

1. Introduction

Land cover and land use assessment are important inputs for ecological studies. However, there is confusion in the use of the terms land use and land cover. Land use is defined as a term that describes how the land is utilized by people and is mainly related with a functional role for economic activities, whereas land cover (LC), which is the focus of this study, describes the physical characteristics of Earth’s surface [1,2]. Land cover change (LCC) is one of the major factors that affects biophysical systems from the local to the global scales [3]. LCC has direct and indirect consequences on the status of the natural environment and human activities. Land productivity, land degradation, hydrological cycle, biodiversity, and quality of the environment are some of the natural processes that could be affected by LCC [4,5]. The disruption of the natural systems’ capacity to meet human needs by changing LC exposes more people and the environment to the harmful effects of climate change. By limiting the ecosystem benefits that could be obtained from the comparatively stable natural environment, socioeconomic crises and political anxiety are also caused [3,6]. Unfortunately, the rate of local and worldwide LCC has increased in recent years, which is the most concerning issue [4,5].
Land use systems theory is one of the pillars of studying LCC dynamics; it incorporates two major components. These are the environmental subsystems in which the changes in LC are studied from the perspectives of the natural environment, such as changes in any one of the cover changes and how such changes affect the ecosystem services. On the other hand, the social subsystem is concerned with the land use affecting the dynamics of LC over spatial and temporal scales [7].
Dynamic LC information, which accounts for changes, offers a holistic understanding of the interactions that are important for sustainable land resource management [8]. LCC is driven by both natural and anthropogenic factors at both the global and the local levels. LCCs are non-linear human–nature interactions, which involve complex processes. The historically observed changes until now are against the natural environment. The LCC trajectory worldwide for the past 300 years has been categorized by gains in human-influenced land use, such as agriculture and settlement and losses near natural environments, including forests, wetlands, grasslands, and shrubland [9,10]. According to [11], LCCs are associated with the change of forestland to agriculture and urban settlements and with other forms of deforestation.
LCC has been investigated by many researchers in Ethiopia, and their findings indicated that there were significant changes during the second half of the twentieth century [12,13,14,15,16,17,18,19]. Studies have shown that LCC has been intense in the highlands of Ethiopia. The major causes of LCC in Ethiopia are the expansion of agriculture and urbanization and the extraction of forest products to meet the requirements of the alarmingly increasing population [17,18,20]. These studies have indicated a considerable increase in the area of cropland at the expense of other LC types. For instance, in Ethiopia’s Central Rift Valley area, cropland has increased at the expense of water, forest, woodlands, and grasslands [21,22,23,24,25]. A reduction in forest, shrubland, and grassland was observed in the Andassa watershed in the Abay basin between 1985 and 2015, mainly as a result of the expansion of cultivated land [26]. Cultivated land expansion was also observed in the hilly–mountainous areas in the central highlands of Ethiopia at the expense of pastureland, forestland, and woodland [27]. There were, however, conflicting accounts of the LCC patterns. For instance, between 1985 and 2015, the Somodo watershed in southwest Ethiopia saw a drop in the area of cultivated land while there was an increase in the extent of grassland [12]. Additionally, grassland and shrubland in Ethiopia’s northern highlands (Gelan sub-watershed) expanded [15].
The processes of LCC are triggered by a combination of anthropogenic and natural drivers [12,13,14,16,17,18,28]. The drivers of LCC can be broadly categorized as biophysical, social, economic, and political factors [18,29,30]. The main drivers of LCC in Ethiopia have been identified as rising human and livestock populations, traditional agricultural practices, unregulated urbanization, ongoing drought, ineffective land use policies or their complete absence, inadequate implementation of the existing policies and strategies, and ineffective land use planning [21,28,31,32,33,34]. The complexity of the drivers of the changes and their effects has not been fully appreciated.
According to existing evidence, Ethiopia has experienced a number of serious environmental issues owing to changes in LC, including soil erosion, land degradation, loss of soil fertility, and deforestation [35]. In terms of natural resource endowment, the Abay basin is the most diverse and significant river basin in Ethiopia and beyond [36,37]. However, these resources are subjected to a variety of stresses [34,38]. Therefore, in order to ensure sustainable development throughout the basin, it is important to have a thorough understanding of the state of the LC, the patterns of the LCC over time, and the rates of change, as well as the drivers and consequences of the changes in the Muger sub-basin, one of the sub-basins of the Abay river basin.
Therefore, the purpose of this study is to investigate the dynamics of the LC in the Muger sub-basin between 1986, 2003, and 2020; to quantify the landscape metrics in time and space for the entire sub-basin to track the changes; and to identify the main factors that are responsible for the LCCs as well as the effects of these changes.

2. Materials and Methods
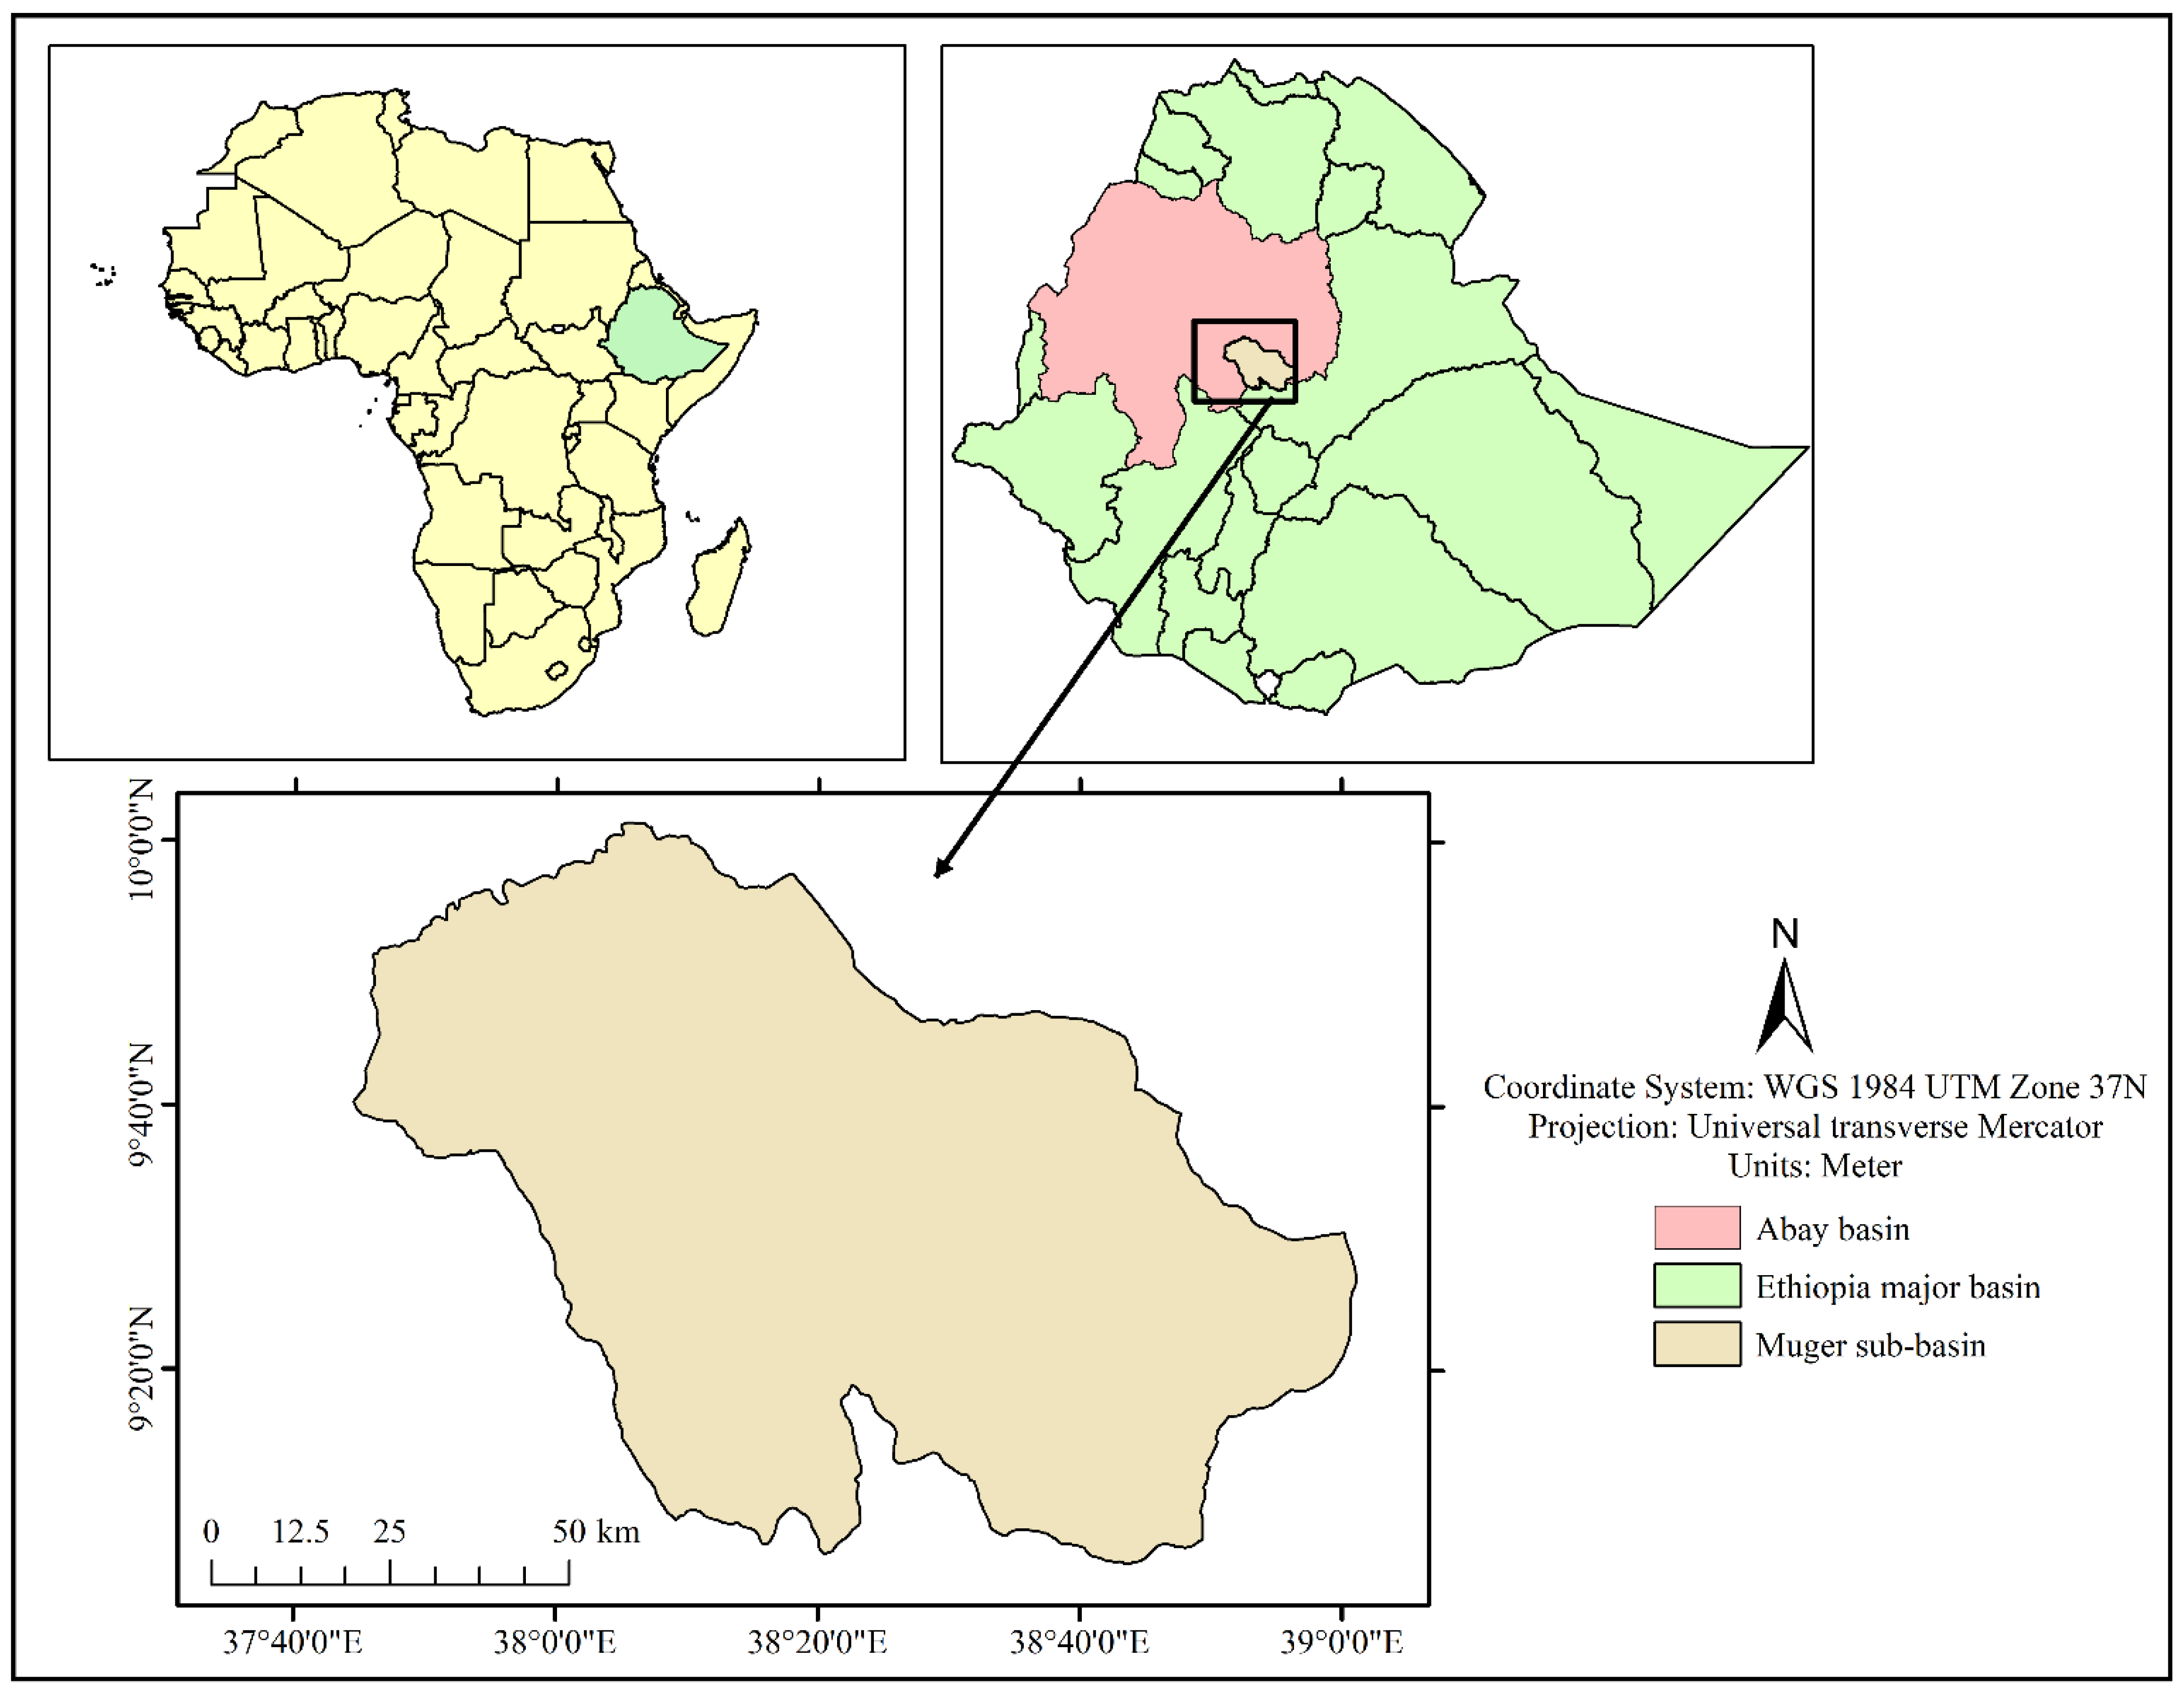
2.1. Study Area

This study was the conducted in the Muger sub-basin in Oromia regional state, Ethiopia. The Muger river flows from the southeast of the basin into the Abay river. Geographically, the study area is located between the 9°05′18.7″ and 10°01′21.7″ N latitudes and between the 37°44′29.77″ and 39°01′06.7″ E longitudes, with an area coverage of 8188 km2 and an altitude ranging from 930 to 3530 m above sea level [39,40]. The spatial details of the study area are shown in Figure 1.

2.2. Data Sources and Analysis Methods

2.2.1. Spatial Data

In this study, three Landsat images of the sub-watershed were taken at various temporal scales, and a DEM with a spatial resolution of 30 m was downloaded from the USGS website (https://earthexplorer.usgs.gov/, accessed on 2 January 2021). The DEM was used to delineate the sub-basin and generate the slope data. Landsat images (i.e., TM Landsat-5 for 1986, ETM+ Landsat-7 for 2003, and OLI-TIRS Landsat-8 for 2020) were used for LCC analysis. All the Landsat images were acquired in January, which corresponds to Ethiopia’s dry season, when there is a clear sky period. During this time, the images have the minimum cloud cover and more similarity in the reflectance values of different LC types across the images taken at different temporal scales. The three periods selected for LCC analysis depended on the availability of the image, the policy changes, and the other environmental factors that had unfolded in the country. With the aid of handheld GPS, the most recent reference data of each land cover type (i.e., those of 2020) were randomly gathered at each sampling point. A digital camera was also employed while conducting fieldwork to take a picture of the surroundings.

2.2.2. Socio-Economic Data

Through a socioeconomic survey, the local community’s knowledge of resource availability and usage, awareness of government decision-making procedures, and views about LCC trends and priorities were evaluated [41]. Key informant interviews (KII) and focus group discussion (FGD) survey techniques were used in this study. Six districts were selected based on the proportion of their area coverage in the sub-basin and their proximity to each other. The selected districts were Wara Jarso, Kuyu, Yaya Gulale, Sululta, Ada Berga, and Meta Robi from the total of seventeen (17) districts in the sub-basin. A group of researchers, including the authors and additional experts in the office of agriculture, carried out the fieldwork. Eighteen FGDs were carried out; i.e., three FGDs for each district of the selected districts in the sub-basin. Six to eight community members participated in each FGD. The management of natural resources, land administration, environmental management, and climate change monitoring were the topics discussed among the 24 KIIs with district- and zonal-level specialists. Each district provided ancillary spatial data.
Both the KII and the FGD questions were constructed with open-ended questions. The questions addressed issues such as their perceptions regarding major shifts in the LC and the relationships among the components of the biophysical environment, institutions, socio-economic activities, and demography. To learn more about the management perspectives, assess the efforts made towards resource management, and identify their challenges, discussions on the practices and regulations that influence land management in their locality were held. The topic of land degradation and the urgency for immediate intervention were also covered. The goal of the discussion and interviews was to gather information on the LCC trends, identify the causes of the changes, and determine how the LCC would affect the long-term socio-economic benefits and environment safety. Farmers were requested to specify which part of the sub-basin had been altered as well as the reasons behind those changes. The effects of such modifications on the farmers’ livelihoods and the environment were also examined. Investigations were also conducted into how the existing socio-economic activities affected LCC.
The analysis of the socio-economic data from the KIIs and FGDs focuses on the historical and current conditions of the LC, the forces driving the change, and the implications of the LCC. A ranking was used to determine the main causes and effects of the changes.

2.3. Land Cover Change Assessment

2.3.1. Image Classification

Image classification is a process of categorizing all pixels from an image into LC classes to extract useful thematic information [42]. In this study, a time series of Landsat images of different sensor characteristics (see Table 1 for the detailed description of each image) were classified. A supervised image classification method was employed in processing the image, using the maximum likelihood classification algorithm, which is the most widely used algorithm for land cover assessment [43,44,45]. This method is theoretically sound and versatile enough to work with different data sources and satellite systems [46]. The supervised classification technique is used in this study because it preserves the basic LC characteristics [47], which are common in the study area based on the training samples of known identity.
The reference data of the land cover types were collected in the field and from high-resolution images such as those of Google Earth. The reference data for the year 2020 were predominantly collected from the field survey. However, those for 1986 and 2003 were collected using a combination of the field survey and digitizing from the high-resolution base maps of Google Earth. Then, for all of the datasets, the data were split into a training set and a validation set. The training dataset was used to train the classification algorithm, while the remaining data were reserved for verifying the classification. In this study, eight separable LC types were considered (see Table 2 for details).
ArcGIS 10.8 was used to run the image classification, mapping, and change detection. As many training samples as possible were collected for each LC class throughout the entire image and used for training the classification algorithm. The minimum number of training samples was 45.

2.3.2. Accuracy Assessment

Accuracy assessment indicates the degree to which the reference LC data are depicted on the classified image. As the entire workflow of the satellite image acquisition, the pre-processing, and the image classification introduce cumulative errors, undertaking an accuracy assessment of the image classification is mandatory. The level of confidence in the results of the image classification and the subsequent change detection are evaluated by accuracy assessment [43]. Therefore, the results of the image classification were compared with the ground truth data for validation. The reference data for 1986 and 2003 came from Google Earth, and they were supplemented by the interpretation of the original Landsat images used for classification and the responses from the KIIs and FGDs. Google Earth and field observation were used to collect the reference data for the 2020 image classification. Random sampling was employed to distribute the sampling sites for collecting the reference data. Handheld GPS was used to determine the location of the sample points. The validation of each classified image employed a minimum of 30 samples per LC class.
The most effective method of accuracy assessment from remotely sensed imagery is a confusion matrix or an error matrix [48]. It provides the measures of overall accuracy, user accuracy, producer accuracy, and kappa statistics, which were calculated using Equations (1)–(4) [49,50]. The classification accuracy is considered adequate if the overall accuracy or kappa coefficient value is more than 70% [51].
  OA = x y × 100  
where OA is the overall accuracy, x is the number of correct samples (i.e., values along the diagonals of the matrix), and y is the total number of samples used for validation.
The kappa coefficient is a measure of the overall agreement of a classification output with the reference data. The peculiar characteristic of this index compared with the overall accuracy is because the kappa coefficient takes the non-diagonal elements into account [52]. The kappa coefficient measures the difference between the actual agreement of the classified map and the expected agreement by chance with the reference data (see Equation (2)).
K ^ = N i = 1 r x i i i = 1 r ( x i + × x + i ) N 2 i = 1 r ( x i + × x + i )
where K ^ is the kappa coefficient, r is the number of rows in the matrix, x i i is the number of observations in row i and column i (i.e., the number of correct classes), x i + are the marginal totals of row i, x + i are the marginal totals of column i, and N is the total number of observations. User accuracy (UA) and producer accuracy (PA) can also be calculated using Equations (3) and (4).
PA = number   of   correctly   classified   samples   for   a   class total   number   of   reference   samples   for   the   same   class
UA = number   of   correctly   classified   samples   for   a   class total   number   of   classified   samples   for   the   same   class

2.3.3. Land Cover Change Analysis

The LC data obtained from the selected consecutive periods were cross-tabulated and compared with each other to examine the patterns of LCC in the sub-basin. To identify the change trends of each LC class, conversion matrices between 1986 and 2003 and those between 2003 and 2020 were developed [34,53,54]. Equation (5) was used to determine the rate of LCC [55,56,57,58].
r = ( 1 t 1 t 2 ) × ln ( A 1 A 2 )
where r is the annual rate of change for each class per year; A 2 and A 1 are the class areas (in hectares) at a later time (2) and earlier time (1), respectively; and 𝑡 is the time interval (in years) between the two periods (1 and 2).
Once the LC classifications were derived, respective LC maps were created for 1986, 2003, and 2020. Then, the areas of the LC classes were calculated and the analysis of the LCC and the rates of the changes were computed. The total LCC between the two periods is calculated as follows:
Total   LC   gain / loss = A   final   year A   initial   year
Percentage   LC   gain / loss = ( A   final   year A   initial   year ) Total   area   of   the   catchement × 100
where A = area of the LC class.
To evaluate the LC inter-category transitions and examine the historical trend of the LC change transaction in the sub-basin, the LCC matrices were created in ArcGIS. Change matrices were constructed for the transitions from 1986 to 2003 and from 2003 to 2020. The areas of gain, loss, and persistence between the LC types were estimated using the matrices. Persistence is the LC class that does not change between the start and end times of the change detection period.
By superimposing the slope computed from the DEM, the link between the terrain slope and the LC was assessed. Next, the spatial raster calculator was used to determine the distribution of LCC in the various slope classes. The analysis of the spatial patterns of LCC along the landscape is helpful in assessing the variability in LCC along the slope gradient.

3. Results

3.1. Accuracy of Image Classification

Table 3 indicates the overall accuracy, the kappa statistics, and the producer’s and user’s accuracy metrics of the image classification at the three temporal resolutions. For the years 1986, 2003, and 2020, the overall classification accuracy was found to be 85.45, 88.51, and 89.39 percent, respectively. The kappa statistics were 0.79, 0.83, and 0.83 for 1986, 2003, and 2020, respectively. Strong agreement was evident throughout all the years according to the kappa coefficient statistics.

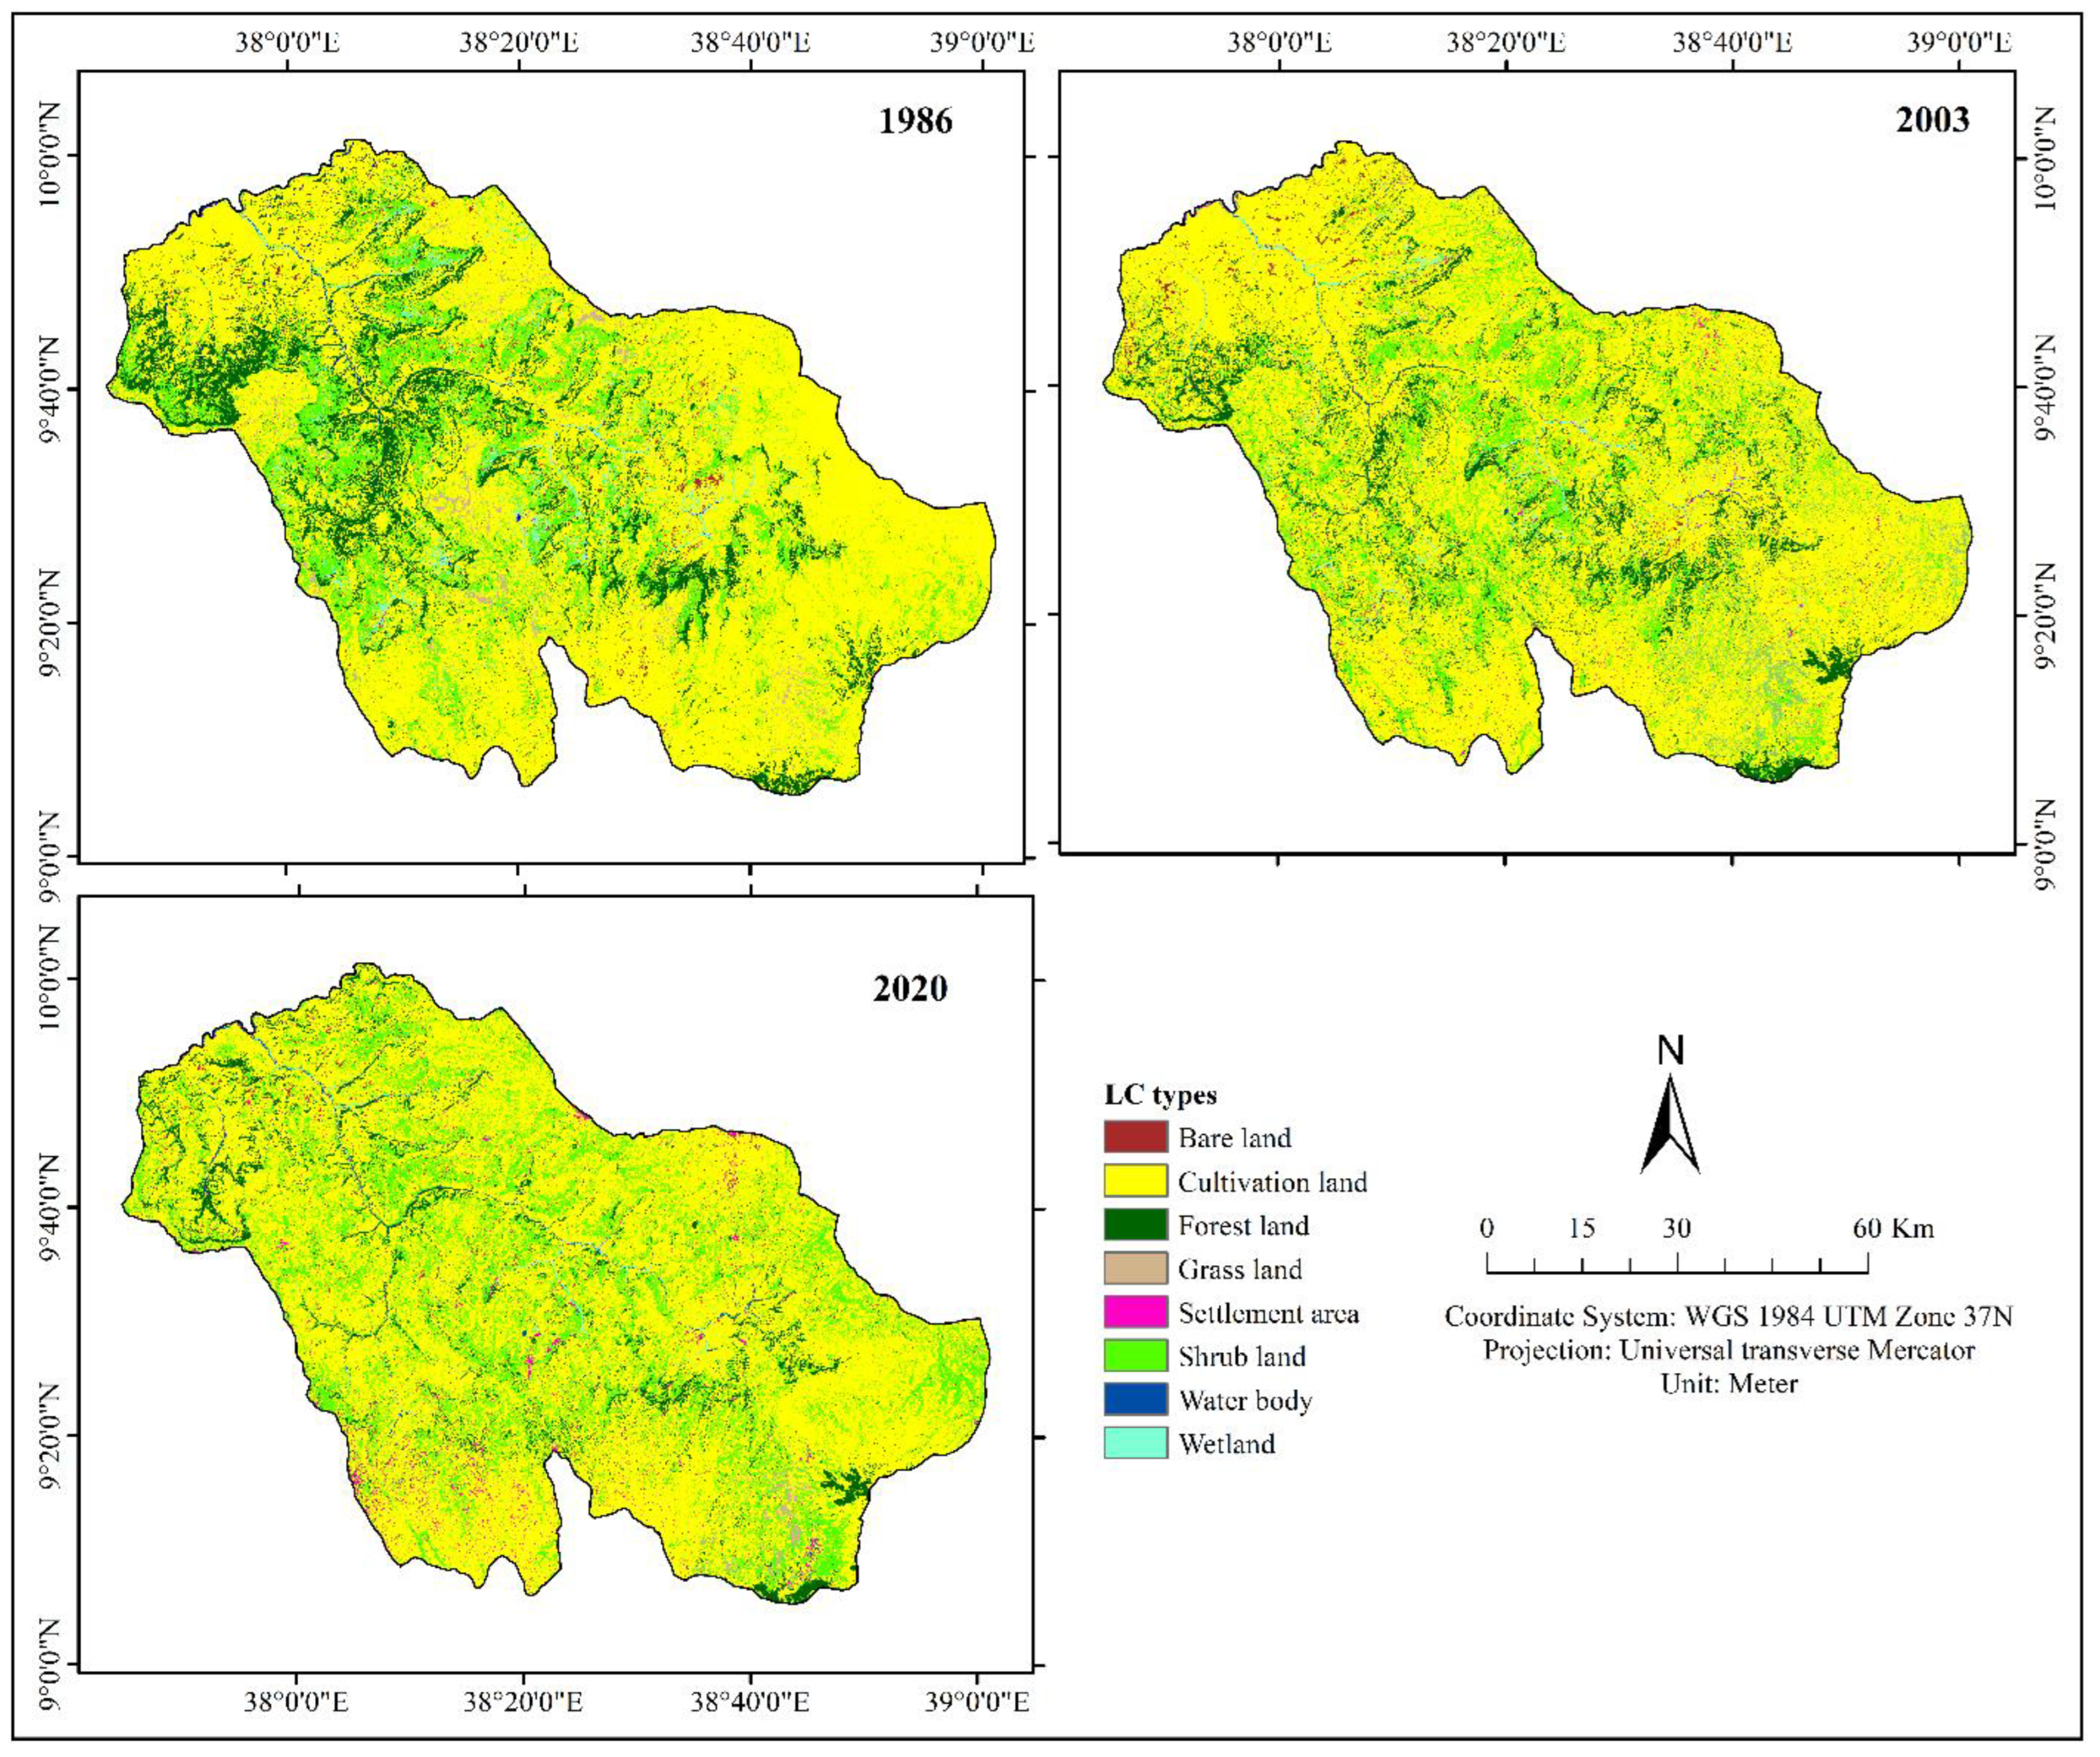
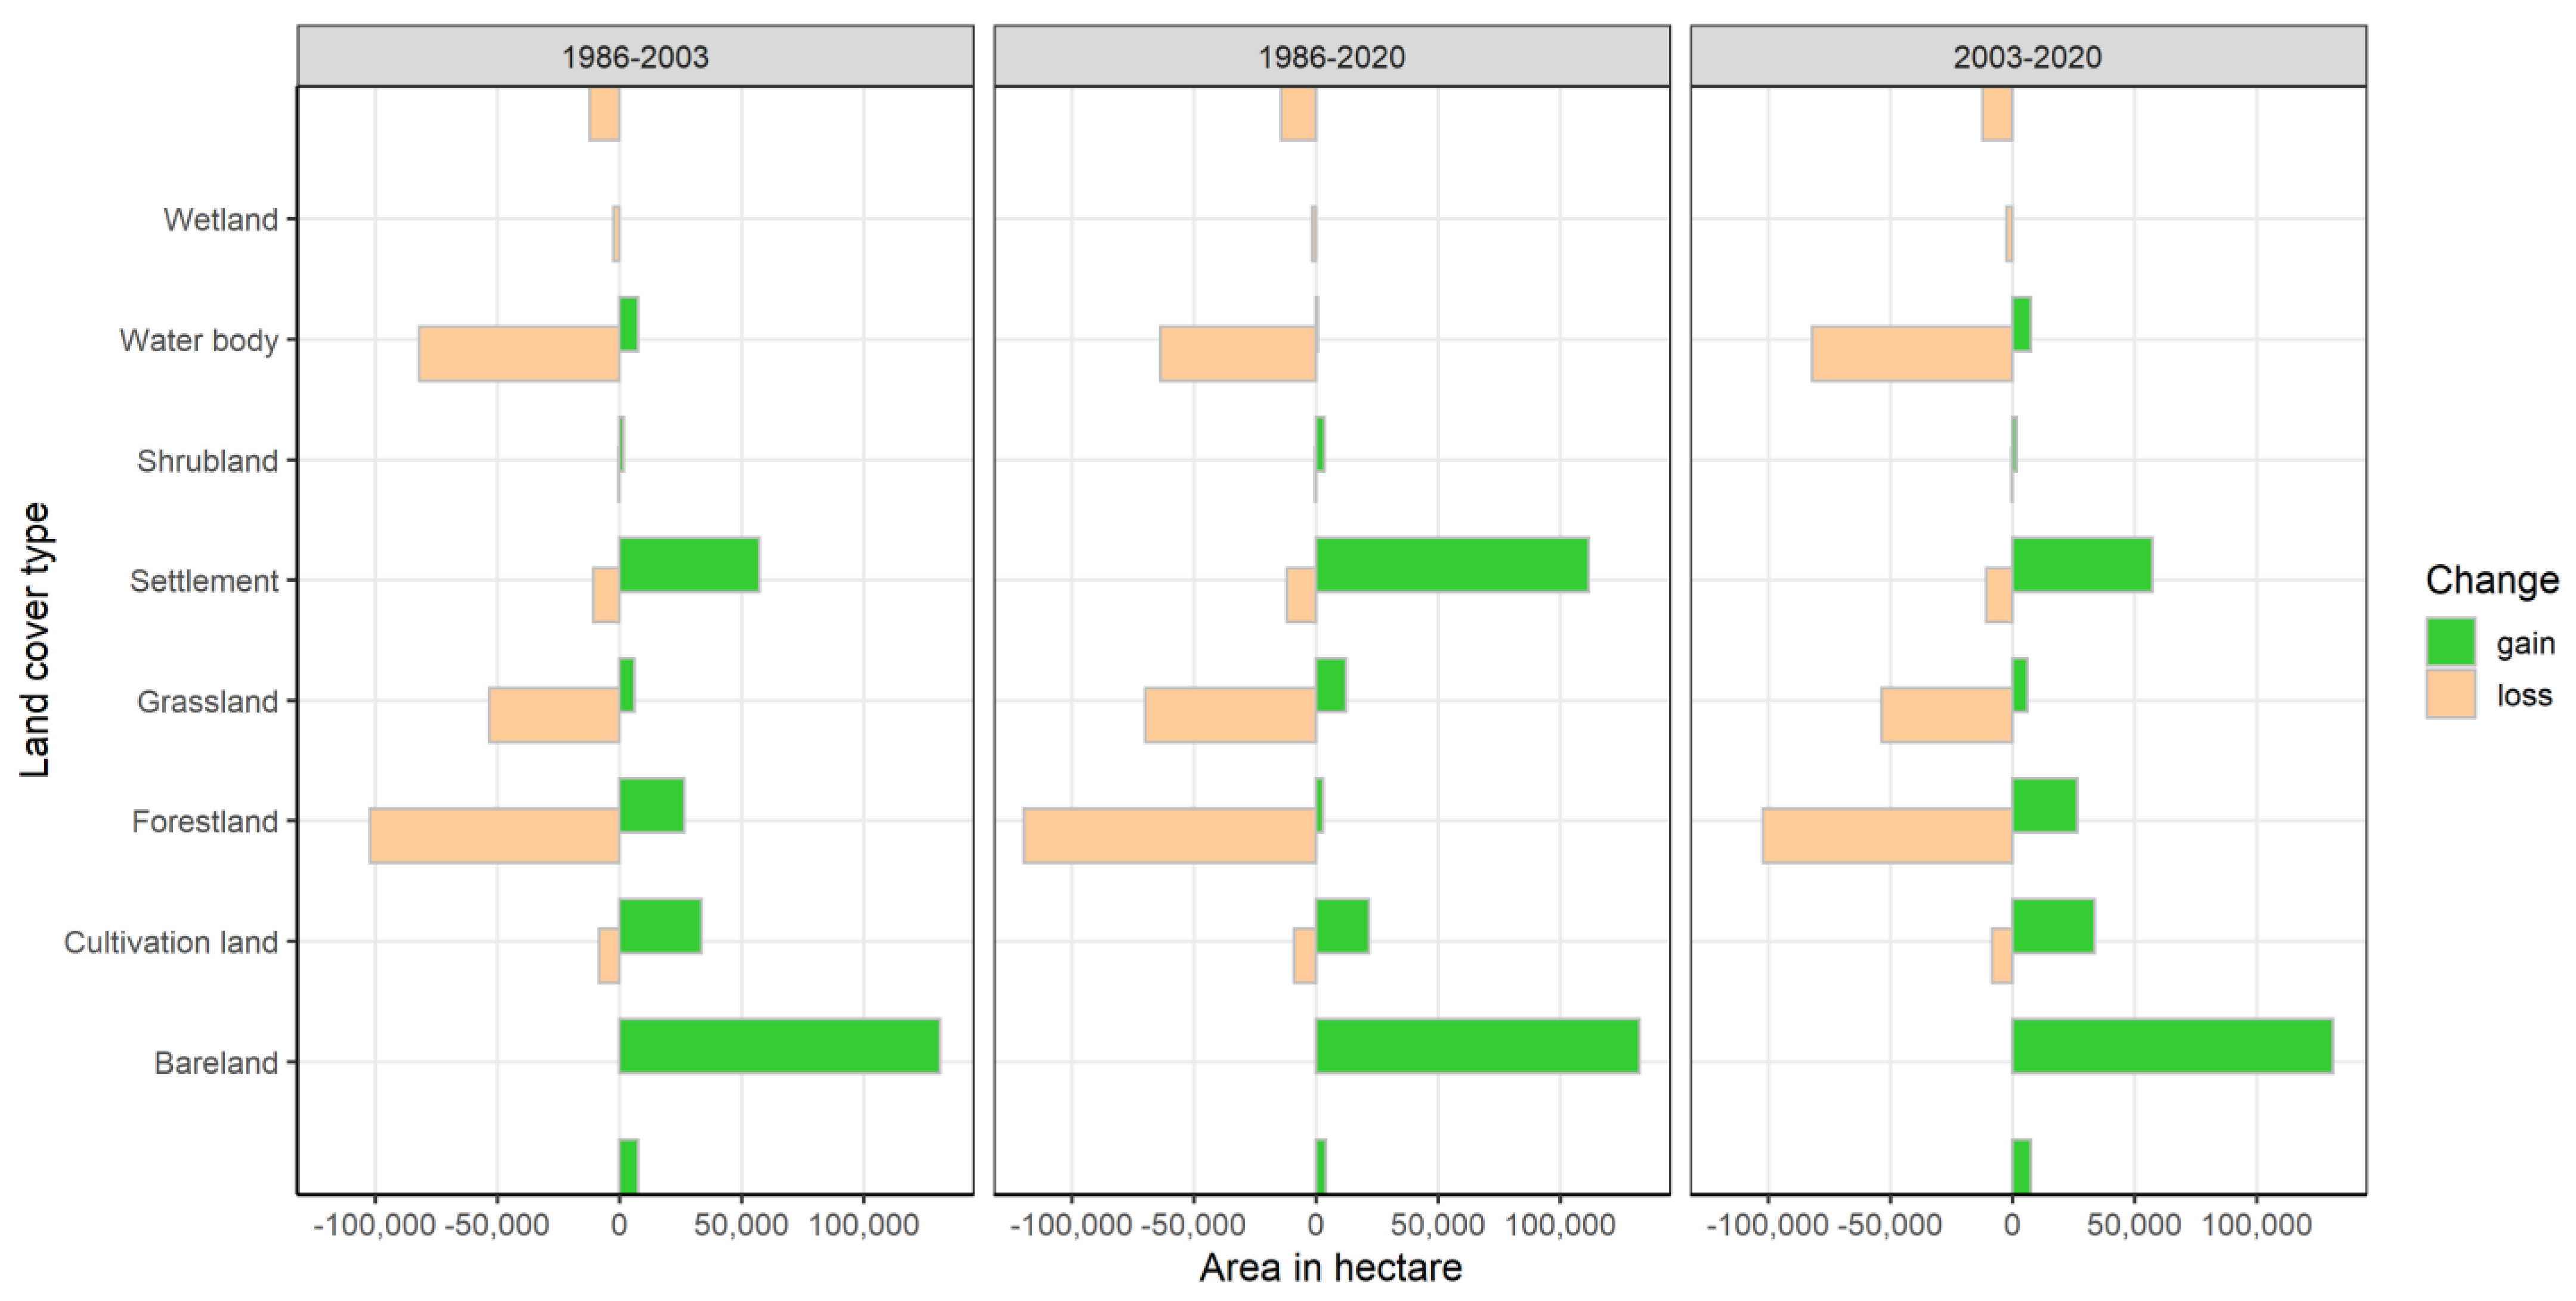
3.2. Spatio-Temporal Distributions of Land Cover Change

Land Cover Change Dynamics

The analysis of the LC patterns in the study sub-basin revealed that over the past three decades the cultivated land and built-up areas have increased at the expense of vegetative cover (Table 4; Figure 2). Cultivated land has been the dominant LC type of the sub-basin over these times, covering 68.86% of the study area in 1986, 72.42% in 2003, and 70.44% in 2020 (Table 4). Similarly, the area coverage of built-up areas, shrubland, and water bodies increased over time (i.e., from 1986 to 2020). Built-up areas as a percentage of the overall study area were 0.03%, 0.76%, and 1.53% in 1986, 2003, and 2020, respectively.
In 1986, shrubland, forestland, wetland, and grazing land accounted for 14.39%, 11.39%, 1.93%, and 1.52% of the sub-basin, respectively. During the period from 1986 to 2003, the areas of shrubland, forestland, and wetland showed the highest reduction, whereas the size of the cultivated land increased. During the latter period (between 2003 and 2020), forestland, grassland, and wetland showed the highest decline. Cultivated land also decreased during the 2003–2020 period. However, the built-up areas kept expanding across both temporal periods. The area coverage of cultivated land, built-up area, and shrubland showed a general increase, whereas that of the forestland, grazing land, and wetland showed a general decline across the study period (Table 4 and Table 5).
The spatio-temporal distribution of LC across the topographic gradient in the Muger sub-basin is presented in Figure 2. From Figure 2, it can be seen that the cultivated and grazing land expanded towards the highland areas of the sub-basin. Obviously, most of the additions to the water bodies followed the routes of the tributaries of the Muger River.

3.3. Land Cover Transition Matrix

The results of the LCC analysis of the Muger sub-basin showed that the study area experienced intricate LC transitions. Then, the net gain in area of each land cover type was developed for the three regimes, i.e., 1986–2003, 2003–2020, and 1986–2020 (Figure 3). This matrix is useful for indicating the directions of change, i.e., the area gain, loss, and persistence among the LC types. During the entire study period (1986–2020), 444,264.66 ha (54.26%) of the cultivated land remained unchanged, followed by the shrubland at 54,051.3 (6.60%), and the forestland at 26,568.09 (3.24%). The majority of the LCC is attributed to the conversion of shrubland to cultivation at 86,677.38 ha (10.59%), followed by cultivation land to shrubland at 56,473.38 ha (6.90%) and forestland at 52,743.24 ha (6.44%). A significant amount of the cultivated land was also converted to built-up areas (7244.91 ha) and barren land (2960.01 ha), while most of the barren land was converted to forest (2803.86 ha) and cultivated land (2162.61 ha). Even though the built-up areas did not change much, an estimated 8732.43 ha was gained from cultivated land (Figure 3).
Regarding the net persistence, the built-up areas showed the highest net change to persistence ratio during all the study periods (i.e., 1986–2003, 2003–2020, and 1986–2020). A high net change to persistence ratio implies a low persisting class of the LCC matrix. The lowest persisting LC class in the Muger sub-basin was the built-up area followed by the grassland for the 1986–2003 period, whereas the cultivated land and shrubland showed the highest persisting LC classes (Table 6). During the 2003–2020 period, the built-up areas and the water bodies were the lowest persisting LC classes, while the shrubland and cultivated land were the highest persisting LC classes. During the overall study period (i.e., 1986–2020), the built-up area and the grassland were the lowest persisting LC classes, while the shrubland and the cultivated land were the highest persisting LC classes. Generally, the cultivated land and the shrubland exhibited the highest persistence of change.
The results in Table 4 and Table 5 indicate that the landscape was dominantly covered with cropland (69% of the study area) in 1986. There was also remarkable cover of shrubland and forestland, accounting for approximately 14% and 12% of the land area. There was a small size of built-up area (0.03%) in 1986. The results of the area gain and loss of LC classes during the period between 1986 and 2003 indicate that there have been tremendous swaps (Table 4). Only 66.8% of the area did not undergo conversion during the time between 1986 and 2003 (Table 6). A net gain in area was observed for cropland, grassland, and built-up area, while other the LC types in the sub-basin experienced a net loss in area. The expansion of the built-up areas was a remarkable change observed during this period. This has happened at the expense of almost all the other LC classes (mainly water body, wetland, shrubland, cropland, and forestland).
Because of the observed changes during the 1986–2003 period, the share of cropland cover in 2003 was higher than it was in 1986, accounting for more than 72% of the sub-basin. However, a decline in cropland cover was observed during the regime between 2003 and 2020. The loss was mainly accounted for by the increase in shrubland, forestland, and grassland, respectively. Despite a shift of LC from cropland to forests, there was a net deforestation in the sub-basin during this period (i.e., 2003–2020). The loss of forestland appears to be related to a conversion to cropland and shrubland in some parts of the landscape. This demonstrates the amount of swap of the LC classes. The result of the change detection has also revealed that the built-up areas doubled in area from 2003 to 2020. The conversion from the cropland, shrubland, and forestland classes contributed to most of the increase in the area of built-up areas.
The synthesis of the results of the wider temporal regime (i.e., from 1986 to 2020) indicated the general trend of LCC in the sub-basin. There has been a continuous decline in bare land, forestland, and wetland over the study period. The negative values of the net change and net change to persistence ratio for the mentioned LC types indicated this pattern of change. On the other hand, there were general increases in the cropland, water bodies, and built-up areas. The expansion of the built-up areas was continuous over the time intervals, indicating that the built-up areas have a more permanent effect on land management practices. The built-up areas had a larger magnitude of net change to persistence ratio as the observed changes stemmed from a small area at the beginning of the change detection period and kept expanding.

3.4. The Effect of Slope on LCC

In this study, LC was reclassified into seven slope categories, such as 0–2% gently undulating, 2–5% undulating slope, 5–8% gently rolling, 8–15% moderately rolling, 15–30% strongly rolling, 30–60% hilly slope, and greater than 60% steep slope [56,59]. The growing demand for agricultural land use brought about changes in LC, especially in sites with steep slopes. In 1986, a large part of the cultivated land (44.2%) was located on gentle slopes (0% to 2%), followed by a more undulating slope (2% to 5%), and was covered with crops. In 1986, the areas covered with forestland dominated the strongly rolling slopes (15% to 30%), followed by the hilly slope class (30% to 60%). However, in 2020 the remnant forestland existed in the hilly slope class (30% to 60%), followed by a strongly rolling slope class. The expansion of cultivated land, the growth of the built-up areas, the conversion to shrubland, and the increased water bodies on the lower slopes have played a significant role in the shift in dominance of the forest cover from the strongly rolling to the hilly slopes. The maximum rate of cultivated land expansion occurred during the study period (1986 to 2020) on slope classes of strongly rolling to extremely mountainous terrain. The amount of forestland declined in all slope ranges, with gently undulating to moderately rolling slopes losing forests at the fastest pace. Similarly, in all the slope classes, the area of wetland shrank.
From 1986 to 2020, the built-up areas expanded in all slope ranges, with the biggest increment on the gently undulating slopes. Grazing land increased only in the slope ranges of 0–5% (i.e., the gently undulating and undulating slope classes). The surface area of the water bodies increased in all the slope ranges except in the higher slope classes. As expected, the highest increase in the area of water bodies was shown on slope ranges of 0–2%. In contrast to the water bodies, the grassland decreased in all slope ranges except on very hilly slope areas. The maximum decline in the area of water bodies happened in the hilly slope class and that of the grassland was observed in the slope ranging from 8 to 15%. The spatial distribution of LCC between 1986 and 2020 against the slope classes is given in Table 7.

3.5. Major Drivers of LCC

LCC is the result of a combination of different causative factors. The results of the FGDs, KIIs, and field observations revealed that both anthropogenic and natural processes contributed to the observed LCC in the study area. However, anthropogenic activities are the more influential factors contributing to LCC, as compared to the natural processes. From a range of different drivers of LCC, the respondents perceived ten of them in the study area (Table 8). The ranks were derived based on how often the variables were mentioned by the respondents. Consequently, the main drivers of LCC in the study area were cultivated land expansion (17.42%), population growth (16.52%), wood extraction (14.02%), expansion of built-up areas (12.65%), and infrastructure development (10.08%).
According to the results from the KIIs and FGDs, the underlying causes of LCC in the study area are the complex socio-economic, institutional, biophysical, demographic, and technological factors (Table 9). High population growth was perceived as the major driver from the demographic factor causing LCC in the study areas (Table 8). According to the 2007 Population and Housing Census of Ethiopia, the total population of the sub-basin districts was 1,827,639 [60]. The population was also projected to be 2,202,756 in 2014, 2,381,946 in 2017, and 2,523,089 in 2020 [61]. According to the information from the KIIs and FGDs, resettlement, immigration, and natural population growth were identified as the causes of the population increase in the sub-basin.
The results of the KIIs and FGDs showed that the attention given by the government to building cement factories, to infrastructure development, and to the expansion of the built-up areas was among the major socio-economic and institutional causes of LCC in the sub-basin.

4. Discussion

4.1. Land Cover Change Dynamics

The results of the post-classification comparison satellite images of 1986, 2003, and 2020 revealed the extent of the LCCs in the Muger sub-basin in the study periods. It showed dramatic changes in LC from one cover type to the other (Table 3; Figure 2). Cultivated land, shrubland, and forestland were the major LC classes that altogether account for more than 93% of the total land in all the three time intervals. However, there has been a general increase in the area coverage of cultivated land and built-up areas, while there has been shrinkage of the forestland and shrubland. The construction of different cement factories, such as Ethio cement PLC, the Derba MIDROC cement plant, Dangote Cement, Abyssinia Cement PLC, CH clinker manufacturing PLC, Inchini Bedrock cement PLC, and the Muger cement factory, was one of the main contributing factors to the observed LCC. A similar study conducted in the Abay basin revealed that the cultivated land expanded at the expense of the forestland, shrubland, and grassland [62,63]. This finding was also consistent with other research reports elsewhere in Ethiopia [14,16,23,24,64,65,66].
The change matrix shows that most of the loss of forestland over the entire period resulted from the expansion of the cultivated land. In addition, the gain in cultivated land and the objectives of the clearing of the forests, which were attributed to charcoal making, timber extraction, and continuous fuelwood extraction, could be the reasons for the loss of forest resources. A historical account from a 70-year-old respondent revealed that before 1986, the lowland areas of the sub-basin (i.e., the Muger valley) had been covered with forests, woodlands, and rangeland. He mentioned that through time, in this valley, there had been diminishing of not only the coverage but also the quality of the forest (i.e., a decline in the vegetation composition, especially in indigenous tree species such as Hagenia abyssinica, Juniperus procera, Podocarpus falcatus and Acacia abyssinica). Other studies conducted in different parts of the Abay basin in Ethiopia reported similar findings. The findings of this study were comparable with those, for example, in the Gumera and Gelan watersheds of the Abay basin [15,16] and in western Ethiopia [13].
The change matrix developed to assess inter-category transitions and the change trajectories highlight the dominant dynamic events and internal conversions between the LC classes. The highest net change to persistence ratio observed for some of the LC classes implies the lowest persisting LC class. The built-up areas showed the highest ratio of the net change to persistence, whereas cultivated land showed the lowest net change to persistence ratio in the broader (i.e., 1986–2020) transition. The expansion rate of the built-up areas increased, with the highest rate in recent years. The increments were due to the expansion and construction of development infrastructures such as roads, buildings of public service institutions, factories, and residential buildings.
The expansion of built-up areas, the loss of forests, and the shrinkage of water bodies such as rivers and wetlands manifested in the results of the image analysis were perceived by members of the local community, as indicated in the FGDs and KIIs. We also observed the escalating demand for agricultural and residential land in recent years. A similar trend has also been observed in other areas of the Abay basin, for example in the Gelda catchment [67] and the Andassa watershed [68]. The findings of this study were also in line with those of [69], who reported a rapid urban growth in the major cities of Ethiopia between 1987 and 2017. Unplanned urban expansion among the zonal, regional, and the capital cities of Ethiopia was the main driver for the conversion of rural landscapes to urban landscapes [17].
Migration from rural areas to urban centers also contributed to urban expansion in the Muger sub-basin. For example, the total population of urban inhabitants in the Muger sub-basin districts was 119,583 in 2007 [60]. According to the CSA projection, the population of urban inhabitants reached 376,312 within a decade in 2017 and 438,521 in 2020 [61]. According to the survey results, migration at an individual or household level was caused by three main factors. The three main causes of the local migration of the rural farmers, as reported in the KIIs and FGDs, were lack or shortage of farmland, limited access to public infrastructure, and the need to engage in petty trades and urban employment. Elders own most of the existing farmlands, and the youth have no farmlands unless they inherit from their families, which forces them to migrate to urban areas in search for job opportunities. Due to a higher rate of rural poverty and very few employment opportunities in the rural centers to absorb the rural labor, population growth is often correlated with LCC in Ethiopia [70]. Likewise, the lack of access to public infrastructure, such as electricity and potable water in rural areas, has forced households to move to urban areas. Relatively wealthier farmers were also motivated to engage in petty trade and other businesses in urban areas.
Forest cover decline and unregulated urban growth were also reported in other studies in Africa and beyond. For example, the size of the built-up areas increased by about tenfold at the expense of grasslands, shrublands, and woodlands in the Central Rift Valley of Ethiopia between 1973 and 2014 [71]. A similar pattern of LCC in the Central Rift Valley of Ethiopia was reported by [24]. A significant decline of shrubland and an increase in built-up areas were also witnessed in Botswana between 1984 and 2015 [72]. The increase in the area coverage of built-up areas and the reduction in forestland and fresh water were also reported in the Upper Shire River Catchment of Malawi [73]. An increase in the built-up areas at the expense of forestland was reported in northern Mozambique [74]. The study on land use change and the climate of East Africa reported that landscapes covered with agricultural crops increased and production systems were more intensified, while forestland decreased between 1986 and 2000 [75].

4.2. Drivers of Land Cover Change

Although both natural and anthropogenic factors were described as the drivers of LCC in the catchment area, anthropogenic causes were identified as the most common and immediate drivers of the observed changes. The natural resource utilization pattern of the local community aggravated the natural processes through deforestation and unsustainable agricultural practices. Such human-induced pressures on the natural ecosystems have widespread coverage across Ethiopia. Thus, they significantly contribute to most of the LCCs in the country. A study conducted in southeastern Ethiopia indicated that anthropogenic factors were the main causes of LCC [70]. In a country where there is unabated population growth and escalating poverty, the human impact on the natural resources is undoubtedly immense. A study conducted on a related topic in Ethiopia showed that the effects of anthropogenic factors were more pronounced than the natural processes over a small area within a short period [67]. The results of this study are in line with various studies, which have identified that the drivers of LCC are attributed to technological, economic, demographic, political, institutional, and cultural factors [30].
The findings of the FGDs and KIIs indicated that the local community understood the impacts of cultivated land expansion, population growth, wood extraction, the expansion of built-up areas, and infrastructure development in changing the LC of their surroundings. Population growth increases the demands for more cultivated land, fuel wood, charcoal, and infrastructural development, which leads to loss of the vegetative cover. Some of the main factors influencing the observed LCC in the Muger sub-basin include population increase, migration, changes in government policy, and/or regime change. These drivers of LCC have often been mentioned in many parts of the country as well. Hence, the boost in the human population is the main cause of LCC in the study sub-basin. Population increase was a contributing factor to LCC in the Chemoga watershed of Ethiopia’s northwestern highland [76], the Dendi district [77], the Dera district [78], and the Geleda catchment [67], to name a few. In other parts of the world as well, population increase was cited as the primary cause of LCCs [79,80].
In the study area, these drivers of LCC were triggered by the high level of poverty, unreliable rainfall, the unaffordable cost of agricultural inputs, limited access to alternative energy supplies, and insufficient law enforcement by the government. Existing experiences indicate that LCC is driven by various intermingling factors, such as urban expansion, cultivated land expansion, population growth, biophysical factors, climate change, and land policy [65]. The results of the survey also confirmed that the expansion of built-up areas, overgrazing, the absence of land use policy, and the lack of access to appropriate agricultural technologies contributed to LCC. A study conducted in Munessa-Shashemene in the Central Rift Valley of Ethiopia reported that poorly implemented social, economic, and environmental policies and limitations in the use of technologies in the agriculture sector contributed to LCC [28].
The expansion of the cement factory and flower farm projects and the associated infrastructure development have displaced the rural communities from their farmlands and forced them to resettle in other places. The displacement has been implemented without adequate compensation. The intensified resettlement on agricultural productive lands, coupled with the decline in productivity of the land for crop production made it difficult for rural households to remain in their localities, forcing them to move to urban areas. Furthermore, the lack or limited availability of rural jobs for the youth and the emerging urban development in the catchment amplified the socio-economic activities, which contributed to LCC. Discussion with the community representatives and the field observations also confirmed that cultivated lands are still expanding in the steep slope areas. Farmers living on the highlands cultivated small parcels of land situated either on the steep slope or on flood-prone areas. A similar study showed that the construction of dams in the Finchaa catchment has taken over many farms; many farmers have lost their land and are left with nothing [81].
The adverse impacts of LCC were associated with the underlying factors related to human activities. Some of the observed consequences of LCC in the basin included severe soil erosion and land degradation in the high lands and sedimentation in the lakes, rivers, and dams in the lowlands. Similar effects were observed in the highlands of Ethiopia [76,82]. Such effects happened because of the prevalence of unregulated agricultural expansion and settlements at the expense of the natural environment. A reduction in the cover of shrubland, forestland, and natural grassland plays a significant role in modifying the characteristics of the surface hydrology and soil erosion processes in the highlands and the sediment flow in the low altitude landscapes [83]. The LCC in this sub-basin has consequences for the larger Abay basin in which the grand Ethiopian renaissance dam is located. The sediment load from this sub-basin will shorten the lifetime of this huge dam unless every part of the upper catchment area is properly managed. For instance, the expanding cultivated land on the steep slopes, implemented without using suitable land management techniques, may make the area more susceptible to erosion and sedimentation in the catchment’s water bodies. A similar study also reported that LCC has a strong potential to lower the crop productivity of subsistence agriculture [15].

5. Conclusions

This study assessed LCC using multi-temporal remotely sensed images in the Muger sub-basin from 1986 to 2020. FGDs and KIIs were used to identify the main drivers of the observed LCCs in the sub-basin. Over the course of the study period, there was a decrease in the areas of bare land (0.58%), forestlands (5.88%), grasslands (1.11%), and wetlands (1.62%), while there was an increase in the areas of cultivated land (1.59%), urban areas (1.5%), shrubland (5.88%), and water bodies (0.23%). Cultivated land and shrubland showed the highest persistence of change during the study period. The spatial distribution of LCC across the slope classes showed a continuous increase in the area coverage of cultivated land and built-up areas and a decrease in forestlands, grasslands, and wetlands.
The increase in the human population, agricultural land expansion, wood extraction, expansion of built-up areas, and infrastructure development were identified as the main causes of LCC. The decline in crop productivity and animal production, biodiversity loss and habitat destruction, land and soil degradation, water scarcity, and protracted aridity and drought are the major impacts of the LCC perceived in the area. Careful planning and informed intervention are required to reduce human pressure on the natural resources found in the sloppy areas. Sustainable watershed management interventions are required to ameliorate both the living conditions of the local community and the conservation of the natural resources in the sub-basin.
The study of LCC, the assessment of the causative factors, and the description of the impacts presented in this study could help decision makers by providing information that supports integrated basin management. This study suggests that special attention should be given to rehabilitating the degraded lands and protecting the remnant natural resources in the sub-basin. We recommend that collaboration among potential partners, coordinated planning, and informed decision making for the rehabilitation of the degraded lands will ensure the reduction in the undesirable effects of the complex environmental challenges arising from LCC in the basin.

Author Contributions

Conceptualization, D.S.T., T.T., and S.Y.; methodology, D.S.T.; software, D.S.T. and M.K.; validation, D.S.T., H.T., T.T., M.K., and S.Y.; formal analysis, D.S.T.; investigation, D.S.T.; resources, H.T., T.T., M.K. and S.Y.; writing—original draft preparation, D.S.T.; writing—review and editing D.S.T., H.T., T.T., M.K. and S.Y.; supervision, S.Y.; funding acquisition, S.Y. All authors have read and agreed to the published version of the manuscript.

Funding

The Ministry of Science and Technology (MOST) of China supported this work (grant number: 2017YFD0300400).

Institutional Review Board Statement

Not applicable.

Informed Consent Statement

Not applicable.

Data Availability Statement

The data used in this study can be made available by the authors on reasonable request.

Acknowledgments

The authors acknowledge the Ministry of Science and Technology (MOST) of China for financial support. We are also grateful to Bako Agricultural Research Centre (BARC) for the logistic support during data collection. The authors would like to thank the Ethiopian Ministry of Water, Irrigation and Energy (MoWIE) for providing data. We are also very grateful to the local community who participated in the study and the administrative officers for their willingness to provide information and for the support during data collection.

Conflicts of Interest

The authors declare that there are no conflict of interest regarding the publication of this paper.

References

  1. Watson, R.T.; Noble, I.R.; Bolin, B.; Ravindranath, N.; Verardo, D.J.; Dokken, D.J. Land Use, Land-Use Change and Forestry: A Special Report of the Intergovernmental Panel on Climate Change; Cambridge University Press: Cambridge, UK, 2000. [Google Scholar]
  2. Mariye, M.; Mariyo, M.; Changming, Y.; Teffera, Z.L.; Weldegebrial, B. Effects of land use and land cover change on soil erosion potential in Berhe district: A case study of Legedadi watershed, Ethiopia. Int. J. River Basin Manag. 2020, 20, 79–91. [Google Scholar] [CrossRef]
  3. Foley, J.A.; DeFries, R.; Asner, G.P.; Barford, C.; Bonan, G.; Carpenter, S.R.; Chapin, F.S.; Coe, M.T.; Daily, G.C.; Gibbs, H.K. Global consequences of land use. Science 2005, 309, 570–574. [Google Scholar] [CrossRef]
  4. Oliver, T.H.; Morecroft, M.D. Interactions between climate change and land use change on biodiversity: Attribution problems, risks, and opportunities. Wiley Interdiscip. Rev. Clim. Chang. 2014, 5, 317–335. [Google Scholar] [CrossRef]
  5. Msofe, N.K.; Sheng, L.; Lyimo, J. Land use change trends and their driving forces in the Kilombero Valley Floodplain, Southeastern Tanzania. Sustainability 2019, 11, 505. [Google Scholar] [CrossRef]
  6. Lin, X.; Xu, M.; Cao, C.; P Singh, R.; Chen, W.; Ju, H. Land-use/land-cover changes and their influence on the ecosystem in Chengdu City, China during the period of 1992–2018. Sustainability 2018, 10, 3580. [Google Scholar] [CrossRef]
  7. Turner, B.; Meyfroidt, P.; Kuemmerle, T.; Müller, D.; Roy Chowdhury, R. Framing the search for a theory of land use. J. Land Use Sci. 2020, 15, 489–508. [Google Scholar] [CrossRef]
  8. Mmbaga, N.E.; Munishi, L.K.; Treydte, A.C. How dynamics and drivers of land use/land cover change impact elephant conservation and agricultural livelihood development in Rombo, Tanzania. J. Land Use Sci. 2017, 12, 168–181. [Google Scholar] [CrossRef]
  9. Pérez-Vega, A.; Mas, J.-F.; Ligmann-Zielinska, A. Comparing two approaches to land use/cover change modeling and their implications for the assessment of biodiversity loss in a deciduous tropical forest. Environ. Model. Softw. 2012, 29, 11–23. [Google Scholar] [CrossRef]
  10. Kolb, M.; Mas, J.-F.; Galicia, L. Evaluating drivers of land-use change and transition potential models in a complex landscape in Southern Mexico. Int. J. Geogr. Inf. Sci. 2013, 27, 1804–1827. [Google Scholar] [CrossRef]
  11. FAO. Climate Change and Food Security: Risks and Responses; Food & Agriculture Organization: Rome, Italy, 2015. [Google Scholar]
  12. Alemayehu, F.; Tolera, M.; Tesfaye, G. Land use land cover change trend and its drivers in somodo watershed south western, Ethiopia. Afr. J. Agric. Res. 2019, 14, 102–117. [Google Scholar]
  13. Betru, T.; Tolera, M.; Sahle, K.; Kassa, H. Trends and drivers of land use/land cover change in Western Ethiopia. Appl. Geogr. 2019, 104, 83–93. [Google Scholar] [CrossRef]
  14. Degife, A.; Worku, H.; Gizaw, S.; Legesse, A. Land use land cover dynamics, its drivers and environmental implications in Lake Hawassa Watershed of Ethiopia. Remote Sens. Appl. Soc. Environ. 2019, 14, 178–190. [Google Scholar] [CrossRef]
  15. Miheretu, B.A.; Yimer, A.A. Land use/land cover changes and their environmental implications in the Gelana sub-watershed of Northern highlands of Ethiopia. Environ. Syst. Res. 2018, 6, 7. [Google Scholar] [CrossRef]
  16. Wubie, M.A.; Assen, M.; Nicolau, M.D. Patterns, causes and consequences of land use/cover dynamics in the Gumara watershed of lake Tana basin, Northwestern Ethiopia. Environ. Syst. Res. 2016, 5, 8. [Google Scholar] [CrossRef]
  17. Muke, M. Reported driving factors of land-use/cover changes and its mounting consequences in Ethiopia: A Review. Afr. J. Environ. Sci. Technol. 2019, 13, 273–280. [Google Scholar]
  18. Gessesse, B.; Bewket, W. Drivers and implications of land use and land cover change in the central highlands of Ethiopia: Evidence from remote sensing and socio-demographic data integration. Ethiop. J. Soc. Sci. Humanit. 2014, 10, 1–23. [Google Scholar]
  19. Ayele, G.T.; Tebeje, A.K.; Demissie, S.S.; Belete, M.A.; Jemberrie, M.A.; Teshome, W.M.; Mengistu, D.T.; Teshale, E.Z. Time series land cover mapping and change detection analysis using geographic information system and remote sensing, Northern Ethiopia. Air Soil Water Res. 2018, 11, 1178622117751603. [Google Scholar] [CrossRef]
  20. Getachew, H.E.; Melesse, A.M. The impact of land use change on the hydrology of the Angereb Watershed, Ethiopia. Int. J. Water Sci. 2012, 1, 1–7. [Google Scholar] [CrossRef]
  21. Ariti, A.T.; van Vliet, J.; Verburg, P.H. Land-use and land-cover changes in the Central Rift Valley of Ethiopia: Assessment of perception and adaptation of stakeholders. Appl. Geogr. 2015, 65, 28–37. [Google Scholar] [CrossRef]
  22. Garedew, E.; Sandewall, M.; Söderberg, U.; Campbell, B.M. Land-use and land-cover dynamics in the central rift valley of Ethiopia. Environ. Manag. 2009, 44, 683–694. [Google Scholar] [CrossRef]
  23. Mekonnen, Z.; Berie, H.T.; Woldeamanuel, T.; Asfaw, Z.; Kassa, H. Land use and land cover changes and the link to land degradation in Arsi Negele district, Central Rift Valley, Ethiopia. Remote Sens. Appl. Soc. Environ. 2018, 12, 1–9. [Google Scholar] [CrossRef]
  24. Mesfin, D.; Simane, B.; Belay, A.; Recha, J.W.; Taddese, H. Woodland cover change in the Central Rift Valley of Ethiopia. Forests 2020, 11, 916. [Google Scholar] [CrossRef]
  25. Ayele, G.T.; Seka, A.M.; Taddese, H.; Jemberrie, M.A.; Ndehedehe, C.E.; Demissie, S.S.; Awange, J.L.; Jeong, J.; Hamilton, D.P.; Melesse, A.M. Relationship of Attributes of Soil and Topography with Land Cover Change in the Rift Valley Basin of Ethiopia. Remote Sens. 2022, 14, 3257. [Google Scholar] [CrossRef]
  26. Gashaw, T.; Tulu, T.; Argaw, M.; Worqlul, A.W. Evaluation and prediction of land use/land cover changes in the Andassa watershed, Blue Nile Basin, Ethiopia. Environ. Syst. Res. 2017, 6, 17. [Google Scholar] [CrossRef]
  27. Minta, M.; Kibret, K.; Thorne, P.; Nigussie, T.; Nigatu, L. Land use and land cover dynamics in Dendi-Jeldu hilly-mountainous areas in the central Ethiopian highlands. Geoderma 2018, 314, 27–36. [Google Scholar] [CrossRef]
  28. Kindu, M.; Schneider, T.; Teketay, D.; Knoke, T. Drivers of land use/land cover changes in Munessa-Shashemene landscape of the south-central highlands of Ethiopia. Environ. Monit. Assess. 2015, 187, 452. [Google Scholar] [CrossRef]
  29. Lambin, E.F.; Geist, H.J.; Lepers, E. Dynamics of land-use and land-cover change in tropical regions. Annu. Rev. Environ. Resour. 2003, 28, 205–241. [Google Scholar] [CrossRef]
  30. Geist, H.; McConnell, W.; Lambin, E.F.; Moran, E.; Alves, D.; Rudel, T. Causes and trajectories of land-use/cover change. In Land-Use and Land-Cover Change; Springer: Berlin/Heidelberg, Germany, 2006; pp. 41–70. [Google Scholar]
  31. Muluneh, A.; Arnalds, O. Synthesis of Research on Land Use and Land Cover Dynamics in the Ethiopian Highlands. Unpublished Master’s Thesis, Hawassa University, Reykjavik, Iceland, 2011. [Google Scholar]
  32. Bewket, W.; Abebe, S. Land-use and land-cover change and its environmental implications in a tropical highland watershed, Ethiopia. Int. J. Environ. Stud. 2013, 70, 126–139. [Google Scholar] [CrossRef]
  33. Nyssen, J.; Simegn, G.; Taha, N. An upland farming system under transformation: Proximate causes of land use change in Bela-Welleh catchment (Wag, Northern Ethiopian Highlands). Soil Tillage Res. 2009, 103, 231–238. [Google Scholar] [CrossRef]
  34. Tsegaye, D.; Moe, S.R.; Vedeld, P.; Aynekulu, E. Land-use/cover dynamics in Northern Afar rangelands, Ethiopia. Agric. Ecosyst. Environ. 2010, 139, 174–180. [Google Scholar] [CrossRef]
  35. Shiferaw, A.; Singh, K. Evaluating the land use and land cover dynamics in Borena Woreda South Wollo Highlands, Ethiopia. Ethiop. J. Bus. Econ. 2011, 2, 69–104. [Google Scholar]
  36. Yalew, S.G.; Mul, M.L.; Van Griensven, A.; Teferi, E.; Priess, J.; Schweitzer, C.; van Der Zaag, P. Land-use change modelling in the Upper Blue Nile Basin. Environments 2016, 3, 21. [Google Scholar] [CrossRef]
  37. Haregeweyn, N.; Tsunekawa, A.; Poesen, J.; Tsubo, M.; Meshesha, D.T.; Fenta, A.A.; Nyssen, J.; Adgo, E. Comprehensive assessment of soil erosion risk for better land use planning in river basins: Case study of the Upper Blue Nile River. Sci. Total Environ. 2017, 574, 95–108. [Google Scholar] [CrossRef]
  38. Hurni, H.; Tato, K.; Zeleke, G. The implications of changes in population, land use, and land management for surface runoff in the upper nile basin area of ethiopia. Mt. Res. Dev. 2005, 25, 147–154. [Google Scholar] [CrossRef] [Green Version]
  39. Denekew, A.; Bekele, S. Characterization and Atlas of the Blue Nile Basin and Its Sub Basins; International Water Management Institute (IWMI): Colombo, Sri Lanka, 2009. [Google Scholar]
  40. Amare, A.; Simane, B. Climate change induced vulnerability of smallholder farmers: Agroecology-based analysis in the Muger sub-basin of the upper Blue-Nile basin of Ethiopia. Am. J. Clim. Chang. 2017, 6, 668–693. [Google Scholar] [CrossRef]
  41. Liswanti, N.; Shantiko, B.; Fripp, E.; Mwangi, E.; Laumonier, Y. Practical Guide for Socio-Economic Livelihood, Land Tenure and Rights Surveys for Use in Collaborative Ecosystem-Based Land Use Planning; CIFOR: Bogor Regency, Indonesia, 2013. [Google Scholar]
  42. Al-sharif, A.A.; Pradhan, B. Monitoring and predicting land use change in Tripoli Metropolitan City using an integrated Markov chain and cellular automata models in GIS. Arab. J. Geosci. 2014, 7, 4291–4301. [Google Scholar] [CrossRef]
  43. Nguyen, T. Optimal ground control points for geometric correction using genetic algorithm with global accuracy. Eur. J. Remote Sens. 2015, 48, 101–120. [Google Scholar] [CrossRef]
  44. Mosammam, H.M.; Nia, J.T.; Khani, H.; Teymouri, A.; Kazemi, M. Monitoring land use change and measuring urban sprawl based on its spatial forms: The case of Qom city. Egypt. J. Remote Sens. Space Sci. 2017, 20, 103–116. [Google Scholar]
  45. Gashaw, T.; Tulu, T.; Argaw, M. Erosion risk assessment for prioritization of conservation measures in Geleda watershed, Blue Nile basin, Ethiopia. Environ. Syst. Res. 2018, 6, 1. [Google Scholar] [CrossRef]
  46. Eastman, J.R. Idrisi Selva Manual, Manual Version 17; Clark Labs Clark University: Worcester, MA, USA, 2012; p. 10. [Google Scholar]
  47. Gashaw, T.; Bantider, A.; Mahari, A. Evaluations of land use/land cover changes and land degradation in Dera District, Ethiopia: GIS and remote sensing based analysis. Int. J. Sci. Res. Environ. Sci. 2014, 2, 199. [Google Scholar] [CrossRef]
  48. Morales-Barquero, L.; Lyons, M.B.; Phinn, S.R.; Roelfsema, C.M. Trends in remote sensing accuracy assessment approaches in the context of natural resources. Remote Sens. 2019, 11, 2305. [Google Scholar] [CrossRef]
  49. Story, M.; Congalton, R.G. Accuracy assessment: A user’s perspective. Photogramm. Eng. Remote Sens. 1986, 52, 397–399. [Google Scholar]
  50. Congalton, R.G. A review of assessing the accuracy of classifications of remotely sensed data. Remote Sens. Environ. 1991, 37, 35–46. [Google Scholar] [CrossRef]
  51. Lillesand, T.; Kiefer, R.W.; Chipman, J. Remote Sensing and Image Interpretation; John Wiley & Sons: Hoboken, NJ, USA, 2015. [Google Scholar]
  52. Rosenfield, G.H.; Fitzpatrick-Lins, K. A coefficient of agreement as a measure of thematic classification accuracy. Photogramm. Eng. Remote Sens. 1986, 52, 223–227. [Google Scholar]
  53. Teferi, E.; Uhlenbrook, S.; Bewket, W.; Wenninger, J.; Simane, B. The use of remote sensing to quantify wetland loss in the Choke Mountain range, Upper Blue Nile basin, Ethiopia. Hydrol. Earth Syst. Sci. 2010, 14, 2415–2428. [Google Scholar] [CrossRef]
  54. Rientjes, T.; Haile, A.; Kebede, E.; Mannaerts, C.; Habib, E.; Steenhuis, T. Changes in land cover, rainfall and stream flow in Upper Gilgel Abbay catchment, Blue Nile basin–Ethiopia. Hydrol. Earth Syst. Sci. 2011, 15, 1979–1989. [Google Scholar] [CrossRef]
  55. Puyravaud, J.-P. Standardizing the calculation of the annual rate of deforestation. For. Ecol. Manag. 2003, 177, 593–596. [Google Scholar] [CrossRef]
  56. Teferi, E.; Bewket, W.; Uhlenbrook, S.; Wenninger, J. Understanding recent land use and land cover dynamics in the source region of the Upper Blue Nile, Ethiopia: Spatially explicit statistical modeling of systematic transitions. Agric. Ecosyst. Environ. 2013, 165, 98–117. [Google Scholar] [CrossRef]
  57. Batar, A.K.; Watanabe, T.; Kumar, A. Assessment of land-use/land-cover change and forest fragmentation in the Garhwal Himalayan Region of India. Environments 2017, 4, 34. [Google Scholar] [CrossRef]
  58. Munthali, M.G.; Davis, N.; Adeola, A.M.; Botai, J.O.; Kamwi, J.M.; Chisale, H.L.; Orimoogunje, O.O. Local perception of drivers of land-use and land-cover change dynamics across Dedza District, Central Malawi Region. Sustainability 2019, 11, 832. [Google Scholar] [CrossRef]
  59. Terfa, B.K.; Suryabhagavan, K. Rangeland suitability evaluation for livestock production using remote sensing and GIS techniques in dire district, southern Ethiopia. Glob. J. Sci. Front. Res. H Environ. Earth Sci. 2015, 15, 10–26. [Google Scholar]
  60. CSA. Summary and Statistical Report of the 2007 Population and Housing Census; Central Statistical Agency: Addis Ababa, Ethiopia, 2007. [Google Scholar]
  61. CSA. Central Statistical Agency: Population Projection of Ethiopia for All Regions at Wereda Level from 2014–2017; Central Statistical Agency: Addis Ababa, Ethiopia, 2013. [Google Scholar]
  62. Dibaba, W.T.; Demissie, T.A.; Miegel, K. Drivers and implications of land use/land cover dynamics in Finchaa catchment, northwestern Ethiopia. Land 2020, 9, 113. [Google Scholar] [CrossRef]
  63. Senbeta, F. Community perception of land use/land cover change and its impacts on biodiversity and ecosystem services in northwestern Ethiopia. J. Sustain. Dev. Afr. 2018, 20, 108–126. [Google Scholar]
  64. Denboba, M.A. Forest Coversion-Soil Degradation-Farmers Perception Nexus: Implications for Sustainable Land Use in the Southwest of Ethiopia; Cuvillier Verlag: Göttingen, Germany, 2005; Volume 26. [Google Scholar]
  65. Yesuph, A.Y.; Dagnew, A.B. Land use/cover spatiotemporal dynamics, driving forces and implications at the Beshillo catchment of the Blue Nile Basin, North Eastern Highlands of Ethiopia. Environ. Syst. Res. 2019, 8, 21. [Google Scholar] [CrossRef]
  66. Tolessa, T.; Dechassa, C.; Simane, B.; Alamerew, B.; Kidane, M. Land use/land cover dynamics in response to various driving forces in Didessa sub-basin, Ethiopia. GeoJournal 2020, 85, 747–760. [Google Scholar] [CrossRef]
  67. Hassen, E.E.; Assen, M. Land use/cover dynamics and its drivers in Gelda catchment, Lake Tana watershed, Ethiopia. Environ. Syst. Res. 2018, 6, 4. [Google Scholar] [CrossRef]
  68. Gashaw, T.; Tulu, T.; Argaw, M.; Worqlul, A.W. Modeling the hydrological impacts of land use/land cover changes in the Andassa watershed, Blue Nile Basin, Ethiopia. Sci. Total Environ. 2018, 619, 1394–1408. [Google Scholar] [CrossRef]
  69. Terfa, B.K.; Chen, N.; Liu, D.; Zhang, X.; Niyogi, D. Urban expansion in Ethiopia from 1987 to 2017: Characteristics, spatial patterns, and driving forces. Sustainability 2019, 11, 2973. [Google Scholar] [CrossRef]
  70. Hailemariam, S.N.; Soromessa, T.; Teketay, D. Land use and land cover change in the Bale Mountain Eco-Region of Ethiopia during 1985 to 2015. Land 2016, 5, 41. [Google Scholar] [CrossRef] [Green Version]
  71. Abera, D.; Kibret, K.; Beyene, S. Tempo-spatial land use/cover change in Zeway, Ketar and Bulbula sub-basins, Central Rift Valley of Ethiopia. Lakes Reserv. Res. Manag. 2019, 24, 76–92. [Google Scholar] [CrossRef]
  72. Matlhodi, B.; Kenabatho, P.K.; Parida, B.P.; Maphanyane, J.G. Evaluating land use and land cover change in the Gaborone dam catchment, Botswana, from 1984–2015 using GIS and remote sensing. Sustainability 2019, 11, 5174. [Google Scholar] [CrossRef]
  73. Palamuleni, L.G.; Annegarn, H.J.; Landmann, T. Land cover mapping in the Upper Shire River catchment in Malawi using Landsat satellite data. Geocarto Int. 2010, 25, 503–523. [Google Scholar] [CrossRef]
  74. Mucova, S.A.R.; Leal Filho, W.; Azeiteiro, U.M.; Pereira, M.J. Assessment of land use and land cover changes from 1979 to 2017 and biodiversity & land management approach in Quirimbas National Park, Northern Mozambique, Africa. Glob. Ecol. Conserv. 2018, 16, e00447. [Google Scholar]
  75. Otieno, V.O.; Anyah, R. Effects of land use changes on climate in the Greater Horn of Africa. Clim. Res. 2012, 52, 77–95. [Google Scholar] [CrossRef]
  76. Bewket, W. Land cover dynamics since the 1950s in Chemoga watershed, Blue Nile basin, Ethiopia. Mt. Res. Dev. 2002, 22, 263–269. [Google Scholar] [CrossRef]
  77. Awoke, B.G. The role of geo information technology for predicting and mapping of forest cover spatio-temporal variability: Dendi district case study, Ethiopia. J. Sustain. Dev. Afr. 2010, 12, 9–33. [Google Scholar]
  78. Gashaw, T.; Bantider, A.; Mahari, A. Population dynamics and land use/land cover changes in Dera District, Ethiopia. Glob. J. Biol. Agric. Health Sci 2014, 3, 137–140. [Google Scholar]
  79. Pullanikkatil, D.; Palamuleni, L.G.; Ruhiiga, T.M. Land use/land cover change and implications for ecosystems services in the Likangala River Catchment, Malawi. Phys. Chem. Earth Parts A/B/C 2016, 93, 96–103. [Google Scholar] [CrossRef]
  80. Bone, R.A.; Parks, K.E.; Hudson, M.D.; Tsirinzeni, M.; Willcock, S. Deforestation since independence: A quantitative assessment of four decades of land-cover change in Malawi. South. For. J. For. Sci. 2017, 79, 269–275. [Google Scholar] [CrossRef]
  81. Müller-Mahn, D.; Gebreyes, M. Controversial connections: The water-energy-food nexus in the Blue Nile basin of Ethiopia. Land 2019, 8, 135. [Google Scholar] [CrossRef]
  82. Wagesho, N. Catchment dynamics and its impact on runoff generation: Coupling watershed modelling and statistical analysis to detect catchment responses. Int. J. Water Resour. Environ. Eng. 2014, 6, 73–87. [Google Scholar]
  83. Zuazo, V.H.; Pleguezuelo, C.R. Soil-erosion and runoff prevention by plant covers: A review. Sustain. Agric. 2009, 785–811. [Google Scholar] [CrossRef] [Green Version]
Figure 1. Location of the study area.
Sustainability 14 11241 g001
Figure 2. LC of Muger sub-basin in 1986, 2003, and 2020.
Sustainability 14 11241 g002
Figure 3. Net gain and loss in area of land cover types by temporal regime.
Sustainability 14 11241 g003
Table 1. Characteristics of Landsat imagery used for the land cover (LC) analysis.
Satellite SensorPath/RowAcquisition DateSpatial ResolutionSources
Landsat 5 (TM)168/53 and 54
169/53 and 54
January 198630 × 30 mUSGS
Landsat 7 (ETM+)168/53 and 54
169/53 and 54
January 200330 × 30 mUSGS
Landsat 8 (OLI)168/53 and 54
169/53 and 54
January 202030 × 30 mUSGS
Table 2. Description of LC classes used in this study.
LC ClassesDescription
Bare landNon-vegetated area dominated by rock outcrops, roads, and eroded and degraded lands.
Cultivation landAreas of land prepared for growing agricultural crops. This category includes areas currently under crop and land under preparation.
ForestlandArea covered by trees where the tree-cover density is greater than 10%. It includes plantation and natural forest.
GrasslandAreas covered by grasses usually used for grazing and those remaining for some months in a year.
Settlement areaLand dominated with houses and huts in rural villages and small towns (also including commercial areas, urban and rural settlements, and industrial areas).
ShrublandAreas covered by scattered small trees, shrubs, and bushes and mixed with grass vegetation
Water bodiesThe area covered by water (ponds, lakes, and rivers)
WetlandSwamplands and wetland area with small green plants or grasses.
Table 3. Accuracy assessment of the classified images by study periods.
LC ClassesYear
198620032020
Producer’s
Accuracy
User’s
Accuracy
Producer’s
Accuracy
User’s
Accuracy
Producer’s
Accuracy
User’s
Accuracy
BL53.3380.0061.5466.6768.4286.67
CL96.8589.7898.5793.2496.7795.54
FL77.0888.1088.2490.9175.0075.00
GL66.6775.0064.7184.6275.0060.00
SA77.7870.0077.7870.00100.0080.00
SL90.3284.8587.5084.0078.9583.33
WB70.0070.0080.0080.0088.8980.00
WL70.0070.0080.0080.0081.8290.00
Overall accuracy (%)85.45 88.51 89.39
Overall kappa0.79 0.83 0.83
Note: BL = bare land, CL = cultivation land, FL = forestland, GR = grassland, SA = settlement area/urban and built-up, SL = shrubland, WB = water body, WL = wetland.
Table 4. Areas of LC types and their changes between 1986, 2003, and 2020.
AreaChange (Gain/Loss)
1986200320201986–20032003–20201986–2020
LC TypesHa%Ha%Ha%Ha%Ha%Ha%
BL9413.191.158601.391.054654.50.57−811.80−0.10−3946.89−0.48−4758.69−0.58
CL563,82368.86592,95772.42576,80670.4429,134.003.56−16,151.00−1.9712,983.001.59
FL96,475.911.7876,634.69.3648,326.35.90−19,841.30−2.42−28,308.30−3.46−48,149.60−5.88
GL12,482.91.5228,152.53.443362.40.4115,669.601.91−24,790.10−3.03−9120.50−1.11
SA262.890.036182.910.7612,563.51.535920.020.726380.590.7812,300.611.50
SL117,79214.3992,954.911.35165,93520.27−24,837.10−3.0372,980.108.9148,143.005.88
WB2764.560.342066.040.254613.580.56−698.52−0.092547.540.311849.020.23
WL15,809.51.9311,274.61.382562.660.31−4534.90−0.55−8711.94−1.06−13,246.84−1.62
Total (ha)818,823.9100818,823.9100818,823.9100
Note: BL = bare land, CL = cultivation land, FL = forestland, GR = grassland, SA = settlement area/urban and built-up, SL = shrubland, WB = water body, WL = wetland. Total LULC gain/loss and percentage of LULC gain/loss were calculated using Equations (6) and (7), respectively.
Table 5. Area (in hectares) and proportion of LC and the rate of changes in the Muger sub-basin between 1986, 2003, and 2020.
AreaChange
1986200320201986–20032003–20201986–2020
LC TypesHa%Ha%Ha%Annual Change Rate (%)LC Change (%)Annual Change Rate (%)LC Change (%)Annual Change Rate (%)LC Change (%)
BL9413.191.158601.391.054654.50.570.000−0.10−0.036−0.48−0.021−0.58
CL563,82368.86592,95772.42576,80670.440.0033.56−0.002−1.970.0011.59
FL96,475.911.7876,634.69.3648,326.35.90−0.014−2.42−0.027−3.46−0.020−5.88
GL12,482.91.5228,152.53.443362.40.410.0481.91−0.125−3.03−0.039−1.11
SA262.890.036182.910.7612,563.51.530.1860.720.0420.780.1141.50
SL117,79214.3992,954.911.35165,93520.27−0.014−3.030.0348.910.0105.88
WB2764.560.342066.040.254613.580.56−0.017−0.090.0470.310.0150.23
WL15,809.51.9311,274.61.382562.660.31−0.020−0.55−0.087−1.06−0.054−1.62
Total (ha)818,823.9100818,823.9100818,823.9100
Note: BL = bare land, CL = cultivation land, FL = forestland, GR = grassland, SA = settlement area/urban and built-up, SL = shrubland, WB = water body, WL = wetland. The percentage and rate of change were calculated using Equation (5).
Table 6. Net change (ha) and net persistence ratio of each land cover type by temporal regime.
Land over Type1986–20032003–20201986–2020
Net ChangeNet PersistenceNet ChangeNet PersistenceNet ChangeNet Persistence
Bareland−811.8−0.78−3946.86−5.069−4758.75−7.69
Cultivation land29,133.810.06−16,150.41−0.03512,983.310.03
Forestland−19,841.31−0.46−28,308.51−1.192−48,149.64−1.81
Grassland15,669.639.54−24,790.14−13.144−9120.51−17.70
Settlement5920.0281.716380.5513.76312,300.57326.19
Shrubland−24,836.76−0.772,979.741.57248,142.980.89
Water body−698.67−1.912547.544.9581848.871.70
Wetland−4534.92−1.24−8711.91−5.307−13,246.83−8.36
Note that net change is the difference of gain and loss in area of a land cover class; and net persistence is the ratio of net change to persistence or the area that remains unchanged for that class.
Table 7. LC distribution of 1986 and 2020 in different terrain slope classes.
1986Percent of Slope Class and Area Coverage, Hectares
LC Type0–2%2–5%5–8%8–15%15–30%30–60%>60%Total
BL3729.782698.291805.13970.2191.75.4912.69413.19
CL275,904.9151,292.378,429.2446,172.710,428.841576.6318.26563,822.8
FL23,261.9420,925.1820,230.6521,388.149815.94749.97104.1396,475.95
GL9683.731761.84524.79372.42112.8611.4315.8412,482.91
SA168.8446.351814.499.990.94.32262.89
SL41,565.7830,723.0324,139.6216,579.264430.34258.6694.95117,791.6
WB1022.85448.38306.45418.9543242.1293.962764.71
WL6699.514637.792920.231359.72157.059.925.2915,809.49
Total (ha)362,037.3212,533.1128,374.187,275.8825,578.722655.1369.35818,823.6
2020Percent of Slope Class and Area Coverage, Hectares
LC Type0–2%2–5%5–8%8–15%15–30%30–60%>60%Total
BL2122.921154.25725.4523.08116.375.586.844654.44
CL253,660.5159,299.692,622.9657,245.4912,434.581034.59508.37576,806
FL12,321.999095.768230.3210,810.537105.95663.3998.3748,326.31
GL3167.01158.4911.3416.568.820.090.093362.4
SA5657.853386.161856.521096.92430.7484.2451.0312,563.46
SL81,155.0737,940.7624,089.5817,000.555307.12279.27162.27165,934.6
WB2420.64978.12557.46405.27132.2114.4105.484613.58
WL1531.35520.02280.53177.4843.925.673.692562.66
Total (ha)362,037.3212,533.1128,374.187,275.8825579.712087.23936.14818,823.5
Note: BL = bare land, CL = cultivation land, FL = forestland, GR = grassland, SA = settlement area/urban and built-up, SL = shrubland, WB = water body, WL = wetland.
Table 8. Ranking of the direct drivers of LC change in the study area based on data from KIIs.
Drivers of LC ChangesPercent (%)Rank
Agriculture expansion17.421
Population growth16.522
Wood extraction (for charcoal, fuel wood, and construction)14.023
Expansion of settlement12.654
Infrastructure development10.085
Overgrazing9.096
Absence of land use planning6.147
Expansion of plantation5.158
Limited capacities of the NRM sector4.629
Lack of land use policies and laws4.3210
Table 9. Underlying causes of LC change in the study area and their ranking based on the KIIs.
Drivers of LC ChangesPercent (%)Rank
Demographic 31.941
Economic 27.222
Institution and policy 16.393
Biophysical/natural 14.444
Technological 10.005
Publisher’s Note: MDPI stays neutral with regard to jurisdictional claims in published maps and institutional affiliations.

