Article

Performance Assessment of a Sensor-Based Variable-Rate Real-Time Fertilizer Applicator for Rice Crop

1
Department of Agricultural Machinery and Technologies Engineering, Faculty of Agriculture, Ataturk University, Erzurum 25240, Turkey
2
Department of Farm Machinery and Power Engineering, College of Agricultural Engineering and Technology (COAET), Punjab Agricultural University (PAU), Ludhiana 141004, India
3
Precision Agriculture Extension, Raven Precision Agriculture Center, South Dakota State University, Brookings, SD 57007, USA
*
Authors to whom correspondence should be addressed.
Sustainability 2022, 14(18), 11209; https://doi.org/10.3390/su141811209
Submission received: 13 June 2022 / Revised: 27 July 2022 / Accepted: 17 August 2022 / Published: 7 September 2022

Abstract

:
Variable-rate technology (VRT) may reduce input costs, increase crop productivity and quality, and help to protect the environment. The present study was conducted to evaluate the performance of a variable-rate fertilizer applicator for rice (Oryza sativa L.). Three replications were conducted, each of which was divided into four plots. Field performance of the system was assessed at different nitrogen levels (N1 to N4, i.e., 75, 125, 175, 225 kg ha−1), growth stages (tillering, panicle initiation, heading), and heights (40, 60, 80, 100 cm) of the sensor from the crop canopy. Fertilizer rate was at minimum 12.59 kg ha−1 at 10 rpm of drive-shaft rotational speed and at maximum 50.41 kg ha−1 at 40 rpm. The system response time was within the range of 3.53 to 4.93 s, with overall error ranging between 0.83% to 4.92%. Across different growth stages, when fertilizer rate was increased from N1 to N4, NDVI increased from 0.49 to 0.69. Hence, drive-shaft rotational speed is decreased from 25 to 7 rpm to shift the application rate from 30.83 to 9.15 kg ha−1. There was a 45% reduction in total fertilizer rate applied by the system, with respect to the recommended rate.

1. Introduction

One of the main aims of sustainable agriculture and agricultural studies is to keep the environment safe, while increasing yield production using agrochemicals, i.e., fertilizers, pesticides, and herbicides. Therefore, it is vital to optimize field chemical-application rates based on adjusting the crop needs at different zones in order to enhance agrochemical-use efficacy [1,2,3,4,5,6,7,8,9,10,11,12,13,14,15]. Precision agriculture using spatial data on plant status and soil characteristics can be described as an integration of techniques and equipment to predict the crop’s requirements and apply those needs at the right time and accurate place, in order to optimize fertilizer-use efficacy and raise both crop quality and productivity [16,17,18].
Conventional methods apply fertilizer uniformly, which is problematic, especially with N fertilizer, in that it may cause under and over fertilization in some areas of the farm. Under fertilization can result in yield losses in some standing crops, such as rice and wheat, whereas over fertilization can lead to lodging during harvesting and cause environmental damage [19]. Moreover, inappropriate application of the N rate negatively affects the indirect and direct mechanisms of crop defense [20]. Therefore, site-specific variable-rate fertilizer-application technology, which can identify the individual needs of each area and apply N fertilizer accordingly, is of great importance. Applying the right amount of N is one of the key factors for increasing crop production, since currently N deficiency causes about 77% of the global farm-production gap [21]. N management is a significant issue in the production of many crops and is one of the main constraints on rice production [22,23,24]. N deficiencies often decrease leaf area, photosynthesis, and biomass in rice, resulting in reduced crop production. However, a surplus of N can have detrimental environmental impacts as well as potential economic and health problems, which should also be considered [25]; for example, when extra N is used, soil becomes vulnerable to leaching, which can pollute groundwater and air [26,27,28,29,30]. When choosing the amount of N, the farmer needs to strike a balance between achieving the most profitable economic yields and minimizing the harm to the environment. Sound N management can simultaneously increase productivity and yield quality and keep the environment safe.
Knowledge about the variability of different soil characteristics in a field is important for the management process. The ideal amount of N will vary based on the soil, weather, and history of crops grown in previous years, since mobile nutrients such as N are used, lost, and stored differently, as these factors vary. For example, coastal plain soils vary in texture, type, water-holding capacity, and other properties that influence crop yield and impact fertilizer-management plans. The failure to characterize soil quickly and cheaply is still one of the main limitations of precision agriculture [31]. The soil mineral nitrogen is presently measured via costly labor-intensive field sampling methods followed by laboratory analysis [32].
In order to remain competitive in the international market, it is vital for farmers to offset additional costs incurred to achieve high crop yields by decreasing input expenses. For instance, a 20% decrease in N application could save USA corn farmers over USD 1.2 billion annually [33]. Several researchers across the cotton- and corn-producing USA have developed algorithms for N fertilization based on optical sensors [34,35,36,37]. These algorithms were taken into account considering N fertilization as the main factor.
Managing crops’ N requirements entails careful consideration of resources, places, times, and amounts [38]. To optimize N usage, producers must know the different sources of N available to the crop besides fertilizer and how to reduce N loss. Traditionally, many farmers have been manually trying to distinguish between over and under fertilized areas, based on the greenery of the crop’s leaves, to apply N fertilizer as needed. The vegetation of the rice crop can be used to identify the status of the N availability of the crop [39,40]. The main factor in control of crop photosynthesis is the chlorophyll content of plant’s leaves, which plays the key role in crop growth and crop yield [41]. Furthermore, crop N status affects chlorophyll content, while a lower or higher N rate results in a lighter and darker green colour in the plant’s leaves, respectively [42,43]. One of the available techniques to identify the N status of the plant via the amount of crop chlorophyll content is to categorize crop vegetation via different wavelengths of the crop canopy, using the Normalized Difference Vegetation Index (NDVI), which responds to slight changes of plant chlorophyll content and N content [44,45,46]. Moreover, the NDVI data of a plant can be attained using a Greenseeker optical sensor [47]. Furthermore, the major factor for rice-crop development and its production is N [48,49,50]. To this end, Punjab Agricultural University also has recommended the use of a Greenseeker handheld active sensor in the university’s research, through the Package of Practices for the Crops of Punjab’s Guidelines [51,52]. Variable-rate fertilizer application, based on the Greenseeker’s readings, has the potential to improve fertilizer-use efficiency, increase income, and reduce environmental damage.
Traditionally, soil-test-based fertilizer application is done in the field manually by farmers, which means the fertilizer can only be applied uniformly [51,52]. An ideal, more efficient method, which is known as the basis of precision agriculture, would be to apply fertilizer as a per plant requirement through variable-rate technology (VRT) [53]. VRT with the help of maps of various soil properties, applies agrochemicals, crop seeds, etc. [54]. Map-based, via prescription maps, and sensor-based, via on-the-go sensors’ feedback, are two types of VRT [55]. Ess et al. [56] stated map-based methods can be considered as a commonly approached type of VRT, due to insufficient accuracy of the sensors used for soil and crop environments. With VRT machines, the NDVI of a crop can be used to specify the optimal dosage and location of application precisely as per the requirement of the crops. This can maximize crop productivity by raising the output and the quality of farm produce. A variable-rate applicator for fertilizer is essential for effective, precision farming. Thus, an electrically mechanized apparatus capable of quantifying and changing the amount of fertilizer to be applied on the go and in real time is required [57].
In recent years, three variable-rate technology (VRT) methods have been applied in precision agriculture to enhance crop productivity, crop quality, and protect the environment: the map-based method [58,59,60,61,62,63,64,65,66,67,68], the sensor-based method [69,70,71,72,73,74,75,76], and a combination of the map-based and sensor-based methods [77,78,79,80,81,82].
Variable-rate applicators use electronic, hydraulic, and pneumatic systems to regulate the rate of fertilizers and seeds. Such systems include: electric DC motors, which via voltage pulse modulation vary the drive-shaft rotational speed [83,84]; DC motor linear action, which regulates the position of adjustment lever via a DC motor [85]; DC motor linear action, which adjusts the exposure length of the fluted roller via a DC motor [86,87]; pneumatic motors, which regulate the position of adjustment lever via pneumatic cylinder [88,89]; hydraulic motors, which regulate the drive-shaft rotational speed via a pulse modulate flow valve [71,90]; and electric linear actuators, which adjust the exposure length of the fluted roller via a linear actuator [57].
VRT has been developed to control the application of crop inputs in order to manage in-field variability. Although growers have begun to adopt VRT to apply pesticides [91], chemicals [92], water [93,94,95,96,97,98,99], and seed [83,100,101] in different amounts across a farm, its role in N management remains uncertain [102,103,104,105]. Variable-rate fertilization aims to improve fertilizer-use efficiency and decrease environmental impacts by varying fertilizer rates according to the needs of each zone within a field [106]. Using VRT in N management improves soil health and reduces ground water pollution, by avoiding the use of extra fertilizer that gets leached and often enters the human food chain. For variable-rate fertilizer application, a suitable application system is required to apply fertilizer based on need.
The key factor of fertilizer unit operation is fertilizer metering. Different shapes of rotating components are used for a metering system, and a common type is the fluted roll. An investigation was conducted on different shapes of the fluted-roll type (helical and straight flute) that are compatible with fertilizer characteristics, to develop a fertilizer metering applicator. The study showed no significant change on the amount of application discharged by either type with 6, 8, 10, and 12 flutes [107]. VRT systems have been enhanced and implemented through several investigations [108,109,110,111,112,113,114,115,116,117,118,119,120,121,122,123,124,125,126,127,128,129,130,131,132,133,134,135,136,137,138,139,140,141,142,143,144,145,146,147,148,149,150,151,152,153,154,155].
A blow-head type and pneumatic granular fertilizer applicator have been developed by Kim et al. [156], and Ryu et al. [157] for rice fields in Korea. The VRT application system was then enhanced with the application rates via including a decision-making code [158], which can use combination of fertilizers for five various fertilizer rates. A VRT applicator using pneumatic cylinder to regulate the fertilizer rate has been developed with a response time between 0.08–1.0 s, with a ±6% overall error [89]. A development of an automatic control on the position of adjustment lever via a DC motor to precisely control the application discharge rate has been accomplished by Tola et al. [85]. The response time of their system to regulate the position of adjustment lever to discharge the aimed application rate was between 0.95–1.90 s, with a ±5% overall error. Forouzanmehr and Loghavi [61] developed and evaluated a map-based variable-rate granular fertilizer applicator by the placement of fertilizer in row crop. Its major result was on the precision of the consumption rate and forward speed, whereas the type of fertilizer had no major result. While the forward speed and consumption rate were increased, the accuracy of the consumption rate was reduced. The accuracy of the applicator for applying the targeted fertilizer rate was about 94%, with overall errors of 5.45% and 5.36% for TSP and urea fertilizers, respectively. Field examinations of the system revealed that the applicator was effectively capable of dispensing the requirement rate with little lag time and admissible reliability. Miller et al. [159] developed a compound map-based and sensor-based VRT fertilizer applicator for citrus, using a spinner-disc pull-type spreader. The applicator regulated the fertilizer rate based on the size of trees via a real-time sensor and prescription map. In this system, modulating control valves vary the hydraulic motor’s shaft rotational speed through the hydraulic flow rate to control the speed of the driven chain. The accuracy of the fertilizer-rate error was at an average of 7.7%. Koundal et al. [160] conducted an experiment for developing a variable-rate granular fertilizer. In this experiment, a PWM pro controller, with the help of a no-tillage fertilizer tool and hydraulic motor, was used. The evaluation showed that by modification of the Envizio-Pro II controller from 1000 to 4000, hydraulic motor speeds changed from 70 to 265 rpm, and the amount of fertilizer varied from 25.53 to 237.93 kg ha−1, respectively. The coefficient of variation (CV) for different modifications of the Envizio-Pro II controller demonstrated that the maximum and minimum CV were 11.35% and 3.69% at 4000 and 3500 modification, or 260 and 236 rpm of the hydraulic motor, respectively. Fulton et al. [161] developed uniform and variable-rate application models for simulating the variable-rate fertilizer application errors of a spinner–disc fertilizer applicator, with the help of experimental data. This allowed them to specify the fertilizer variability of the distributor and to examine the impact of amount changes through GPS monitoring. To specify growth changes in the fertilizer rate, a sigmoidal function was applied to the developed models, such that for changes in reduction rate a linear function was used. Mean transverse spreading patterns were applied to models increasing and decreasing in fertilizer rates. The CV of the application uniformity distribution was found above 20%. A VRT granular fertilizer control system was developed by Alameen et al. [88] using pneumatic cylinder to control the position of adjustment lever of the applicator in order to regulate the application rate. The applicator’s response time for targeted fertilizer rate was in the range of 6–11 ms, with ±2.6% overall error. May and Kocabiyik [162] developed a VRT applicator to control the rate of targeted microgranular fertilizer via varying a DC motor rotational speed controlled by a motor driver using the pulse-width modulation technique. Evaluation of the system for the desired application rate performed with about 98% accuracy and a ±2.43% overall error.
In a VRT system, errors can be reduced by adjusting hardware and/or look-ahead time in the software, to make an adjustment between the applicator’s response time and the right application rate for the different specific areas [163]. An investigation stated applying the right amount of application should happen some seconds later than the response time of the controller’s action, due to the controller’s time transition with respect to the right area of application. This study specified that the transition time during the intersection of specific areas was 0.65 s, while changing one area to another takes about 2 s. Therefore, in software there was the consideration of 3 s as the initiation time of the system. The errors of this application system were ±2.5% [164]. Al-Gaadi and Ayers [165] specified that the maximum typical response time of a VRT system for herbicide was 2.2 s with 2.0% error, due to the transition time while changing from one specific site to another. Research has been conducted on the impact of the fertilizer rate on the applicator’s transition time, which revealed that there is no significant influence by the changing the fertilizer rate on application errors. In particular, there were no difference errors between an application rate of 0 and 166 kg ha−1. The study revealed that there was a variation in areas with needs of greater amount of fertilizer, and errors mostly occur when changing from one specific area to another [166].
The main factors for fertilizer/seed applicators are accuracy, uniform distribution of application, and response time. The coefficient of variation (CV) is one of the methods to evaluate uniformity distribution of seed/fertilizer [17]. One technique to evaluate the applicator and identify the operative swath width (as the distance between tracks work at CV of 15%) is via overlapping the distribution of application [167]. A study on the evaluation of a VRT applicator for assessment of the working swath of different fertilizer-distribution uniformity stated that the operative swath width of the rotary spinner disc varied with fertilizer-distribution uniformity. The response time of this system was 3.1 s for a low-to-high-rate change and 5.6 s for a high-to-low-rate change. Evaluation of this applicator was assessed as 27% saved in applying the fertilizer rate. The study stated that to reduce the errors of the applicator in the intersection management zones and transition time, considerations about different initiation times for the software of the system are needed [168]. Fulton et al. [169] has conducted an experiment for VRT applicators to examine the uniformity distribution of granular fertilizer using a rotary and pneumatic boom. This study revealed that CV was increased by an increase in fertilizer rate. The optimum fertilizer swath for the rotary one was found to be narrower than the one suggested one by the producer. The uniformity-distribution CV for the pneumatic boom was between 11.6% to 31.3%. In this research, for the level of fertilizer uniformity, an acceptable CV was considered to be 20%. In another study, the VRT applicators’ response rate for two spinner spreaders and two pneumatic boom types has been assessed for granular fertilizer using a sigmoid function to model the response rate. For spinner spreaders, the transition times was between 3.6 to 6.8 s, while for pneumatic ones it was between 0.4 to 12.4 s. The outcomes revealed that there was feasibility for one of the applicators to consider initiation time in its software system, as it had stable transition and lag times. However, the transition time in the other systems were affected by the change in fertilizer rates [163].
The present study was performed in order to supplement the work of similar lab studies. The goal was to evaluate the efficacy of a developed variable-rate applicator in detecting the real-time deficiency of N in the field and assess its capacity to apply fertilizer as per the requirements of the plots with controlled pre-N fertilizer levels.

2. Materials and Methods

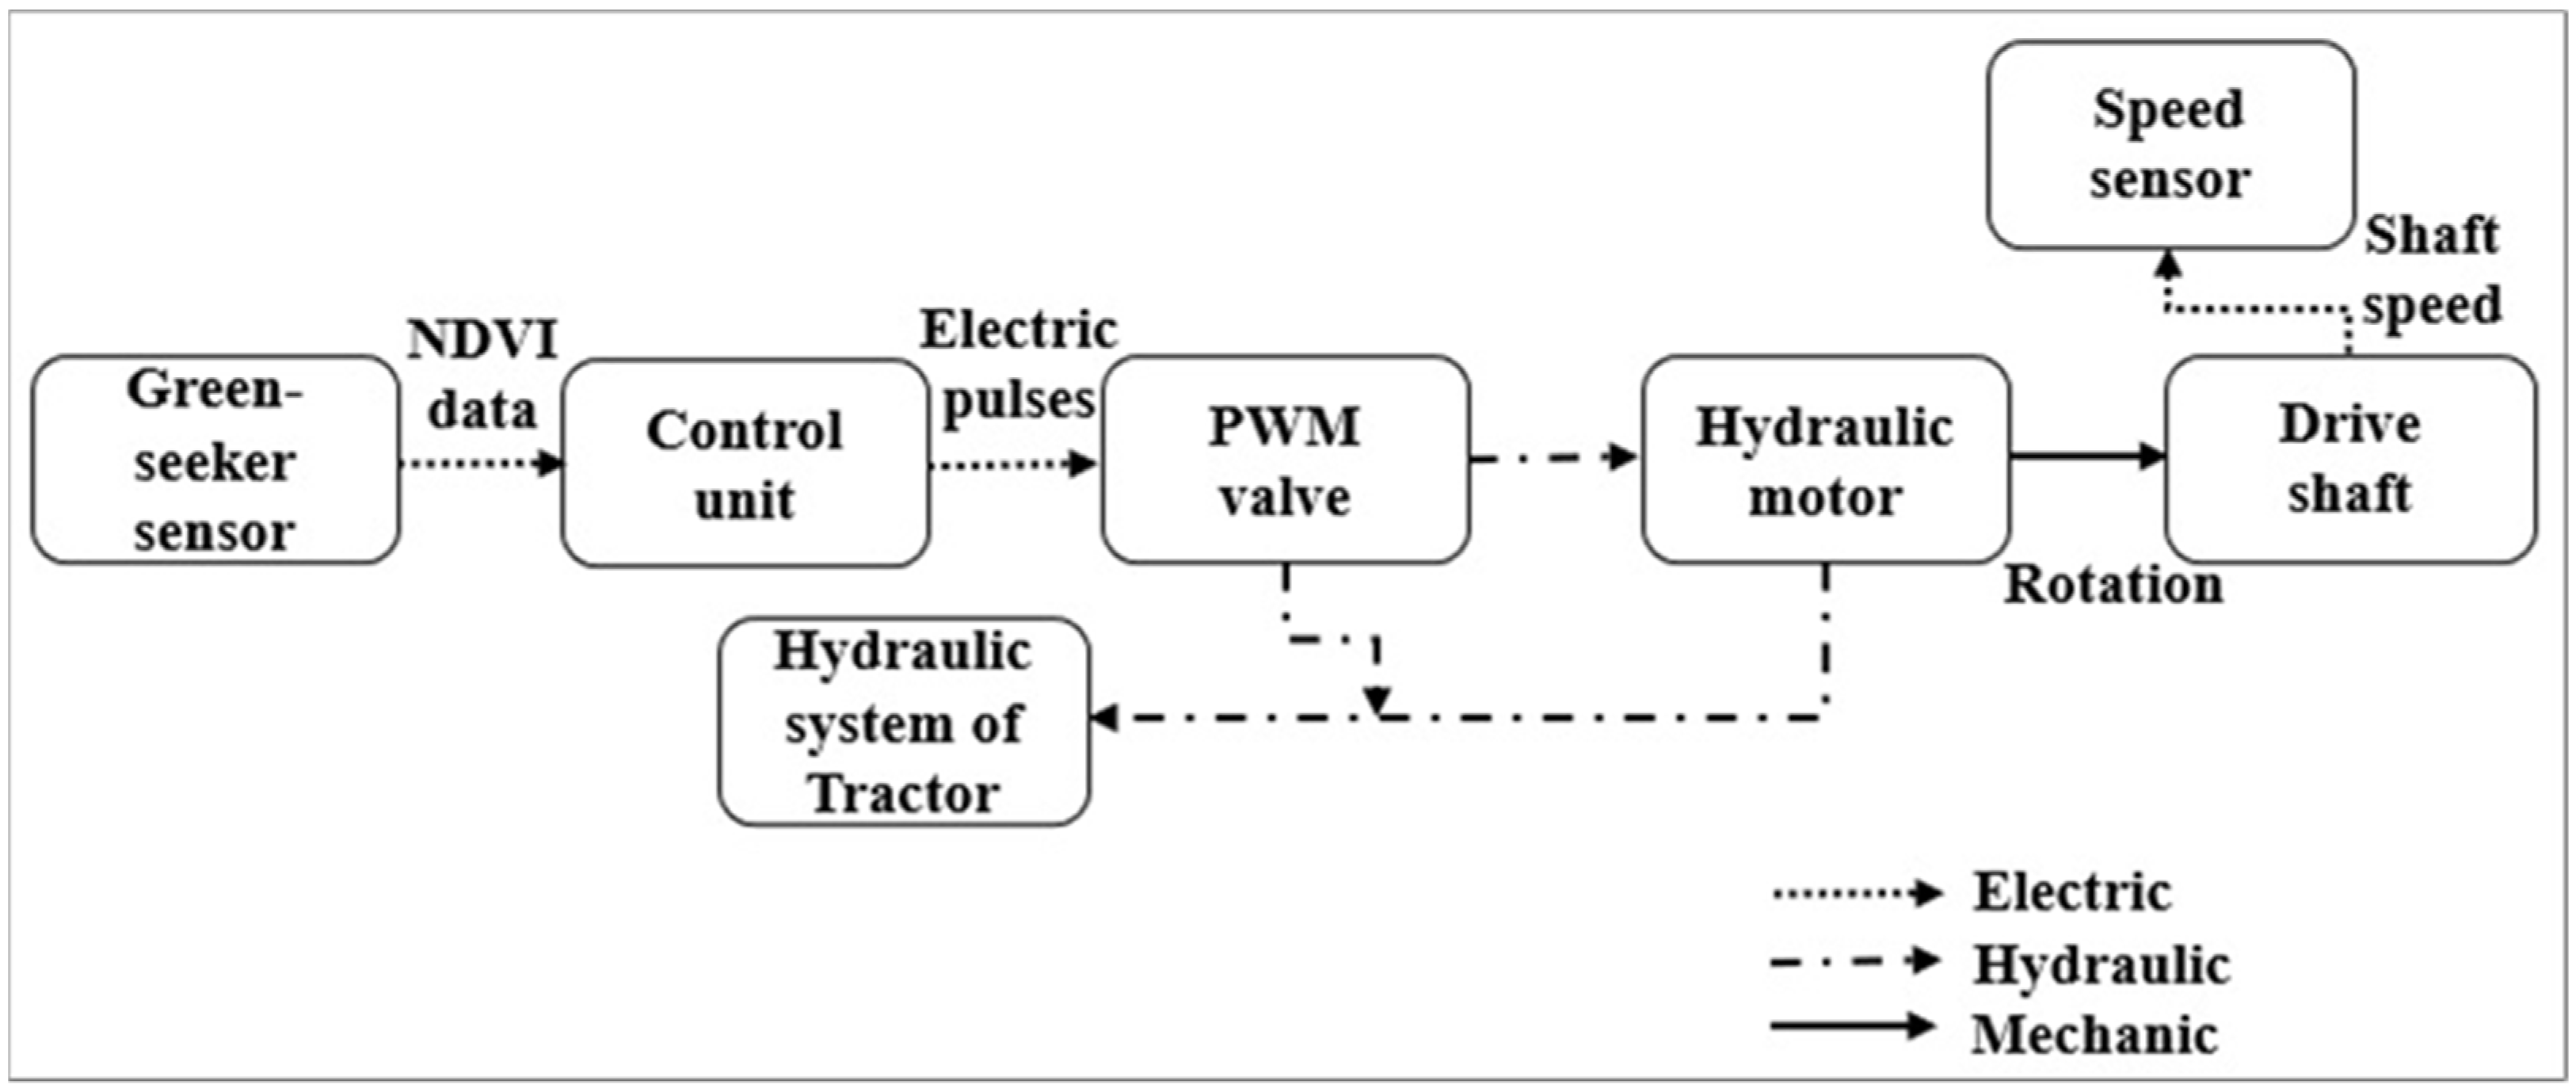
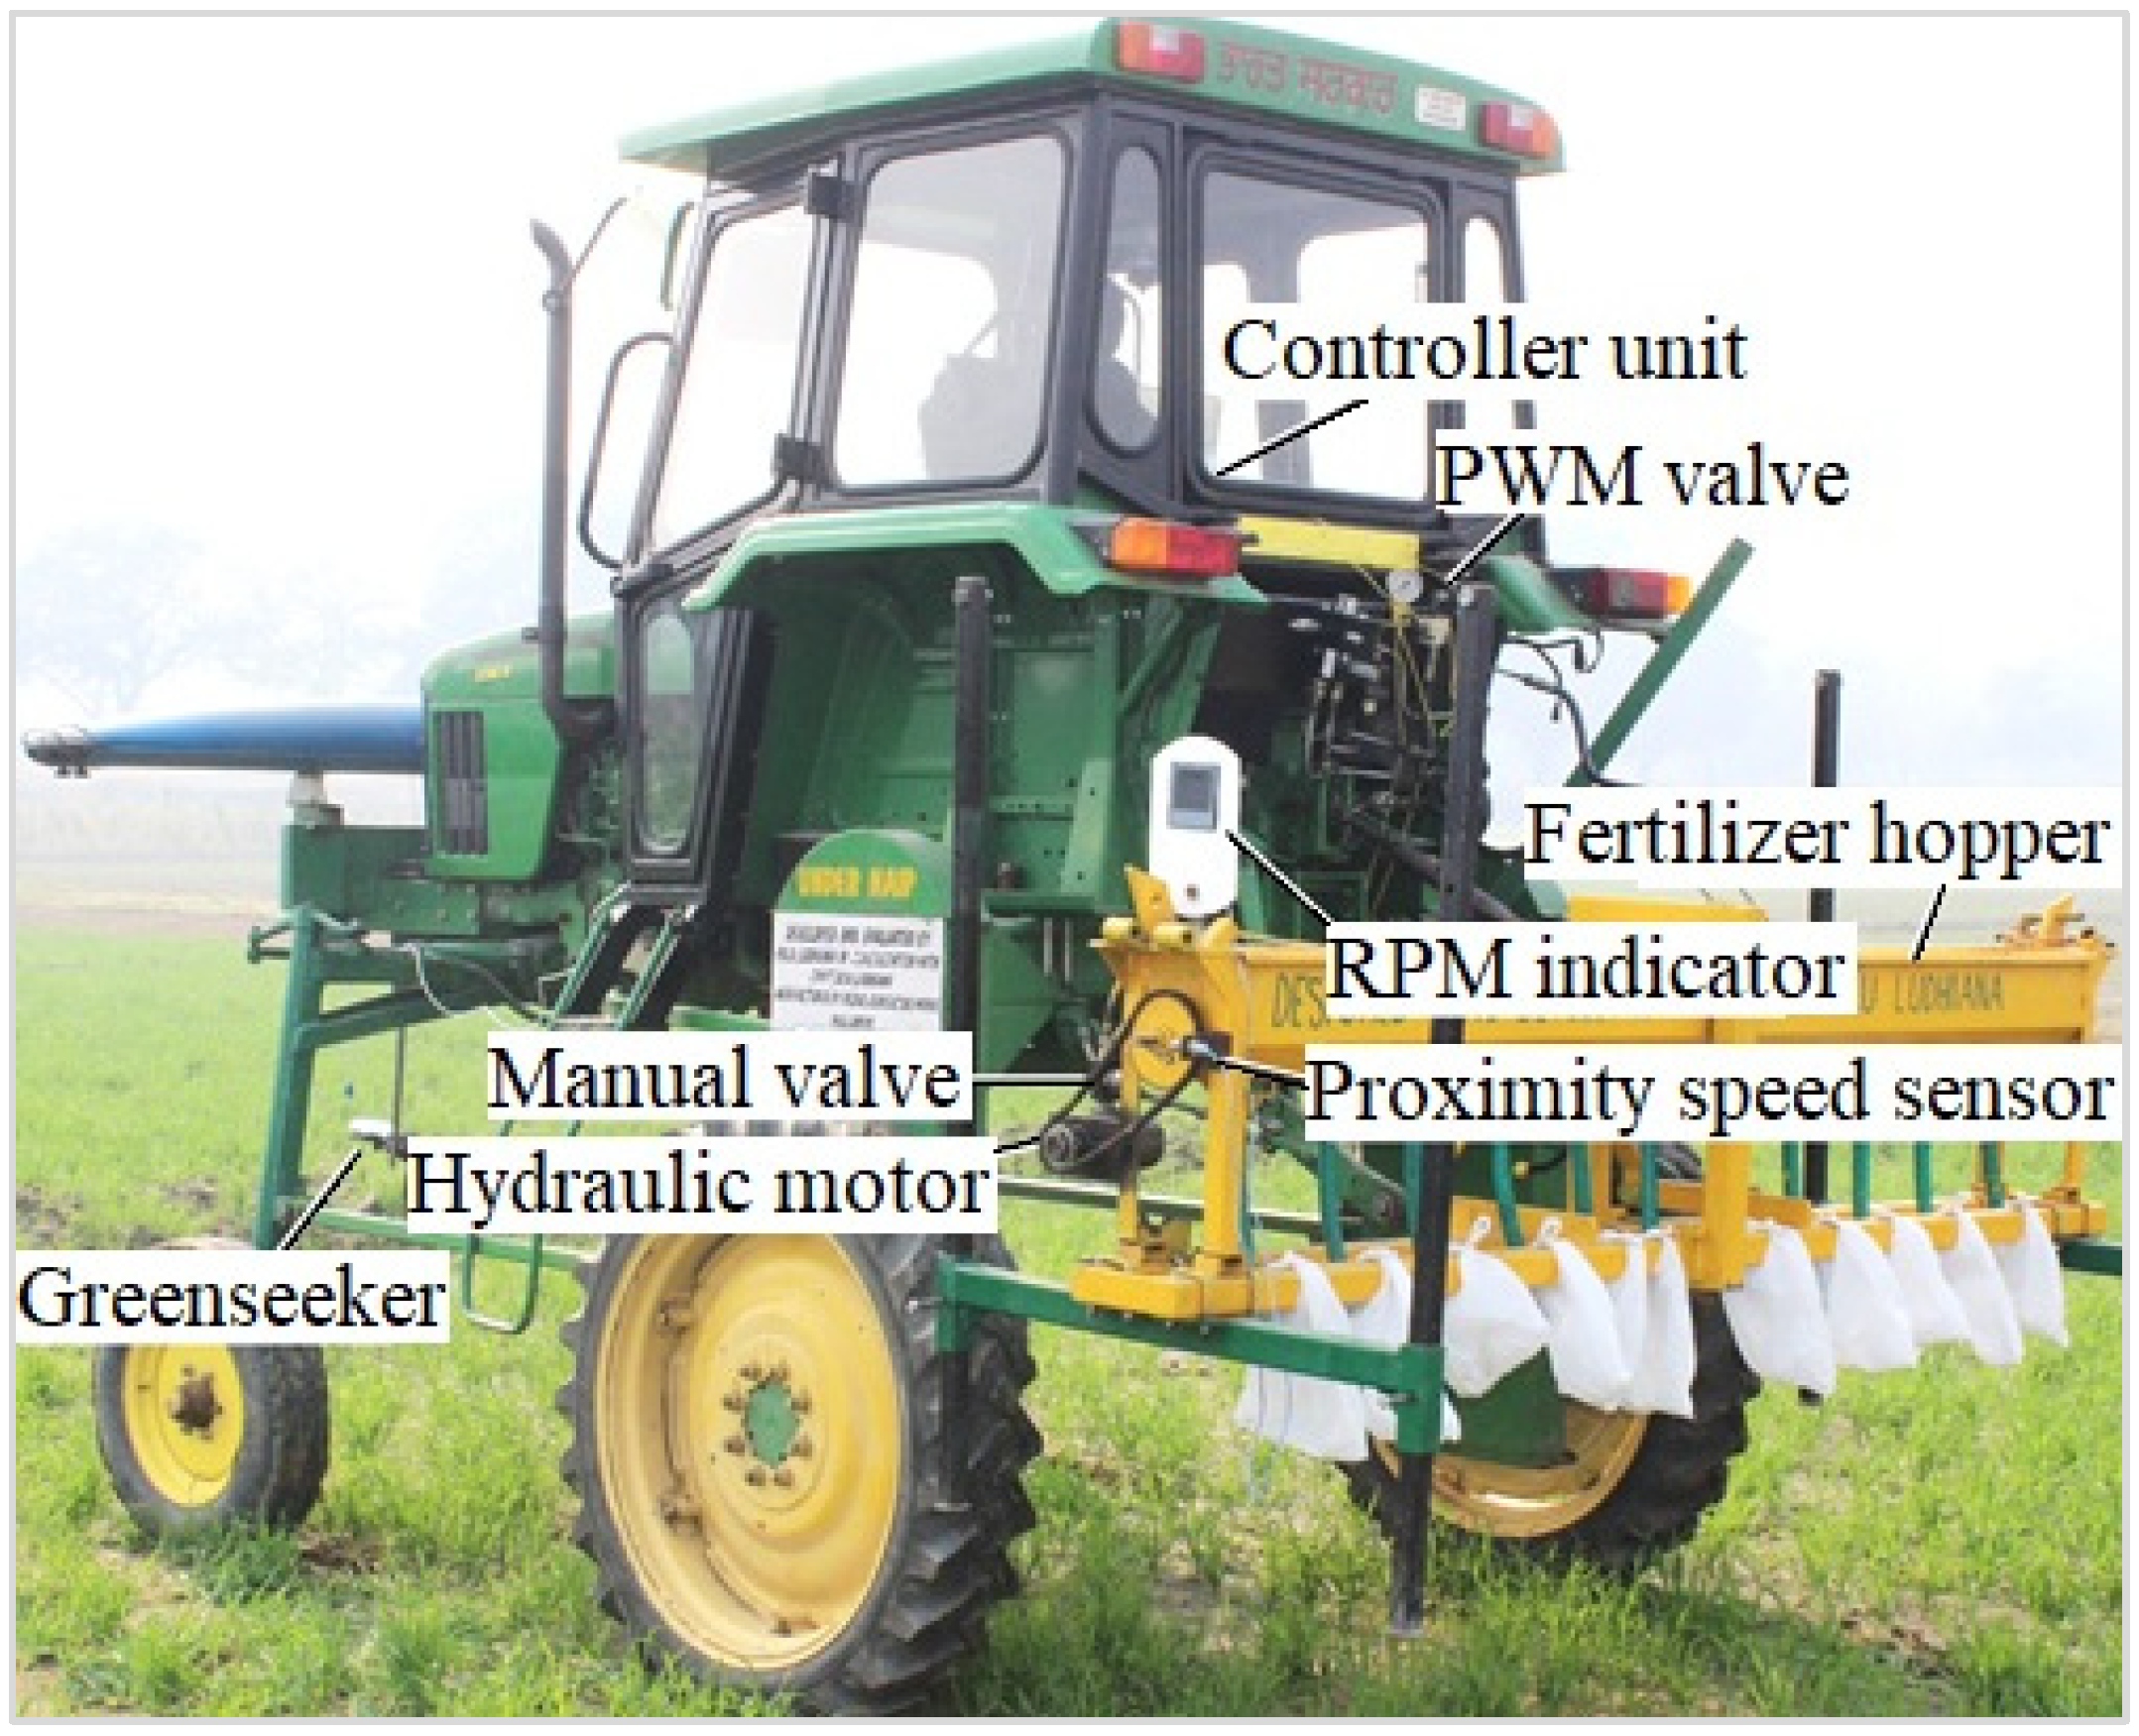
2.1. Description of the VRT System

The schematic diagram of the automatic VRT system is shown in Figure 1. The system consisted of: (a) a Greenseeker, (b) a controller unit using Arduino Uno and Raspberry Pi board, (c) a PWM valve (d) a hydraulic circuit, (e) a hydraulic motor, (f) an indicator for sensing the rotational speed of the drive shaft, and (g) a fluted-rollers-type metering mechanism (Figure 2). In this experiment, to attain different fertilizer rates with a constant tractor speed, an 11-row zero-till seed cum fertilizer drill was used. It was tractor-operated and included fluted rollers as well as a changeable lever for fertilizer discharge, with the capability to vary the drive shaft speed of the metering mechanism. The total operating width of the applicator was 2.2 m, including the 0.2 m space between outlets. A high-clearance tractor with power of 35 HP, already developed in the Farm Machinery department of PAU, was used as the prime mover for the Greenseeker, which was mounted on the front of the tractor. The main parts of the applicator included a tubular steel section frame, a fertilizer hopper, and a fluted-roller-type metering mechanism. To drive the shaft of the metering mechanism, the tractor’s hydraulic system was used as a power source through sprockets, a chain, and a power transmission system via a hydraulic motor located on front side of the applicator. The field capacity, field efficiency, and fuel consumption of the machine were 0.3–0.4 ha h−1, about 75%, and 5.5 L h−1, respectively. The applicator cost about USD 700 to construct. The urea fertilizer that was used for the present study contained, on a dry basis, a minimum of 46% total nitrogen by weight, a maximum of 1.0% moisture by weight, and a maximum of 1.5% biuret by weight. Particle size was such that not less than 90% of the material was intended to pass through a 2.8 mm IS sieve, and not less than 80% by weight was intended to be maintained by a 1 mm IS sieve.

2.1.1. Mechanical System

One of the systems that is generally used for basal application of fertilizer consists of a fluted-roller-type metering mechanism attached to a seed drill. This system effectively facilitates a controlled variable rate of fertilizer application based on the requirements of the crop. Hence, the mechanical system was developed by using a fluted-roller-type metering mechanism, hopper, and outlet tubes. The major component in the mechanical system was designing the fluted-roller-type metering mechanism for variable-rate application of granular fertilizer.
For developing an NDVI-based variable-rate applicator, an existing fluted roller used in seed drills was selected for conversion into a variable-rate applicator for fertilizer. The furrow openers were eliminated from the drill and tubes were attached to control the flow of the fertilizer from the box to the crop. The fluted roller fixed in the applicator had 11 flutes. There are two potential ways to vary the fertilizing rate using a fluted feed roll type zero-till seed cum fertilizer drill: (a) varying the dynamic feed-roll length and/or (b) varying the fertilizer fluted drive-shaft speed. A variable-rate fertilizer applicator was developed by enhancing a controller system with the intention of controlling the speed of the fluted-roller-metering system, in order to vary the fertilizer discharge rate based on the NDVI readings on the go. The rate of fertilizer was varied by changing the speed of the fluted shaft via a hydraulic motor. The hydraulic motor was fixed at the end of one side of the fluted roller shaft to rotate it. The fluted metering roller was chosen as the fertilizing component, which regulates the amount of fertilizer discharged based upon its rpm, as controlled by the hydraulic system.

2.1.2. Hydraulic System

The hydraulic system used to link the controller system via the hydraulic motor to the fluted-roller drive shaft to vary the fertilizer rate. The oil provided through the hydraulic pump of the tractor was usually delivered at a pressure of 13.78 to 20.68 kPa. The hydraulic motor selected for the system had a maximum power output of 16.1 kW. It had a maximum shaft speed of 480 rpm, and its torque ranged from 280 to 370 Nm. The motor transported the flow between pressure limits of 0.69 to 22.48 kPa, with a volume flow rate ranging from 9 to 19.8 L/min.

2.1.3. N-Sensing System

The sensing unit for plants consisted of a sensor or several sensors in groups with small electronic tools that permit the signal processing and interaction with any computer or device. Green crops absorb mostly red light and reflect mostly infrared light. The comparative advantage of using distinguished light is that it is a direct reflection of the concentration of the greenery in the sensor’s sight. The distinction between the reflected light signals is larger if the crop is darker and stronger. The sensing unit consists of a N sensor, a controller system to process the signal, and a triggering system for output. The Greenseeker handheld sensor (Trimble Inc., Sunnyvale, CA, USA) was used in this study as a N sensor. It is an active sensor with 660 and 780 nm wavelengths, which emits red and infrared light and then measures the amount of each type of light that is reflected from the plant. It was made to be used from a distance of 0.60–1.2 m height above the crop canopy and to sense a 0.25–0.50 m wide field zone. The sensor continues to sample the scanned area if the trigger remains engaged up to 60 s, and then it gives an average value of all readings. The sensor displays the measured value in terms of an NDVI reading (ranging from 0.00 to 0.99) on its LCD display screen. The NDVI was based on reflectance by the plant in Infra-Red (IR) and Near Infra-Red (NIR) regions as follows:
NDVI = (NIR − Red)/(NIR + Red)
As NDVI measures photosynthetic activity, it is also correlated positively with chlorophyll content and, in turn, nitrogen levels in plants.

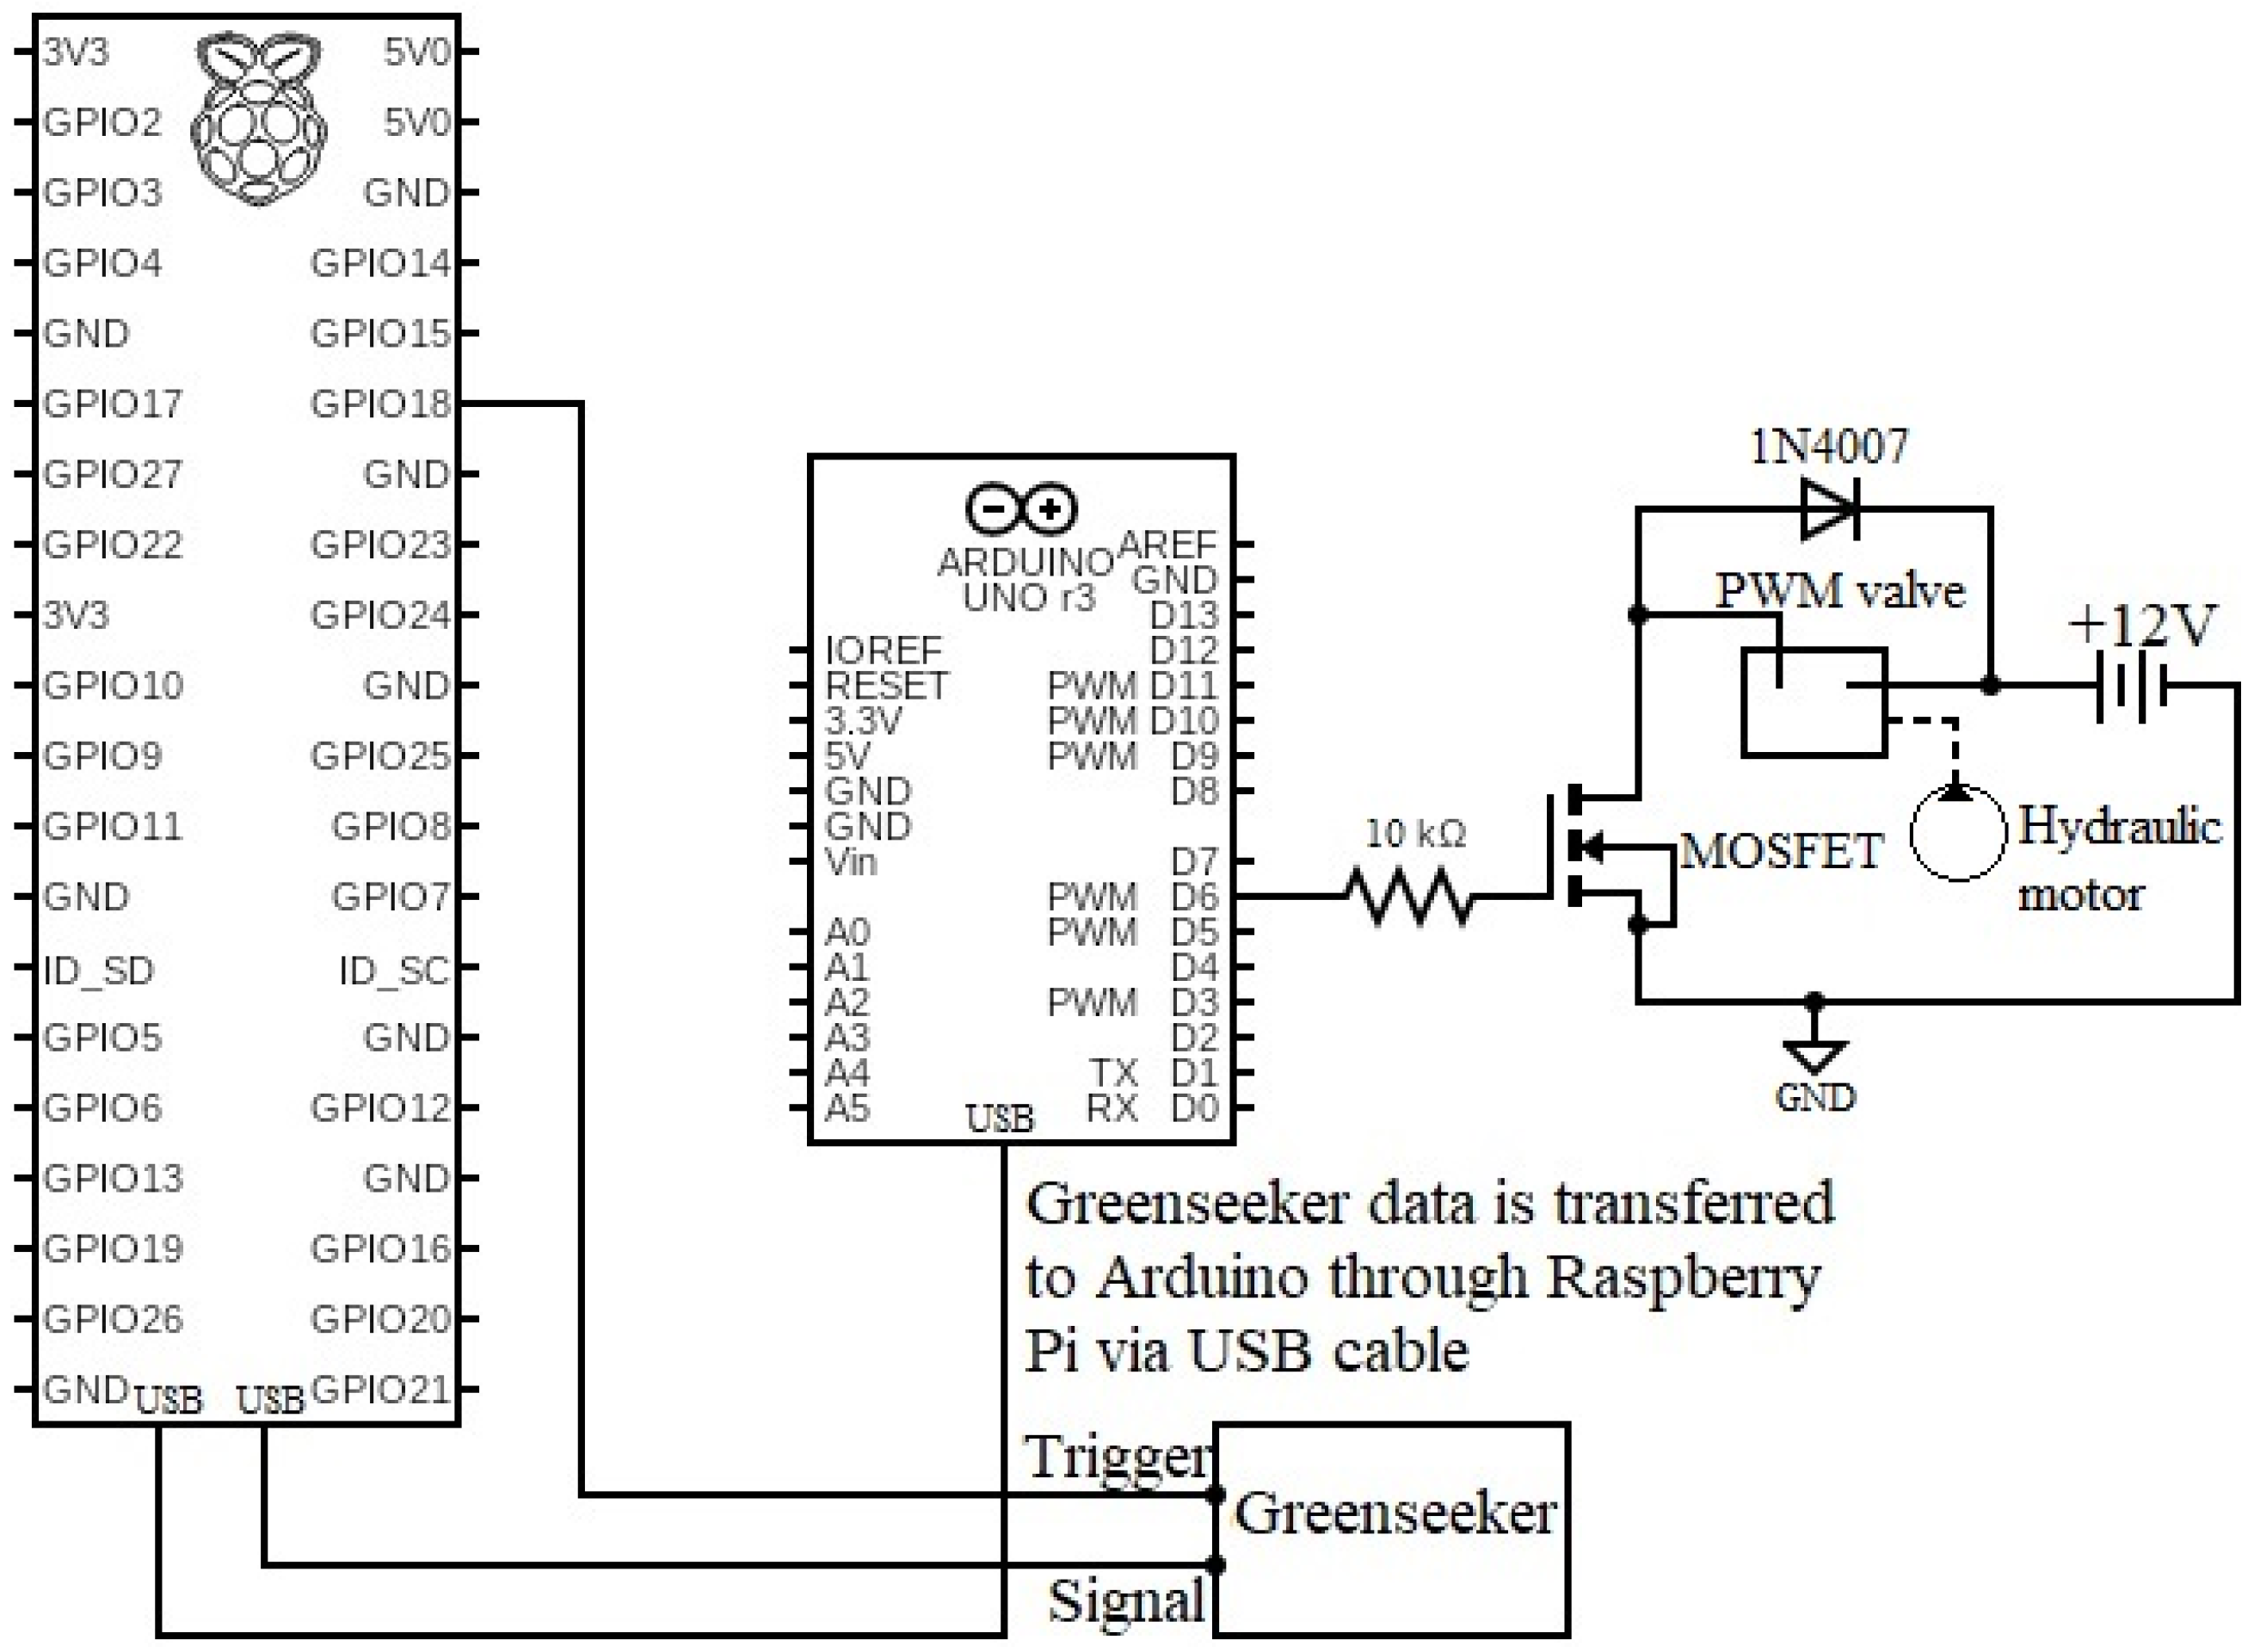
2.1.4. Controller System

To process the NDVI data from the N sensor and regulate the control unit/PWM valve, a controller-based embedded system is required. The Greenseeker is directly connected to the controller system, which further gives commands to the PWM valve. The PWM valve controls the oil flow rate, which then varies the hydraulic motor speed. The hydraulic motor changes the speed of the fluted-roller shaft, to apply fertilizer as per the signal given by the Greenseeker for variable application of inputs. A schematic diagram of the VRT controller system is shown in Figure 3.
The Raspberry Pi 3 B+ (Raspberry Pi Foundation, Cambridge, UK) was coded in Python. The code specified the segregation of the NDVI values from the Greenseeker and then transmitted them to the Arduino board. The Arduino’s microcontroller (ATMEGA 328P, Atmel, San Jose, CA, USA) was coded in C. Its code processed the received values and generated a PWM signal according to the valve-control circuit. To generate PWM pulses, the average voltage is powered via battery-operated, effective time, and pulse cycle, using Equation (2) [170]:
Va = (te/T) × Vs = αVs
where Va is the average voltage (V); te is the effective time (s); T is the pulse cycle (s); α is the duty cycle; and Vs is the max voltage determined via the battery-operated (V).
The PWM values varied linearly and inversely with the received NDVI data from the Greenseeker. Therefore, the rotational speed of the hydraulic motor also varied linearly but inversely with the NDVI from the Greenseeker. Essentially, varying the α in Equation (2) means that varying the application rate.
The VRT applicator was developed to apply the fertilizer as per the requirement based upon crop N status, represented by the NDVI as measured by the Greenseeker. To adjust NDVI data into real time crop N status, a Greenseeker algorithm theory has been adapted from the Nutrient Management Spear Program of Cornell University [171]. In this algorithm, crops with a low NDVI less than 0.35 receive a small amount of N, as only a slight growth response is expected (minor growth because of other causes than N deficiency). When NDVI data rise beyond 0.35 into the mid-range, N suggestions rise, as a growth response to additional N is probable. Third, crop-production response to N no longer rises once NDVI is beyond 0.75. Fourth, N suggestions reduce with rising NDVI, since they are estimated to already have enough N for ideal crop growth. Hence, the variable-rate applicator was designed for application of N in the crops with an NDVI ranging from 0.35 to 0.75.

Variation in Metering-Mechanism Drive-Shaft Rotational Speed of the Variable-Rate Applicator with NDVI of Crop

The speed of the drive shaft was varied with respect to NDVI values provided through Greenseeker, based on Greenseeker algorithm theory, which was discussed in the controller-system section [171]. The drive-shaft rotational speed of the metering mechanism was used to vary the rotational speed from 0 to 40 rpm, as NDVI varied from 0.75 to 0.35. This was because a higher NDVI (maximum NDVI = 0.75) represents a healthier crop, and less fertilizer (minimum = 0 rpm) is required by the crop. Likewise, the lower the NDVI (minimum NDVI = 0.35), the more fertilizer (maximum = 40 rpm) is needed by the crop [71].

2.2. Field Evaluation of the VRT System

A real-time variable-rate fertilizer applicator was evaluated at the Research Farm of the Department of Farm Machinery and Power Engineering at Punjab Agricultural University (PAU), Ludhiana, India. The goal was to assess the amount of granular urea fertilizer discharged and see how well this aligned with the amount expected, based on the algorithm.
The amount of N fertilizer recommended by the university for rice crop was 225 kg ha−1. Fertilizer was applied at 5 different stages: basal dose, first dose 10 days after transplanting (DAT), tillering (40 DAT), panicle initiation (60 DAT), and heading (80 DAT). Initially, 25 and 50 kg ha−1 fertilizer were manually applied as a basal dose and first dose, respectively. The remaining 150 kg ha−1 of the recommended fertilizer was applied in three equally split doses of maximum 50 kg ha−1 by the applicator, during the last three crop-growth stages. It means that the maximum targeted fertilizer of each split dose was 50 kg ha−1, and applicator was set to apply 0 to 50 kg ha−1 based on plant’s N status through N sensor and no more than that.
Before field evaluation, fertilizer-discharge rate was calibrated at different drive-shaft rotational speeds via an installed manual regulator valve in the hydraulic circuit, to determine application rate precisely. This valve controlled the oil-flow rate to generate a constant rotational speed of the hydraulic motor, which then controlled the fluted-roller drive-shaft rotational speed. The applicator lever, which manually regulated the rate of fertilizer discharge, was placed in a fixed position at the maximum N discharge rate (50 kg ha−1). This coincided with the maximum rotational speed of the fluted-roller metering-mechanism drive shaft (40 rpm). To evaluate the fertilizer-discharge rate and the variation among the discharge tubes, four different drive-shaft rotational speeds (10, 20, 30, 40 rpm) were chosen. The speed of the tractor was fixed at 3 km h−1. At each rotational speed, with three replications, fertilizer was collected in poly bags placed under the discharge tubes. The application discharge rate was assessed in (g s−1) and then converted to a fertilizer rate (kg ha−1).

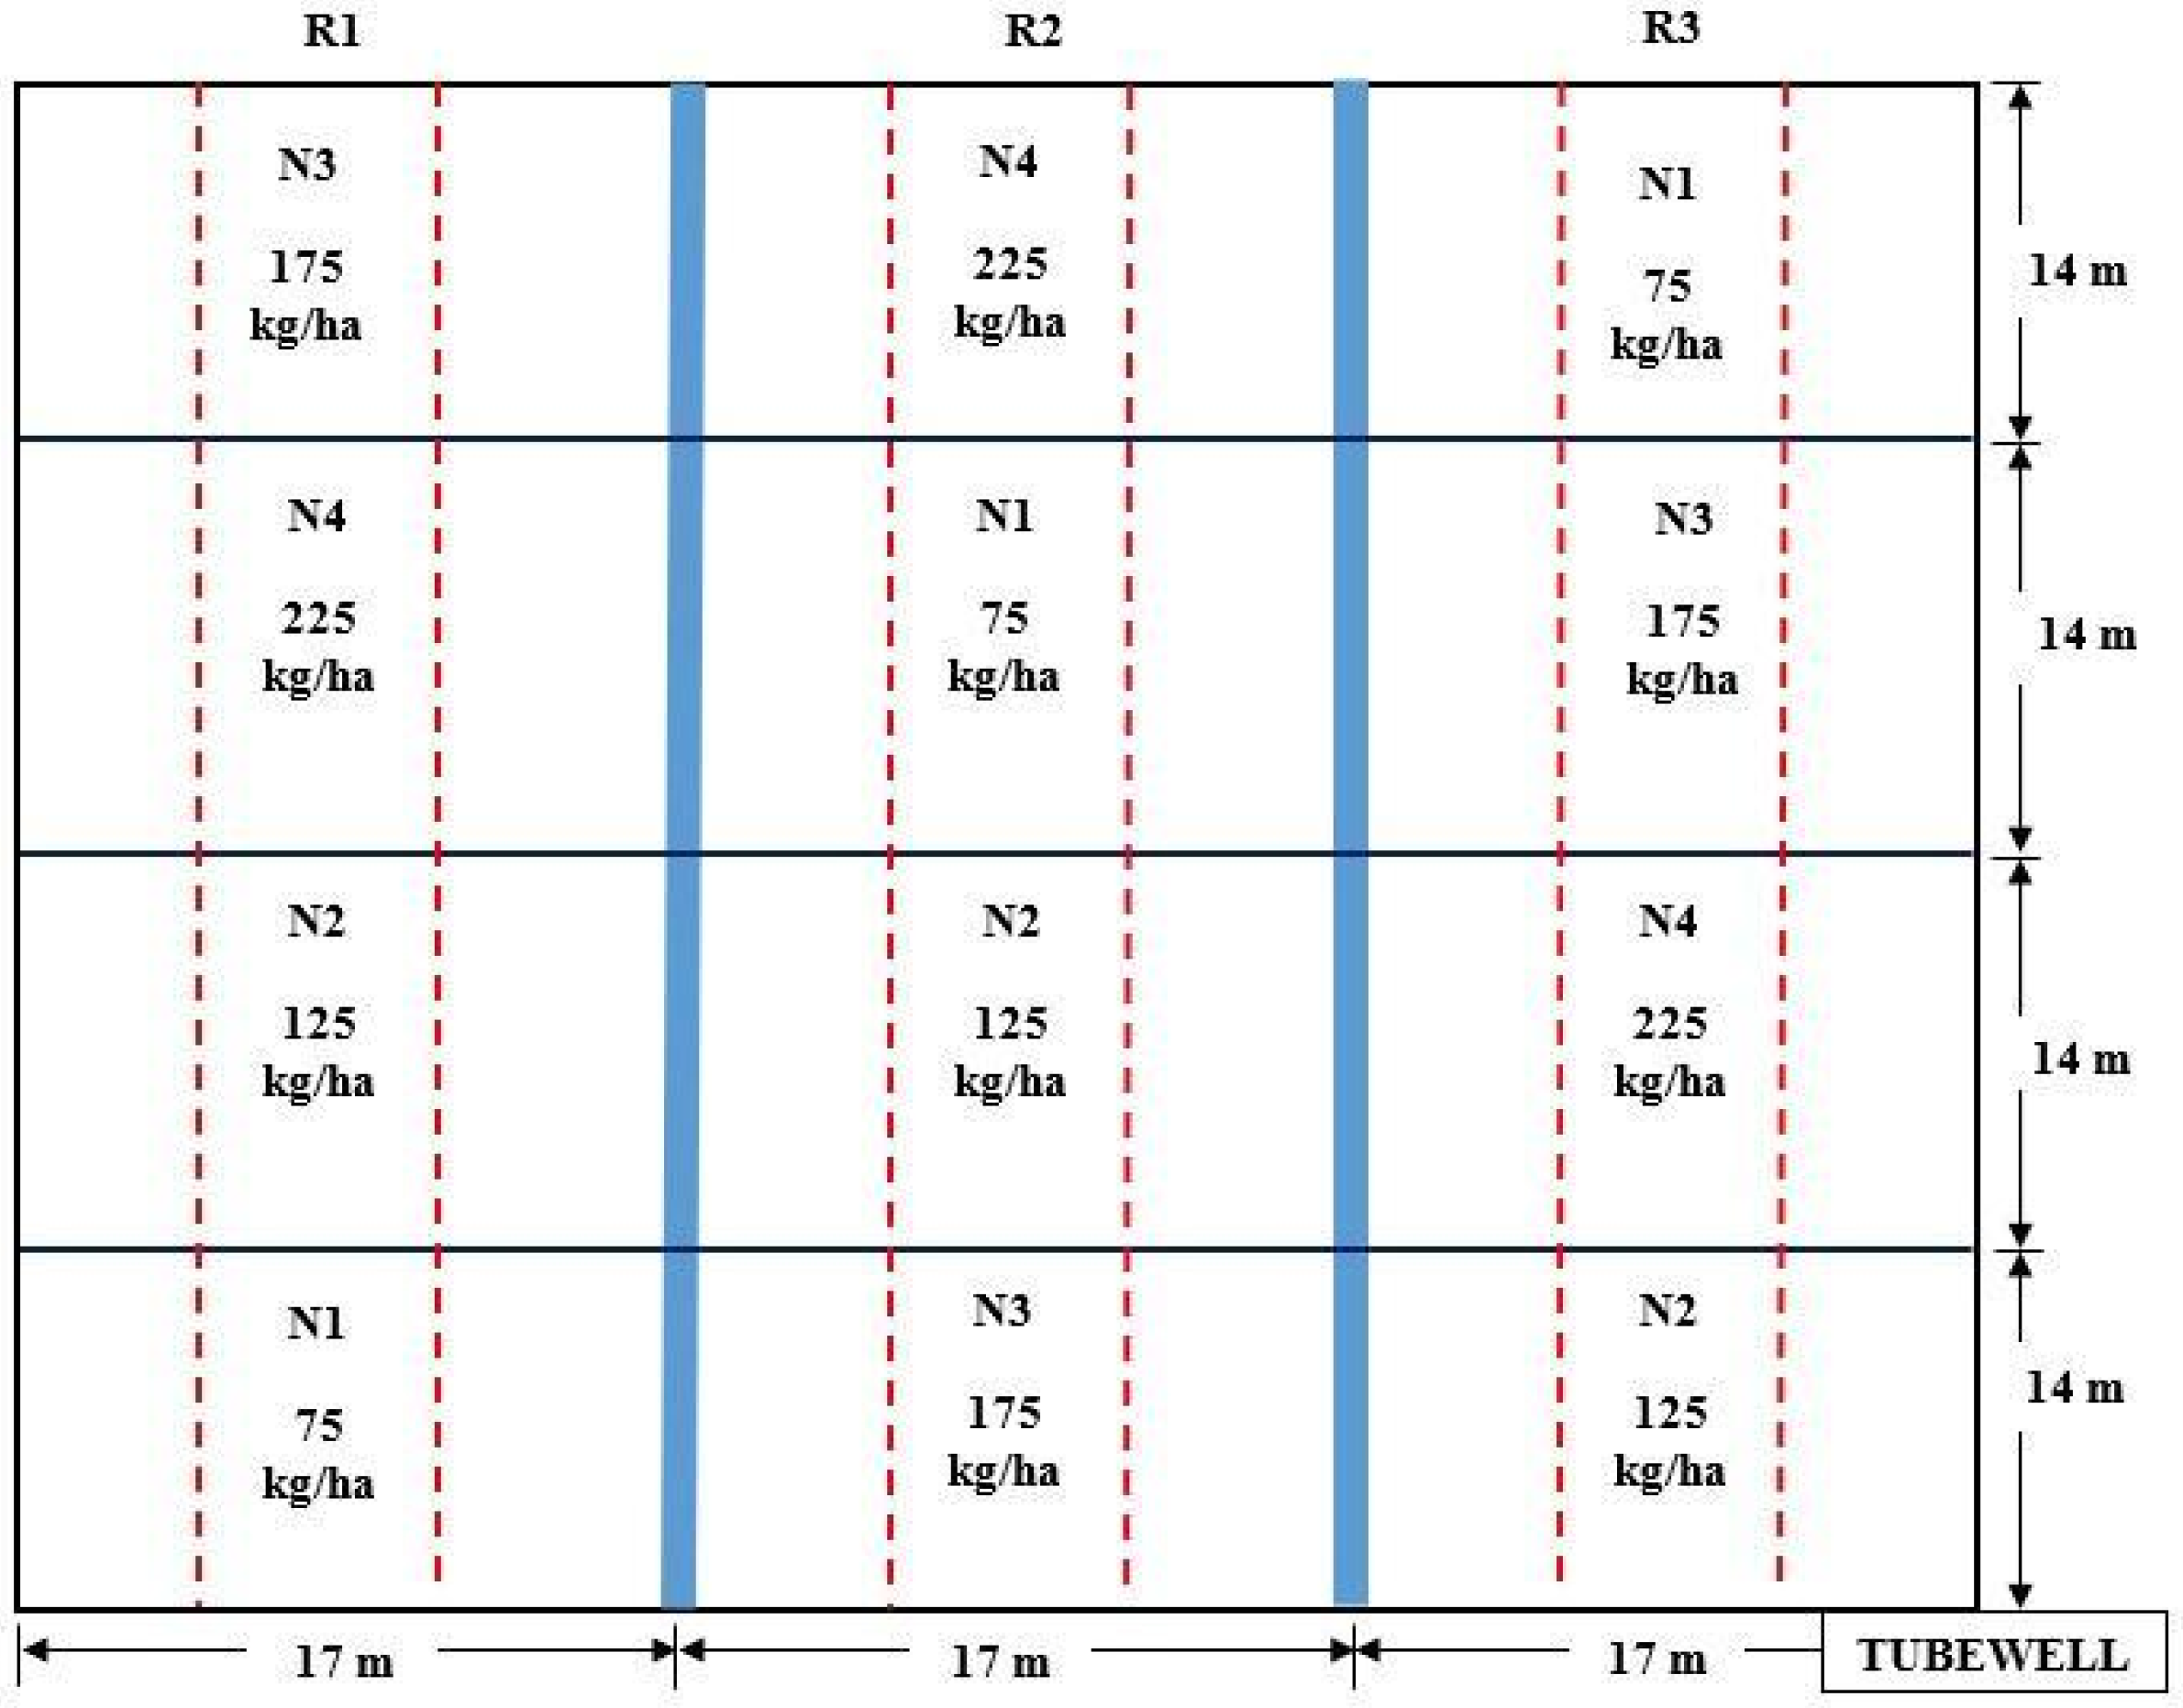
2.2.1. Experimental Design for Test Evaluation of Variable-Rate Fertilizer Applicator

The different independent parameters selected for the study were N level (N1 = 75, N2 = 125, N3 = 175, N4 = 225 kg ha−1), sensing height above crop canopy (40, 60, 80, 100 cm), and crop growth stages (40, 60, 80 DAT): tillering, panicle initiation, and heading. Response time(s) and amount of applied N fertilizer (kg ha−1) were the two dependent variables in the study.

2.2.2. Experimental Field

The developed applicator was field-evaluated for rice during the dry season of 2019–2020 (June–October) on a loamy soil with pH 7.3, organic C [172] 3.2 g kg−1, 0.5 M NaHCO3 extractable P [173] 6.4 mg kg−1, and NH4OAc extractable K [174] 58 mg kg−1 at the research farm of PAU, Ludhiana, India, at 30.91° N, 75.81° E and with an average elevation of 244 m. Ludhiana has a subtropical, semi-arid climate and experiences an average of 774 mm rainfall annually. Approximately 80% of the yearly rainfall happens during rice season. The average temperatures during rice season range from 23.4 to 37.4 °C. Soil samples with 15 cm depth were collected before rice transplanting for all 12 plots for a total area of 51 × 56 m2 and an individual plot area of 17 × 14 m2. The experiment in the field was laid out in a randomized complete block design, as shown in Figure 4. Treatments, namely different N levels and different crop-growth stages, were selected for the study. There were three replications for each treatment combination. The research field was divided into three replications, each with three paths for the applicator that were divided into four plots (17 × 14 m2). Within each replication, each plot was randomly assigned one of four levels of N fertilizer (N1 = 75, N2 = 125, N3 = 175, N4 = 225 kg ha−1). The N fertilizer was uniformly applied in accordance with the level assigned to each plot. In other words, before using the applicator, fertilizer was initially applied by hand in all the plots to produce manual variation in the research field (levels of N1, N2, N3, N4), in order to evaluate the VRT system’s performance in a field with varied fertilizer conditions. In this case, the basal doses of 25 kg ha−1 fertilizer were applied manually for all N levels. Ten days after transplanting, the first doses of 12.5, 25, 37.5, and 50 kg ha−1 were also applied manually for levels of N1, N2, N3, and N4, respectively. Thereafter, the second, third, and fourth doses were applied by the applicator.

2.2.3. Sensing Height

Sensing height was selected as one of the parameters for field evaluation of the variable-rate applicator. The sensor was mounted on a tractor and was intended to be used at different farm locations and at different crop growth stages. Therefore, evaluation of the sensor height above the crop canopy was deemed important. The manufacturer of the Greenseeker recommended a range of height between 60 to 120 cm from the crop canopy. To determine the optimal mounting height for this study, an experiment was conducted, which collected NDVI data at different heights from 40 to 100 cm. The experiment was conducted on two different rice fields at PAU, Ludhiana (field 1, 30.90° N, 75.80° E; field 2, 30.90° N, 75.81° E), with loamy soil and the same N level, at the panicle-initiation and tillering-crop-growth stages, respectively.
The sensor was evaluated for NDVI reading at heights of 40, 60, 80, and 100 cm above the crop canopy. The heights below 40 cm and above 100 cm from crop canopy were discarded, as the sensor showed error beyond the error close (EC) and error far (EF) ranges. The NDVI was measured by keeping the sensor parallel to ground, in accordance with the recommendation of the manufacturer [175], and the required height was maintained by measuring from the crop canopy using measurement tape held vertically. The duration of each reading was set for 10 s and 20 readings per position were performed. The distance walked and the walking speed were 10 m and 1 m s−1, respectively.

2.2.4. Crop-Growth Stages

Three growth stages were used in the study: tillering, panicle initiation, and heading, which corresponded to 40, 60, and 80 DAT, respectively. The Greenseeker was mounted on the tractor, allowing it to move through each plot, while keeping the sensor parallel to ground and maintaining the required height measurement. The readings were collected at each crop-growth stage. For each stage, data were taken from 5 different points of each plot. These were selected randomly and data were collected 3 times at each point in order to check the variability of N levels within plots.

2.2.5. Response Time Evaluation of the Real-Time-Variable Fertilizer Applicator

Data from two different crop samples with two different NDVI values, representing desired fertilizer rates of 12.5 and 50 kg ha−1, were used to manipulate the Greenseeker’s NDVI values, in order to evaluate response time of the applicator. Then, to vary the fluted-roller drive-shaft rotational speed from low to high and high to low (10 rpm to 40 rpm), the controller system received the Greenseeker’s NDVI values and sent a command signal to the PWM. As stated above, for low to high transition, a crop with an NDVI corresponding to 10 rpm was placed under the sensor to initiate the transition. Then, after the drive-shaft rotational speed became fixed at 10 rpm, a crop with lower NDVI, representing 40 rpm rotational speed of drive shaft, was placed under the Greenseeker to get the corresponding NDVI. The timer of a stopwatch was started at the initiation of the sensing, while the rpm indicator simultaneously monitored the change in rotational speed to show 40 rpm and stopped the timer. The opposite of this procedure was used to attain the response time for high to low transition.

2.2.6. Amount of N Fertilizer Applied by Applicator

The amount of N fertilizer applied by the variable-rate real-time fertilizer applicator was collected by placing poly bags under the fertilizer-discharge tubes, as the applicator was moved along the paths in each of the three replications. All fertilizer discharged by the applicator was initially collected in bags and measured before being applied directly. The applicator was used in this manner for all four plots in each replication, which each represented different levels of nitrogen. Therefore, the experiment was done for a total of 36 sections.
The experimental trials were laid out in a randomized complete block design, and the data obtained from the field were analyzed to determine the impact of both the independent parameters separately and of potential-interactions effects on the dependent variables (response time, amount of N). Statistical analysis software (SAS) was applied for the analysis of variance and operation of means.
The accuracy index was determined, in order to specify the percentage of fertilizer discharged rate error, with respect to expected fertilizer discharged rate, via the following formula:
E = ((| Fa − Fe |)/Fe) × 100
where Fa is the applied fertilizer rate (kg ha−1), Fe is the expected fertilizer discharged rate (kg ha−1), and E represents the overall implementation error (%).

3. Results

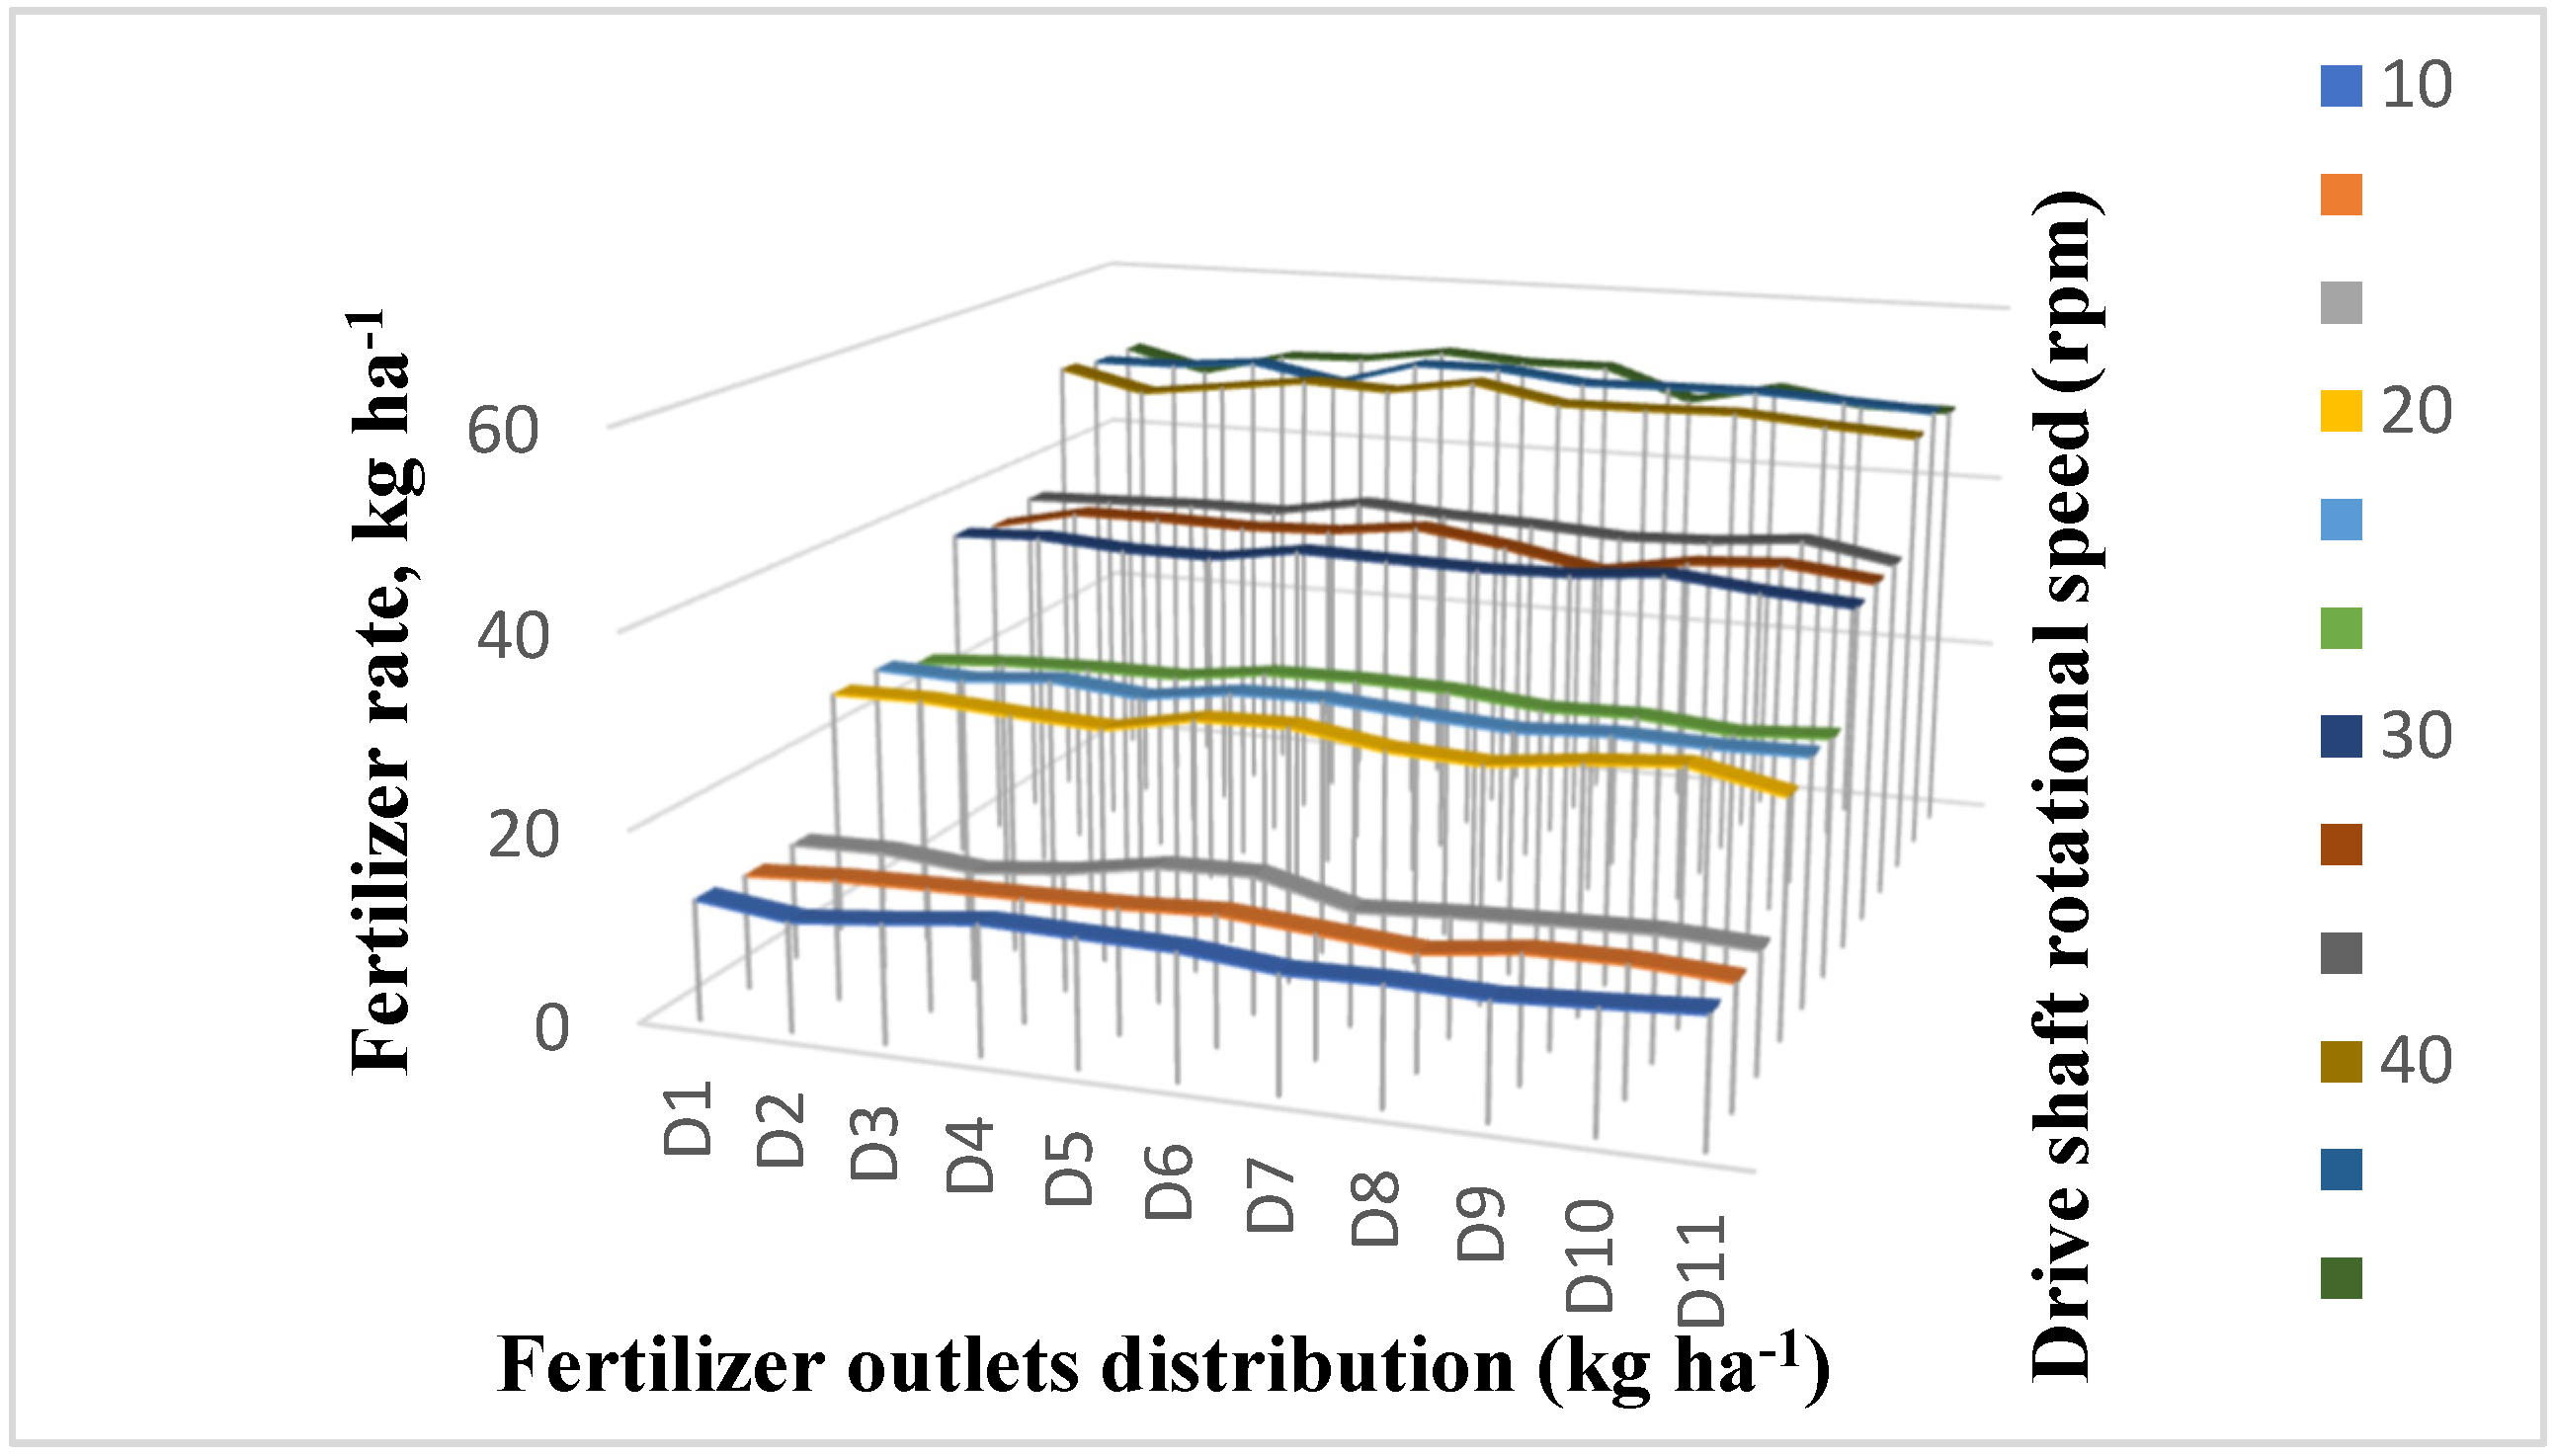
3.1. Accuracy of Fertilizer-Concentration Control

The data of the effect of fluted-roll drive-shaft rotational speed on urea fertilizer rate and variation among fertilizer outlets are depicted in Figure 5. Data showed that the effect of rotational speed on the application discharge rate was linear and that the CV of the urea fertilizer distributed by different outlets was low, ranging from 2.16% to 5.31%. This reaffirms what has been found in past research, that the fluted-roller-type mechanism had a lower variation (CV ranging from 2.16% to 5.31%) in applied fertilizer rate, as compared to the spinner-disc-type fertilizer applicator, which typically has a CV ranging from 20.0–50.0% [161]. Fertilizer rate at 10 rpm was the minimum, i.e., 12.59 kg ha−1, and was the maximum, 50.41 kg ha−1, at 40 rpm of the shaft speed. This fulfils the requirement of a variable-rate applicator developed to change the fertilizer rate, with the change in the shaft of the metering mechanism.
Variation in the urea fertilizer at different fluted-roller drive-shaft rotational speeds (rpm) among fertilizer-discharge outlets (D1 to D11) decreased with the increase in rpm. Variation in the urea fertilizer discharge rate reached its maximum at 10 rpm and its minimum at the maximum fluted-roller drive-shaft rotational speed (40 rpm). This may be due to the smooth flow of fertilizer, with the higher agitation provided at higher speeds of the shaft of the metering mechanism.
Data for the error of fertilizer distribution rate at different levels of drive-shaft rotational speed are shown in Table 1. The applicator accuracy was, regarding the application of the recommended fertilizer rate, for the maximum level of rotational speed i.e., 40 rpm, when the applicator had better accuracy, with an error of 0.83%, whereas for the other levels the error was between 1.68 to 4.92%, with the least accuracy for the drive-shaft rotational speed of 10 rpm. Overall, with an increase in rotational speed, applicator accuracy was slightly decreased. This may be because of the increase in the number of revolutions per minute for the condition of the physical mixture, increase in application rate, and unfinished filling of fluted roll slots at higher drive-shaft rotational speeds, which similarly was stated in previous research conducted by Reyes et al. [90] as well as Forouzanmehr and Loghavi [61].

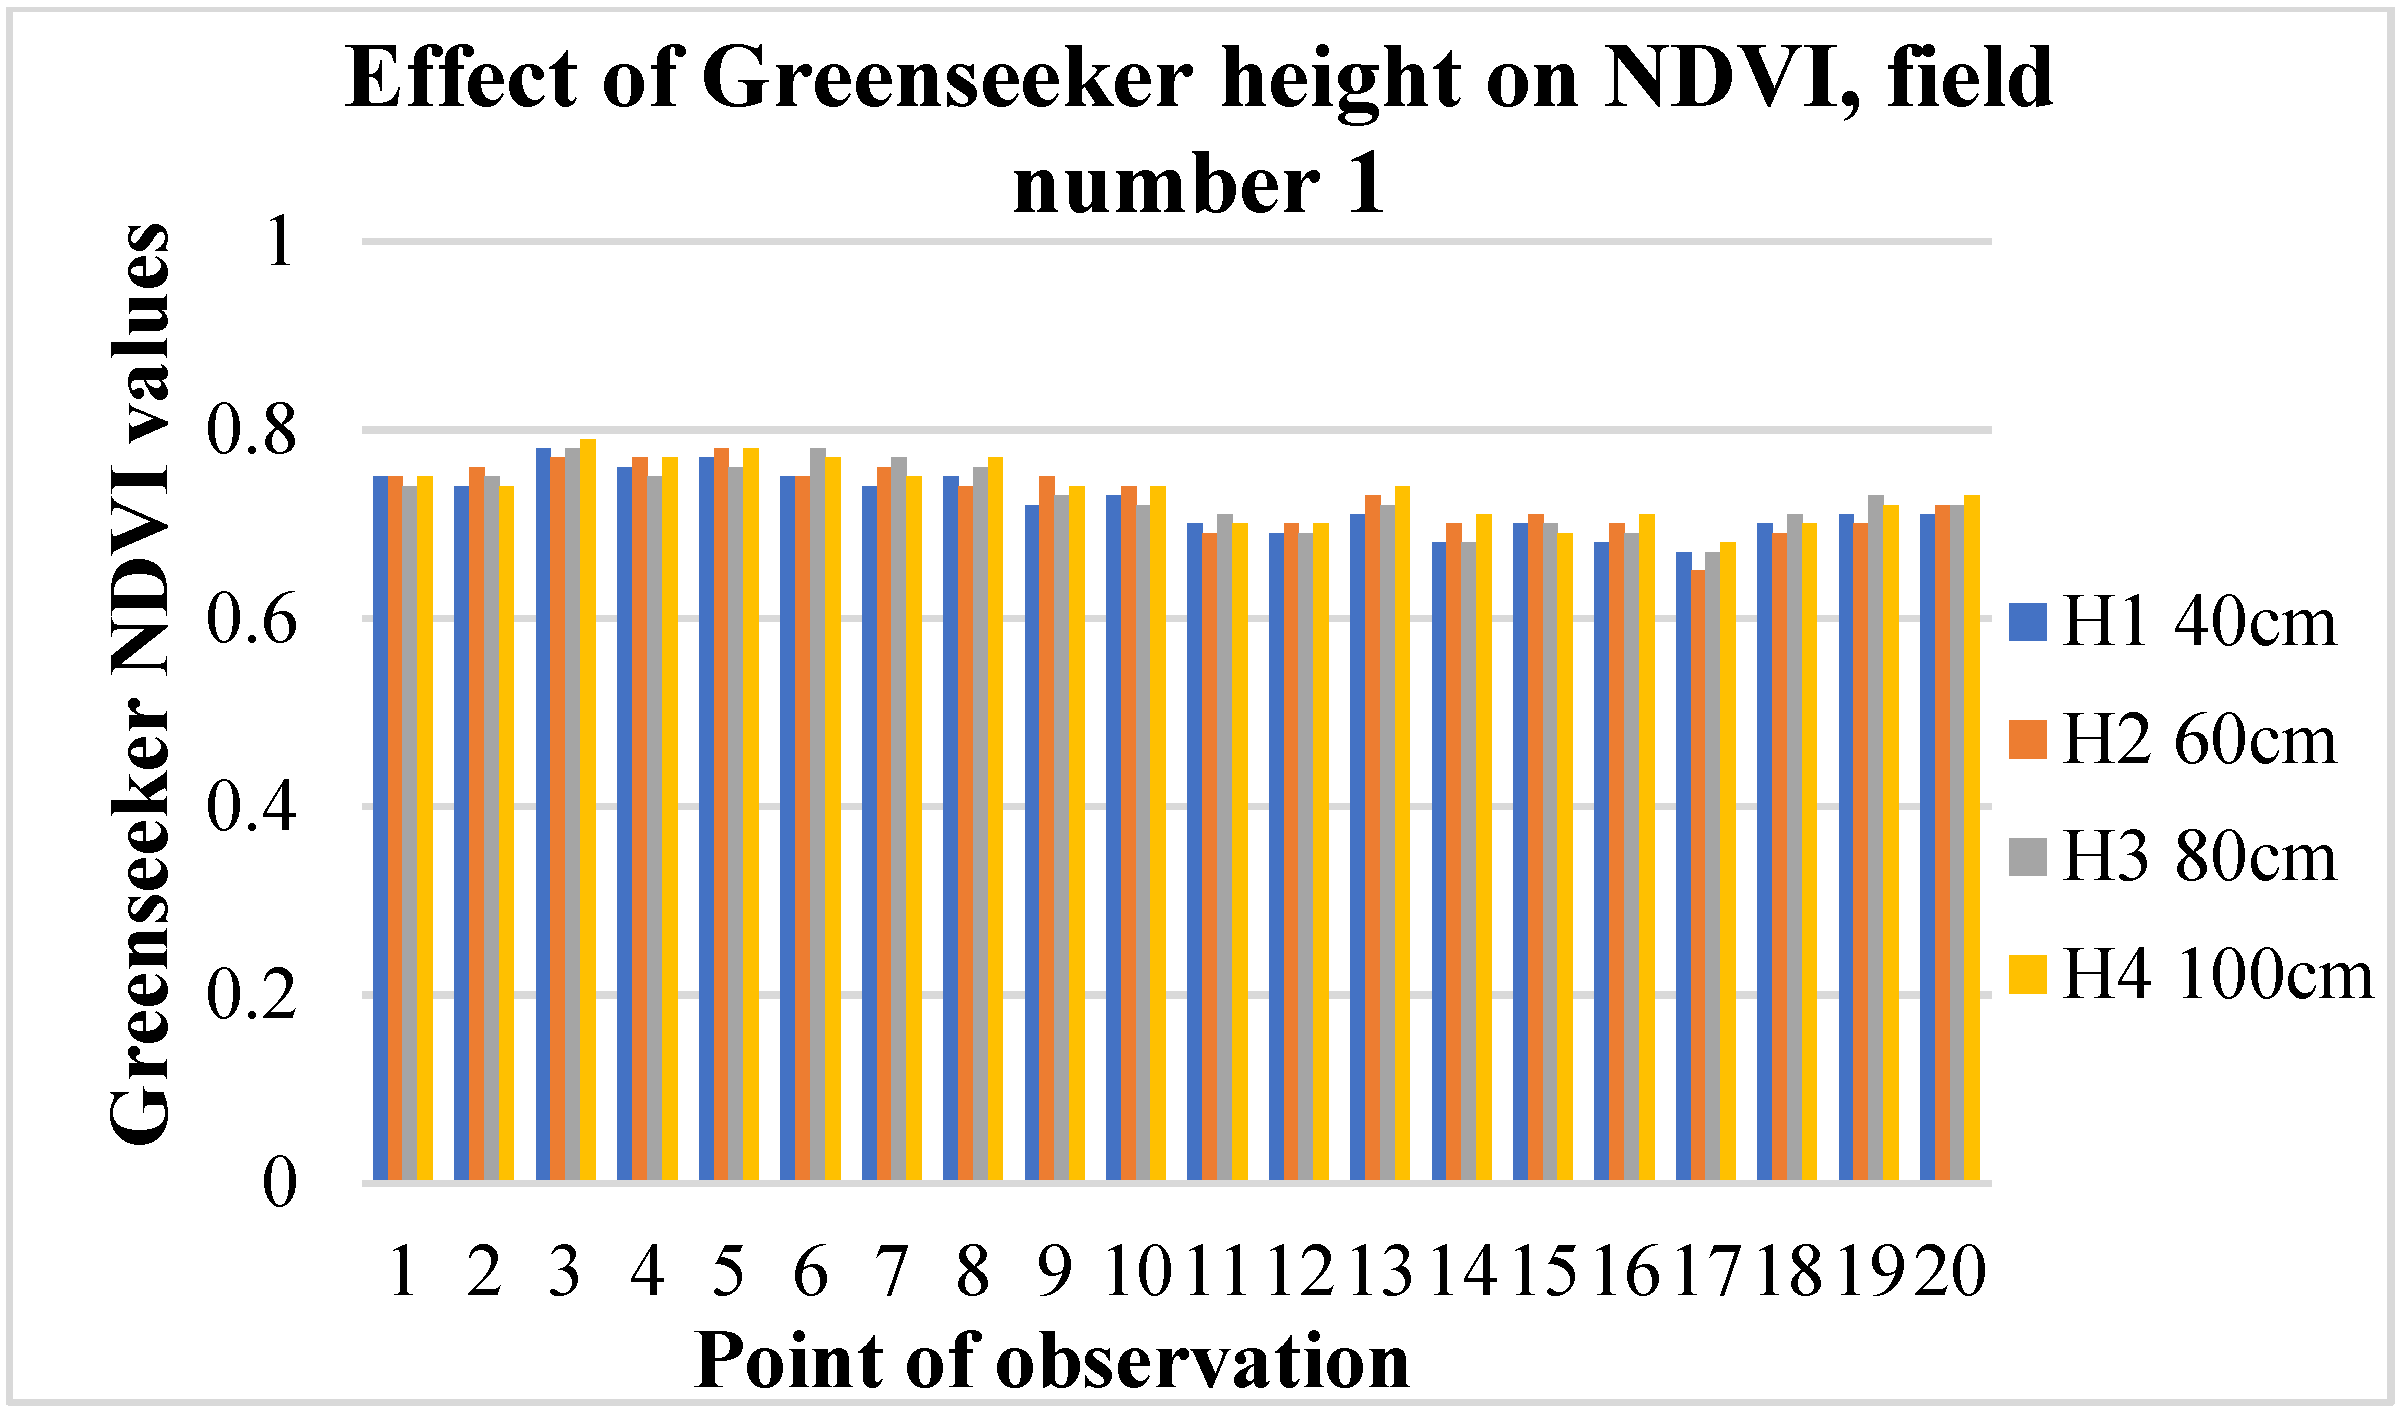
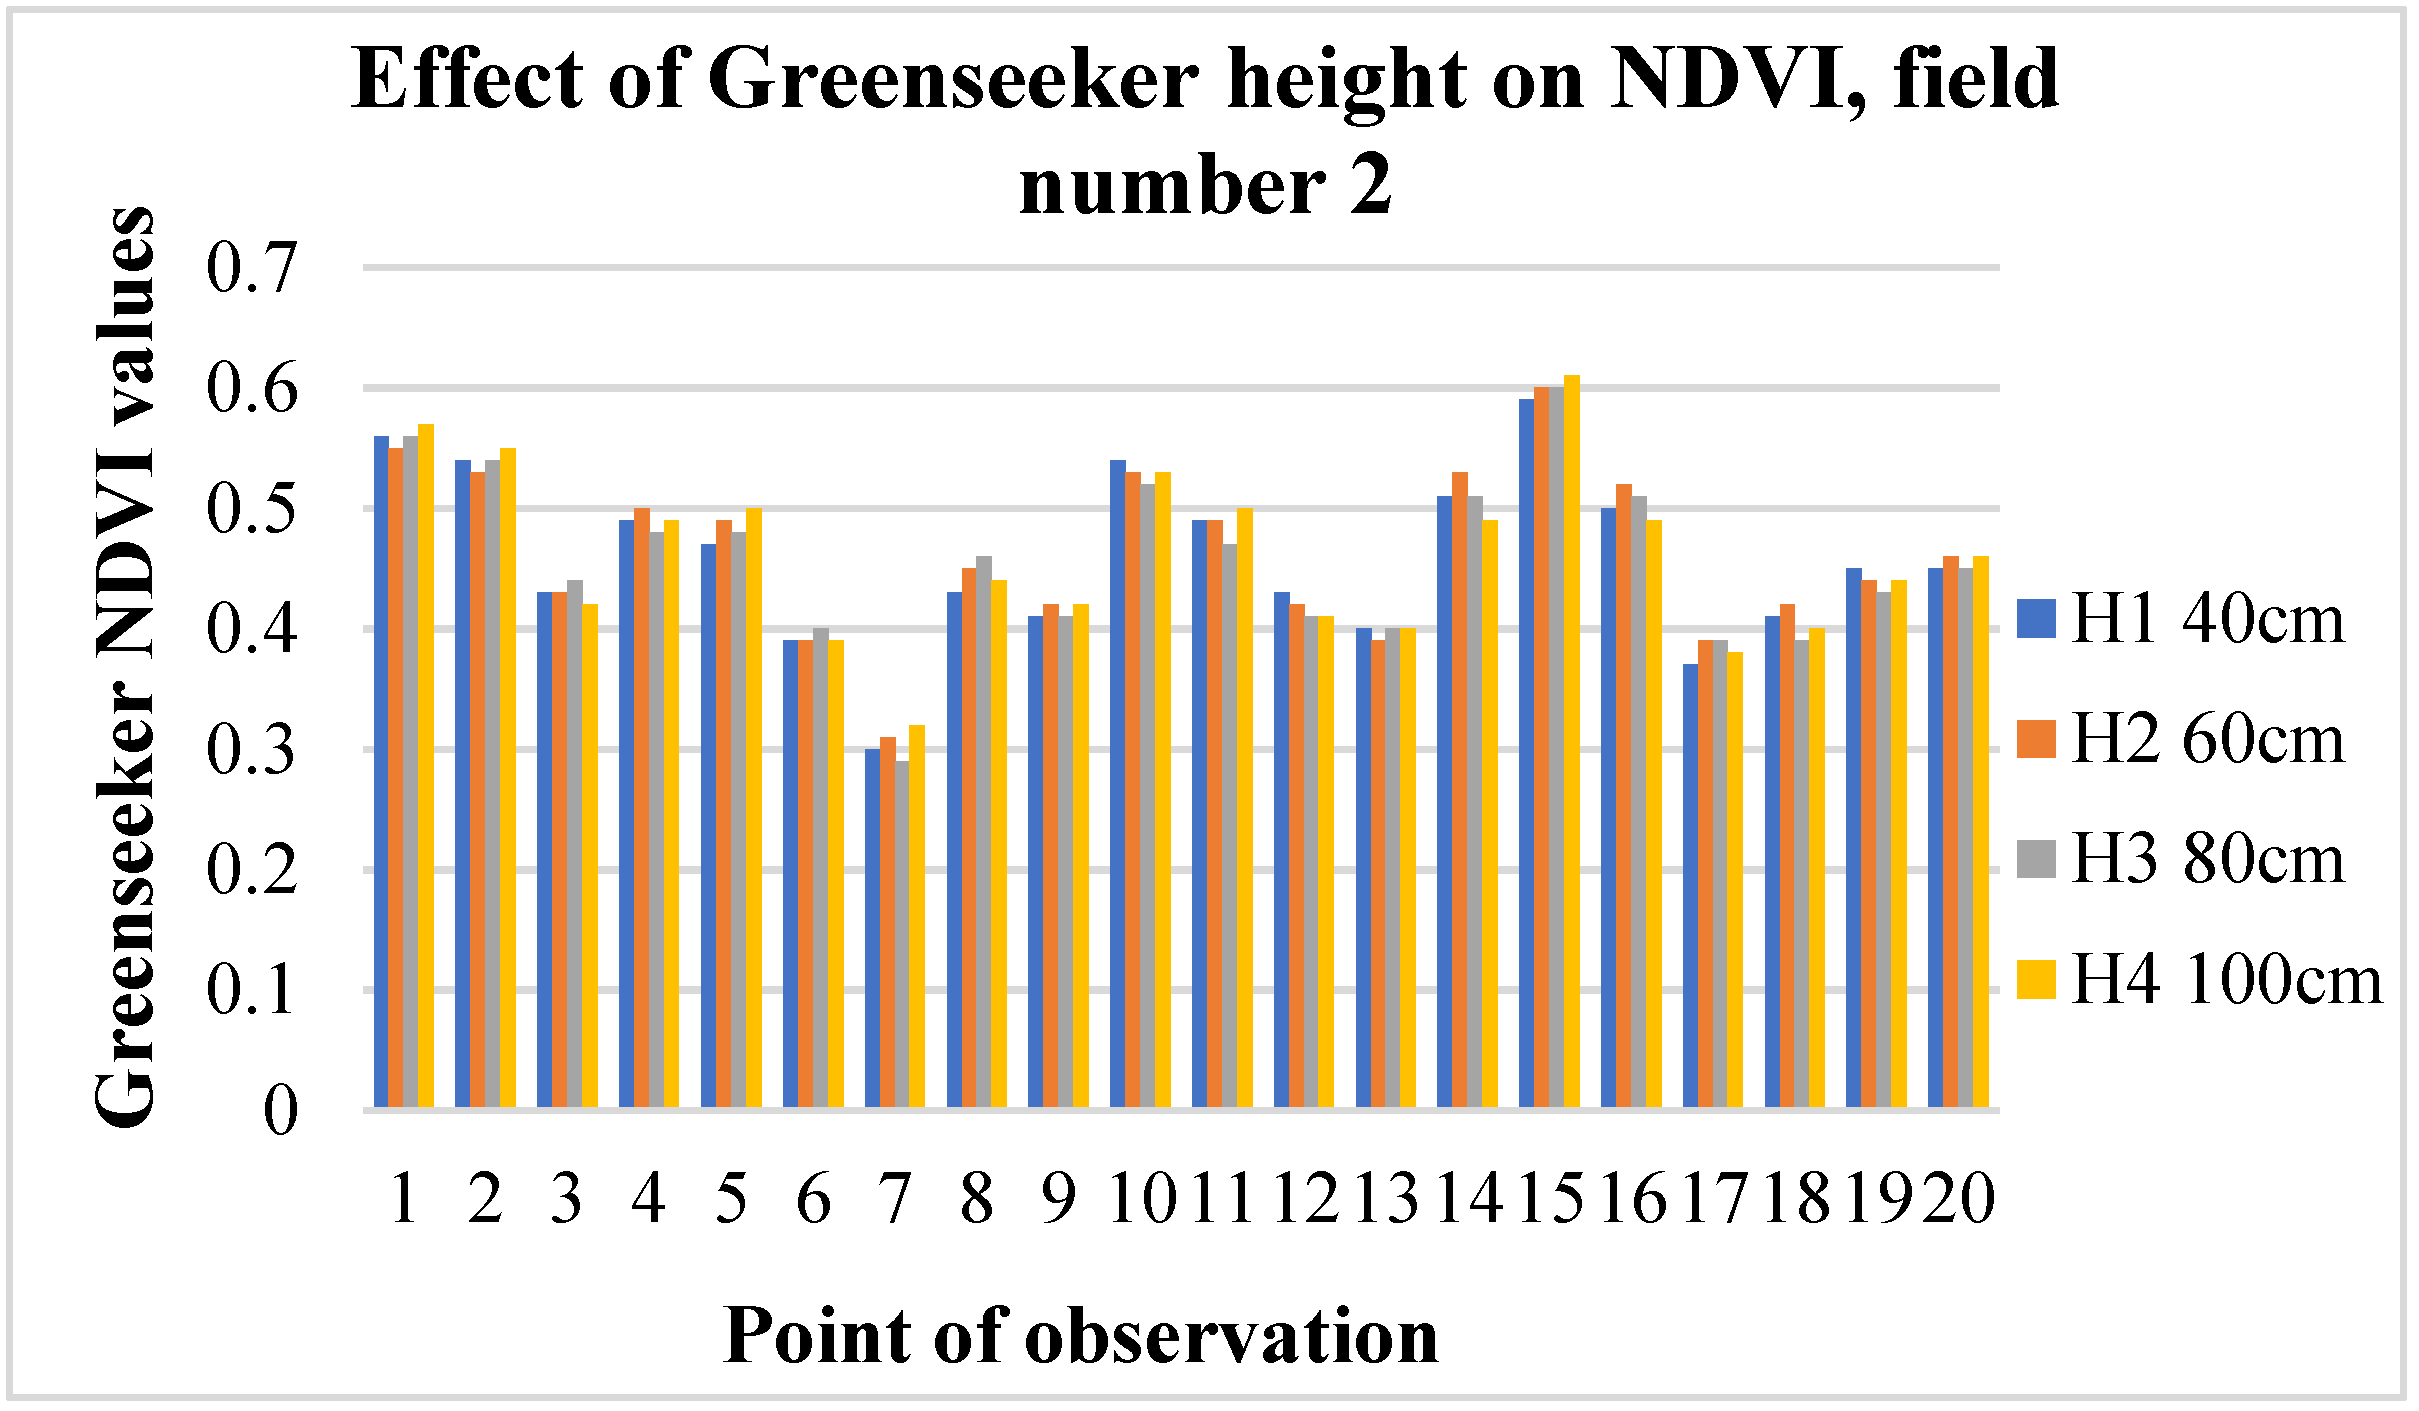
3.2. Effect of Greenseeker Height on NDVI

NDVI values recorded by the Greenseeker at different heights above the rice crop for field number 1 at the panicle-initiation crop-growth stage are shown in Figure 6.
Similarly, the NDVI values recorded by Greenseeker at different heights above the rice crop for field number 2 at the tillering crop-growth stage are shown in Figure 7. Statistical analysis revealed that the effect of height on NDVI was non-significant at the 5% level.
Based on the above discussion, it was concluded that NDVI was not affected by the height of the Greenseeker above crop canopy, which means the Greenseeker could be mounted on the tractor at any suitable height between 40 to 100 cm from the crop canopy.

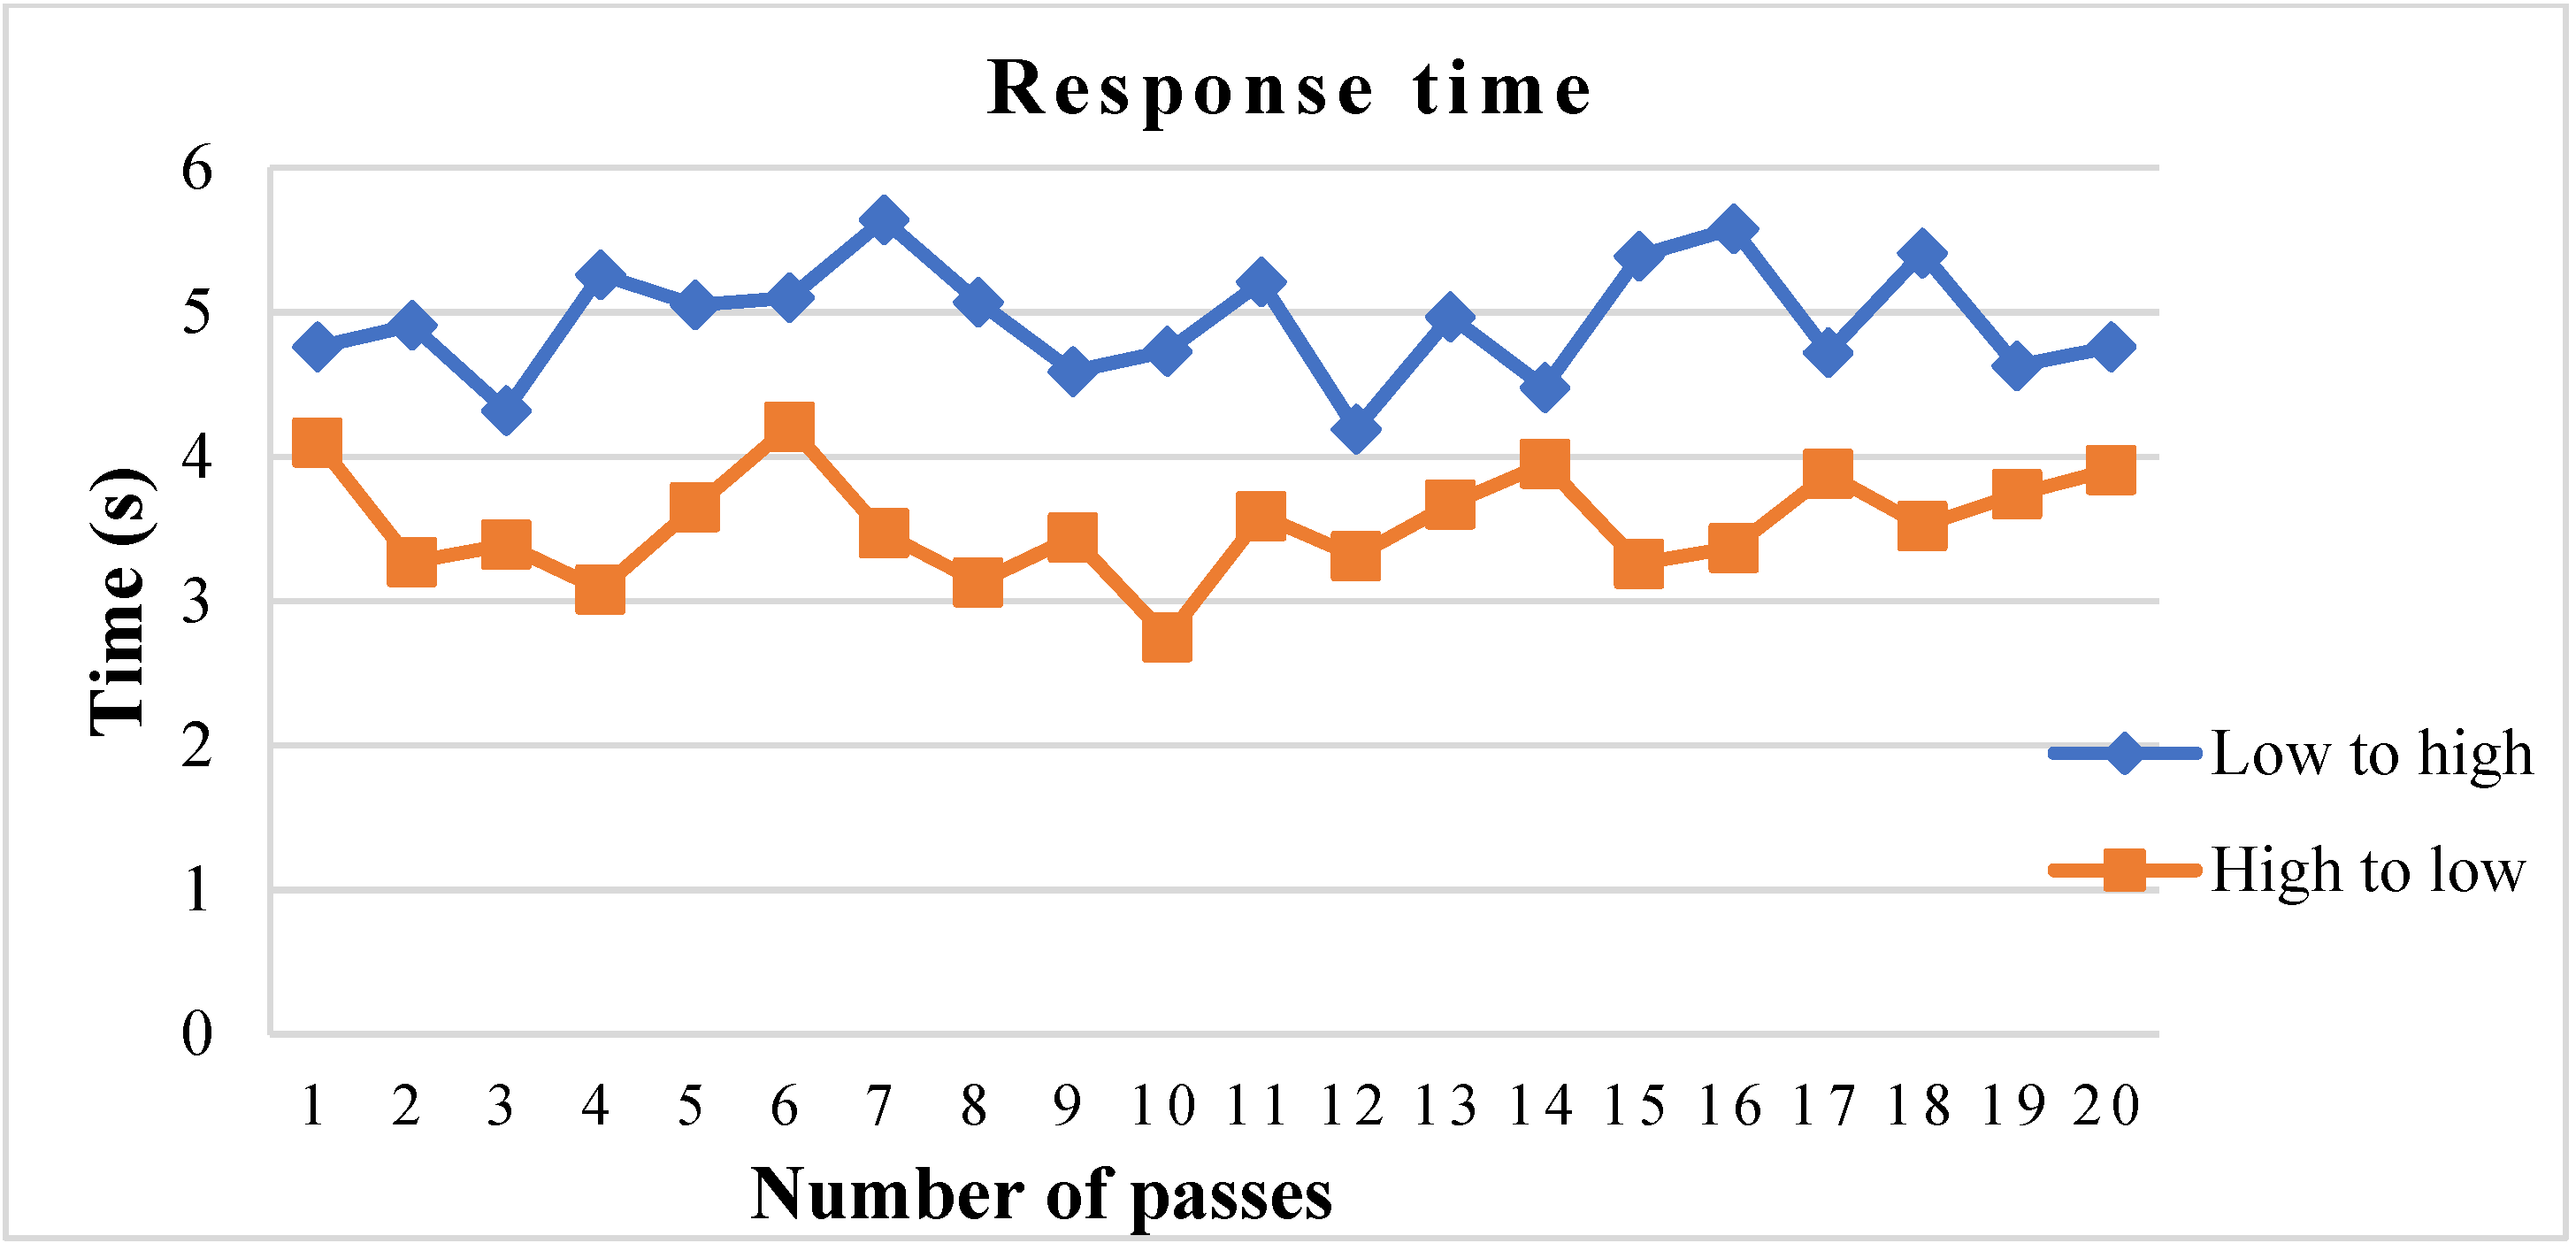
3.3. Response Time of Real Time Variable-Rate Applicator

The second part of the experiment was conducted to specify the response time from the N sensor to the corresponding change in fluted-roller drive-shaft rotational speed, based on variation in different NDVI values, with the intention of examining the real-time fertilizer-adjustment efficiency. The response time of the applicator from the sensing unit to the change in the rotational speed of the drive shaft, for a low-to-high-rate change (from 12.59 to 50.41 kg ha−1) at 3 km ha−1 and for high-to-low-rate change (from 50.41 to 12.59 kg ha−1) at 3 km ha−1, is shown in Figure 8.
The control system was evaluated with respect to its response to transition time during the applicator’s experiments, when variation in the fertilizer rate was required. The data revealed that the response time of the control system to step-variation adjustments (the transition period from 12.59 to 50.41 kg ha−1) was within the range of 3.53 to 4.93 s for both the high-to-low-rate and the low-to-high-rate. Therefore, a look-ahead time takes into account, based on the applicator’s response time, the tractor forward speed (i.e., 3 km h−1) and the distance of the N sensor mounted on tractor from the fertilizer discharge outlets.

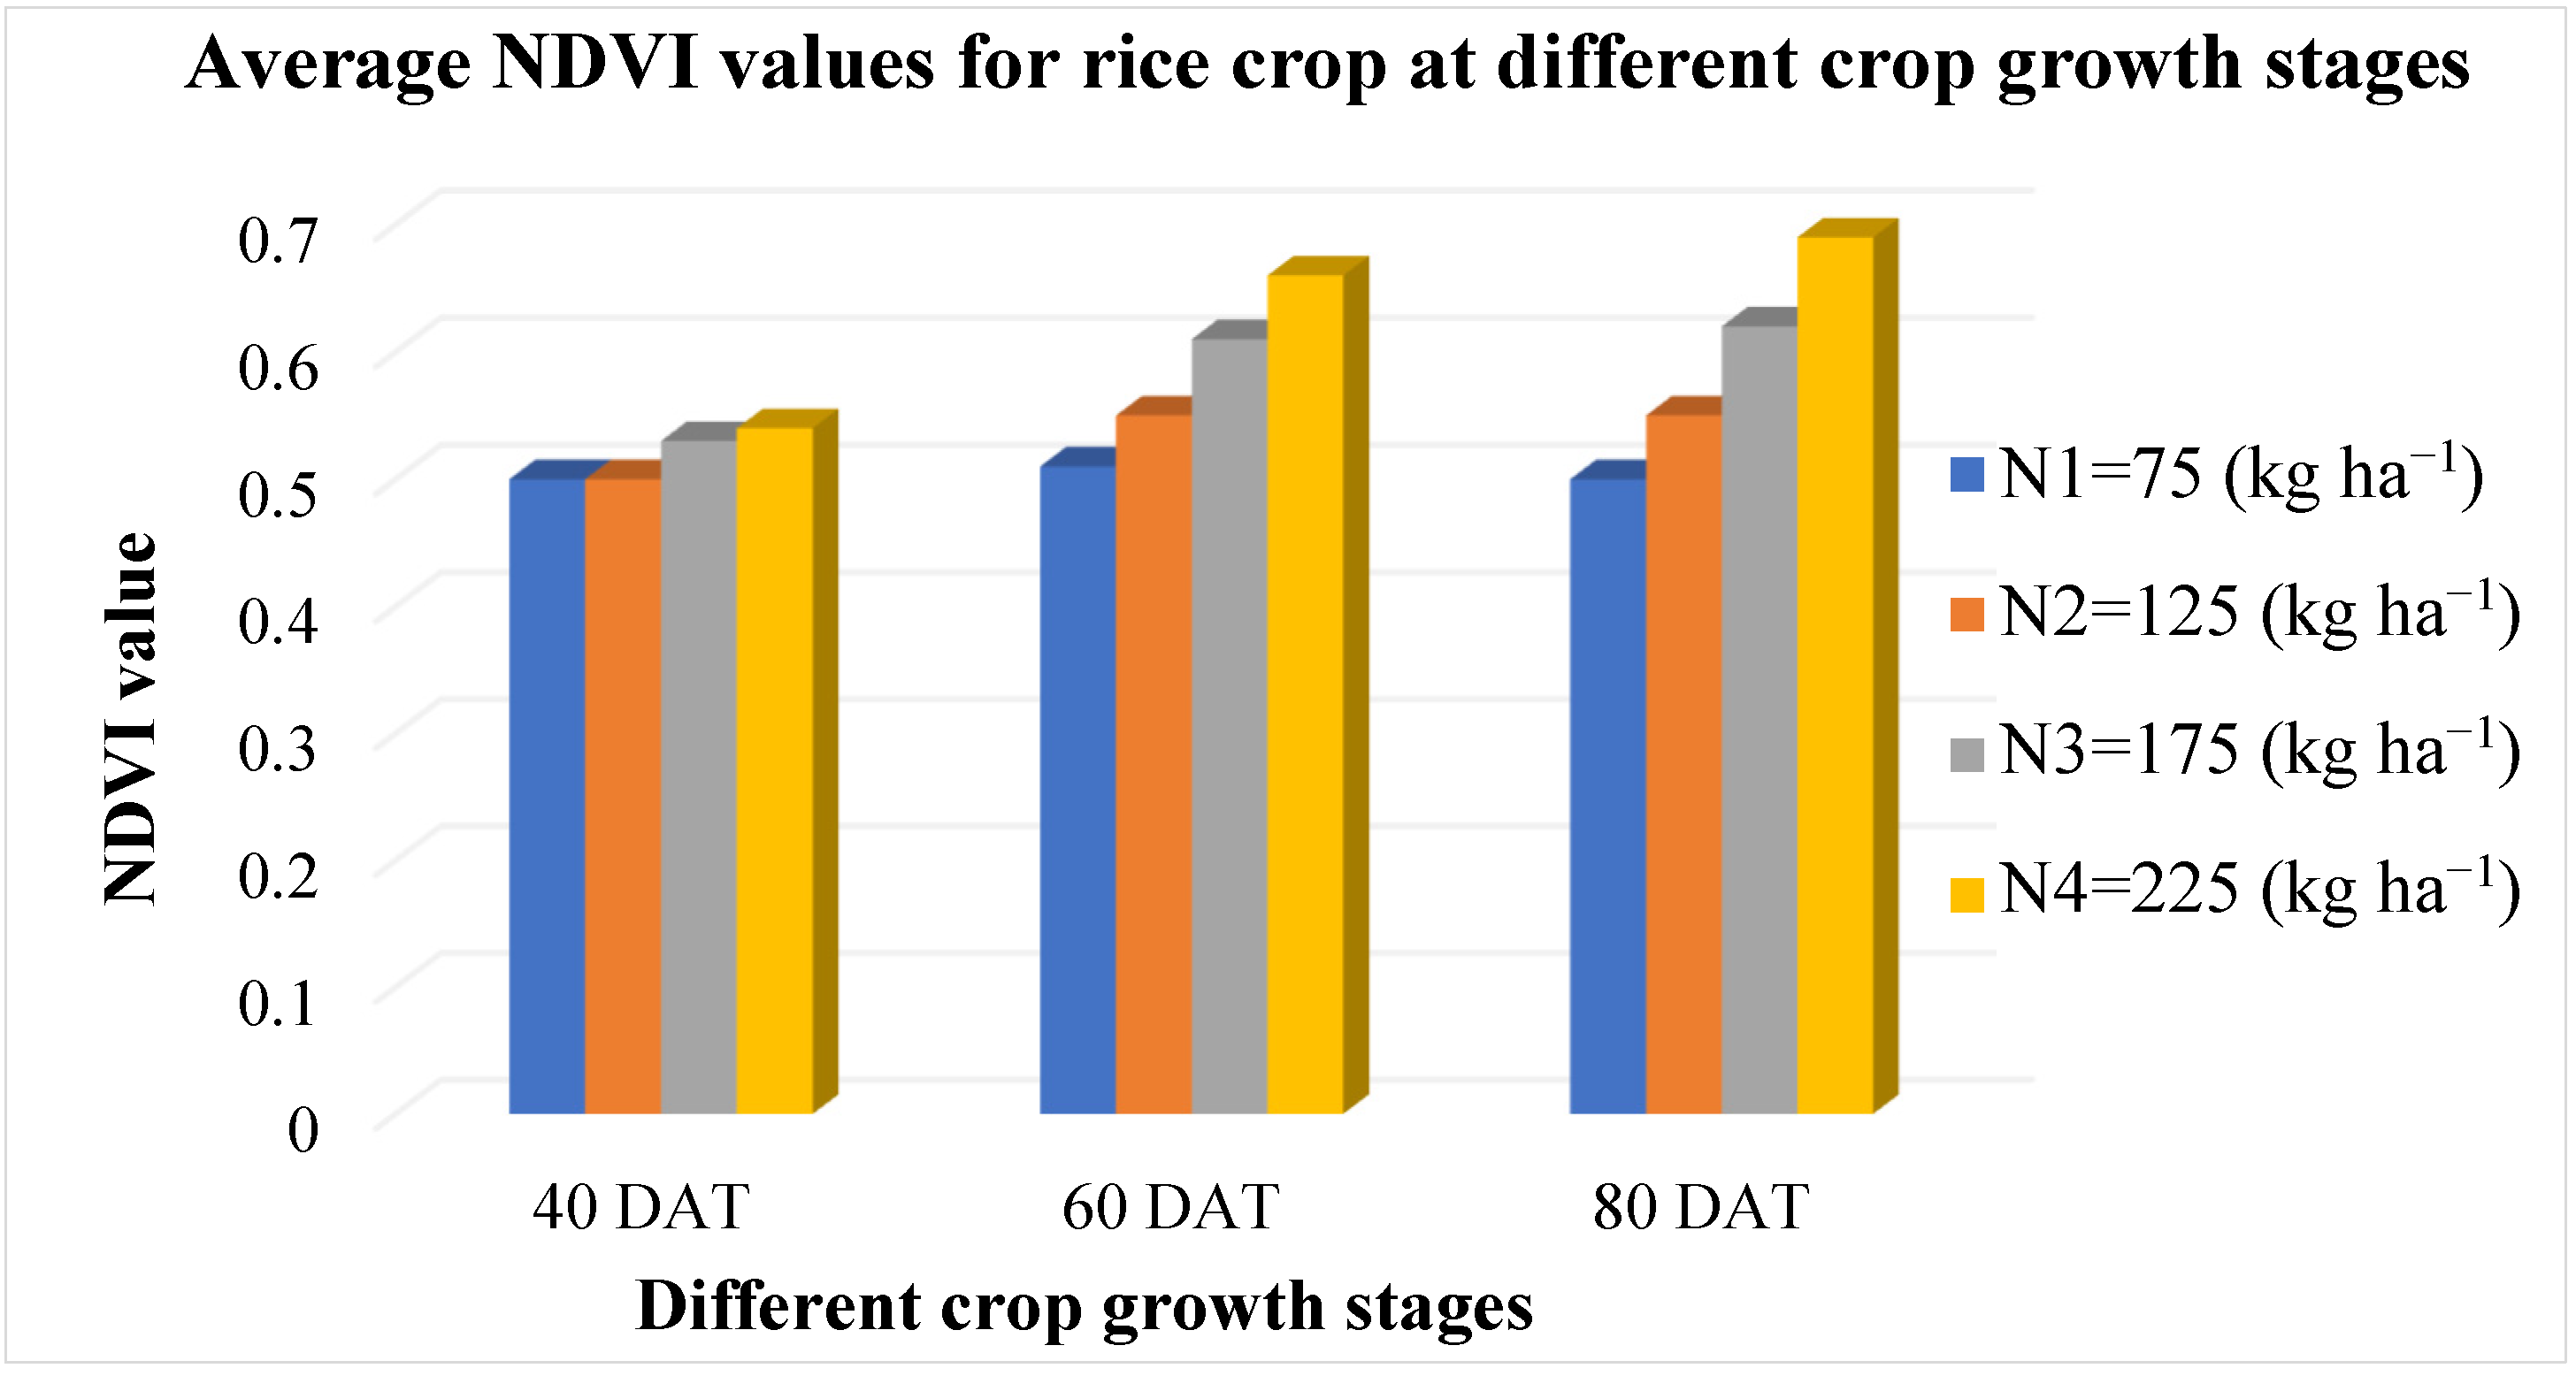
3.4. NDVI Values for Rice Crop at Different Crop Growth Stages

NDVI data were collected at different crop growth stages at different N levels (N1 to N4). As shown in Figure 9, the NDVI values have some small change at 40 DAT, while at 60 and 80 DAT they have significantly changed for the different N levels. This could be due to the time requirement of N uptake by plants and because of less of a crop canopy covering the ground, which causes an error in NDVI reading as some of N sensor’s emitted lights, instead of reflecting off the plants, are directly reflected from the ground and, thus, captured by the sensor.

3.5. Application of Fertilizer at Different Crop Growth Stages Using Variable-Rate Applicator

Fertilizer was applied using a developed variable-rate applicator at different growth stages of the rice crop at 40, 60, and 80 DAT. NDVI, drive-shaft rotational speed (rpm), and the fertilizer rate applied by the applicator to plots with different N levels at 40 DAT are shown in Table 2. As the applicator moved from N1 plots to N4 plots and the fertilizer rate increased, NDVI increased from 0.49 to 0.54. Hence, the drive-shaft rotational speed decreased from 25 to 20 rpm, to apply the fertilizer at a corresponding rate ranging from 30.83 to 26.75 kg ha−1.
NDVI, drive-shaft rotational speed, and the fertilizer rate applied by the applicator to plots with different N levels at 60 DAT are shown in Table 3. As the applicator moved from N1 plots to N4 plots and the fertilizer rate increased, NDVI increased from 0.51 to 0.66. Therefore, the drive-shaft rotational speed decreased from 25 to 9 rpm, to apply the fertilizer at a corresponding rate ranging from 30.42 to 11.42 kg ha−1.
NDVI, drive-shaft rotational speed, and the fertilizer rate applied by the applicator to plots with different N levels at 80 DAT are shown in Table 4. As the applicator moved from N1 plots to N4 plots and the fertilizer rate increased, NDVI increased from 0.50 to 0.69. Therefore, the drive-shaft rotational speed decreased from 26 to 7 rpm, to apply the fertilizer at a corresponding rate ranging from 35.29 to 9.15 kg ha−1.

3.6. Savings in Fertilizer Application by Using Variable-Rate Applicator

The university’s fertilizer recommendation for rice crop was 225 kg ha−1. As shown in Table 5, the total fertilizer applied by the applicator at different N levels, N1 to N4, were 134.04, 130.87, 124.32, and 122.32 kg ha−1, respectively. So, instead of using 225 kg ha−1 as recommended by the university, the N usage was greatly reduced at all N levels and resulted in a maximum fertilizer savings of about 45% in N4.
The urea application rate has some small change in 40 DAT, while at 60 and 80 DAT it has significantly changed for different N levels. Since the application of urea is based on NDVI values sensed via the N sensor, and, as is mentioned above, this could be due to the time requirement of N uptake by plants and because of less of a crop canopy covering the ground, which causes errors in the NDVI reading as some of the N sensors emitted lights, instead of reflecting off the plants, directly reflected off the ground and were captured by the sensor. Therefore, at 60 and 80 DAT, the crop-growth stage urea application is significantly efficient.

4. Discussion

In this study, field-testing of a variable-rate fertilizer applicator for use in rice demonstrated that, by using VRT, we can optimize fertilizer output. Field-evaluation assessments indicated that the newly developed variable-rate real-time fertilizer applicator did a good job of responding to discharge-rate variability, with acceptable response time and accuracy. The fertilizer discharge rate was linear, with respect to drive-shaft rotational speed variation, and the CV of the fertilizer among the discharge outlets was low, ranging from 2.16% to 5.31%, in comparison to previous research conducted by Fulton et al. [169] on uniformity distribution CV, which for the pneumatic boom were between 11.6% and 31.3%, similar to one study by Reyes et al. [90], where the CV ranged between 5.4–27.8%. The CV has been applied extensively by several investigators in precision farming, as an index for changing the application rate in a targeted area [161,167,169,176,177,178]. This index can provide an assist to specify the existing variation in the operated area via the real-time VRT system and by applying the desired application rate across the operated farm area. The overall implementation error of the system was between 0.83% and 4.92%, which, when compared to previous studies (Sui, [59], with an error ranging from 1.3% to 6.5%; Reyes et al. [90], with an average error of 5.46%; Talha et al. [89], with a ±6% overall error; Tola et al. [85], with a ±5% overall error; Miller et al. [159], with an average error of 7.7%; Alameen et al. [88], with a ±2.6% overall error; May and Kocabiyik [162], with a ±2.43% overall error; Forouzanmehr and Loghavi [61], with an overall error of 5.36%; and Wang et al. [130], with an error ranging from 0.15% to 0.63%), this error system is reasonable. Data showed that the Greenseeker mounted on a tractor for taking crop NDVI could be placed at any suitable height between 40 to 100 cm from the crop canopy, which fit in the similar height range of previous studies [77,179]. The system-response time fell within the range of 3.53 to 4.93 s for both high-to-low rate and low-to-high rate transitions, which was suitable for the applicator as compared to previous studies. This response time was appropriate for the applicator, as compared to Jafari et al. [83], with a response time of 7.2 and 5.2 s; Tola et al. [85], with a response time of 0.95 and 1.9 s.; Kim et al. [17], with a response time of 1.5 and 3 s; Bahri [180], with a response time of 3 and 9 s; Talha et al. [89], with a response time of 0.08 to 1.0 s; Alameen et al. [88], with a response time of 0.006 to 0.011 s; Maleki et al. [181], with a response time of 0.14–0.65 s; Al-Gaadi and Ayers [165], with a maximum response time of 2.2 s; Anglund and Ayers [164], with a response time of 0.65 to 2.65 s; Forouzanmehr and Loghavi [61], with a response time of 0.15 s and 0.22 s; Molin et al. [168], with a response time of 3.1 to 5.6 s; and Fulton et al. [163], for spinner spreaders, with transition times between 3.6 to 6.8 s, and for pneumatic ones, between 0.4 to 12.4 s.
One of the interesting points of this study was the agronomic aspect. The NDVI values had a slight change in the tillering stage, while at the panicle-initiation and heading stages it had significantly changed at different N levels. It is interesting to see how the effect based on fertilization manifests itself in NDVI. It is also interesting to see the variation within and between stages of crop development. This correlation between NDVI values, different N levels, and different stages can be taken into account in a future study for monitoring and predicting of the N-uptake status of crop, crop yield, and crop response to and in different growth stages, as well as the level of N in specific zones, just as this approach was taken into account in previous studies [47,77,182,183]. The developed applicator applied N fertilizer, per crop N status and necessity. The urea-application rate has been applied as the maximum at the lowest N level (N1) by the applicator, as N1 had maximum deficiency in N fertilizer compared to the other N levels. While at the highest N level (N4), the minimum application rate has been applied, as N4 had minimum deficiency in N fertilizer compared to the other N levels. Ultimately, the developed applicator resulted in a fertilizer savings of 45%, which is a reduction in the N rate in comparison to the conventional rate and previous research on the evaluation of a VRT applicator, by Molin et al. [168] with 27%; Zhang et al. [62] with 32% in 2004 and 29% in 2005; and Stamatiadis et al. [70] with a 58% saving assessment in the applied fertilizer rate, which is significant. However, one limitation of the present study is the lack of yield data, which could be collected in future studies in order to reinforce the value of this outcomes.

5. Conclusions

The fertilizer discharge rate was linear with respect to drive-shaft rotational-speed variation, and the CV of the fertilizer among the discharge outlets was low, ranging from 2.16% to 5.31%. The suitable height for the Greenseeker mounted on a tractor for measuring crop NDVI ranged from 40 to 100 cm above the crop canopy. The system response time was within the range of 3.53 to 4.93 s, with overall error ranging between 0.83% and 4.92%. In the lowest N level, more nitrogen has been applied due to more nitrogen deficiency than in all other N levels. A nitrogen fertilizer savings of 45% was achieved by using the developed applicator.
There are several important implications of cutting fertilizer usage nearly in half. In particular, these findings suggest that, if applied on a larger scale, variable-rate technology for fertilizer application could benefit farmers, the environment, and consumers. Economically, as fertilizer decreases, so too does the corresponding amount of money spent on it, increasing farmers’ income and allowing them to divert those funds for other purposes. Further, this could even have a meaningful impact for consumers, if it leads to a decrease in cost farther down the supply chain, which could make the products grown more accessible to lower-income individuals and families that may previously have been unable to access fresh foods due to the price. Environmentally, the reduction in fertilizer use decreases pollution, lessening the burden of farming on the surrounding ecosystem.
Both of these economic and environmental factors highlight the importance of this technology; however, more research is needed regarding how variable-rate fertilizer applicators can be optimized, particularly through the cross-fertilization of different key areas of research in precision agriculture. For instance, integration of soil and plant-status indicators into the sensing process, as well as combining them with prescription maps, could lead to even greater savings and precision. Previous research has largely focused on each of these individually; however, by combining these three, a more efficient model could be used to more accurately estimate the correct fertilizer amount to distribute. Furthermore, future studies can focus on developing a real-time soil-sensor-based VRT N applicator, combined with row-crop planters to enhance the distribution efficiency of the N fertilizer rate. This could help to protect the environment and avoid waste of extra fertilizer application, as well as reduce the use of machinery in the field by planting the crop simultaneously.

Author Contributions

Conceptualization, H.M., M.S. and A.M.N.; methodology, H.M., M.S., A.K.D., A.P. and A.M.N.; software, H.M., S.S. and J.K.; formal analysis, H.M. and M.S.; investigation, H.M., M.S., A.P. and S.S.; resources, H.M. and M.S.; data curation, H.M. and M.S.; writing—original draft preparation, H.M.; writing—review and editing, H.M., M.S., A.K.D., A.P., S.S., J.K. and A.M.N. All authors have read and agreed to the published version of the manuscript.

Funding

This study was conducted under research at Punjab Agricultural University, Ludhiana (India). The DST funded the project under scheme CSS-42, operational at Punjab Agricultural University.

Institutional Review Board Statement

Not applicable.

Informed Consent Statement

Not applicable.

Data Availability Statement

Not applicable.

Acknowledgments

The authors duly acknowledge the assistance received from the Ministry of Science, Research and Technology of Iran, the Agricultural Ministry of Iran, the Indian Council of Agricultural Research (ICAR), the Indian Council for Cultural Relations (ICCR), the Department of Science and Technology, Ministry of Science and Technology of India, and the Department of Farm Machinery & Power Engineering, College of Agricultural Engineering & Technology, Punjab Agricultural University (PAU), Ludhiana, during the study.

Conflicts of Interest

The authors declare no conflict of interest.

References

  1. Jat, M.L.; Chakraborty, D.; Ladha, J.K.; Rana, D.S.; Gathala, M.K.; McDonald, A.; Gerard, B. Conservation agriculture for sustainable intensification in South Asia. Nat. Sustain. 2020, 3, 336–343. [Google Scholar] [CrossRef]
  2. Lee, S. Recent advances on nitrogen use efficiency in rice. Agronomy 2021, 11, 753. [Google Scholar] [CrossRef]
  3. Quan, Z.; Zhang, X.; Fang, Y.; Davidson, E.A. Different quantification approaches for nitrogen use efficiency lead to divergent estimates with varying advantages. Nat. Food 2021, 2, 241–245. [Google Scholar] [CrossRef]
  4. Tao, M.; Ma, X.; Huang, X.; Liu, C.; Deng, R.; Liang, K.; Qi, L. Smartphone-based detection of leaf color levels in rice plants. Comput. Electron. Agric. 2020, 173, 105431. [Google Scholar] [CrossRef]
  5. Li, Y.; Xu, J.; Liu, X.; Liu, B.; Liu, W.; Jiao, X. Win-win for monosodium glutamate industry and paddy agriculture: Replacing chemical nitrogen with liquid organic fertilizer from wastewater mitigates reactive nitrogen losses while sustaining yields. J. Clean. Prod. 2022, 347, 131287. [Google Scholar] [CrossRef]
  6. Rodriguez, D.G.P. An assessment of the site-specific nutrient management (SSNM) strategy for irrigated rice in Asia. Agriculture 2020, 10, 559. [Google Scholar] [CrossRef]
  7. Baral, B.R.; Pande, K.R.; Gaihre, Y.K.; Baral, K.R.; Sah, S.K.; Thapa, Y.B.; Singh, U. Real-time nitrogen management using decision support-tools increases nitrogen use efficiency of rice. Nutr. Cycl. Agroecosyst. 2021, 119, 355–368. [Google Scholar] [CrossRef]
  8. Zeng, X.; Han, B.; Xu, F.; Huang, J.; Cai, H.; Shi, L. Effects of modified fertilization technology on the grain yield and nitrogen use efficiency of midseason rice. Field Crops Res. 2012, 137, 203–212. [Google Scholar] [CrossRef]
  9. Li, L.; Zhang, Z.; Tian, H.; Mo, Z.; Ashraf, U.; Duan, M.; Wang, Z.; Wang, S.; Tang, X.; Pan, S. Roles of nitrogen deep placement on grain yield, nitrogen use efficiency, and antioxidant enzyme activities in mechanical pot-seedling transplanting rice. Agronomy 2020, 10, 1252. [Google Scholar] [CrossRef]
  10. Peng, S.; Buresh, R.J.; Huang, J.; Zhong, X.; Zou, Y.; Yang, J.; Wang, G.; Liu, Y.; Hu, R.; Tang, Q.; et al. Improving nitrogen fertilization in rice by sitespecific N management. A review. Agron. Sustain. Dev. 2010, 30, 649–656. [Google Scholar] [CrossRef]
  11. Chen, Y.; Peng, J.; Wang, J.; Fu, P.; Hou, Y.; Zhang, C.; Fahad, S.; Peng, S.; Cui, K.; Nie, L.; et al. Crop management based on multi-split topdressing enhances grain yield and nitrogen use efficiency in irrigated rice in China. Field Crops Res. 2015, 184, 50–57. [Google Scholar] [CrossRef]
  12. Ebrahimian, H.; Playán Jubillar, E. Optimum management of furrow fertigation to maximize water and fertilizer application efficiency and uniformity. J. Agric. Sci. Technol. 2014, 16, 591–607. [Google Scholar] [CrossRef]
  13. Batte, M.T.; Arnholt, M.W. Precision farming adoption and use in Ohio: Case studies of six leading-edge adopters. Comput. Electron. Agric. 2003, 38, 125–139. [Google Scholar] [CrossRef]
  14. Thind, H.S.; Gupta, R.K. Need based nitrogen management using the chlorophyll meter and leaf colour chart in rice and wheat in South Asia: A review. Nutr. Cycl. Agroecosyst. 2010, 88, 361–380. [Google Scholar] [CrossRef]
  15. Robert, P.C. Precision agriculture: A challenge for crop nutrition management. Plant Soil 2002, 247, 143–149. [Google Scholar] [CrossRef]
  16. Mulla, D.J. Twenty five years of remote sensing in precision agriculture: Key advances and remaining knowledge gaps. Biosyst. Eng. 2013, 114, 358–371. [Google Scholar] [CrossRef]
  17. Kim, Y.J.; Kim, H.J.; Ryu, K.H.; Rhee, J.Y. Fertiliser application performance of a variable-rate pneumatic granular applicator for rice production. Biosyst. Eng. 2008, 100, 498–510. [Google Scholar] [CrossRef]
  18. Dong, X.; Vuran, M.C.; Irmak, S. Autonomous precision agriculture through integration of wireless underground sensor networks with center pivot irrigation systems. Ad Hoc Netw. 2013, 11, 1975–1987. [Google Scholar] [CrossRef]
  19. Xu, J.; Peng, S.; Yang, S.; Wang, W. Ammonia volatilization losses from a rice paddy with different irrigation and nitrogen managements. Agric. Water Manag. 2012, 104, 184–192. [Google Scholar] [CrossRef]
  20. Olson, D.M.; Cortesero, A.M.; Rains, G.C.; Potter, T.; Lewis, W.J. Nitrogen and water affect direct and indirect plant systemic induced defense in cotton. Biol. Control. 2009, 49, 239–244. [Google Scholar] [CrossRef]
  21. Barbieri, P.; Pellerin, S.; Seufert, V.; Smith, L.; Ramankutty, N.; Nesme, T. Global option space for organic agriculture is delimited by nitrogen availability. Nat. Food 2021, 2, 363–372. [Google Scholar] [CrossRef]
  22. Tavakoli, H.; Gebbers, R. Assessing nitrogen and water status of winter wheat using a digital camera. Comput. Electron. Agric. 2019, 157, 558–567. [Google Scholar] [CrossRef]
  23. Rong, L.B.; Gong, K.Y.; Duan, F.Y.; LI, S.K.; Ming, Z.H.A.O.; Jianqiang, H.E.; Zhou, W.B.; Qiang, Y.U. Yield gap and resource utilization efficiency of three major food crops in the world–A review. J. Integr. Agric. 2021, 20, 349–362. [Google Scholar] [CrossRef]
  24. Cheng, B.; Jiang, Y.; Cao, C. Balance rice yield and eating quality by changing the traditional nitrogen management for sustainable production in China. J. Clean. Prod. 2021, 312, 127793. [Google Scholar] [CrossRef]
  25. Wang, Y.; Lu, Y. Evaluating the potential health and economic effects of nitrogen fertilizer application in grain production systems of China. J. Clean. Prod. 2020, 264, 121635. [Google Scholar] [CrossRef]
  26. Liang, H.; Yang, S.; Xu, J.; Hu, K. Modeling water consumption, N fates, and rice yield for water-saving and conventional rice production systems. Soil Tillage Res. 2021, 209, 104944. [Google Scholar] [CrossRef]
  27. Deng, F.; Li, W.; Wang, L.; Hu, H.; Liao, S.; Pu, S.L.; Tao, Y.F.; Li, G.H.; Ren, W.J. Effect of controlled-release fertilizers on leaf characteristics, grain yield, and nitrogen use efficiency of machine-transplanted rice in southwest China. Arch. Agron. Soil Sci. 2021, 67, 1739–1753. [Google Scholar] [CrossRef]
  28. Inman, D.; Khosla, R.; Westfall, D.G.; Reich, R. Nitrogen uptake across site specific management zones in irrigated corn production systems. Agron. J. 2005, 97, 169–176. [Google Scholar] [CrossRef]
  29. Xu, J.; Liu, B.; Wang, H.; Liu, W.; Li, Y.; Dai, Y.; Lu, T. Ammonia volatilization and nitrogen leaching following top-dressing of urea from water-saving irrigated rice field: Impact of two-split surge irrigation. Paddy Water Environ. 2019, 17, 45–51. [Google Scholar] [CrossRef]
  30. da Silva, M.J.; Magalhaes, P.S. A liquid injection dosing system for site-specific fertiliser management. Biosyst. Eng. 2017, 163, 150–158. [Google Scholar] [CrossRef]
  31. Adamchuk, V.I.; Hummel, J.W.; Morgan, M.T.; Upadhyaya, S.K. On-the-go soil sensors for precision agriculture. Comput. Electron. Agric. 2004, 44, 71–91. [Google Scholar] [CrossRef]
  32. Hirel, B.; Tétu, T.; Lea, P.J.; Dubois, F. Improving nitrogen use efficiency in crops for sustainable agriculture. Sustainability 2011, 3, 1452–1485. [Google Scholar] [CrossRef]
  33. Khalilian, A.; Rogers, N.G.; Williams, P.B.; Han, Y.J.; Nafchi, A.M.; Maja, J.M.; Marshall, M.W.; Payero, J.O. Sensor-Based Algorithm for Mid-Season Nitrogen Application in Corn. Open J. Soil Sci. 2017, 7, 278–287. [Google Scholar] [CrossRef]
  34. Varco, J. Crop Reflectance as an Indicator of Cotton Growth and Leaf Nitrogen Status. In Proceedings of the ASA-CSSA-SSSA International Annual Meetings, Indianapolis, IN, USA, 12–16 November 2006. [Google Scholar]
  35. Scharf, P.C.; Lory, J.A. Calibrating reflectance measurements to predict optimal side dress nitrogen rate for corn. Agron. J. 2009, 101, 615–625. [Google Scholar] [CrossRef]
  36. Arnall, D.B. Analysis of the Coefficient of Variation of Remote Sensor Readings in Winter Wheat, and Development of a Sensor Based Mid-Season N Recommendation for Cotton. Ph.D Thesis, Oklahoma State University, Stillwater, OK, USA, 2008. [Google Scholar]
  37. Raun, W.R.; Solie, J.B.; Stone, M.L.; Martin, K.L.; Freeman, K.W.; Mullen, R.W.; Zhang, H.; Schepers, J.S.; Johnson, G.V. Optical sensor-based algorithm for crop nitrogen fertilization. Commun. Soil Sci. Plant Anal. 2005, 36, 2759–2781. [Google Scholar] [CrossRef]
  38. Malhi, S.S.; Grant, C.A.; Johnston, A.M.; Gill, K.S. Nitrogen fertilization management for no-till cereal production in the Canadian Great Plains: A review. Soil Tillage Res. 2001, 60, 101–122. [Google Scholar] [CrossRef]
  39. Kharim, M.N.A.; Wayayok, A.; Abdullah, A.F.; Shariff, A.R.M. Effect of variable rate application on rice leaves burn and chlorosis in system of rice intensification. Malays. J. Sustain. Agric. 2020, 4, 66–70. [Google Scholar] [CrossRef]
  40. Alam, M.Z.; Sadekuzzaman, M.; Sarker, S.; Hafiz, M.H.R. Reducing soil application of nitrogenous fertilizer as influenced by liquid fertilization on yield and yield traits of kataribhog rice. Int. J. Agron. Agric. Res. 2015, 6, 63–69. [Google Scholar]
  41. Wu, A.; Hammer, G.L.; Doherty, A.; von Caemmerer, S.; Farquhar, G.D. Quantifying impacts of enhancing photosynthesis on crop yield. Nat. Plants 2019, 5, 380–388. [Google Scholar] [CrossRef]
  42. Shaygany, J.; Peivandy, N.; Ghasemi, S. Increased yield of direct seeded rice (Oryza sativa L.) by foliar fertilization through multi-component fertilizers. Arch. Agron. Soil Sci. 2012, 58, 1091–1098. [Google Scholar] [CrossRef]
  43. Syam’Un, E.; Musa, Y.; Sadimantara, G.R.; Leomo, S.; Rakian, T.C. The effect of shade on chlorophyll and anthocyanin content of upland red rice. In Proceedings of the IOP Conference Series: Earth and Environmental Science, International Conference on Agriculture, Environment, and Food Security, Medan, Indonesia, 7–8 November 2017; IOP Publishing: Bristol, UK; Volume 122, p. 012030. [Google Scholar] [CrossRef]
  44. Chen, R.K.; Yang, C.M. Determining the optimal timing for using LAI and NDVI to predict rice yield. J. Photogramm. Remote Sens. 2005, 10, 239–254. [Google Scholar]
  45. Li, L.; Zhang, Q.; Huang, D. A review of imaging techniques for plant phenotyping. Sensors 2014, 14, 20078–20111. [Google Scholar] [CrossRef] [PubMed]
  46. Naito, H.; Ogawa, S.; Valencia, M.O.; Mohri, H.; Urano, Y.; Hosoi, F.; Omasa, K. Estimating rice yield related traits and quantitative trait loci analysis under different nitrogen treatments using a simple tower-based field phenotyping system with modified single-lens reflex cameras. J. Photogramm. Remote Sens. 2017, 125, 50–62. [Google Scholar] [CrossRef]
  47. Varinderpal-Singh; Kunal; Kaur, R.; Mehtab-Singh; Mohkam-Singh; Harpreet-Singh; Bijay-Singh. Prediction of grain yield and nitrogen uptake by basmati rice through in-season proximal sensing with a canopy reflectance sensor. Precis. Agric. 2021, 23, 733–747. [Google Scholar] [CrossRef]
  48. Grant, C.A.; Wu, R.; Selles, F.; Harker, K.N.; Clayton, G.W.; Bittman, S.; Zebarth, B.J.; Lupwayi, N.Z. Crop yield and nitrogen concentration with controlled release urea and split applications of nitrogen as compared to non-coated urea applied at seeding. Field Crops Res. 2012, 127, 170–180. [Google Scholar] [CrossRef]
  49. Chen, L.S.; Wang, K. Diagnosing of rice nitrogen stress based on static scanning technology and image information extraction. J. Soil Sci. Plant Nutr. 2014, 14, 382–393. [Google Scholar] [CrossRef]
  50. Gholizadeh, A.; Saberioon, M.; Borůvka, L.; Wayayok, A.; Soom, M.A.M. Leaf chlorophyll and nitrogen dynamics and their relationship to lowland rice yield for site-specific paddy management. Inf. Process. Agric. 2017, 4, 259–268. [Google Scholar] [CrossRef]
  51. Package of Practices for the Crops of Punjab. Kharif 2019–2020. Available online: https://www.pau.edu/content/pf/pp_kharif.pdf (accessed on 18 July 2019).
  52. Package of Practices for the Crops of Punjab. Rabi 2019–2020. Available online: https://www.pau.edu/content/pf/pp_rabi.pdf (accessed on 18 November 2019).
  53. El Nahry, A.H.; Ali, R.R.; El Baroudy, A.A. An approach for precision farming under pivot irrigation system using remote sensing and GIS techniques. Agric. Water Manag. 2011, 98, 517–531. [Google Scholar] [CrossRef]
  54. Rokhafrouz, M.; Latifi, H.; Abkar, A.A.; Wojciechowski, T.; Czechlowski, M.; Naieni, A.S.; Maghsoudi, Y.; Niedbała, G. Simplified and Hybrid Remote Sensing-Based Delineation of Management Zones for Nitrogen Variable Rate Application in Wheat. Agriculture 2021, 11, 1104. [Google Scholar] [CrossRef]
  55. Grisso, R.D.; Alley, M.M.; Thomason, W.E.; Holshouser, D.L.; Roberson, G.T. Precision Farming Tools: Variable-Rate Application; Virginia Cooperative Extension Publication: Charlottesville, VA, USA, 2011; pp. 442–505. [Google Scholar]
  56. Ess, D.R.; Morgan, M.T.; Parson, S.D. Implementing Site-Specific Management: Map-Versus Sensor-Based Variable Rate Application; Publication Number SSM-2-W; Site-Specific Management Center, Purdue University: West Lafayette, IN, USA, 2001. [Google Scholar]
  57. Van Loon, J.; Speratti, A.B.; Gabarra, L.; Govaerts, B. Precision for smallholder farmers: A small-scale-tailored variable rate fertilizer application kit. Agriculture 2018, 8, 48. [Google Scholar] [CrossRef]
  58. Jeong, I.G.; Jeong, S.O.; Seong, J.H.; Lee, C.G. Development of map-based variable-rate applicator. Proc. Korean Soc. Agric. Mach. Conf. 2006, 11, 345–348. Available online: http://koreascience.kr/article/CFKO200636035485058.page (accessed on 21 July 2019).
  59. Sui, R. Performance assessment of a variable-rate fertilizer applicator. J. Agric. Sci. 2019, 11, 25–30. [Google Scholar] [CrossRef]
  60. Baio, F.H.R.; Balastreire, L.A. Evaluation of a site specific chemical application system based on the spatial variability of weeds. In Proceedings of the World Congress of Computers in Agriculture and Natural Resources, Iguacu Falls, Brazil, 13–15 March 2002; pp. 225–231. [Google Scholar] [CrossRef]
  61. Forouzanmehr, E.; Loghavi, M. Design, development and field evaluation of a map-based variable rate granular fertilizer application control system. Agric. Eng. Int. CIGR J. 2012, 14, 255–261. [Google Scholar]
  62. Zhang, S.; Lan, Y.; Wei, L.I.; Hoffmann, W.C.; Xu, Y.; Ma, C. Variable rate fertilization for maize and its effects based on the site-specific soil fertility and yield. Agric. Eng. Int. CIGR J. 2007. [Google Scholar] [CrossRef]
  63. Iida, M.; Umeda, M.; Radite, P.A.S. Variable rate fertilizer applicator for paddy field. In Proceedings of the ASAE Annual Meeting. American Society of Agricultural and Biological Engineers, Sacramento, CA, USA, 29 July–1 August 2001. [Google Scholar] [CrossRef]
  64. King, B.A.; Wall, R.W. Secondary, spatially variable chemical application system for site-specific crop management using continuous-move irrigation systems. In Proceedings of the ASAE Annual Meeting. American Society of Agricultural and Biological Engineers, Sacramento, CA, USA, 29 July–1 August 2001. [Google Scholar] [CrossRef]
  65. Zhang, R.; Wang, X.; Zhao, C.; Meng, Z.; Chen, L. Design and experiment of variable rate fertilizer spreader with conveyor chain. Trans. Chin. Soc. Agric. Eng. 2012, 28, 20–25. [Google Scholar] [CrossRef]
  66. Aghkhani, A.D.M.; Motie, M.K.J.B. Fabrication and evaluation of variable rate fertilizer system. J. Agric. Mach. 2015, 5, 251–260. [Google Scholar]
  67. Türker, U.; Talepbour, B.; Özgüven, M.M. Development of a Row Type Variable Rate Fertilizer Machine and Performance Assessment. Gaziosmanpaşa Üniversitesi Ziraat Fakültesi Derg. 2019, 36, 36–44. [Google Scholar]
  68. Xiangyu, G.; Yanming, L.; Yubin, M.; Chengliang, L. Development of variable rate fertilizer applicator based on GPRS. Trans. Chin. Soc. Agric. Eng. 2007, 23, 164–167. [Google Scholar]
  69. Martins, R.N.; Pinto, F.D.A.D.C.; Moura, A.D.D.; Siqueira, W.D.C.; Villar, F.M.D.M. Nitrogen variable rate fertilization in corn crop prescribed by optical sensor. J. Plant Nutr. 2020, 43, 1681–1688. [Google Scholar] [CrossRef]
  70. Stamatiadis, S.; Schepers, J.S.; Evangelou, E.; Tsadilas, C.; Glampedakis, A.; Glampedakis, M.; Dercas, N.; Spyropoulos, N.; Dalezios, N.R.; Eskridge, K. Variable-rate nitrogen fertilization of winter wheat under high spatial resolution. Precis. Agric. 2018, 19, 570–587. [Google Scholar] [CrossRef]
  71. Mirzakhaninafchi, H.; Singh, M.; Bector, V.; Gupta, O.P.; Singh, R. Design and Development of a Variable Rate Applicator for Real-Time Application of Fertilizer. Sustainability 2021, 13, 8694. [Google Scholar] [CrossRef]
  72. Sozzi, M.; Bernardi, E.; Kayad, A.; Marinello, F.; Boscaro, D.; Cogato, A.; Gasparini, F.; Tomasi, D. On-the-go variable rate fertilizer application on vineyard using a proximal spectral sensor. In Proceedings of the IEEE International Workshop on Metrology for Agriculture and Forestry (MetroAgriFor), Trento, Italy, 4–6 November 2020; pp. 343–347. [Google Scholar] [CrossRef]
  73. Zhang, R.; Wang, X.; Guo, J.; Chen, L.; Zhou, J.; Ma, W. Development of Variable Rate Fertilizer System Based on Optical Sensor. Sens. Transducers 2014, 26, 1. [Google Scholar]
  74. Maleki, M.R.; Mouazen, A.M.; De Ketelaere, B.; Ramon, H.; De Baerdemaeker, J. On-the-go variable-rate phosphorus fertilisation based on a visible and near-infrared soil sensor. Biosyst. Eng. 2008, 99, 35–46. [Google Scholar] [CrossRef]
  75. Yinyan, S.H.I.; Man, C.H.E.N.; Xiaochan, W.A.N.G.; OO, M.; Chengguang, L.I.; Weimin, D.I.N.G. Design and experiment of variable-rate fertilizer spreader with centrifugal distribution cover for rice paddy surface fertilization. Nongye Jixie Xuebao/Trans. Chin. Soc. Agric. Mach. 2018, 49, 86–93. [Google Scholar] [CrossRef]
  76. Wen, S.; Zhang, Q.; Deng, J.; Lan, Y.; Yin, X.; Shan, J. Design and experiment of a variable spray system for unmanned aerial vehicles based on PID and PWM control. Appl. Sci. 2018, 8, 2482. [Google Scholar] [CrossRef]
  77. Quebrajo, L.; Pérez-Ruiz, M.; Rodriguez-Lizana, A.; Agüera, J. An approach to precise nitrogen management using hand-held crop sensor measurements and winter wheat yield mapping in a mediterranean environment. Sensors 2015, 15, 5504–5517. [Google Scholar] [CrossRef]
  78. Amaral, L.R.; Molin, J.P.; Portz, G.; Finazzi, F.B.; Cortinove, L. Comparison of crop canopy reflectance sensors used to identify sugarcane biomass and nitrogen status. Precis. Agric. 2015, 16, 15–28. [Google Scholar] [CrossRef]
  79. Cho, S.I.; Choi, S.H.; Kim, Y.Y. Development of electronic mapping system for N-fertilizer dosage using real-time soil organic matter sensor and DGPS. Biosyst. Eng. 2002, 27, 259–266. [Google Scholar]
  80. Cilia, C.; Panigada, C.; Rossini, M.; Meroni, M.; Busetto, L.; Amaducci, S.; Boschetti, M.; Picchi, V.; Colombo, R. Nitrogen status assessment for variable rate fertilization in maize through hyperspectral imagery. Remote Sens. 2014, 6, 6549–6565. [Google Scholar] [CrossRef]
  81. Schumann, A.W.; Miller, W.M.; Zaman, Q.U.; Hostler, K.H.; Buchanon, S.; Cugati, S. Variable rate granular fertilization of citrus groves: Spreader performance with single-tree prescription zones. Appl. Eng. Agric. 2006, 22, 19–24. [Google Scholar] [CrossRef]
  82. Portz, G.; Molin, J.P.; Jasper, J. Active crop sensor to detect variability of nitrogen supply and biomass on sugarcane fields. Precis. Agric. 2012, 13, 33–44. [Google Scholar] [CrossRef]
  83. Jafari, M.; Hemmat, A.; Sadeghi, M. Development and performance assessment of a DC electric variable-rate controller for use on grain drills. Comput. Electron. Agric. 2010, 73, 56–65. [Google Scholar] [CrossRef]
  84. Tumbo, S.D.; Salyani, M.; Miller, W.M.; Sweeb, R.; Buchanon, S. Evaluation of a variable rate controller for aldicarb application around buffer zones in citrus groves. Comput. Electron. Agric. 2007, 56, 147–160. [Google Scholar] [CrossRef]
  85. Tola, E.; Kataoka, T.; Burce, M.; Okamoto, H.; Hata, S. Granular fertiliser application rate control system with integrated output volume measurement. Biosyst. Eng. 2008, 101, 411–416. [Google Scholar] [CrossRef]
  86. Chandel, N.S.; Mehta, C.R.; Tewari, V.K.; Nare, B. Digital map-based site-specific granular fertilizer application system. Curr. Sci. 2016, 111, 1208–1213. [Google Scholar] [CrossRef]
  87. Tewari, V.K. Application of microcontroller interfaced with DGPS for variable rate fertilizer applicator. In Proceedings of the ASABE Annual International Meeting, New Orleans, LA, USA, 26–29 July 2015; pp. 1–8. [Google Scholar] [CrossRef]
  88. Alameen, A.A.; Al-Gaadi, K.A.; Tola, E. Development and performance evaluation of a control system for variable rate granular fertilizer application. Comput. Electron. Agric. 2019, 160, 31–39. [Google Scholar] [CrossRef]
  89. Talha, Z.; Tola, E.; Al-Gaadi, K.A.; Kheiralla, A.F. Pneumatic system for granular fertilizer flow rate control. Middle East J. Sci. Res. 2011, 8, 688–693. [Google Scholar]
  90. Reyes, J.F.; Esquivel, W.; Cifuentes, D.; Ortega, R. Field testing of an automatic control system for variable rate fertilizer application. Comput. Electron. Agric. 2015, 113, 260–265. [Google Scholar] [CrossRef]
  91. Jones, A.; Ali, U.; Egerstedt, M. Optimal pesticide scheduling in precision agriculture. In Proceedings of the ACM/IEEE 7th International Conference on Cyber-Physical Systems (ICCPS), Vienna, Austria, 11–14 April 2016; pp. 1–8. [Google Scholar] [CrossRef]
  92. Sokefeld, M. Variable rate technology for herbicide application. In Precision Crop Protection-the Challenge and Use of Heterogeneity; Springer: Dordrecht, The Netherlands, 2010; pp. 335–347. [Google Scholar] [CrossRef]
  93. Longchamps, L.; Khosla, R.; Reich, R.; Gui, D.W. Spatial and temporal variability of soil water content in leveled fields. Soil Sci. Soc. Am. J. 2015, 79, 1446–1454. [Google Scholar] [CrossRef]
  94. Linker, R. Model-based optimal delineation of drip irrigation management zones. Precis. Agric. 2021, 22, 287–305. [Google Scholar] [CrossRef]
  95. Sharma, V.; Irmak, S. Comparative analyses of variable and fixed rate irrigation and nitrogen management for maize in different soil types: Part I. Impact on soil-water dynamics and crop evapotranspiration. Agric. Water Manag. 2021, 245, 106644. [Google Scholar] [CrossRef]
  96. Serrano, J.; Shahidian, S.; Marques da Silva, J.; Paixão, L.; Moral, F.; Carmona-Cabezas, R.; Garcia, S.; Palha, J.; Noéme, J. Mapping Management Zones Based on Soil Apparent Electrical Conductivity and Remote Sensing for Implementation of Variable Rate Irrigation—Case Study of Corn under a Center Pivot. Water 2020, 12, 3427. [Google Scholar] [CrossRef]
  97. Mendes, W.R.; Araújo, F.M.U.; Dutta, R.; Heeren, D.M. Fuzzy control system for variable rate irrigation using remote sensing. Expert Syst. Appl. 2019, 124, 13–24. [Google Scholar] [CrossRef]
  98. Zhao, W.; Li, J.; Yang, R.; Li, Y. Determining placement criteria of moisture sensors through temporal stability analysis of soil water contents for a variable rate irrigation system. Precis. Agric. 2018, 19, 648–665. [Google Scholar] [CrossRef]
  99. Miller, K.A.; Luck, J.D.; Heeren, D.M.; Lo, T.; Martin, D.L.; Barker, J.B. A geospatial variable rate irrigation control scenario evaluation methodology based on mining root zone available water capacity. Precis. Agric. 2018, 19, 666–683. [Google Scholar] [CrossRef]
  100. He, X.; Ding, Y.; Zhang, D.; Yang, L.; Cui, T.; Zhong, X. Development of a variable-rate seeding control system for corn planters Part II: Field performance. Comput. Electron. Agric. 2019, 162, 309–317. [Google Scholar] [CrossRef]
  101. Šarauskis, E.; Kazlauskas, M.; Naujokiene, V.; Bruciene, I.; Steponavicius, D.; Romaneckas, K.; Jasinskas, A. Variable Rate Seeding in Precision Agriculture: Recent Advances and Future Perspectives. Agriculture 2022, 12, 305. [Google Scholar] [CrossRef]
  102. Koch, B.; Khosla, R.; Frasier, W.M.; Westfall, D.G.; Inman, D. Economic feasibility of variable-rate nitrogen application utilizing site-specific management zones. Agron. J. 2004, 96, 1572–1580. [Google Scholar] [CrossRef]
  103. Rodriguez, D.G.P.; Bullock, D.S.; Boerngen, M.A. The origins, implications, and consequences of yield-based nitrogen fertilizer management. Agron. J. 2019, 111, 725–735. [Google Scholar] [CrossRef]
  104. Trevisan, R.G.; Bullock, D.S.; Martin, N.F. Spatial variability of crop responses to agronomic inputs in on-farm precision experimentation. Precis. Agric. 2021, 22, 342–363. [Google Scholar] [CrossRef]
  105. Sanches, G.M.; Otto, R. A novel approach for determining nitrogen requirement based on a new agronomic principle—sugarcane as a crop model. Plant Soil 2022, 472, 29–43. [Google Scholar] [CrossRef]
  106. Maleki, M.R.; Zamiran, A. Evaluating the profitability of a soil sensor-based variable rate applicator for on-the-go phosphorus fertilization. Int. J. Agric. Biol. 2009, 11, 651–658. [Google Scholar]
  107. Gurjar, B.; Sahoo, P.K.; Kumar, A. Design and development of variable rate metering system for fertilizer application. J. Agric. Eng. 2017, 54, 12–21. [Google Scholar]
  108. Katz, L.; Ben-Gal, A.; Litaor, M.I.; Naor, A.; Peres, M.; Bahat, I.; Netzer, Y.; Peeters, A.; Alchanatis, V.; Cohen, Y. Spatiotemporal normalized ratio methodology to evaluate the impact of field-scale variable rate application. Precis. Agric. 2022, 23, 1125–1152. [Google Scholar] [CrossRef]
  109. Zhang, J.; Liu, G. Effects of control sequence optimisation on the performance of bivariate fertiliser applicator. Comput. Electron. Agric. 2022, 192, 106594. [Google Scholar] [CrossRef]
  110. Heiß, A.; Paraforos, D.S.; Sharipov, G.M.; Griepentrog, H.W. Real-time control for multi-parametric data fusion and dynamic offset optimization in sensor-based variable rate nitrogen application. Comput. Electron. Agric. 2022, 196, 106893. [Google Scholar] [CrossRef]
  111. Guerrero, A.; Mouazen, A.M. Evaluation of variable rate nitrogen fertilization scenarios in cereal crops from economic, environmental and technical perspective. Soil Tillage Res. 2021, 213, 105110. [Google Scholar] [CrossRef]
  112. Amaral, L.R.; Trevisan, R.G.; Molin, J.P. Canopy sensor placement for variable-rate nitrogen application in sugarcane fields. Precis. Agric. 2018, 19, 147–160. [Google Scholar] [CrossRef]
  113. Colaço, A.F.; Molin, J.P. Variable rate fertilization in citrus: A long term study. Precis. Agric. 2017, 18, 169–191. [Google Scholar] [CrossRef]
  114. Guerrero, A.; De Neve, S.; Mouazen, A.M. Current sensor technologies for in situ and on-line measurement of soil nitrogen for variable rate fertilization: A review. Adv. Agron. 2021, 168, 1–38. [Google Scholar] [CrossRef]
  115. Guerrero, A.; De Neve, S.; Mouazen, A.M. Data fusion approach for map-based variable-rate nitrogen fertilization in barley and wheat. Soil Tillage Res. 2021, 205, 104789. [Google Scholar] [CrossRef]
  116. Sharipov, G.M.; Heiß, A.; Eshkabilov, S.L.; Griepentrog, H.W.; Paraforos, D.S. Variable rate application accuracy of a centrifugal disc spreader using ISO 11783 communication data and granule motion modeling. Comput. Electron. Agric. 2021, 182, 106006. [Google Scholar] [CrossRef]
  117. Dahal, S.; Phillippi, E.; Longchamps, L.; Khosla, R.; Andales, A. Variable rate nitrogen and water management for irrigated maize in the Western US. Agronomy 2020, 10, 1533. [Google Scholar] [CrossRef]
  118. Gatti, M.; Schippa, M.; Garavani, A.; Squeri, C.; Frioni, T.; Dosso, P.; Poni, S. High potential of variable rate fertilization combined with a controlled released nitrogen form at affecting cv. Barbera vines behavior. Eur. J. Agron. 2020, 112, 125949. [Google Scholar] [CrossRef]
  119. Sharipov, G.M.; Heiß, A.; Griepentrog, H.W.; Paraforos, D.S. Evaluation of Centrifugal Spreader Response to Variable Rate Application by Using Task File Data. IFAC-PapersOnLine 2020, 53, 15804–15809. [Google Scholar] [CrossRef]
  120. Song, C.; Zhou, Z.; Zang, Y.; Zhao, L.; Yang, W.; Luo, X.; Jiang, R.; Ming, R.; Zang, Y.; Zi, L.; et al. Variable-rate control system for UAV-based granular fertilizer spreader. Comput. Electron. Agric. 2021, 180, 105832. [Google Scholar] [CrossRef]
  121. Chen, M.; Yang, Z.; Wang, X.; Shi, Y.; Zhang, Y. Response characteristics and efficiency of variable rate fertilization based on spectral reflectance. Int. J. Agric. Biol. Eng. 2018, 11, 152–158. [Google Scholar] [CrossRef]
  122. Chattha, H.S.; Zaman, Q.U.; Chang, Y.K.; Read, S.; Schumann, A.W.; Brewster, G.R.; Farooque, A.A. Variable rate spreader for real-time spot-application of granular fertilizer in wild blueberry. Comput. Electron. Agric. 2014, 100, 70–78. [Google Scholar] [CrossRef]
  123. Fulton, J.P.; Shearer, S.A.; Higgins, S.F.; McDonald, T.P. A method to generate and use as-applied surfaces to evaluate variable-rate fertilizer applications. Precis. Agric. 2013, 14, 184–200. [Google Scholar] [CrossRef]
  124. Robertson, M.J.; Llewellyn, R.S.; Mandel, R.; Lawes, R.; Bramley, R.G.V.; Swift, L.; Metz, N.; O’callaghan, C. Adoption of variable rate fertiliser application in the Australian grains industry: Status, issues and prospects. Precis. Agric. 2012, 13, 181–199. [Google Scholar] [CrossRef]
  125. Kitchen, N.R.; Sudduth, K.A.; Drummond, S.T.; Scharf, P.C.; Palm, H.L.; Roberts, D.F.; Vories, E.D. Ground-based canopy reflectance sensing for variable-rate nitrogen corn fertilization. Agron. J. 2010, 102, 71–84. [Google Scholar] [CrossRef]
  126. Su, N.; Xu, T.; Song, L. Development of a variable rate fertilization control system based on DC motor for use on granular fertilizer applicator. In Proceedings of the Fifth International Conference on Communication Systems and Network Technologies, Gwalior, India, 4–6 April 2015; pp. 1205–1209. [Google Scholar] [CrossRef]
  127. Radite, P.A.S.; Hermawan, W.; Budiyanto, B.; Azis, A. Development of Variable Rate Fertilizer Applicator Module Based on 8-bit Embedded System. In Proceedings of the AFITA International Conference, The Quality Information for Competitive Agricultural Based Production System and Commerce, IPB International Convention Center (IICC), Baranangsiang, Bogor, Indonesia, 4–7 October 2010. [Google Scholar]
  128. Rogers, N.G.; Williams, P.B.; Nafchi, A.M.; Han, Y.J.; Maja, J.M.J.; Payero, J.O.; Khalilian, A. Development of a sensor-based algorithm to determine the mid-season nitrogen requirements in deficit irrigated corn production. In Proceedings of the ASABE Annual International Meeting, American Society of Agricultural and Biological Engineers, Spokane, WA, USA, 16–19 July 2017. [Google Scholar] [CrossRef]
  129. Benjamin, E.; Krishnan, D.A.; Kavitha, R. Development of Fertilizer Broadcaster with Electronically Controlled Fluted Roller Metering Mechanism for Paddy Crop. Int. J. Curr. Microbiol. Appl. Sci. 2019, 8, 2694–2703. [Google Scholar] [CrossRef]
  130. Wang, H.; Gu, Z.; Xu, J.; Li, S.; Qi, Z.; Li, Y.; Zhou, J. Automatic variable rate fertilisation system for improved fertilisation uniformity in paddy fields. Biosyst. Eng. 2022, 219, 56–67. [Google Scholar] [CrossRef]
  131. Qi, J.; Tian, X.; Li, Y.; Fan, X.; Yuan, H.; Zhao, J.; Jia, H. Design and experiment of a subsoiling variable rate fertilization machine. Int. J. Agric. Biol. Eng. 2020, 13, 118–124. [Google Scholar] [CrossRef]
  132. Molin, J.P.; Motomiya, A.V.D.A.; Frasson, F.R.; Faulin, G.D.C.; Tosta, W. Test procedure for variable rate fertilizer on coffee. Acta Scientiarum. Agronomy 2010, 32, 569–575. [Google Scholar] [CrossRef]
  133. Fulton, J.; Shearer, S.; Higgins, S.; McDonald, T.; Dillon, C.; Stombaugh, T. Variable-rate fertilizer application assessment using an as-applied methodology. In Proceedings of the Precision Agriculture ’07, 6th European Conference on Precision Agriculture, Skiathos, Greece, 3–6 June 2007; Wageningen Academic: Wageningen, The Netherlands, 2007; p. 681. [Google Scholar] [CrossRef]
  134. Wigley, K.; Owens, J.; Trethewey, J.; Ekanayake, D.; Roten, R.; Werner, A. Optical sensors for variable rate nitrogen application in dairy pastures. J. N. Z. Grassl. 2017, 79, 223–227. [Google Scholar] [CrossRef]
  135. Zhang, J.; Liu, G.; Huang, J.; Zhang, Y. A Study on the Time Lag and Compensation of a Variable-Rate Fertilizer Applicator. Appl. Eng. Agric. 2021, 37, 43–52. [Google Scholar] [CrossRef]
  136. Mohan, S.S.; Ajay, A.; Jayan, P.R. GPS and Sensor Based Technologies in Variable Rate Fertilizer Application. International Journal of Agriculture, Environ. Biotechnol. 2021, 14, 21–27. [Google Scholar] [CrossRef]
  137. Tang, X.Y.; Chen, Y.Z.; Peng, Y.K.; Wang, X.; Xu, Y.; Yang, W.L.; Wang, W. A DSP-Based Control System for Precision Variable Rate Fertilization. Adv. Mater. Res. 2013, 605, 1408–1414. [Google Scholar] [CrossRef]
  138. Hussain, N.; Farooque, A.A.; Schumann, A.W.; McKenzie-Gopsill, A.; Esau, T.; Abbas, F.; Acharya, B.; Zaman, Q. Design and development of a smart variable rate sprayer using deep learning. Remote Sens. 2020, 12, 4091. [Google Scholar] [CrossRef]
  139. Farooque, A.A.; Hussain, N.; Schumann, A.W.; Abbas, F.; Afzaal, H.; McKenzie-Gopsill, A.; Esau, T.; Zaman, Q.; Wang, X. Field Evaluation of a Deep Learning-based Smart Variable-Rate Sprayer for Targeted Application of Agrochemicals. Smart Agric. Technol. 2022, 3, 100073. [Google Scholar] [CrossRef]
  140. de Paula Corrêdo, L.; de Carvalho Pinto, F.D.A.; Queiroz, D.S.; Valente, D.S.M.; de Melo Villar, F.M. Nitrogen variable rate in pastures using optical sensors. Semin. Cienc. Agrar. 2019, 40, 2917–2932. [Google Scholar] [CrossRef]
  141. Vatsanidou, A.; Fountas, S.; Liakos, V.; Nanos, G.; Katsoulas, N.; Gemtos, T. Life Cycle Assessment of Variable Rate Fertilizer Application in a Pear Orchard. Sustainability 2020, 12, 6893. [Google Scholar] [CrossRef]
  142. Maciel, B.H.; Mantovani, I.; Hubert, M.A.; Goergen, R.; Rannov, C.; Rasia, L.A.; Valdiero, A.C. Development of a Human–Machine Interface Implemented in Smartphone for a Variable Rate Fertilizer Applicator. In Interdisciplinary Conference on Innovation, Desgin, Entrepreneurship, And Sustainable Systems; Springer: Cham, Switzerland, 2021; pp. 356–362. [Google Scholar] [CrossRef]
  143. Hosseini, M.S.; Almassi, M.; Minaei, S.; Ebrahimzadeh, M.R. Response time of a variable rate fertilizer applicator. Adv. Environ. Biol. 2014, 8, 1–9. [Google Scholar]
  144. Jia, H.; Feng, X.; Qi, J.; Liu, X.; Liu, C.; Yang, Y.; Li, Y. Research and Application of Variable Rate Fertilizer Applicator System Based on a DC Motor. In Proceedings of the International Conference on Computer and Computing Technologies in Agriculture, Beijing, China, 18–20 September 2013; pp. 381–391. [Google Scholar]
  145. Yu, Y.J.; Ge, Z.Y.; Zhang, S.H. A Variable Rate Fertilization System Based on ARM and its Realization. Appl. Mech. Mater. 2013, 303, 1465–1469. [Google Scholar] [CrossRef]
  146. Ji, J.; Wang, X.; Ma, W.; Mao, Y.; Guo, J. Development of a controller for an automatic variable rate fertilizer applicator. In Proceedings of the World Automation Congress, Kobe, Japan, 19–23 September 2010; pp. 345–349. [Google Scholar]
  147. Huang, J.X.; Zhou, H.B.; Wang, J.F.; Hou, Y. Research on Variable Rate Fertilization Control System based on Fuzzy PID. Appl. Mech. Mater. 2014, 614, 207–210. [Google Scholar] [CrossRef]
  148. Wang, C.; Liang, L.; Liang, T. Design of variable rate fertilization control system based on improved PID. In Proceedings of the International Conference on Measurement, Information and Control, Harbin, China, 18–20 May 2012; Volume 2, pp. 1037–1040. [Google Scholar] [CrossRef]
  149. Chen, G.; Dong, W.; Jiang, J.; Wang, G. Variable-Rate Fertilization Decision-Making System Based on Visualization Toolkit and Spatial Fuzzy Clustering. Sens. Lett. 2012, 10, 230–235. [Google Scholar] [CrossRef]
  150. Chunying, L.; Xi, W. Variable-rate fertilization control system based on fuzzy PID control strategy. In Proceedings of the International Conference on Electrical and Control Engineering, Wuhan, China, 25–27 June 2010; pp. 2511–2514. [Google Scholar] [CrossRef]
  151. Huang, W.; Chen, L.; Meng, Z.; Zhao, C. Design of Can-based Variable Rate Fertilizer Control System. In Proceedings of the International Conference on Computer and Computing Technologies in Agriculture, Wuyishan, China, 18–20 August 2007; pp. 1317–1320. [Google Scholar] [CrossRef]
  152. Hosseini, M.S.; Almassi, M.; Minaei, S.; Ebrahimzadeh, M.R. Accuracy of two types of fertilizer rate control systems in a variable rate fertilizer applicator. Adv. Environ. Biol. 2014, 8, 306–314. [Google Scholar]
  153. Muslimin, J.; Bakar, B.A.; Abd Rani, M.N.F.; Bookeri, M.A.; Abdullah, M.Z.K.; Ismail, R.; Yasin, L. Performance evaluation of active canopy sensor for variable rate fertilizer model in paddy production. ASM Sci. J. 2020, 13, 96–103. [Google Scholar]
  154. Ma, X.; Ma, C.; Sang, G.; Zhuang, J. Design of variable rate fertilizer applicator. Nongye Jixie Xuebao/Trans. Chin. Soc. Agric. Mach. 2005, 36, 50–53. [Google Scholar]
  155. Yu, Y.; Zhang, S.; Qi, J.; Zhang, L. Positioning method of variable rate fertilizer applicator based on sensors. Nongye Jixie Xuebao/Trans. Chin. Soc. Agric. Mach. 2009, 40, 165–168. [Google Scholar]
  156. Kim, Y.J.; Kim, H.J.; Seo, M.; Rhee, J.Y. Development of a Variable Rate Granule Applicator for Environment-Friendly Precision Agriculture (II)-Development of Pneumatic Fertilizer Blow Head and Its Application Uniformity. Biosyst. Eng. 2006, 31, 474–481. [Google Scholar]
  157. Ryu, K.H.; Kim, Y.J.; Cho, S.I.; Rhee, J.Y. Development of variable rate granule applicator for environment-friendly precision agriculture (I)-concept design of variable rate pneumatic granule applicator and manufacture of prototype. Biosyst. Eng. 2006, 31, 305–314. [Google Scholar] [CrossRef] [Green Version]
  158. Kim, M.H.; Fu, J.D.; Lee, B.W. Determining nitrogen topdressing rate at panicle initiation stage of rice based on vegetation index and SPAD reading. Korean J. CROP Sci. 2006, 51, 386–395. [Google Scholar]
  159. Miller, W.M.; Schumann, A.; Whitney, J.D.; Buchanon, S. Variable rate applications of granular fertilizer for citrus test plots. Appl. Eng. Agric. 2005, 21, 795–801. [Google Scholar] [CrossRef]
  160. Koundal, A.; Singh, M.; Sharma, A.; Mishra, P.K.; Sharma, K. Development and evaluation of an experimental machine for Variable Rate Application of granular fertilizers. In Proceedings of the Sixth International Conference on Sensing Technology (ICST), Kolkata, India, 18–21 December 2012; pp. 370–373. [Google Scholar] [CrossRef]
  161. Fulton, J.P.; Shearer, S.A.; Chabra, G.; Higgins, S.F. Performance assessment and model development of a variable–rate, spinner–disc fertilizer applicator. Trans. ASAE 2001, 44, 1071. [Google Scholar] [CrossRef]
  162. May, S.; Kocabiyik, H. Design and development of an electronic drive and control system for micro-granular fertilizer metering unit. Comput. Electron. Agric. 2019, 162, 921–930. [Google Scholar] [CrossRef]
  163. Fulton, J.P.; Shearer, S.A.; Higgins, S.F.; Darr, M.J.; Stombaugh, T.S. Rate response assessment from various granular VRT applicators. Trans. ASAE 2005, 48, 2095–2103. [Google Scholar] [CrossRef]
  164. Anglund, E.A.; Ayers, P.D. Field evaluation of response times for a variable rate (pressure-based and injection) liquid chemical applicators. Appl. Eng. Agric. 2003, 19, 273–282. [Google Scholar] [CrossRef]
  165. Al-Gaadi, K.A.; Ayers, P.D. Integrating GIS and GPS into a spatially variable rate herbicide application system. Appl. Eng. Agric. 1999, 15, 255–262. [Google Scholar] [CrossRef]
  166. Fulton, J.P.; Shearer, S.A.; Stombaugh, T.S.; Anderson, M.E.; Burks, T.F.; Higgins, S.F. Simulation of fixed–and variable–rate application of granular materials. Trans. ASAE 2003, 46, 1311–1321. [Google Scholar] [CrossRef]
  167. Coelho, J.L.D.; Molin, J.P.; Gadanha Júnior, C.D.; Vasarhelyi, A. Avaliação do Desempenho de Máquinas Aplicadoras a Lanço na Distribuição de Gesso Agrícola (Evaluation of the Performance of Spreader Machines in the Distribution of Agricultural Gypsum); XXI Congresso Brasileiro De Engenharia Agricola E I Simposio De Engenharia Agricola Do Cone Sul (Brazilian Agricultural Engineering Congress): Santa Maria, Brazil, 1992; Volume 4, pp. 2058–2103. [Google Scholar]
  168. Molin, J.P.; Menegatti, L.A.A.; Pereira, L.L.; Cremonini, L.C.; Evangelista, M. Testing a fertilizer spreader with VRT. In Proceedings of the World Congress of Computers in Agriculture and Natural Resources. American Society of Agricultural and Biological Engineers, Iguacu Falls, Brazil, 13–15 March 2002; pp. 232–237. [Google Scholar] [CrossRef]
  169. Fulton, J.P.; Shearer, S.A.; Higgins, S.F.; Hancock, D.W.; Stombaugh, T.S. Distribution pattern variability of granular VRT applicator. Trans. ASAE 2005, 48, 2053–2064. [Google Scholar] [CrossRef]
  170. Nouman, Z.; Klima, B.; Knobloch, J. Generating PWM signals with variable duty from 0% to 100% based FPGA SPARTAN3AN. Electrorevue J. Int. Soc. Sci. Eng. Publ. 2013, 4, 75–79. [Google Scholar]
  171. Cornell University. Nutrient Management Spear Program, Agronomy Fact Sheet 84: Crop Vigor Sensing for Variable-Rate Nitrogen, Greenseeker Algorithm Theory. Available online: http://nmsp.cals.cornell.edu/guidelines/factsheets.html (accessed on 17 December 2019).
  172. Walkley, A.; Black, I.A. An examination of the Degtjareff method for determining soil organic matter, and a proposed modification of the chromic acid titration method. Soil Sci. 1934, 37, 29–38. [Google Scholar] [CrossRef]
  173. Olsen, S.R. Estimation of Available Phosphorus in Soils by Extraction with Sodium Bicarbonate; US Department of Agriculture: Washington, DC, USA, 1954; pp. 1–19.
  174. Pratt, P.F.P. Methods of Soil Analysis: Part 2 Chemical and Microbiological Properties. Am. Soc. Agron. Inc. 1965, 9, 1022–1030. [Google Scholar]
  175. GreenSeeker Handheld Crop Sensor. Available online: https://agriculture.trimble.com/product/greenseeker-handheld-crop-sensor/?_gl=1*1w4jliw*_ga*MTgzMTkxMDY2Mi4xNjU0MDA4MDU3*_ga_1TWB0X464Z*MTY1NDAwODA1Ni4xLjEuMTY1NDAwODExOS4w (accessed on 23 June 2018).
  176. Raun, W.R.; Johnson, G.V.; Lees, H.L.; Sembiring, H.; Phillips, S.B.; Solie, J.B.; Stone, M.L.; Whitney, R.W. Microvariability in soil test, plant nutrient, and yield parameters in bermudagrass. Soil Sci. Soc. Am. J. 1998, 62, 683–690. [Google Scholar] [CrossRef]
  177. Bolland, M.D.A.; Wilson, I.R. Soil phosphorus testing: 1. Studies on spatial variation of Colwell soil test phosphorus. Commun. Soil Sci. Plant Anal. 1994, 25, 2371–2384. [Google Scholar] [CrossRef]
  178. Dhillon, N.S.; Samra, J.S.; Sadana, U.S.; Nielsen, D.R. Spatial variability of soil test values in a Typic Ustochrept. Soil Technol. 1994, 7, 163–171. [Google Scholar] [CrossRef]
  179. Ali, A.M.; Thind, H.S. A framework for refining nitrogen management in dry direct-seeded rice using GreenSeeker™ optical sensor. Comput. Electron. Agric. 2015, 110, 114–120. [Google Scholar] [CrossRef]
  180. Bahri, A. Modulating Wheat Seeding Rate for Site Specific Crop Management. Ph.D. Thesis, University of Nebraska, Lincoln, NE, USA, 1996. [Google Scholar]
  181. Maleki, M.R.; Ramon, H.; De Baerdemaeker, J.; Mouazen, A.M. A study on the time response of a soil sensor-based variable rate granular fertiliser applicator. Biosyst. Eng. 2008, 100, 160–166. [Google Scholar] [CrossRef]
  182. Naser, M.A.; Khosla, R.; Longchamps, L.; Dahal, S. Using NDVI to differentiate wheat genotypes productivity under dryland and irrigated conditions. Remote Sens. 2020, 12, 824. [Google Scholar] [CrossRef]
  183. Thind, H.S.; Kumar, A.; Choudhary, O.P.; Gupta, R.K.; Vashistha, M. Site-specific fertilizer nitrogen management using optical sensor in irrigated wheat in the Northwestern India. Agric. Res. 2017, 6, 159–168. [Google Scholar] [CrossRef]
Figure 1. Schematic diagram of VRT system.
Sustainability 14 11209 g001
Figure 2. View of the variable-rate fertilizer application system.
Sustainability 14 11209 g002
Figure 3. Schematic diagram of the VRT controller system.
Sustainability 14 11209 g003
Figure 4. Experimental field layout for rice crop (red dotted and blue lines represented divisions for different paths and irrigation channels, respectively).
Sustainability 14 11209 g004
Figure 5. Fertilizer distribution rate at different levels of drive-shaft rotational speed.
Sustainability 14 11209 g005
Figure 6. NDVI at different heights of Greenseeker in rice crop for field number 1 at panicle-initiation crop-growth stage.
Sustainability 14 11209 g006
Figure 7. NDVI at different heights of Greenseeker in rice crop for field number 2 at tillering crop-growth stage.
Sustainability 14 11209 g007
Figure 8. Response time (between the applicator sensing a change in NDVI and varying the rotational speed) for both high-to-low (from 50.41 to 12.59 kg ha−1) and low-to-high (from 12.59 to 50.41 kg ha−1) transitions at 3 km ha−1.
Sustainability 14 11209 g008
Figure 9. Average NDVI values for rice crop at different crop-growth stages.
Sustainability 14 11209 g009
Table 1. Fertilizer rate at different rotational speed and coefficient of variation among the outlets.
Drive-Shaft Rotational Speed (rpm)Overall Implementation Error (%)
100.83
201.63
303.56
404.92
Table 2. NDVI, drive-shaft rotational speed, and fertilizer rates applied by applicator at different N levels in paddy crop at 40 DAT (tillering).
N Levels (kg ha−1)Mean NDVI ValuesMean Drive-Shaft Rotational Speed (rpm)Mean Fertilizer Rate (kg ha−1)
N1 = 750.492530.83
N2 = 1250.502630.91
N3 = 1750.532127.08
N4 = 2250.542026.75
Table 3. NDVI, drive-shaft rotational speed, and fertilizer rates applied by applicator at different N levels in paddy crop at 60 DAT (panicle initiation).
N Levels (kg ha−1)Mean NDVI ValuesMean Drive-Shaft Rotational Speed (rpm)Mean Fertilizer Rate (kg ha−1)
N1 = 750.512530.42
N2 = 1250.552025.58
N3 = 1750.611317.58
N4 = 2250.66911.42
Table 4. NDVI, drive-shaft rotational speed, and fertilizer rates applied by applicator at different N levels in paddy crop at 80 DAT (heading).
N Levels (kg ha−1)Mean NDVI ValuesMean Drive-Shaft Rotational Speed (rpm)Mean Fertilizer Rate (kg ha−1)
N1 = 750.502635.29
N2 = 1250.552024.38
N3 = 1750.621217.16
N4 = 2250.6979.15
Table 5. Application rate at all stages of rice crop.
N Levels (kg ha−1)Basal DoseFirst Dose (10 DAT)Second Dose (40 DAT)Third Dose (60 DAT)Fourth Dose (80 DAT)Total
N1 = 752512.530.8330.4235.29134.04
N2 = 1252525.030.9125.5824.38130.87
N3 = 1752537.527.0817.5817.16124.32
N4 = 225255026.7511.429.15122.32
Publisher’s Note: MDPI stays neutral with regard to jurisdictional claims in published maps and institutional affiliations.

