1. Introduction
The concept of sustainable development refers to meeting the needs of the present generation without reducing the chances of the next generations to meet these needs at a similar level. More figuratively speaking, it is about effective management with particular emphasis on caring for natural resources and their availability for future generations. The problem of wasting food on the food market has been present in society for years. The processing sector is responsible for the generation of a large amount of food losses, the number of which depends on the advancement of techniques and the type of raw material processed [
1]. Food losses and waste occur at all stages of the product production chain (growing/breeding–processing–storage–selling–consumption). In developed countries, the greatest losses and food waste concern the phase of consumption, while in developing countries, the greatest losses occur at the handling of the raw material after harvest. In developed countries, raw materials are rejected because they do not meet trade standards, even though they are fit for consumption. On the other hand, in developing countries, these losses relate to a lack of adequate infrastructure, e.g., warehouses, cold stores, etc. [
2]. The causes of large losses include, among others, inadequately selected machines, an incompetent workforce or disloyal suppliers of raw materials [
3,
4]. Moreover, the meat and dairy sector is responsible for the consumption of large deposits and the emission of greenhouse gases [
5]. Although waste is visible in many areas of life and occurs at various levels of food supply chain management, the problem of food waste mainly concerns households; it should be clearly emphasized, however, that a lot depends on the attitudes, habits and behavior of consumers.
In the context of customers, potential solutions to the problem of waste primarily concern changing the attitudes of consumers in terms of awareness of excessive shopping, over-consumption and improper management of food in the household [
6,
7]. Often times, such activities should start with a change of mind and with the help of small steps and awareness-raising activities. One of the important ways to counteract food waste is to make smaller but more frequent purchases. Another is increasing consumer awareness at all stages of life, from educating schoolchildren to educating adults [
8]. The concept of a circular bioeconomy, the principle of which is based on limitation, recycling and re-use, seems to be a good solution [
9].
It is worth mentioning that the Resolution for the General Assembly has developed an action plan for sustainable development, which introduced 17 goals with regard to sustainable development. Worldwide consumption and production—a driving force of the global economy—rest on the use of the natural environment and resources in a way that continues to have destructive impacts on the planet. Economic and social progress over the last century has been accompanied by environmental degradation that is endangering the very systems on which our future development—indeed, our very survival—depends [
https://www.un.org/sustainabledevelopment/sustainable-consumption-production/] (accessed on 18 July 2022). One of the four key objectives in the renewed European Union Sustainable Development Strategy (EU SDS) is environmental protection. The prevention and reduction of environmental pollution and the promotion of sustainable consumption and production (SCP) are fundamental to safeguard the earth’s capacity to support life, respect the limits of the planet’s natural resources, and ensure a high level of environmental protection and improvement [
10]. To reduce inequality among countries and to improve the quality of life, in 2015, the United Nations introduced a new series of goals called ‘Sustainable Development Goals’ (SDGs) made up of 17 goals and 169 associated targets to be achieved over the next 15-year period starting from 2016 until 2030. In order to support the accomplishment of the SDGs, cross-disciplinary cooperation with other parties is required as the goals involve all aspects of human endeavor [
11]. In this situation, corporations play a significant role to support the achievement of the goals as they undertake many business activities that involve and contribute to a country’s standard of living. Hence, there is a major opportunity for corporations to assist governments in achieving the SDGs through their business activities, particularly through corporate social responsibility (CSR) activities [
12].
There are many concepts, the assumptions of which are consistent with a sustainable approach to consumption, such as zero waste or less waste, e.g., the zero waste concept, which treats waste as a substrate for the production of another product. Another is freeganism, a trend based on the principle of reducing the purchase of products to a minimum and obtaining most of the necessary things as a result of the so-called “Second Life”, such as finding them in free classifieds, collection points, landfills or receiving them from others.
One more important issue on the food market is the conflict of interest between the producer and the consumer, because the former are interested in selling as many products as possible and will do their best to convince the client to buy, while the latter, often falling into the trap of shopping, buy unnecessary products, and this the burden of waste is often transferred to them, as they are the last link, and consequently they are credited with throwing away food that they are unable to process or consume [
13].
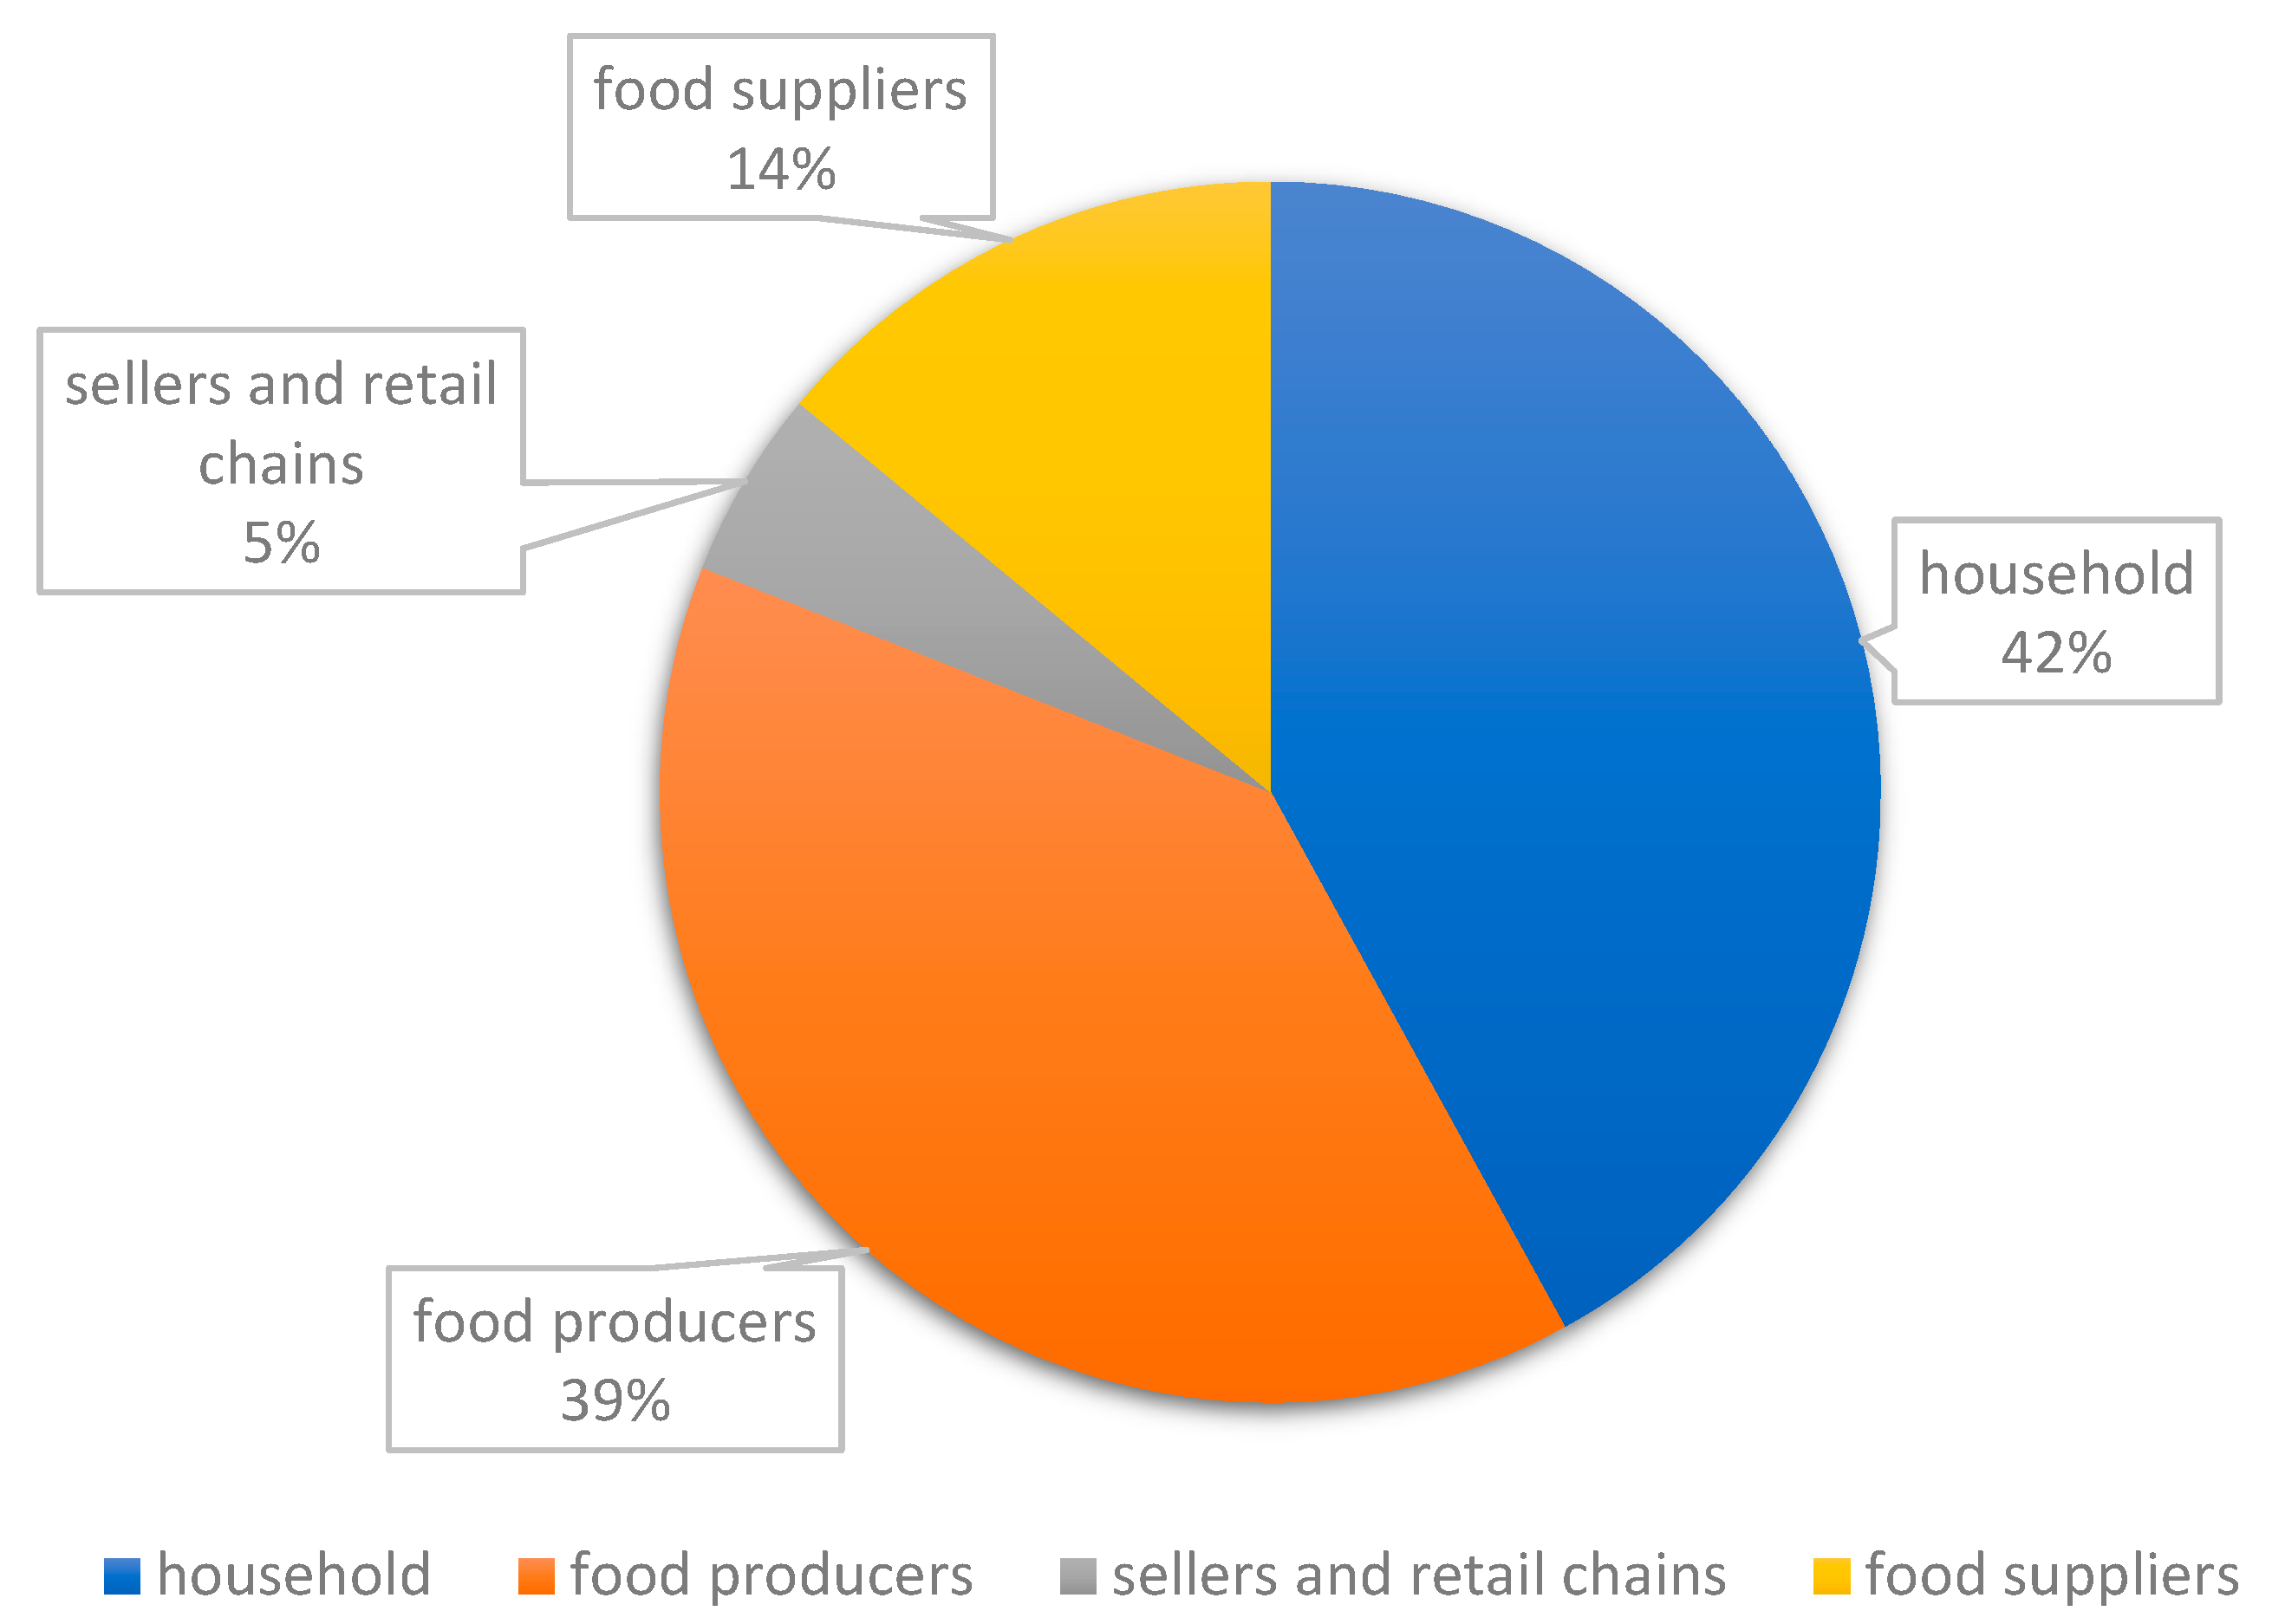
Figure 1 shows the share of individual sectors in food waste.
Food waste has many undesirable effects that have a negative impact on both the environment and society, and as it turns out, the dangers of wasting food can be huge [
15]. Due to this phenomenon, natural resource inputs are unnecessarily used, and it also has an impact on global warming [
16,
17]. Food processing and distribution have been shown to account for about one-fifth of greenhouse gas emissions [
18]. The carbon footprint in the food industry is an estimate of the energy consumption and greenhouse gas emissions caused by the processing and delivery of foodstuffs to the consumer [
19]. The production of 1 kg of beef generates 60 kg of carbon dioxide (IV), which proves that the breeding and processing of cattle is both very expensive and harmful to the environment [
20]. The European Union wants to reduce livestock production, mainly cattle breeding, in order to achieve a degree of neutrality in terms of climate harmfulness. In addition, much more inorganic and organic waste is produced, which requires management and disposal. Food that ends up in landfills during putrefaction processes releases harmful chemicals. Such compounds include methane, which enters the atmosphere and prevents the flow of air, causing the planet to heat up [
21,
22]. It is also worth mentioning the wasted water, the estimated amount of which is about 250 km
3 per year. The water footprint is the amount of water necessary to meet human needs; it is the total amount of water used (directly or indirectly) to produce products [
23]. For example, the production of 1 kg of apples requires approx. 822 L of water, and the production of 1 kg of beef requires approx. 15,500 L of water. It is worth adding that the production of 1 kg of roasted coffee, beloved by the majority of society, uses approx. 21,000 L of water. In fact, these liters of water are not visible; only after adding up the values, the results are surprising. The earth consists of over 1.4 million km
3 of water; however, only about 4% is freshwater, while the rest is salt water [
24]. Much more water is used in developing countries than in highly developed countries. Techniques for minimizing water consumption must therefore be developed that will reduce the need for fresh water and thus reduce the amount of waste water generated. Economic development has the effect of increasing demand for all natural resources, which can result in the depletion of non-renewable resources, including hard coal, lignite, oil and natural gas. While their resources are limited, their exploitation is constantly increasing.
Another negative effect of wastage is the huge financial loss of producers who are not reimbursed for their production costs due to the lack of payment for the goods they have produced [
25]. Human work and the costs of maintaining and operating machines also require a lot of capital, hence another problem resulting from the waste of food. An artificial increase in consumption can be observed, which causes the prices of food products to rise [
26]. Higher prices contribute to a reduction in the availability of food for particular groups of society who simply cannot afford to obtain the products necessary for their functioning. As a result of the projected increase in the number of people and the lack of counteracting food waste, this problem will increase significantly [
26,
27,
28].
Food losses occur during production, cultivation, transportation, processing, distribution and consumption. It is estimated that around 1.3 billion tonnes of edible food are lost or wasted in the supply chain. There are many reasons for this ever-increasing problem. The main factor that relates to each stage is mismanagement or lack of planning. In highly industrialized countries, the highest percentage of food is wasted at the stage of distribution and consumption, while in developing countries, waste mostly occurs at the stage of production. In the case of the first group, it can be concluded that this is due to the excess production and the lack of a rational approach to purchases on the part of consumers. In the second group, it is mainly the result of the lack of skillful planning, modern production techniques and warehouses ensuring appropriate storage conditions. It is also worth paying attention to the quality of food and visual appearance; more and more often on store shelves you can find food items that deviate from commonly accepted standards by consumers [
29]. Most people, when buying fresh produce, such as fruit or vegetables, choose those that look perfect, proportionate, and undamaged. We also often choose foods that can be stored for a long time [
30]. The carriage of foodstuffs, and in particular fresh products such as fruit, vegetables, meat, fish, milk products, juices or crustaceans are particularly sensitive to transport conditions. Subjected to too high or low temperatures, or too much or too little humidity in the air, produce can lose a significant proportion of its quality, leading to wilting, silting or rotting, and therefore becomes unfit for consumption. Therefore, it is very important that the persons responsible for the transport chain of these articles (food logistics) should be able to adjust the temperature, humidity, transport time, drivers and means of transport to the requirements for the transport of individual food goods. This is due to the lack of competences and knowledge about a given topic of employees in these positions. Another reason is the failure of devices responsible for maintaining appropriate conditions of the stored food. The non-observance of the expiry dates of food stored in warehouses is also an oversight on the part of warehouse staff. Markets and grocery stores lower the prices of these products to encourage the customer to buy at all costs; unfortunately, most of this type of food will be wasted and will end up in the trash. Therefore, the causes of waste in the food industry should be analyzed. An inadequate marketing strategy, an incorrectly selected target group of recipients, or inadequate inventory management affect the growth of unsold articles. Currently, there are many organizations that accept food for further (quick) consumption and distribute it to the needy and poor; however, some producers are unaware of the possibility of subsidizing products that are not suitable for sale to these organizations. In this way, the percentage of food thrown away would be reduced and the number of people suffering from hunger would also be reduced. In Poland, there is the Federation of Polish Food Banks dealing with helping the poor and homeless [
31,
32,
33,
34,
35].
The conducted research aims to indicate how big the problem of food waste is. It concerns all aspects of the logistics chain related to both the distribution and consumption of food. Unfortunately, the waste affects producers, distributors and consumers alike. There are many potential bottlenecks that should be looked at in this process. This study focuses on food waste from the consumer side; indeed, waste food the most (as much as 42%). Therefore, further research was devoted to this group—food consumers. Two main questions were asked: how often they waste food, and why they waste it. In the later part of this research, the dependence of price reductions offered by retail chains and the impact of this phenomenon on the amount of food transferred to the so-called food banks is discussed. Both phenomena are worrying because a reduction in the price of food often causes an increase in demand (we buy because it pays off), but consumers do not always buy wisely. They also do not always eat the discounted food on time, and it often has a fairly short expiry date. In fact, this may be because responsibility is passed on from the producer to the consumer. As a result, the food is thrown away by the consumer rather than by the commercial network. Another phenomenon is donating food to institutions in need, which is still not very popular. According to the literature review and our own research, the problem is huge and very complex.
The conducted research was primarily aimed at indicating the importance of the problem of food wastage due to socio-demographic characteristics, and which groups of consumers it is most affected by. In addition, we also aimed to present the problem of food waste in the example of Poland, and to develop preventive measures for this phenomenon in the system of sustainable development [
36,
37].
Due to the research nature of the article, two research hypotheses were proposed to verify the two main problems, which are the frequency and reasons for the wastage of food by consumers. The key here is to determine the validity of hypotheses in the context of differentiation depending on the grouping variable, such as gender or place of living:
Hypothesis 1 . “Food is wasted by consumers very often, and this relationship is differentiated by variables such as gender and place of living”;
Hypothesis 2. “Among the most common reasons for food waste is “the date for consumption has expired,” and this relationship varies by place of living”.
2. Materials and Methods
In order to present the discussed issues in relation to the behavior of consumers in the area of food waste, our own study was carried out to highlight the importance of this problem. The problem analysis was carried out in relation to the consumers’ point of view. Our own research was carried out on a group of adults over 18 years of age. The survey, apart from the metric questions enabling the socio-demographic characteristics of the respondents according to various grouping variables, included questions mainly about: the respondents’ attitude to the problem of food waste, the frequency of throwing it away, the type of food wasted and the reason for which they do it. Respondents were asked about the issues related to whether they waste food, how often it happens to them, what are the reasons that food is wasted, and whether they are taking action and, if so, how to counteract it. The study was conducted on a group of 384 respondents—the research sample was differentiated by sex or place of residence (
Table 1). These were closed questions, which were developed in an unambiguous way so that they did not require additional comments, and the respondents were asked for one correct answer from several available options. Several of the questions were multiple-choice questions, also with the possibility of giving your own different answer (Survey questionnaire—
Supplementary Materials).
The method used was simple non-random selection. Due to the fact that the data were obtained from population samples, they can be considered descriptive studies based on the method of data collection, and more precisely, a research survey. Due to the fact that a qualitative approach was used to conduct the research, it was necessary to use appropriate methods so that the results of the qualitative analysis would allow for a reliable and unambiguous interpretation of phenomena, and give meaning to the responses of the study participants [
38,
39]. Basic information on the conducted research is presented in
Table 2. For this purpose, two main methods of statistical data analysis were used—correspondence analysis and regression analysis.
Data analyses were carried out on the basis of the statistical processing software Statistica 13.3 and Excel 2013. Correspondence analysis was carried out in relation to three selected variables, i.e., gender, places of living and food waste declaration. Correspondence analysis is a descriptive and exploratory technique for analyzing two-way and multi-way tables, containing certain measures that characterize the relationship between columns and rows. The obtained results provide information and allow for the analysis of the structure of qualitative variables making up the table. Therefore, as a result of the analyses, a two-dimensional contingency table was obtained, where the frequencies in the contingency table were first standardized in such a way that the relative frequencies were calculated, which, when summed up in all fields (cells) of the table, give 1.0. One way to show the goals of a typical analysis is to express the relative frequencies by the distance between individual rows or columns in a space with a small number of dimensions. In correspondence analysis, inertia is defined as the quotient of the Pearson chi-square statistic calculated from the two-way table by the total count (in the example presented, the total count is 384). On the other hand, the total inertia is a measure of the profile dispersion around the corresponding average profiles. It should be added that the dimensions are determined in such a way as to maximize the distances between the points representing the rows or columns, and the subsequent dimensions (which are independent or orthogonal to each other) explain smaller and smaller parts of the general chi-square (i.e., also inertia).
In correspondence analysis, the term inertia is used analogously to the concept of the moment of inertia in applied mathematics, which is defined as the mass integral multi-plied by the square of the distance from the center of gravity (or to the notion of variance in statistics). The analysis of statistics and charts resulting from the correspondence analysis allows for intuitive inference about the relationships between the categories of variables.
3. Results
In the first part of the analysis, the results were presented in the form of categorized histograms showing the frequency of discarding food declared by the respondents due to their place of residence. For this purpose, multi-way tables were used. The conducted research shows that the majority of people admit that they only throw away food occasionally, and the group of respondents living in rural areas and cities with more than 300,000 inhabitants often declared that they would rather never do it. The results of this analysis are presented in
Figure 2.
3.1. Statistical Analysis—Correspondence Analysis
Correspondence analysis (CA) is a multivariate statistical method for analyzing tables of categorial data or any data on a common ratio scale. Correspondence analysis is a descriptive and exploratory technique for analyzing two-way and multi-way tables, containing certain measures that characterize the relationship between columns and rows. The obtained results provide information and allow for the analysis of the structure of qualitative variables making up the table [
40,
41].
One of the goals of correspondence analysis is to describe the relationship between two nominal variables in a correspondence table in a low-dimensional space, while describing the relationship between the categories for each variable. CA belongs to the group of multidimensional methods of studying coexistence, and solves one of the most difficult tasks; namely, it enables the accurate recognition of the coexistence of categories of variables or objects measured on a nominal scale. By indicating the links between the categories of features, it extends the scope of the examination of nominal features. Its advantage is the possibility of a clear, graphical presentation of the coexistence of variable categories [
42].
Therefore, as a result of the analyses, a two-dimensional contingency table was obtained, where the frequencies in the contingency table were first standardized in such a way that the relative frequencies were calculated, which, when summed up in all fields (cells) of the table, give 1.0. One way to show the goals of a typical analysis is to express the relative frequencies by the distance between individual rows or columns in a space with a small number of dimensions. In correspondence analysis, inertia is defined as the quotient of the Pearson chi-square statistic calculated from the two-way table by the total count (in the example presented, the total count is 384) [
43,
44].
On the basis of the respondents’ declarations, an analysis of the correspondence between two groups of characteristics was carried out, i.e., the declaration regarding the frequency of food waste (variables: X1—I never throw away food; X2—sporadically; X3—once a week; X4—2–3 times a week; X5—daily), as well as the gender and place of residence of the respondents (gender: female, male; place of living: RA—rural area; C < 100—city up to 100th residents; C100–300—city of 100–300th residents; C > 300—city with more than 300 th. residents). A two-dimensional factor space was chosen to represent the configuration of the points representing the input data.
The first factor allows the reproduction of 65.83% of the input data variation (i.e., total inertia), while the second factor allows 86.35%, as shown in
Table 3.
As already mentioned at the beginning of the correspondence analysis undertaken, the first two dimensions allow for the reconstruction of 86.35%, i.e., they explain the greatest amount of variation in the input data (total inertia).
Table 3 presents the eigenvalues of the separated dimensions. The total inertia is 0.22205, the chi-square (χ2) test value is 85.268,
p = 0.0000.
Figure 3 also shows that the greatest share in the creation of the two-dimensional factor space by the frequency of food waste had the answers of the respondents: sporadically (X2), 2–3 times a week (X4), and every day (X5) as the 1st coordinate; and the answer that they never throw away food (X1) or once a week (X3) as coordinate II.
On the other hand, women, living in cities of 100–300 thousand people, had the largest share in creating a two-dimensional factor space by gender and place of residence. Men living in cities of up to 100,000 inhabitants and women living in cities of 100-300 thousand people had one dimension. In the case of the second dimension, men living in rural areas and women living in cities with less than 100,000 inhabitants had the greatest share in the creation of the factor space, and female with those in cities of more than 300,000 inhabitants (
Figure 3).
Thus, as can be seen from the correspondence analysis, four groups with a similar structure of indicators can be distinguished (
Figure 3). The first (GI) is made up of women living in rural areas and medium-sized cities, i.e., 100,000–300,000 residents, declaring that they throw food sporadically. The second group (GII) are men living in rural areas who say they never throw away food. The third group (GIII) are men living in small towns, i.e., up to 100,000 residents who say that they throw away food quite often, i.e., 2–3 times a week, and some of them even every day. The last, fourth group (GIV) are women living in small towns (up to 100,000 inhabitants), who throw away food once a week.
Two groups seem to stand out from the rest particularly significantly, the third (GIII) and the fourth (GIV) group, because in these two groups there are relatively strong bonds. Due to the values of these indicators, these two groups under discussion stand out from the other groups.
Thus, Hypothesis 1 has been verified positively, as the frequency of food waste by consumers varies by place of residence, as confirmed by the correspondence analysis conducted above.
Another important question is why food is wasted. According to the women’s declaration (
Figure 4a), food is wasted when the use-by date has passed, and when signs of deterioration such as mold or food rancidity can be seen. This situation repeats itself in all groups of respondents due to their place of residence, but it is the group of people living in rural areas that is the largest here.
In the case of declarations made by men, the situation with regard to the expired shelf-life date seems to be, as in the case of women, the main reason why this food is wasted, especially among men living in medium-sized cities, i.e., 100,000–300,000 residents. On the other hand, the second most frequent answer is surprising, as men largely replied that they were not wasting their food (
Figure 4b).
In the case of Hypothesis 2, it was positively verified only partially, as “spoiled food” (“you can see mold, smell rancid—Z2”) was indicated among the most common reasons for consumers to waste food, rather than “the date for consumption has expired–Z1”, as expected. On the other hand, the reason (Z2) varies due to the grouping variable—the place of residence—as confirmed by the survey results shown in
Figure 4a,b.
3.2. Statistical Analysis—Correlation of Individual Variables
In order to verify the collected data, a statistical analysis was performed with the use of the Statistica 13.3 SW. For this purpose, an analysis of the correlation of individual variables (food whose price has been lowered by a trading network—V1, and food donated to non-profit organizations—V2) was carried out. The correlation between the variables V1 and V2 is a measure of the strength of the linear relationship between these variables. The analysis of the correlation relationship between the examined features began with the calculation of the correlation between the individual variables and the preparation of a chart. Charts that graphically represent the relationship between variables are called scatterplots.
To carry out regression analysis, it is necessary to consider three selection steps:
Step 1—the independent variables (V2, which is the explanatory variable, the predictor) must be substantively related to the phenomenon under study (with variable V1, the modeled variable). In the case of the research we conducted, the variables are related because the greater the price discounts given by the retail chain, the greater the interest in the products, and this affects the amount of food donated to non-profit institutions.
Step 2—the independent variables (V2) should have a statistical relationship with the modeled variable (V1). We create a correlation matrix between the independent variable and the dependent variable and look at the correlation coefficient between them; the correlation matrix between the dependent variable (V1) and the independent variable (V2) showed a negative relationship at −0.3708.
Step 3—the independent variables (V2) should not be excessively correlated with each other. In the case of our study, the correlation is quite high, but it does not show excessive correlation between the variables V1 and V2.
Table 4 presents a summary of the statistical values of the individual variables.
Table 3 presents information on, inter alia, the largest dependencies, whether the correlation is statistically significant, and with what level of significance.
The statistical test shows that the null hypothesis H0 Pearson’s linear correlation coefficient is 0, while the alternative hypothesis H1 ≠ 0, i.e., p < 0.05, which means that the value of the correlation coefficient is statistically significantly different from 0, i.e., the relationship is significant, and the correlation coefficient is not statistically significant.
As the data presented in
Table 4 shows that there is a quite strong correlation between food whose price has been lowered by a trading network (V1) and food donated to non-profit organizations (V2), only the variables relating to these two relationships were included in the further analysis, as shown in
Figure 5.
Table 5 shows accurate results of the statistical analysis of the correlation for food whose price has been lowered by a trading network (V1) and food donated to non-profit organizations (V2). The individual fields of the results sheet contain arithmetic means of selected variables (1435 for food donated to non-profit organizations—V2; −271,150 for food whose price has been lowered by a trading network—V1) and the standard deviation values (3443.6 for V2; 101,332.3 for V1).
The Pearson correlation coefficient was −0.3708, and the determination coefficient (r2 square of the correlation coefficient) was as high as 0.1375. The correlation coefficient is a descriptive measure of the accuracy of fitting regression to empirical data. It assumes values in the range <0, 1>, or in percentage <0, 100%>, and informs, according to the record, how much of the total variability in Y observed in the sample was explained (determined) by regression in relation to X. The greater r2, the better the relationship, and we can have more confidence in a possible regression line. The value of the t-statistic examining the significance of the correlation coefficient is −1.6462, the value of the test probability is p = 0.0118, the size of the group is 19 cases, the intercept of linear regression Y with respect to X is −255,489, the coefficient of linear regression of the variable Y with respect to the variable X is −10.9111, and the intercept linear regression of X with respect to Y is −1981.44, while the coefficient of linear regression of variable X with respect to Y is −0.0126.
The data presented in
Table 5 make it possible to calculate the regression function of the variable Y against X and the regression function of the variable X against Y, describing the analytical form of the relationship between the variables.
The results presented in the chart show a fairly strong but negative correlation (r = −0.3708) between food that is overestimated by the commercial network (V1), i.e., one that applies a price reduction, to products that, for various reasons, should be “quickly sold”, and the amount of products that are transferred to the so-called community organizations (V2), such as food banks or other non-profit organizations that provide assistance to those in need.
Thus, a clear trend in this phenomenon can be noticed—because the price reduction favors decisions made by consumers, they are more inclined to buy the product at a “reduced price”; hence, the point of sale partially has the problem solved, while the responsibility regarding the need for accelerated consumption is then shifted to the customer. It should be remembered that consumers buying a product at a reduced price did not always plan to buy it, and such action can be irrational and, consequently, result in a loss, i.e., wasted.
4. Discussion
In the currently quite dynamically developing market and the constant change of civilization, the satisfaction of physiological needs such as eating food remains unchanged [
45]. Over the past decades, eating habits have changed, but the need to consume food is still the same. For this reason, well-developed countries have begun to overproduce food on a large scale, and due to excess food, a significant part is spoiled. However, the problem of waste in the food market is becoming increasingly serious, and the causes of this phenomenon should be looked at more closely. In poor countries, access to food is a problem, while in richer countries, wasting food is a problem [
46]. Research in Europe revealed that about 179 kg of food per person are thrown away each year. According to Bilska et al. [
47], in Poland, about 235 kg per person is wasted per year. Households that are responsible for the greatest food waste, producing 38 million tonnes of food waste annually, which makes up 42% of losses in the entire food chain in the European Union. Production makes up 39%, food services make up 14%, and retail and wholesale contribute to 5% of food waste. Polish households waste 22.8% of food. Poland came seventh among European countries in terms of the amount of food wasted.
Figure 1 shows the percentage share of individual sectors in this practice.
This waste is caused by the inadequate management of food products and the raw materials necessary for their production. Producers do not take into account the costs incurred, the consumption of natural resources or human work [
45]. The responsibility for it is also lies, in part, on the consumers; they buy too much food that they are not able to consume by the expiry date and, as a consequence, throw the produce in the garbage [
48]. In recent years, more and more people confirm that they are experiencing such a practice. Despite an increase in the more ecological approach to purchasing choices, the trend of showing one’s wealth to others by buying excess food is not diminishing. If nothing changes, we can expect a rapid increase in waste, which has a very harmful impact on the environment, and the loss of natural resources [
49,
50].
One of the main problems is losses at the level of storage, processing and production, while the other is trade with distribution and consumption. Productive food losses in relation to the agricultural sector refer to the accidental reduction in the quantity and quality of food before consumption. These losses are mainly related to weather anomalies, plant diseases and the presence of pests, as well as changes in cultivation/harvesting techniques.
Another rather important problem relates to deliberately discarding food that is fit for human consumption. The global demand for food continues to increase; it is estimated that about 680 million people lack food access and suffer from malnutrition. The problem is projected to increase significantly due to the COVID-19 pandemic, which is still ongoing [
9,
48,
51]. Overall, the first wave of the pandemic disrupted the four basic pillars of food security (availability, access, use and stability). Society, fearing the impending threat, began to accumulate food in large amounts, regardless of whether there would be enough for the others. In March last year, the shortages of durable food products such as groats, pasta and canned food could be seen on store shelves. Due to the sudden increase in demand, warehouses and wholesalers were unable to keep up with the supply of stocks. Another disruption resulting from the COVID-19 pandemic on the food market was the impeded movement of people and limited stay in public places. There was an increase in interest in cheaper food of lower quality due to the increase in unemployed people as a result of the pandemic, as well as an increase in the prices of commonly selected products. Moreover, while it appears that society is gradually starting to pay attention to the amount of thrown away and bought food, it is known that it is impossible to completely reduce the amount of wasted food and losses resulting from its production [
16,
18,
32,
33,
34,
35,
38].
With regard to the conducted own research, which partially agrees with the conducted literature review, it should be clearly emphasized that the main causes of food waste in households include:
- –
throwing away food with an expiring use-by date;
- –
insufficient co-educational programs;
- –
inadequate quality of products;
- –
irrational shopping;
- –
lack of knowledge about the appropriate method of storing food products;
- –
lack of consumer awareness of the growing scale of the problem of wasting food;
- –
inadequate preparation of food portions during the preparation of meals;
- –
easy access to food;
- –
affordability of low-quality food [
27].
Above are some of the main causes of waste in households. The above-mentioned factors prove the lack of awareness and rational approach of consumers to the growing problem of wasted food. Bad eating habits and the incomprehensible need to buy food in too large quantities are deeply rooted in society. On the other hand, it is difficult to change something that has been promoted by the media and influential figures for so many years [
52]. It is worth paying attention to the behavior of adolescents and children towards food. They have a significant impact on the development or reduction of the problem in the future [
53]. Nutrition education begins at home; as such, young people share their parents’ mistakes. It is necessary to increase social awareness and universally accessible education in this direction for both younger and adult people. Society should buy as much as it can eat in order to limit throwing food produce into the trash, and thus reduce the consumption of natural resources [
34,
46].
In the context of counteracting food waste, it should be clearly emphasized that the problems related to the environment and food safety refer to the current problem that has stimulated the global awareness of the society. Various communities such as governments, academia and NGOs have started trying to solve these problems. Rapid industrialization and urbanization affect climate change through dangerously high levels of greenhouse gas emissions, mostly carbon dioxide (IV), into the atmosphere. Climate change is responsible for more frequent weather anomalies such as violent and gusty storms, as well as droughts that seriously threaten crops [
54]. Reducing food losses and wastage in the various parts of the chain, from production to consumption, will improve food security and thus reduce the consumption of natural resources. According to Wrzosek et al. [
55], “The structure of food losses presented by the FAO indicates that nearly 33% of products considered as waste are not suitable for further consumption, while the remaining 2/3 of the food could be consumed.” Global food waste is under constant surveillance thanks to the Food Loss Index (FLI) and the Food Waste Index (FWI). The latter covers the level of retail sales and consumption, and is under development. On the other hand, the Food Loss Index shows that there are large losses of food in all stages of the chain, from production to retail sales. National governments, in order to limit the growing problem, issue dedicated acts, laws and run campaigns to educate consumers. These documents show that a sustainable agri-food system and food supply chains ensuring food security should be introduced. The best option is a circular bioeconomy that involves reducing, recycling and reusing [
56,
57]. A circular bioeconomy strategy would help to achieve energy and environmental security that leads to food security, i.e., free access to food for all people [
58,
59,
60]. This is very important as the world population is growing steadily and there is a risk of worsening hunger among the population. This system would restore effective efficiency and reduce the consumption of natural resources. Properly applied actions in the supply chain can reduce water and energy consumption, as well as implement the principles of bioeconomy [
61]. The world’s agri-food systems absorb enormous amounts of water and energy during production and distribution. Agriculture is responsible for approx. 72% of water consumption, while food production and distribution are responsible for approx. 30% of energy consumption in the world. Globally, the use of fossil fuels, the extraction of which uses a lot of water, dominates the use of water-saving, renewable energy sources. The relationship between water, energy and food security is critical to achieving sustainable development. These three concepts are closely related to each other in social, environmental and economic terms. It is important to introduce appropriate management of these resources so that the human population can use them for as long as possible. It is important to develop communication between all actors in the distribution chain and to improve cooperation between sectors. The forecasts for the coming years are not optimistic, because the rapid economic development, urbanization, population growth, climate change and changes in dietary preferences are set to increase the demand for water by up to 55% in 2050. Energy consumption and food demand could increase by 50% in 2035 as the population is expected to increase to as much as 9 billion. If the current situation does not improve, such forecasts do not sound optimistic. It is important that consumers understand the seriousness of the matter and take preventive measures. In recent years, there has been an increase in the number of people promoting a life without producing waste, encouraging a reduction in waste. The public is partially aware of the fact that by buying and throwing away food in excess, it is not only wasting money but also depriving future generations of access to non-renewable resources. Therefore, the pressure should be increased, and people should be encouraged to save money and care for ecology. In light of this, the number of organizing campaigns and advertising spots on this subject should be increased. It is impossible to force all people to make rational purchases or limit food throwing away. We need to encourage and interest the public to change their habits so that they would like to respect food and care for the environment on a daily basis [
62]. The basic prevention of food waste comes from early education in schools; children are the future of society, and everything begins with them. Habits and behaviors that they take away from family homes are not always good, and young people often share their parents’ mistakes. There are several ways to reduce unnecessary food waste in households. A good solution is to minimize buying the so-called “stock” of short-life food products (fruit, meat products, dairy products). Some products can be easily frozen and their nutritional values remain the same. It is worth checking the refrigerator and pantry more often to find out about the expiry dates of the products. Leftovers from meals can be composted and then processed into natural fertilizers. Household kitchens can be emptied once a week and a meal prepared using the leftover products. Many food products are thrown away due to inadequate storage, so labels should be read and the manufacturers’ recommendations followed [
18,
63]. According to Rejman et al. (2016), wasted bread, dairy products and ready-to-eat meals are the most common in the household [
64]. Sustainable consumption and diet of society is one of the recommended options by the international organizations, the WHO and the FAO. This mainly involves reducing consumerism among wealthy people in order to minimize the consumption of natural resources for the sake of the next generations of society [
65]. Another project promoted by the FAO is “Save Food”, the assumptions of which are, among others: initiating private–public partnership and conducting information campaigns on the increasing problem, with better prepared data analyses based on the conducted research. In its documents, the European Union refers to the problem of wasting food, and in the Europe 2020 strategy, calls on the Member States to use goods efficiently and rationally. In 2012, the European Parliament adopted a resolution on “Avoiding food waste: a strategy to improve the efficiency of the food chain in the EU (2011/2175 (INI))”. This document provides information on reducing food waste by half, as well as increasing the availability of food for poorer citizens.
One thing is certain; this problem must be solved and the amount of food waste must be reduced, otherwise natural resources and deposits will be prematurely depleted. First of all, government authorities still need put in considerable work and improve their actions in order to reach consumers and change their shallow worldview in relation to food waste. There are social groups that are fully aware of the growing problem and are trying to get other people to change their lifestyle [
33,
38,
39,
47].
5. Conclusions
Based on the survey research conducted in Poland, it can be concluded that the problem of food waste is becoming increasingly worrying. The greatest waste in terms of households is due to:
- –
omission of the use-by date for food products;
- –
inadequate planning in the area of purchases made by consumers;
- –
buying in stock products that are then left unused.
In order to minimize this problem, many preventive actions are initiated, both on the part of the government and the philosophy of social life.
The concept of reducing the production of waste, “Zero Waste”, which has its roots in Japan, is gaining more and more popularity. It was used for the first time in the USA in the 1970’s. According to this concept, waste is treated as a raw material that is used to produce another product. The term largely means life without rubbish. The principle of this trend is the practice of sustainable consumption and avoiding the generation of unnecessary waste. A new trend that is spreading among people who care about the environment, called freeganism, is also gaining increasing popularity. This trend comes from the USA; it arose from the combination of two words “free”—free, and “veganism”—vegan. The latter concerns a diet which is mainly based on the abstention of animal products. Followers of this trend try to limit the buying of both food and material goods, and strive to live ecologically. On a daily basis, they use the principle of “reduce, reuse, recycle” [
66,
67].
From the point of view of legal provisions, regulations concerning only trade were introduced in September 2019; meanwhile, as the results of the latest research show, most food waste, as much as 60%, goes into the trash straight from our homes. The Food and Agriculture Organization of the United Nations (FAO) reports that 1 billion 300 million tonnes of food suitable for consumption in the world is wasted every year, or one third of the total food produced. It is not only an economic and ecological problem, but above all an ethical one. The latest research carried out in Poland shows that almost 5 million tons of food is wasted in the country every year, more than half of which is landfilled not from trade and gastronomy, as it might seem, but from our homes. The Act of 2019 concerns the donation of food to non-governmental organizations, which may end up in the trash due to expiring use-by dates, the approaching dates of minimum durability, or due to reservations regarding the appearance of food products or their packaging that is not in line with the standards. On the basis of the concluded contract, the stores provide unsold food products to a selected non-governmental organization that meets the requirements of the act. Vendors who throw away food despite the contract are then charged by the organization they signed the contract with. If they do not reach a conclusion, the fees are transferred to the voivodeship fund for environmental protection and water management (WFOŚiGW).
From the point of view of solving the problem of waste, the most important approach is to undertake supra-ministerial actions that will enable the creation of a comprehensive and effective system of monitoring and preventing food waste at all stages of the food chain. Preventing waste is possible if taking the necessary steps for the implementation of the above-mentioned the goals of legislative activities, in cooperation with all stakeholders. It is of great importance to build social awareness of the need to counteract food waste, with the use of a nationwide information campaign concerning, among others, the scale of this phenomenon and its negative social, environmental and economic effects.
Not only in Poland, but around the world, the problem of food waste is growing. According to the Institute for Environmental Protection of the National Research Institute, we waste 4.8 million tons of food per year, of which 0.65% is the responsibility of transportation, 1.17% of catering, 6.96% of commerce, 15.5% of agricultural production, 15.6% of processing, while as much as 60% is from households (
https://ios.edu.pl, accessed on 18 July 2022). Here is where a big problem arises, as enforcing it in such a small area that cannot be directly inspected is particularly difficult. In this regard, research limitations are a major challenge, as we are reluctant to admit to the problem. The most important approach would have to be attributed to education and the constant raising of consumer awareness. The argument could be that, in addition to wasting food, we are also losing money unjustifiably spent on these purchases. Clearly, the problem is very difficult. It is worth taking a closer look at it, in order to seek solutions to reduce food waste in the future.
Although there are more and more ideas and concepts related to the elimination of waste, everything starts in the mind of a person, which is why the most significant action seems to be encouraging the constant awareness of consumers and working out a common policy of various groups, not only for consumers, but also for producers and distributors, by law-makers in the pursuit of sustainable development and humanity’s care for common good in the form of our planet. Unfortunately, this is where the biggest problem arises: How to do it effectively?


