Article

Coordinated Development of Renewable Energy: Empirical Evidence from China

1
School of Earth Sciences and Resources, China University of Geosciences, Beijing 100083, China
2
Institute of Mineral Resources, Chinese Academy of Geological Sciences, Beijing 100037, China
3
Research Center for Strategy of Global Mineral Resources, Chinese Academy of Geological Sciences, Beijing 100037, China
4
School of Business, Hebei University of Economics and Business, Shijiazhuang 050061, China
5
Chinese Academy of International Trade and Economic Cooperation, Beijing 100710, China
*
Author to whom correspondence should be addressed.
Sustainability 2022, 14(18), 11122; https://doi.org/10.3390/su141811122
Submission received: 8 August 2022 / Revised: 31 August 2022 / Accepted: 3 September 2022 / Published: 6 September 2022
(This article belongs to the Special Issue Environmental Economics and Sustainability Policy)

Abstract

:
The utilization of renewable energy (RE) is a meaningful way to realize the low-carbon transformation of energy systems. However, due to the imbalance of resources, economy, technology, society, and environment among regions, the coordinated development of regional RE may be restricted by different factors, which brings challenges to the formulation of relevant development policies. This paper focuses on the development of RE in 30 provinces in China from 2011 to 2019. It uses the AHP-EM integrated evaluation model to evaluate the constructed multilayer indicator system for the comprehensive development of RE. The characteristics of the coupling and coordination relationship between indicators are explored, and the critical driving factors affecting the coordinated development and change in RE in different regions are quantitatively identified through the logarithmic mean Divisia index method. The results show that the comprehensive development level of RE in each province is relatively low, and the relatively high-level areas gradually move eastward in terms of spatial distribution. The degree of coupling and coordination between indicators is still in a low-level coupling stage, and RE in each region has not achieved coordinated development. In addition, the comprehensive development of regional RE is consistent with the spatial evolution characteristics of the degree of coordination among indicators, emphasizing the importance of coordinated development among indicators for RE. These findings will provide broader insights for improving the comprehensive development level of regional RE and formulating differentiated policies.

1. Introduction

The development of renewable energy (RE) is closely related to the issue of carbon emission reduction, which has attracted widespread attention. From a long-term perspective, the development of RE has become a key measure to address global climate change and achieve carbon emission reduction [1,2], as well as an essential means to promote the low-carbon development of the energy structure [3]. On a global scale, RE (wind energy, solar energy) has become a necessary force to replace fossil energy due to its nonpolluting and environmentally friendly nature, and excellent resource potential [4,5]. It is estimated that RE in the EU and the US has received sufficient attention as advocates of a global low-carbon energy system. It is manifested in the rapid growth of wind power and solar installed capacity, increased investment in the RE industry [6,7,8], and an increase in the proportion of RE power generation [9]. However, with the scale development and widespread use of RE, issues such as social acceptance [10,11,12], infrastructure construction [13,14], and grid transmission technology [15,16] related to the RE industry also follow.
In contrast, China, as the world’s largest carbon emitter, is indispensable in addressing climate change and in the process of low-carbon transformation of the global energy system. RE development has become essential for China’s energy transition and carbon neutrality goals [17]. China’s RE industry has also achieved rapid development with the support of relevant policies under the urgent requirement of realizing carbon emission reduction commitments, especially the power generation and utilization of wind and solar energy. China’s installed wind and solar power capacity reached 328.48 GW and 306.56 GW in 2021. It accounts for 24.3% of the total installed capacity (total installed capacity of thermal energy, hydropower, wind power, and photovoltaic power generation). Compared with 2011, its installed capacity’s average annual growth rate reached 21.67% and 62.81%, respectively. However, the proportion of RE power generation in the power structure is still low at this stage, with a total proportion of only 9.53%. Moreover, its future sustainable development also faces many challenges, such as large-scale abandonment of wind and light [18], the difficulty of grid connection and consumption caused by randomness and intermittentness [19], the delay of power grid construction, and insufficient transmission channels [20]. Under this circumstance, how to realize the coordinated and sustainable development of RE has become an urgent problem.
Given the importance and urgency of RE development, many scholars try to understand the development of the RE industry from different perspectives and methods (e.g., Bamati et al. [21]; Clausen et al. [22]; and Zhang et al. [23]). Some scholars have evaluated the development of RE (e.g., Mukeshimana et al. [24] and Wang et al. [25]). The evaluation of energy capacity includes the development level, industrial development potential, and performance of RE utilization. Specifically, using the analytic network process (ANP), Yu et al. [26] comprehensively assessed China’s RE development from the energy, economic, environmental, technological, and social levels. Furthermore, they proposed that the installed capacity of RE is the critical factor affecting its all-around performance. Wang et al. [25] used principal component analysis to comprehensively evaluate RE development from multiple perspectives. The results show that institutions are the most challenging for RE development. Liang et al. [27] used the long-range energy alternatives planning system (LEAP) model to evaluate the impact of RE development planning in China’s power industry and explore possible paths for future power development. Sun et al. [28] evaluated the available potential of different types of RE in China’s eastern coastal provinces using a multicriteria assessment technique of geographic information systems. Singh and Prakash [29] focused on the specific utilization of RE and conducted a feasibility analysis of wind power generation in different regions of India. Sun et al. [30] evaluated the power generation efficiency of biomass energy in China using power generation enterprises as research samples. Dong and Pan [31] decomposed the RE consumption of countries along “the Belt and Road.” They pointed out that energy structure and energy intensity are the main positive and negative contributors to RE consumption. Generally, the development status of RE often does not depend on the outstanding performance of a specific factor. However, most studies only pay attention to the evaluation results and ignore discussing the development balance between indicators.
On the other hand, some scholars have focused on the relevant factors affecting RE development, including technological innovation investment [32,33,34], energy resource endowment [35,36], economic benefits [37,38], social development [39,40], and environmental sustainability [41,42]. Specifically, as a technology-intensive emerging industry, RE has relatively high requirements for related technologies. Investment in scientific and technological innovation can provide sufficient technical support for RE development [43]. Increasing scientific and technological personnel and R&D investment has become the driving force for RE to expand production and play an essential role in improving the utilization efficiency of RE. Energy resource endowment is the basis for the development of RE. The establishment of RE power production in regions with relatively scarce resources will undoubtedly increase the operating cost of electricity [44], which will dampen the enthusiasm for regional RE development. The development of RE requires a stable economic foundation because economic growth can often drive the rapid consumption of electricity, thus increasing the development potential of RE [45]. It is worth noting that to avoid the external diseconomy caused by economic growth, the improvement in economic benefits will inevitably drive the development potential of RE [46]. Similar to economic development, RE for social development is also necessary in the long run [40,41]. The development of RE can provide low-carbon industrial support for the development of the whole society, including sufficient jobs, an increase in residents’ income, and an increase in social welfare. In addition, the primary purpose of developing RE is to reduce environmental pollution. Therefore, environmental sustainability can measure the development level of RE. In short, a high level of RE development can improve environmental pollution and ensure sustainable development of the environment [47,48].
Although scholars at home and abroad have gained some knowledge in understanding RE development in recent years, some issues must be further discussed. First, most of the previous scholars only analyzed some aspects involved in the development of RE, such as the impact assessment of economic growth on RE [49], the resource risk assessment of RE [50], and the assessment of technology on the development of RE [51]. However, cross-synthesis research from multiple perspectives is lacking, which may lead to certain deviations in the research results. Second, there are few quantitative analyses of RE after assessment by relevant scholars, and identifying the limitations of RE development often remains at the qualitative stage [3,22].
To make up for the insufficiency of RE development research at the current stage, this research constructs a multidimensional comprehensive evaluation system of RE development level based on careful consideration of economic, social, technological, energy, and environmental factors. We accurately measure the comprehensive development level of RE. On this basis, combined with the coupling coordination degree and the exponential decomposition model, the coordination of RE development and the dominant factors affecting the change in the coordination degree were quantitatively identified to supplement the qualitative analysis in previous research on the development of RE. In addition, due to differences in natural resource endowment, economic development, technological level, and geographical location among regions, China’s RE industry also has regional imbalances in its industrial development [45,46], which undoubtedly increases the difficulty of implementing RE development policies. Therefore, the results of this study can also provide practical suggestions and references for the coordinated development of RE for national policymakers. The rest of this article is as follows. Section 2 presents the research methodology and data sources. Section 3 presents the model’s results, including the comprehensive development degree of regional RE, the coupling and coordination relationship between dimensions, and the dominant factors affecting its coordinated development and changes. Section 4 summarizes the research and puts forward policy recommendations to improve the comprehensive development level of regional RE and achieve coordinated development.

2. Research Methods and Data

2.1. Research Methods

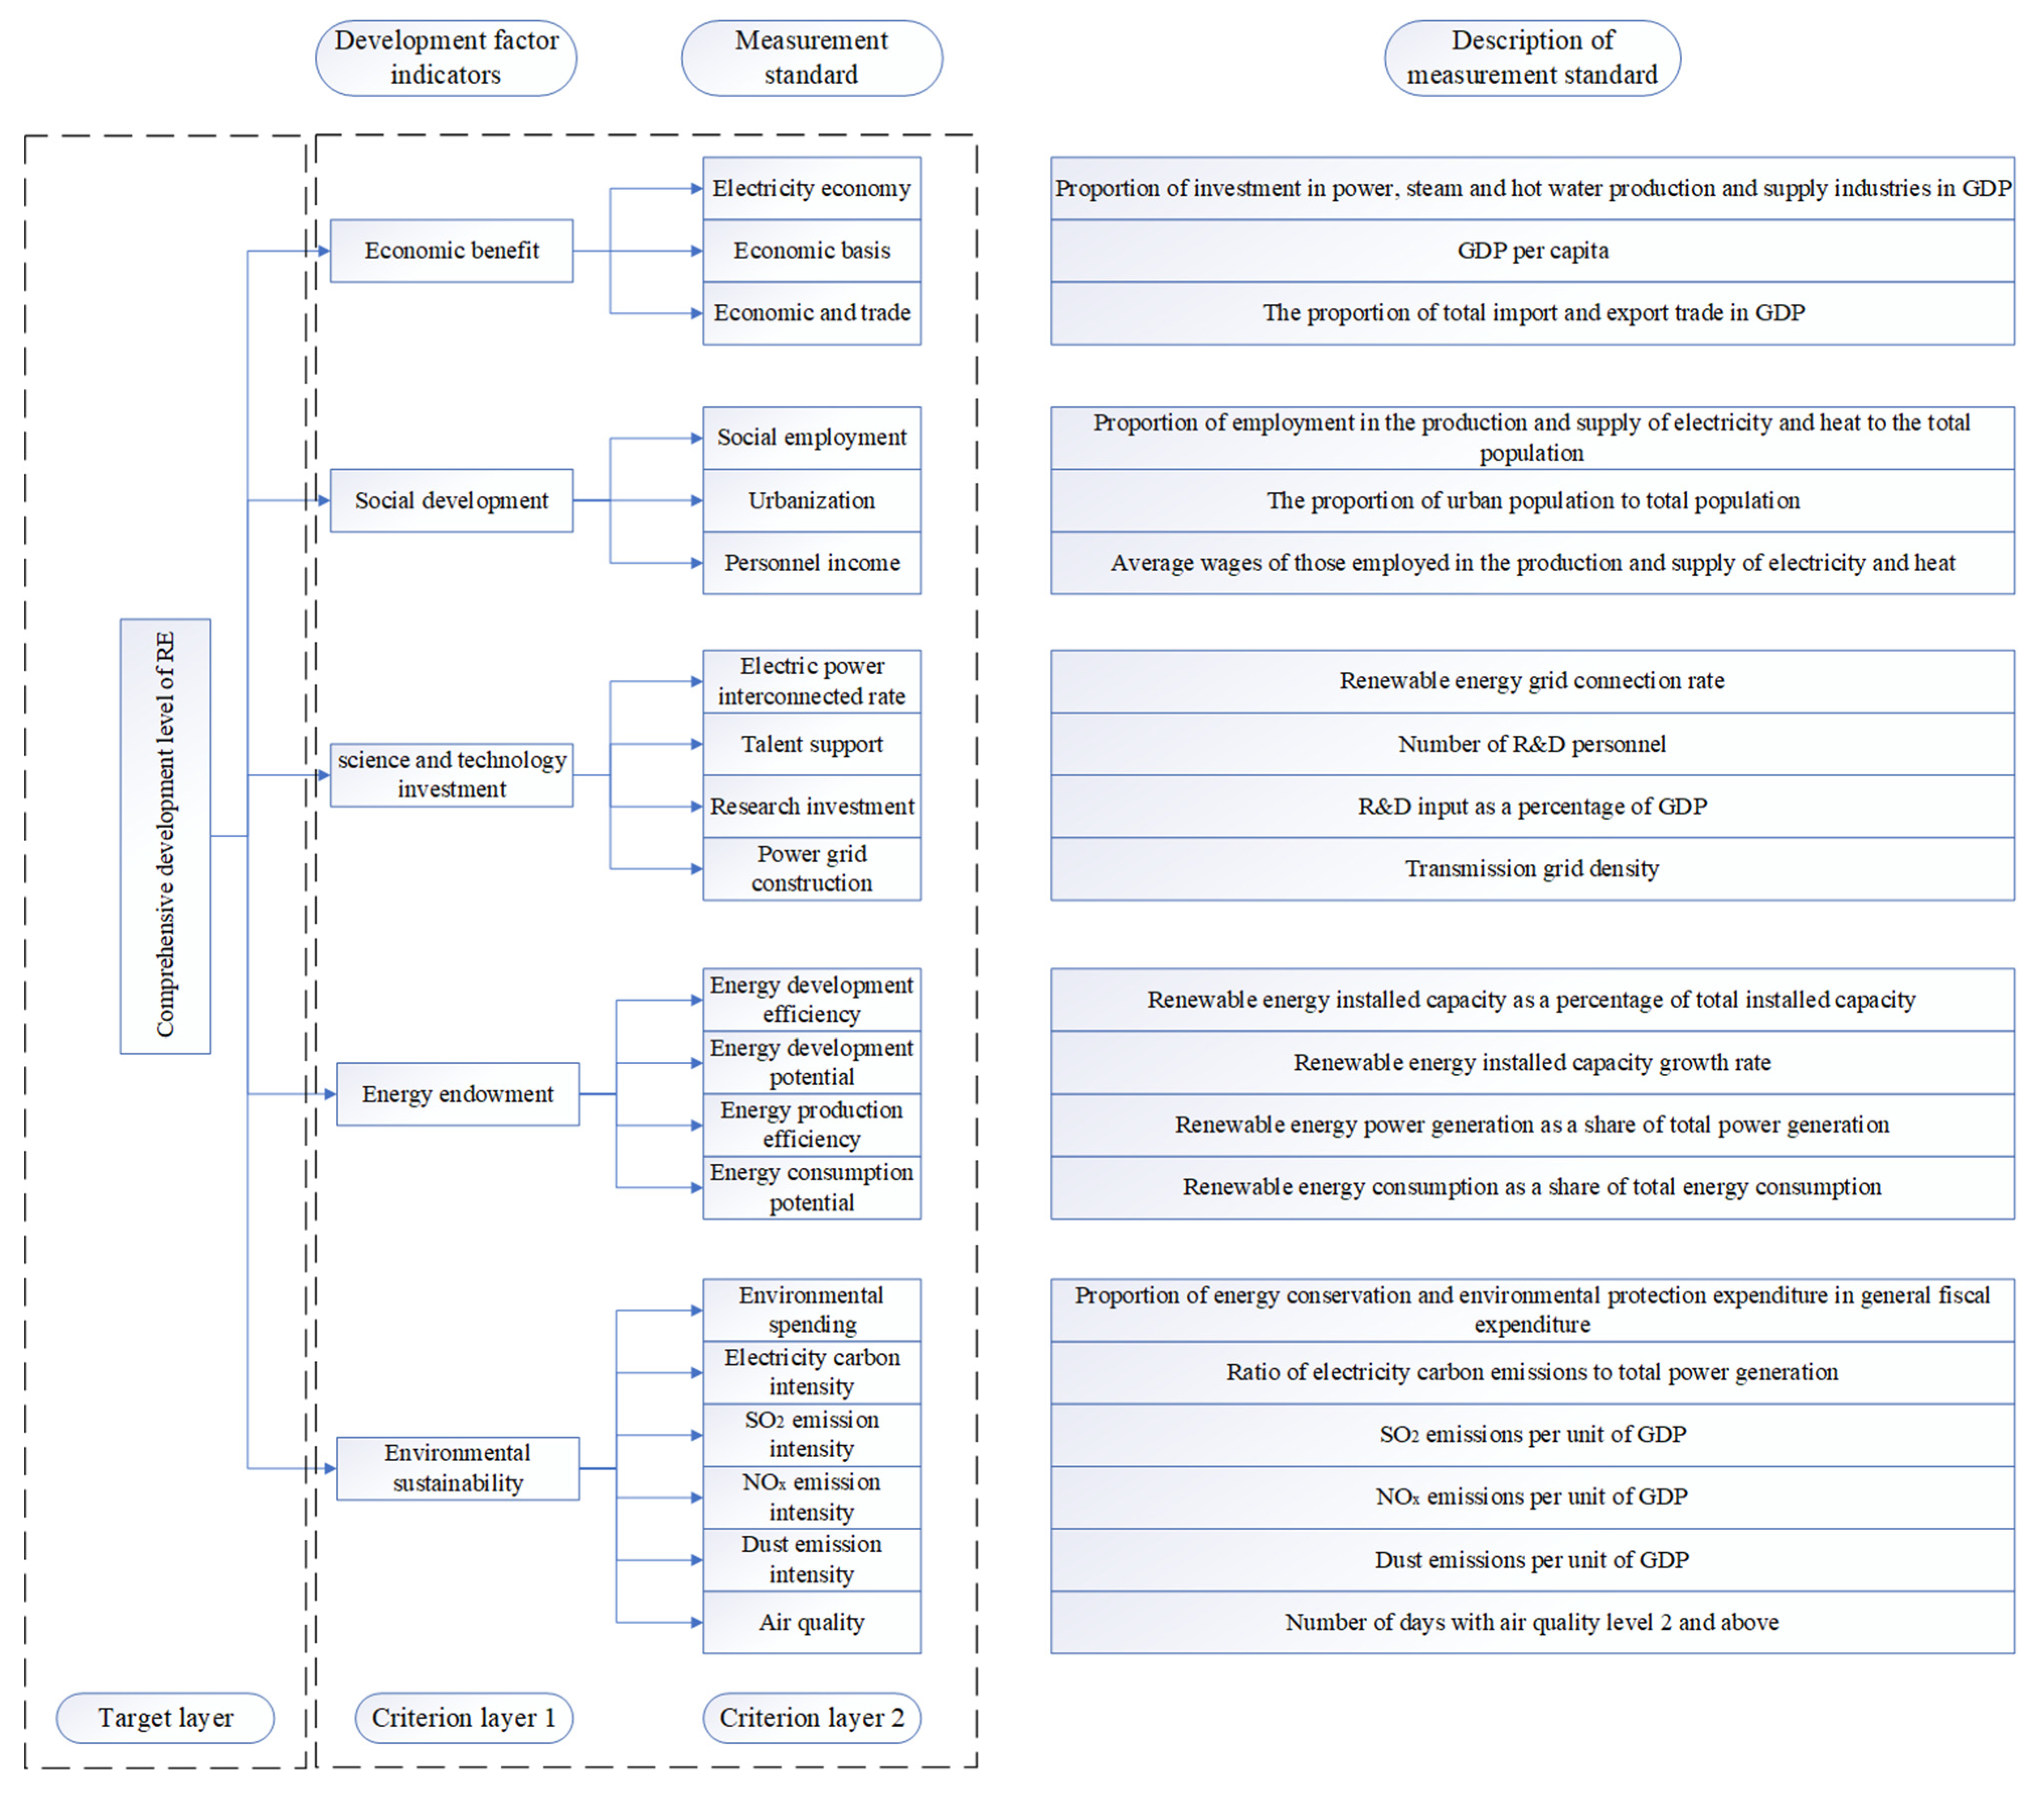
2.1.1. Integrated Evaluation Model of the Comprehensive Development Level of Renewable Energy

Assessing the comprehensive development level of renewable energy is a complex and systematic issue involving multiple dimensions. To avoid the bias caused by the evaluation of a single method, this research accurately evaluates the comprehensive development level of renewable energy by constructing the analytic hierarchy process—entropy method (AHP-EM) evaluation model (Formulas (1) and (2)). In addition, the indicators that measure the comprehensive development level of regional renewable energy are divided into five dimensions: economic benefit indicators, social development indicators, science and technology investment indicators, energy endowment indicators, and environmental sustainability indicators (Figure 1). In other words, the sustainability of the renewable energy industry results from the coordinated development of the economy, society, technology, energy, and environment.
The AHP-EM ensemble evaluation model is as follows:
E = i = 1 n m i P
P = α 1 P 1 + α 2 P 2
where E represents the evaluation result, and the value range is between 0 and 1. The closer it is to 0, the lower the evaluation, and vice versa. m i represents the standardized value of the measured data of index i. P represents the AHP-EM integrated evaluation weight. P 1 and P 2 represent the AHP weight and EM weight, respectively. α 1 and α 2 represent the proportion of AHP weight and EM weight, respectively. This paper believes that the weights of P 1 and P 2 have the same importance, so take α 1 = α 2 = 0.5 .
The AHP weight P 1 formula is as follows:
P 1 = a 01 a 0 n × a 11 a n 1 a 1 n a n n
λ m a x E A k a k 1 a k n = 0
where a 01 , a 02 , , a 0 n T represents the indicator weight of criterion layer 1, and a k 1 , a k 2 , , a k n T , k 0 represents the index weight of each unit of criterion layer 2. λ m a x represents the maximum eigenvalue of the judgment matrix A k . E represents a unit vector matrix.
The EM weight P_2 formula is as follows:
P 2 = 1 E j n j = 1 n E j
E j = i = 1 n x i j s i = 1 m x i j ln x i j s i = 1 m x i j ln n
where E j represents the index information entropy. n and m denote the number and sample size of criterion layer 2 indicators, respectively. x i j s represents the actual value in the ith index after normalization. When x i j s = 0 , make x i j s i = 1 m x i j ln x i j s i = 1 m x i j = 0 .

2.1.2. Coupling Coordination Model

CCD can effectively measure the benign interaction process between multiple systems [52]. This paper draws on the model setting in related research [53,54]. It combines the actual characteristics of China’s RE development to introduce the model into the analysis of the coordinated development relationship between various dimensions in the comprehensive development of regional RE. The coupling degree (CD) and CCD models are as follows:
C = 5 U E c × U S × U T × U E n × U E U E c + U S + U T + U E n + U E 5 5
D = C × T
T = α U E c + β U s + γ U T + δ U E n + ε U E
where C represents the CD. UEc, US, UT, UEn, and UE represent the economic benefit index, social development index, science and technology investment index, energy endowment index, and environmental sustainability index, respectively. D represents the degree of coupling and coordination between dimensions. T represents the coupling coordination index. α , β , γ , δ , and ε represent the contributions of UEc, US, UT, UEn, and UE to the overall target system coordination, respectively. This paper considers that each dimension has an equal contribution to the coordinated development of RE. Set α =   β   = γ   = δ   = ε   = 1/5. According to the literature, the CCD is divided into different stages (Table 1).

2.1.3. LMDI Model

This paper’s comprehensive CCD measurement model of regional RE can be expressed as Equation (10). Based on the decomposition idea of LMDI, the change in the CCD from base period 0 to target period t can be decomposed into the contribution degree [56]. As shown in Equation (11):
D = C × T = C 1 2 × T 1 2 = 5 ( U E c × U S × U T × U E n × U E ) 1 5 U E c + U S + U T + U E n + U E 1 2 × [ 1 5 U E c + U S + U T + U E n + U E ] 1 2 = ( U E c × U S × U T × U E n × U E ) 1 10 = U E c 1 10 × U S 1 10 × U T 1 10 × U E n 1 10 × U E 1 10 = U E c * × U S * × U T * × U E n * × U E *
Δ D = D t D 0 = Δ U E c * + Δ U S * + Δ U T * + Δ U E n * + Δ U E *
where Δ U E c * , Δ U S * , Δ U T * , Δ U E n * , and Δ U E * represent the contributions of economic benefits, social development, scientific and technological investment, energy endowment, and environmental sustainability in the CCD changes from the base period to the target period, respectively. The specific calculation is shown in Equation (12). When an indicator does not change from 0 to t, set Δ U k *   = 0 (k = Ec, S, T, En, E); that is, this indicator did not contribute to the changes in the coordination of the overall comprehensive development of RE during periods 0 to t.
Δ U E c * = L D t , D 0 ln U E c * t U E c * 0 Δ U S * = L D t , D 0 ln U S * t U S * 0 Δ U T * = L D t , D 0 ln U T * t U T * 0 Δ U E n * = L D t , D 0 ln U E n * t U E n * 0 Δ U E * = L D t , D 0 ln U E * t U E * 0

2.2. Data Sources

This study aggregated panel data from 30 provinces in China from 2011 to 2019, excluding Tibet, Taiwan, Hong Kong, and Macao. The original data of indicators such as economic foundation, support for opening up, environmental protection expenditure, and air quality are from the China Statistical Yearbook. The raw data for social employment and income level indicators come from the China Labor Statistical Yearbook. Population data come from the China Population and Employment Statistical Yearbook. The original data of indicators such as talent support and scientific research investment come from the China Statistical Yearbook on Science and Technology. The original data of the electric power interconnected rate come from the National Energy Administration. The original data on power grid construction, energy development efficiency, energy development potential, energy production efficiency, and energy consumption potential are derived from the China Electric Power Yearbook. The original data of indicators such as electricity economy, electricity carbon emission intensity, sulfur dioxide emission intensity, nitrogen oxide emission intensity, and dust emission intensity are from the China Energy Statistical Yearbook and China Electric Power Yearbook. In addition, the economic data used in this paper are all converted into actual values with 2011 as the base period.

3. Results and Discussion

3.1. Comprehensive Assessment of RE Development

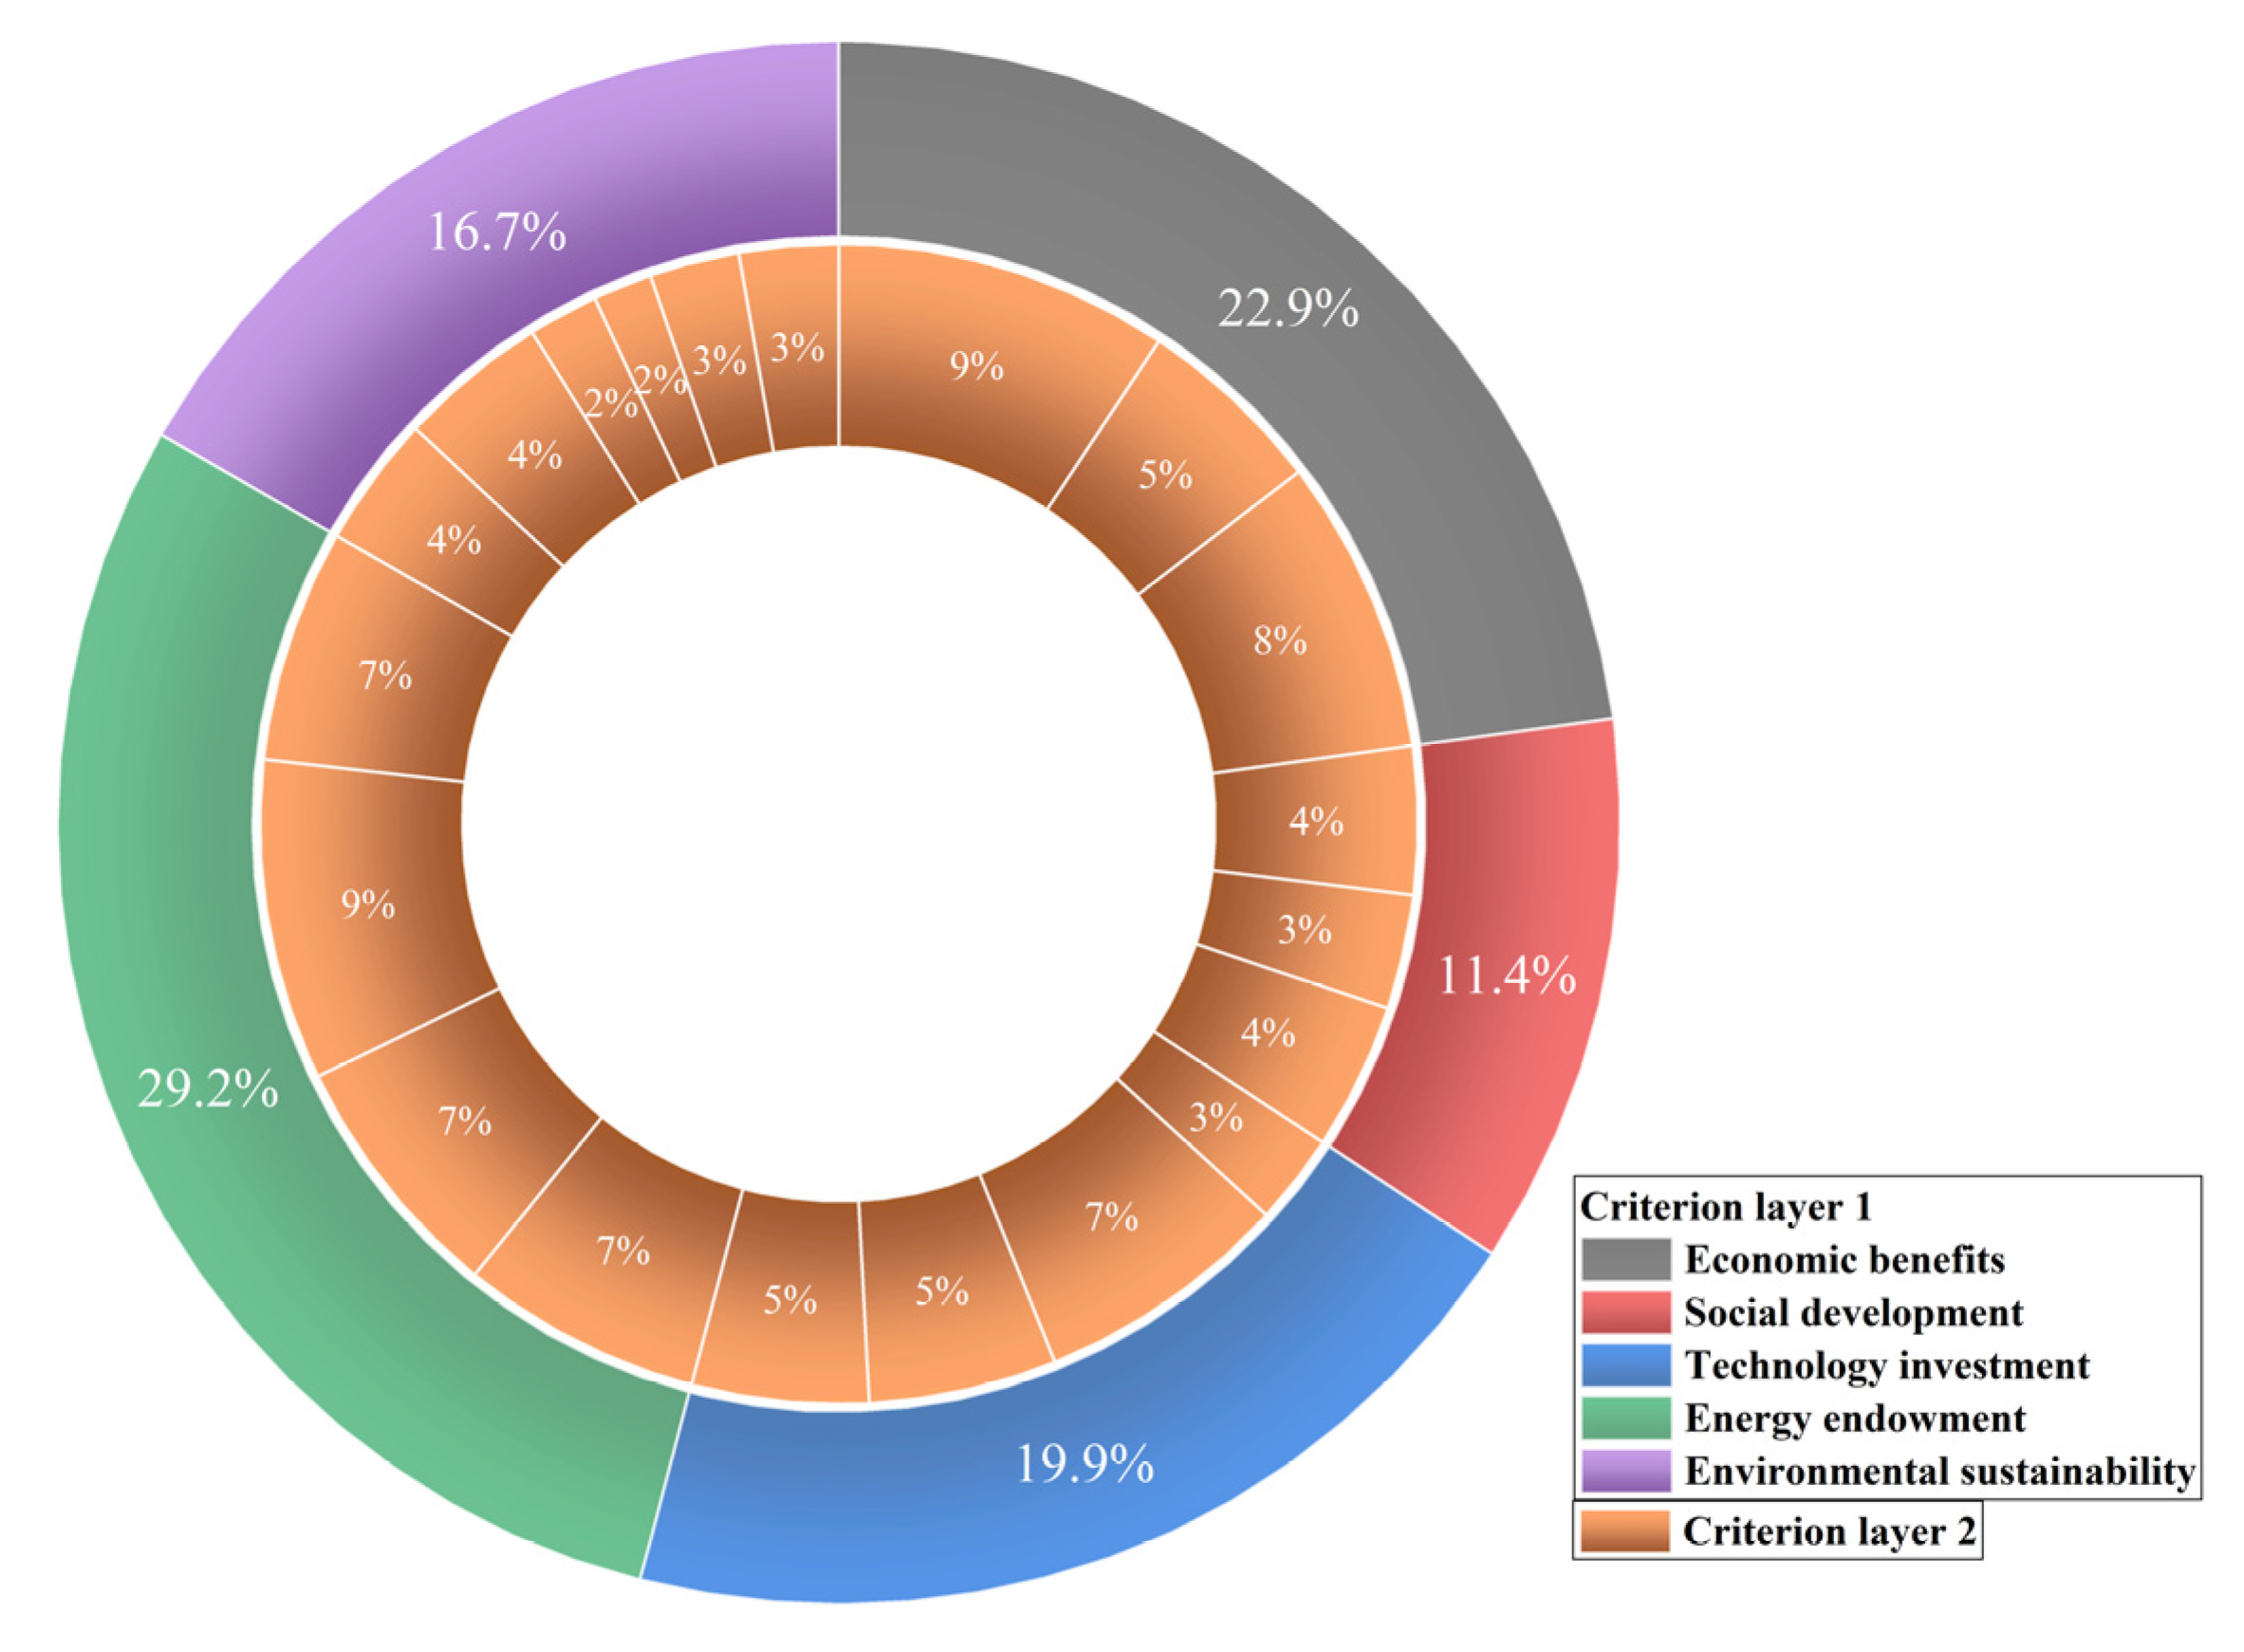
3.1.1. AHP-EM Integrated Evaluation Index Weight

The AHP-EM integrated evaluation model can not only avoid the subjectivity of the weight of the indicators determined by the AHP but also avoid the error problem caused by the entropy method for weighting time series data, thus improving the accuracy of the comprehensive evaluation. The weight results are shown in Table 2.
Among the five dimensions of RE development, the weights from small to large are energy endowment > economic benefits > technological investment > environmental sustainability > social development (Figure 2). Energy endowment has the highest weight, accounting for nearly 30% of the overall RE development indicators. Energy endowment has become an essential prerequisite for developing RE, which is the same point of view as Lorente et al. [57]. China is extremely rich in wind and solar resources. This resource endowment also provides a steady stream of potential resource support for the sustainable development of RE power generation. The weight of economic benefits is 22.9%, indicating that rapid economic development can provide stable economic support for RE (e.g., Muhammed et al. [58]). This support includes various investments related to RE and management experience support from opening to the outside world [37,47,48]. As China’s economy has entered a new normalized development model, economic development has changed from extensive high-speed growth to medium-speed high-quality growth. The method of development has been optimized. The economy as a whole shows a gradual distribution of high in the east and low in the west. Therefore, this provides a necessary economic guarantee for offshore wind power and distributed solar power generation in the eastern coastal areas of China. Developing RE requires investment in infrastructure construction and technical support as a technology-intensive emerging industry [55]. That is, technology investment is an essential driving force to promote the sustainable development of its industry (e.g., Wang et al. [59]). At the same time, it is also an indispensable constructive investment for developing RE in the early stage. The weight of technology investment is close to 20%, and the contribution is in a balanced state. Compared with resource endowment, economic benefits, and technological investment, environmental sustainability and social development have relatively low weights, accounting for only 16.7% and 11.4% of the overall RE development indicators, respectively.

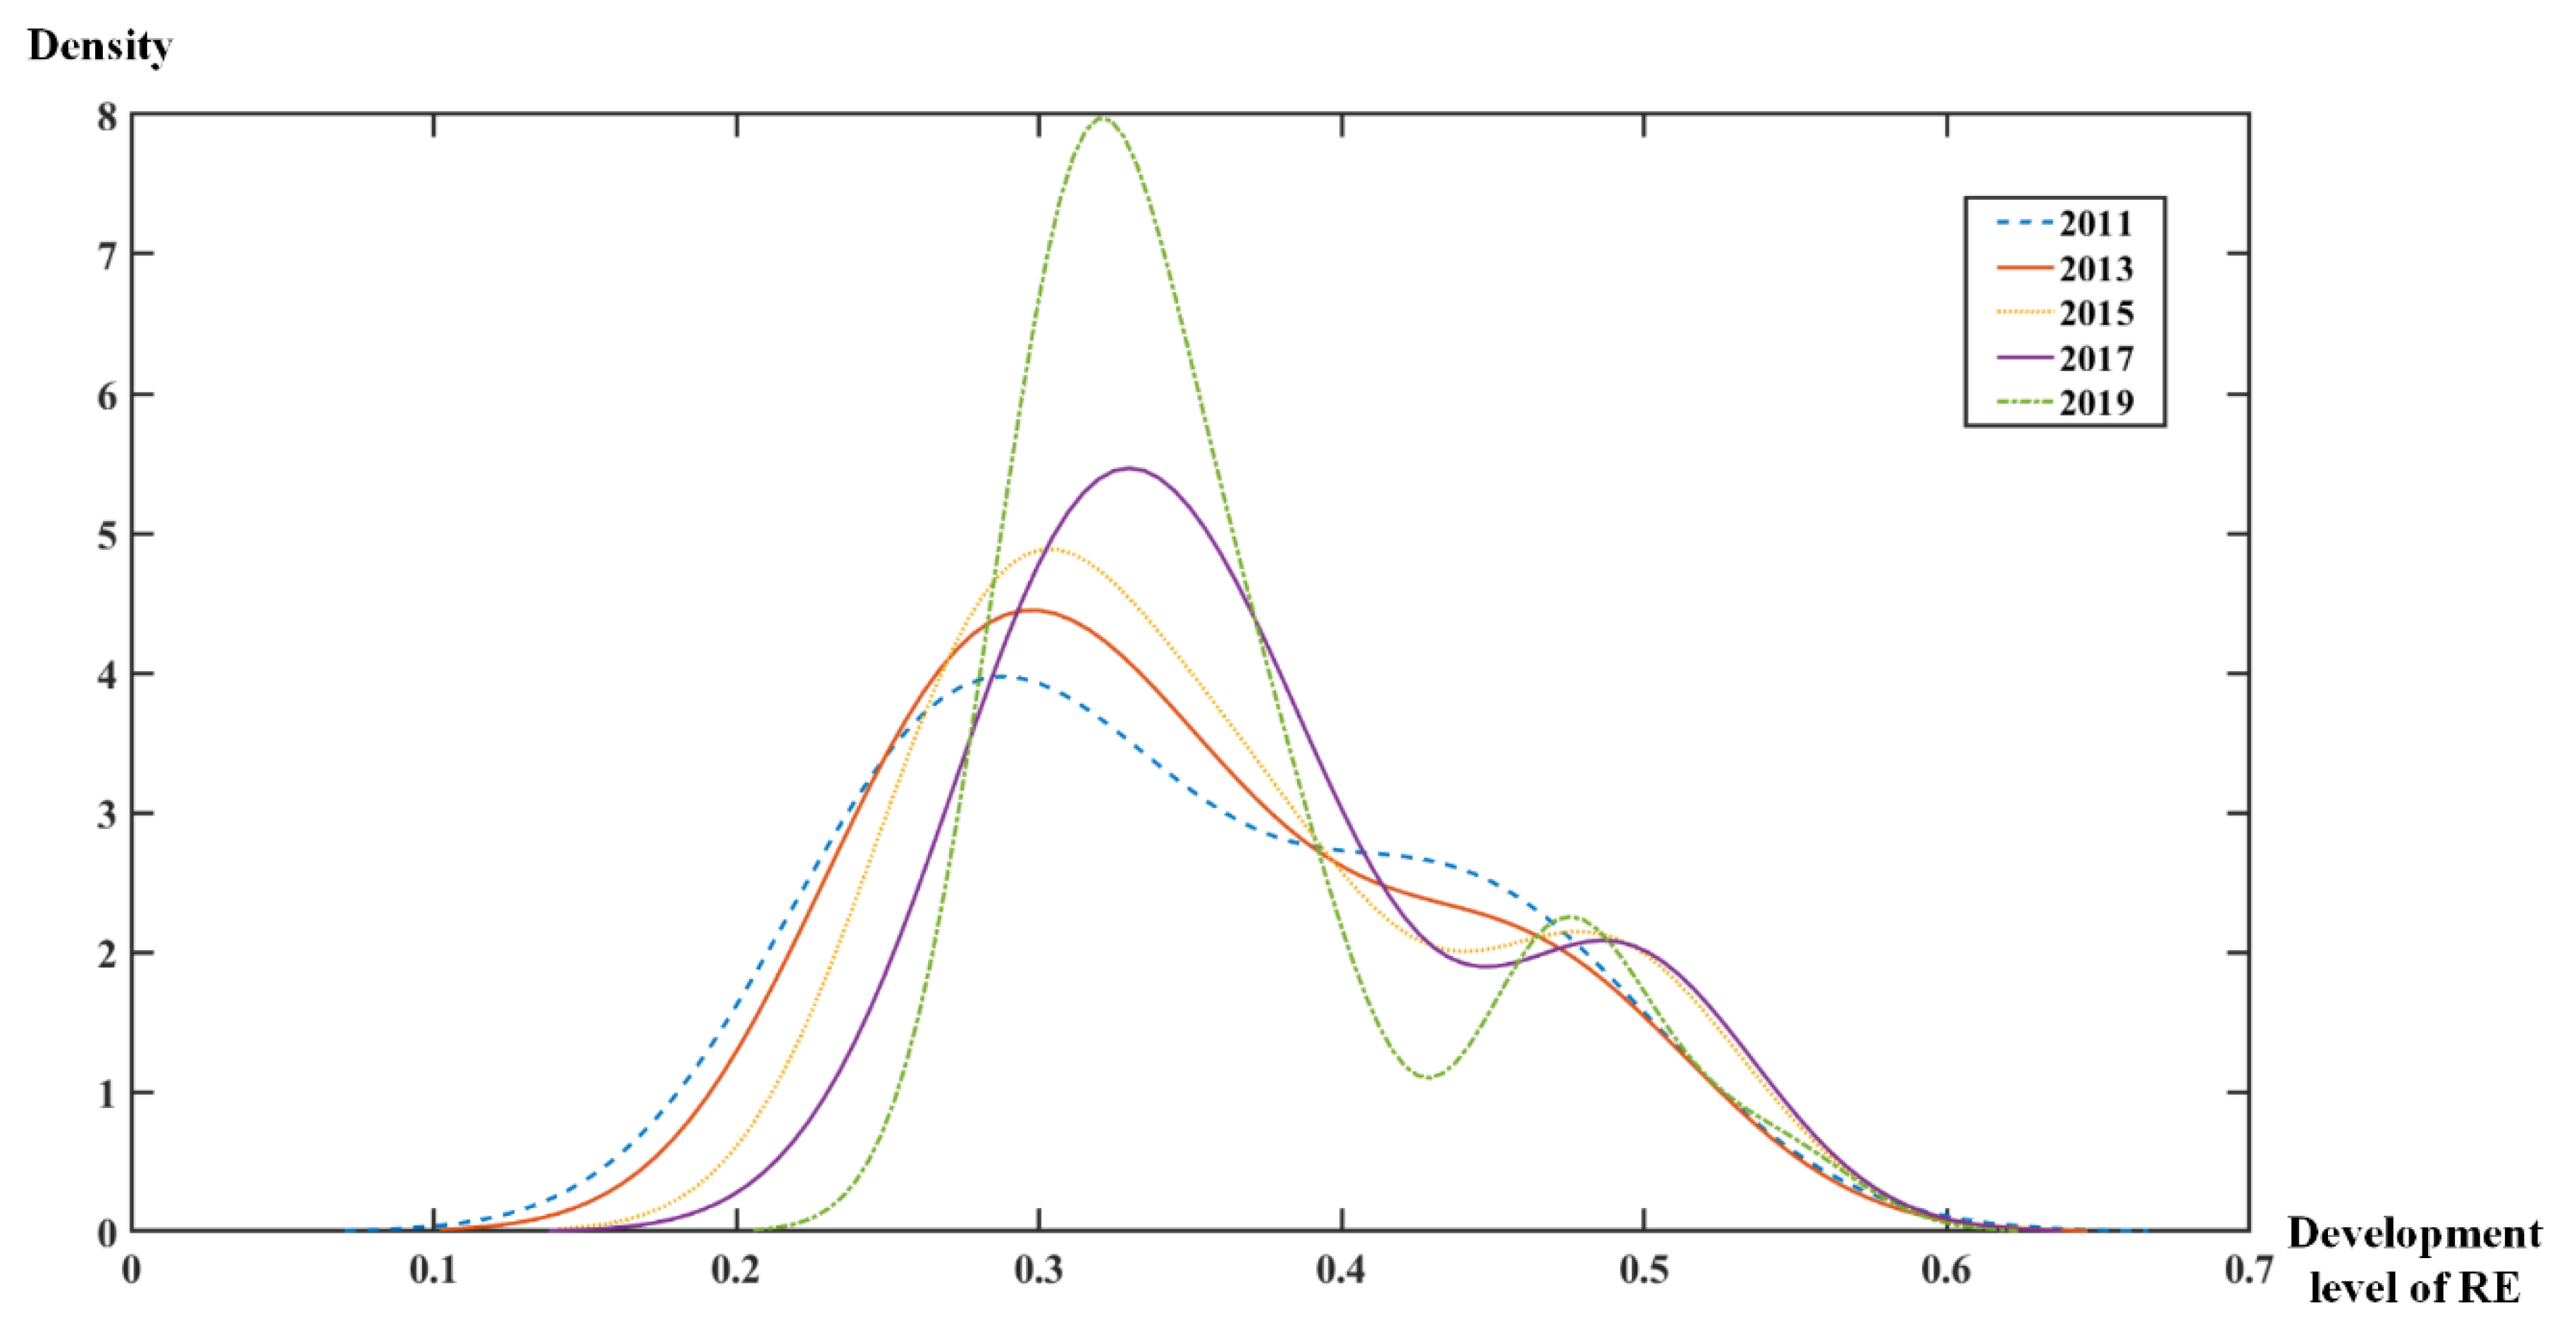
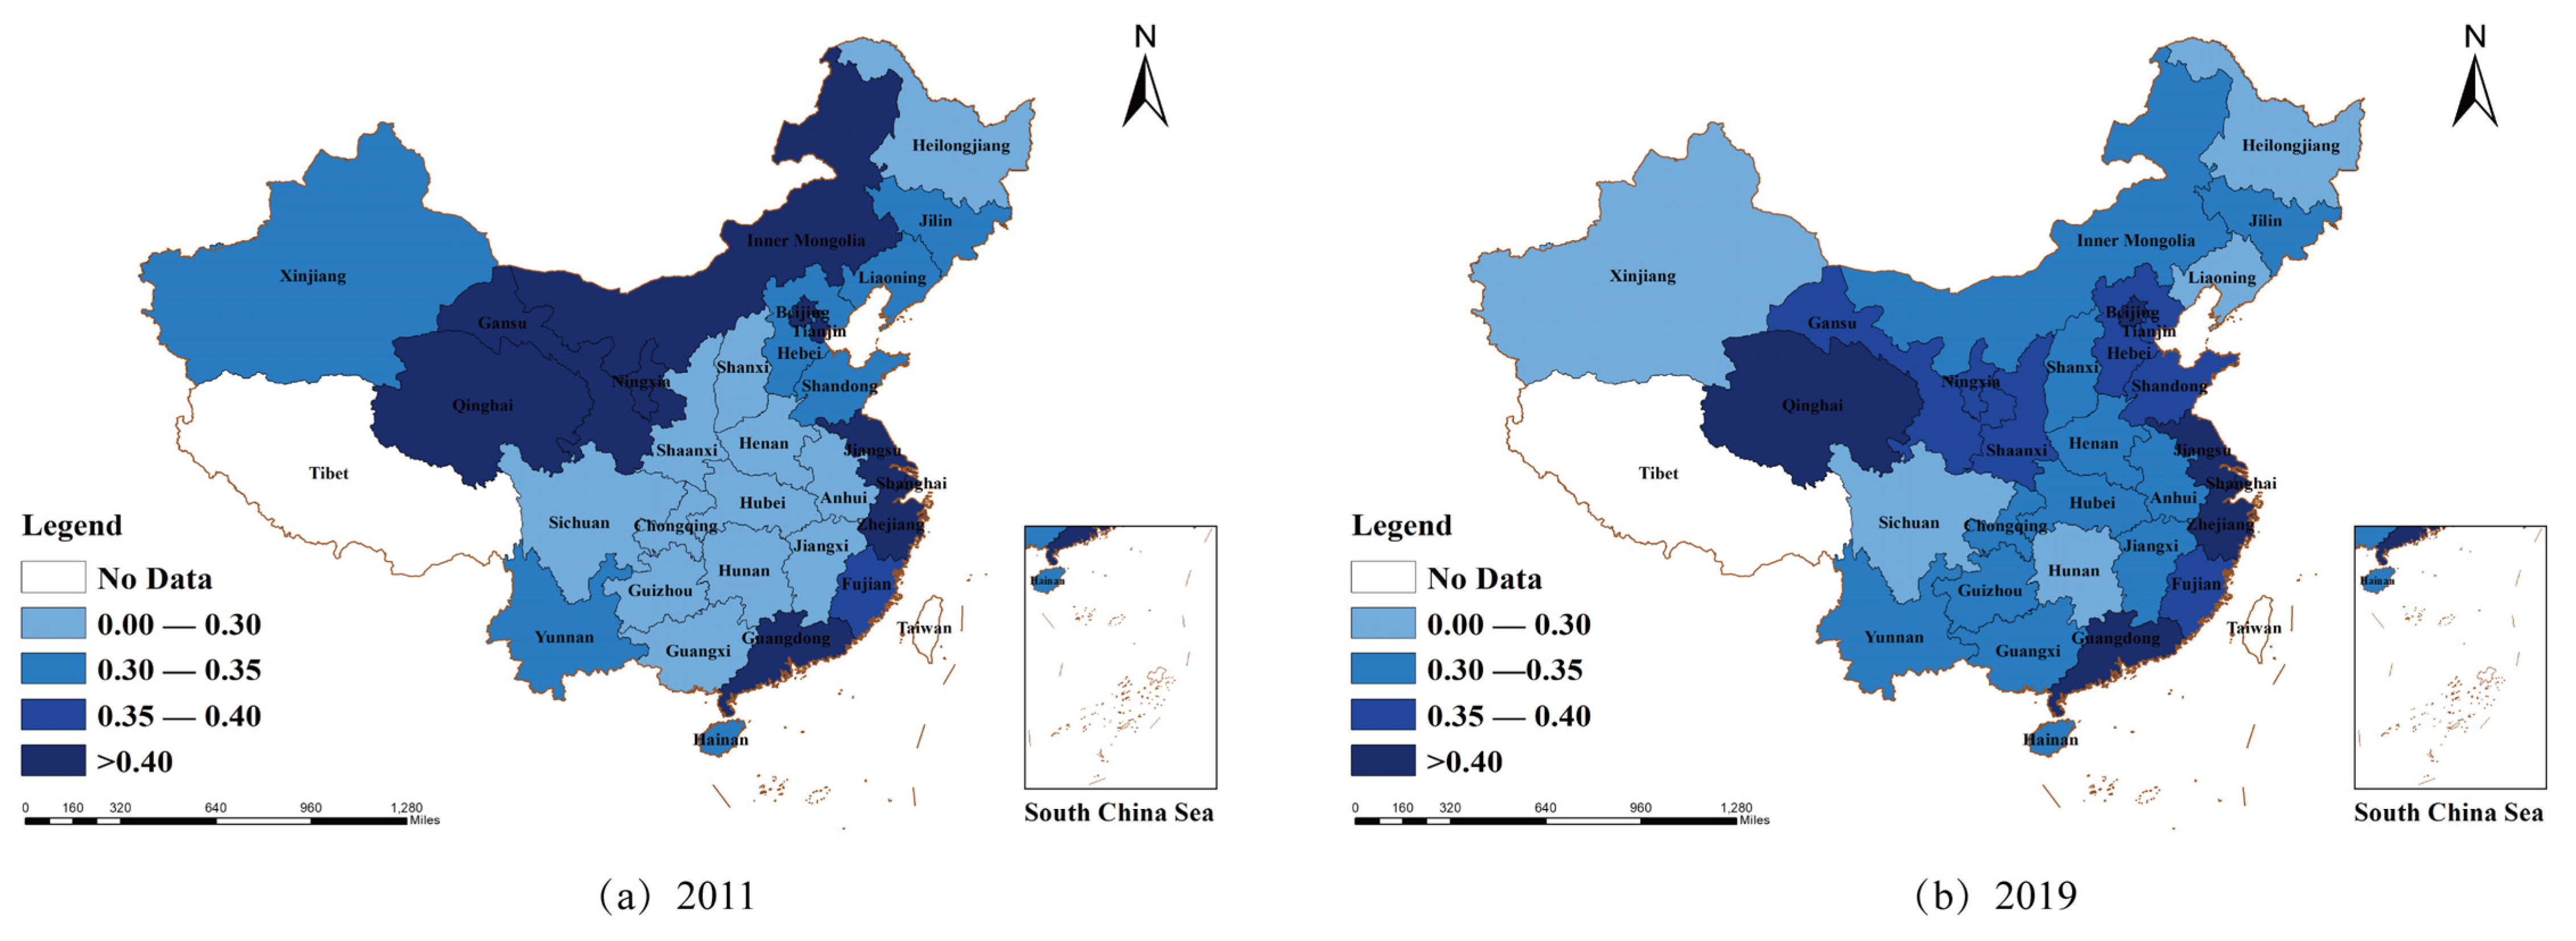
3.1.2. Spatial and Temporal Characteristics of the Comprehensive Development Level of RE

Based on the constructed AHP-EM integrated evaluation model, the comprehensive weight value of each index is calculated. This paper measures the comprehensive development level of RE in 30 provinces in China from 2011 to 2019 (Appendix A). The comprehensive RE development level results show that the overall average value of the comprehensive RE development level assessment in each region is 0.3558, which means that the overall development of RE in China is still at a low level. The nuclear density estimation method is used to analyze the changing trend in the comprehensive development level of regional RE in some years (Figure 3). During 2011–2019, the peak value of the nuclear density curve shifted to the right as a whole, indicating that the comprehensive development level of regional RE improved. At the same time, the nuclear density curve changed from “short and fat” to “tall and thin,” indicating that under the same peak, the gap in the comprehensive development of RE decreased and gradually tended to be concentrated. Notably, the second peak at the end of the nuclear density curve became more obvious. This shows that the development level of RE in a few provinces is in a leading position, playing a “leader” role in the comprehensive development of regional RE. In addition, the comprehensive development level of RE in most regions has achieved different degrees of improvement, which means that the development trend of China’s RE industry is improving. RE has achieved rapid development with the support of relevant national policies. However, due to the short development time, its industrial development is still in its infancy, resulting in a relatively low level of comprehensive RE development in various regions. As of 2019, the provinces with better comprehensive RE development prospects (>0.4) included Qinghai, Beijing, Jiangsu, Guangdong, Zhejiang, and Shanghai, while the less developed (<0.3) provinces included Heilongjiang, Hunan, Liaoning, Sichuan, and Xinjiang. The potential for the comprehensive development of RE between regions is still quite different.
Figure 4 shows the spatial distribution of the comprehensive development level of regional RE. Specifically, in 2011, ten provinces had a comprehensive development level of regional RE greater than 0.4. They are mainly concentrated in the resource-rich areas in the northwest and developed areas along the eastern coast, including Beijing, Gansu, Shanghai, Guangdong, Ningxia, Jiangsu, Zhejiang, Qinghai, Tianjin, and Inner Mongolia. At the same time, there are 12 provinces with a comprehensive development level of regional RE of less than 0.3. They are mainly concentrated in the central, southwest, and northeast regions, involving Heilongjiang, Hubei, Guangxi, Sichuan, Chongqing, Hunan, Jiangxi, Shanxi, Henan, Anhui, Shaanxi, and Guizhou, respectively. In 2019, there were six provinces with a comprehensive regional renewable development level greater than 0.4. Compared with 2011, the number of provinces with a high level of development gradually decreased, including only Qinghai, Beijing, Jiangsu, Guangdong, Zhejiang, and Shanghai. The comprehensive development of RE in these provinces is in a leading position, and the gap with other provinces is increasing, gradually showing a leading trend. It is worth mentioning that there are only five provinces with a comprehensive development level of regional RE less than 0.3, including Heilongjiang, Hunan, Liaoning, Sichuan, and Xinjiang. The number of provinces with a low level of development has gradually decreased, indicating that most regions’ comprehensive development has improved. In addition, during the period from 2011 to 2019, the high-point provinces of the comprehensive development of regional RE showed an overall trend of moving eastward, and the distribution of comprehensive development levels among regions evolved from a “basin type” to a spatial pattern of high in the east and low in the west.

3.2. Coupling Coordination and Contribution Degree Decomposition Analysis between Dimensions of Renewable Energy

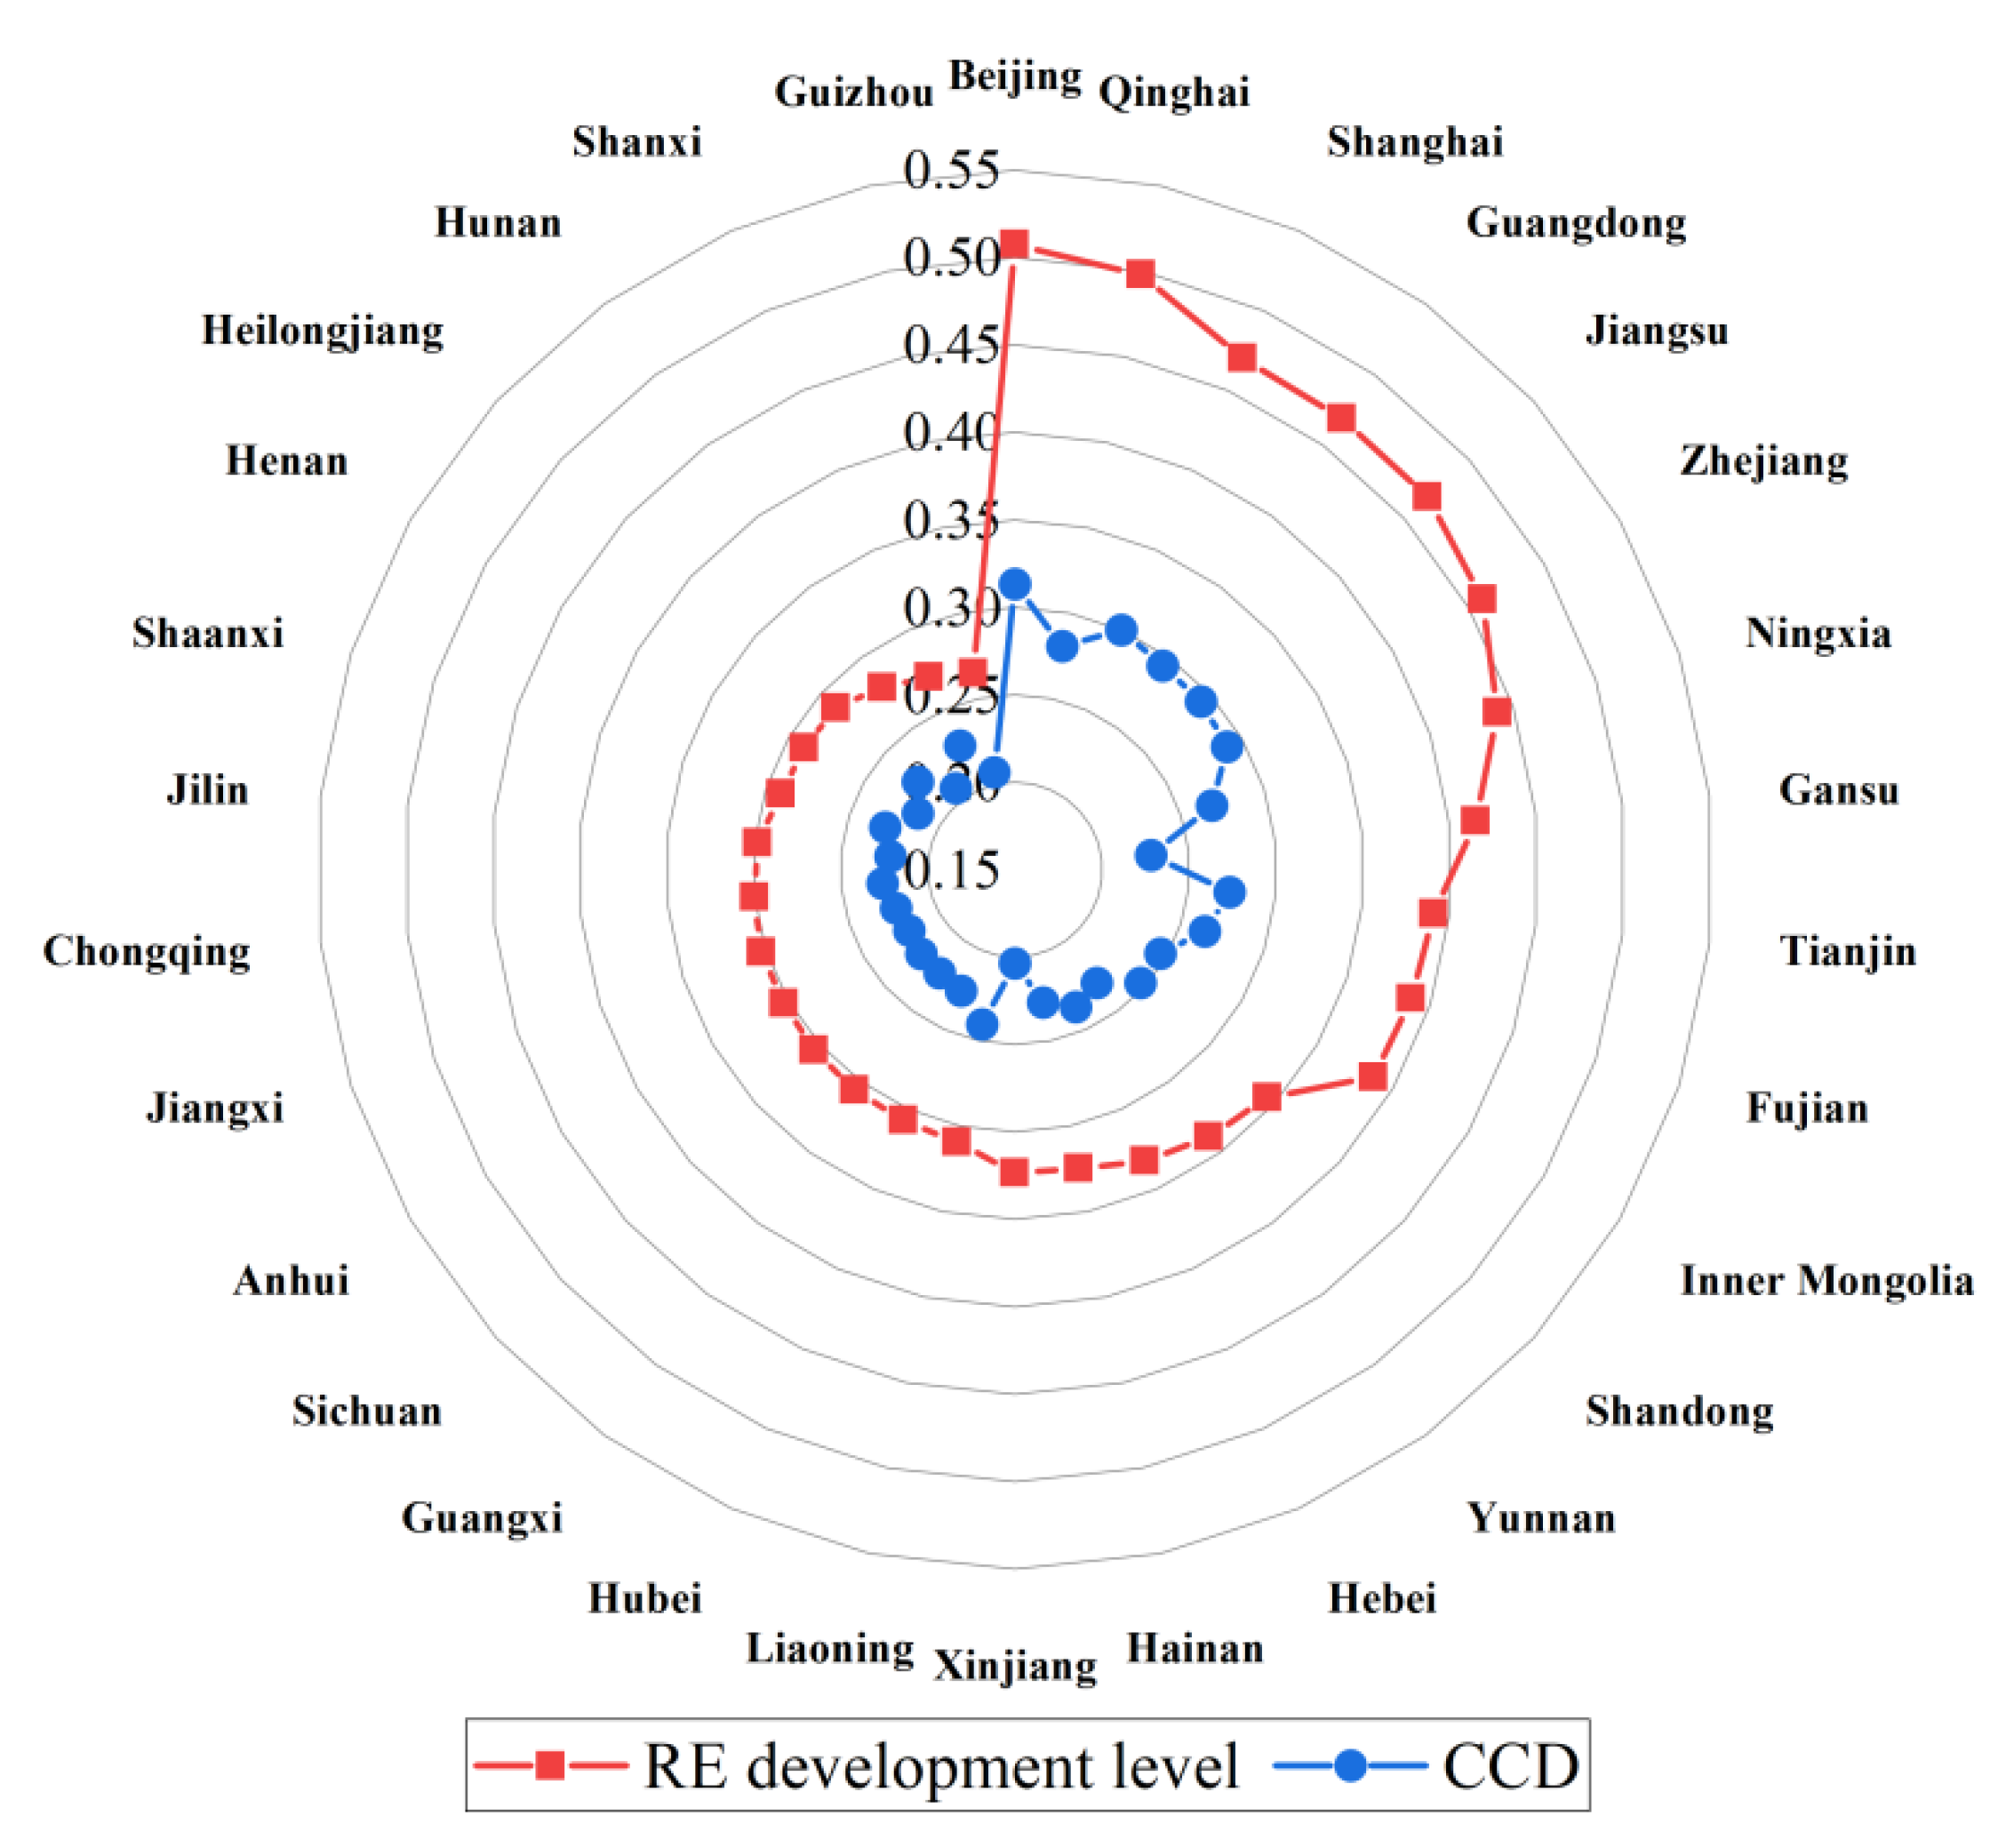
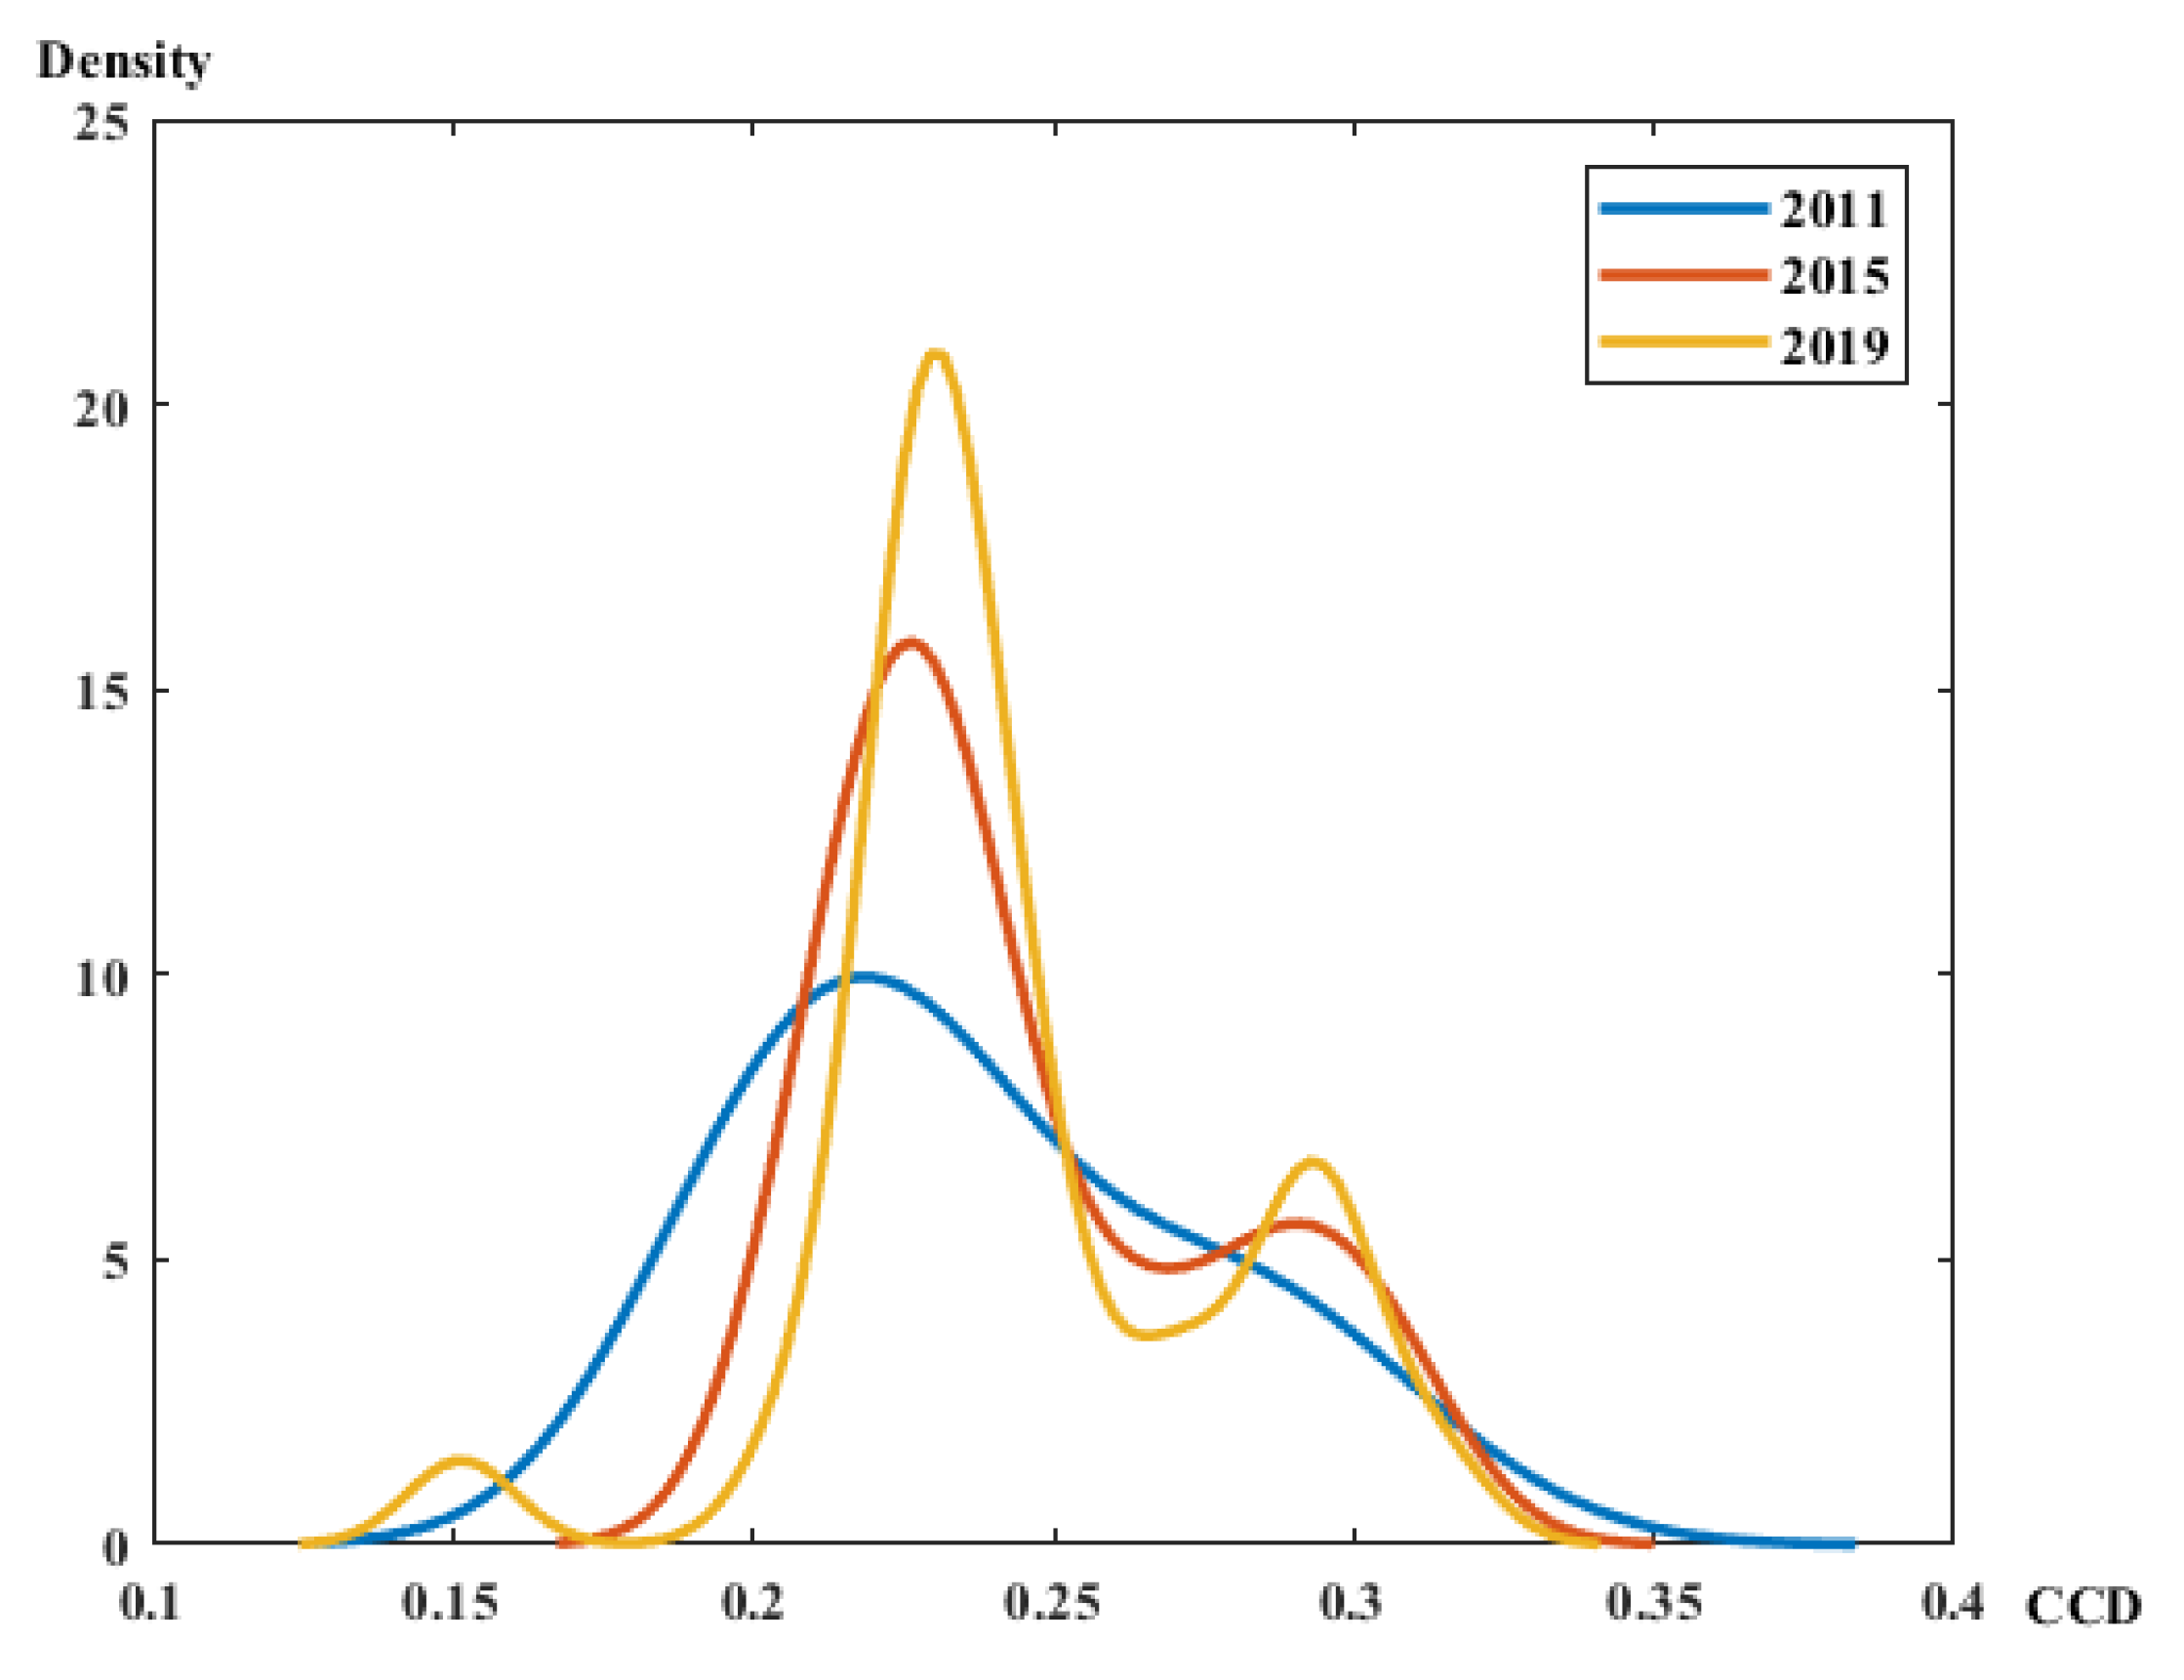
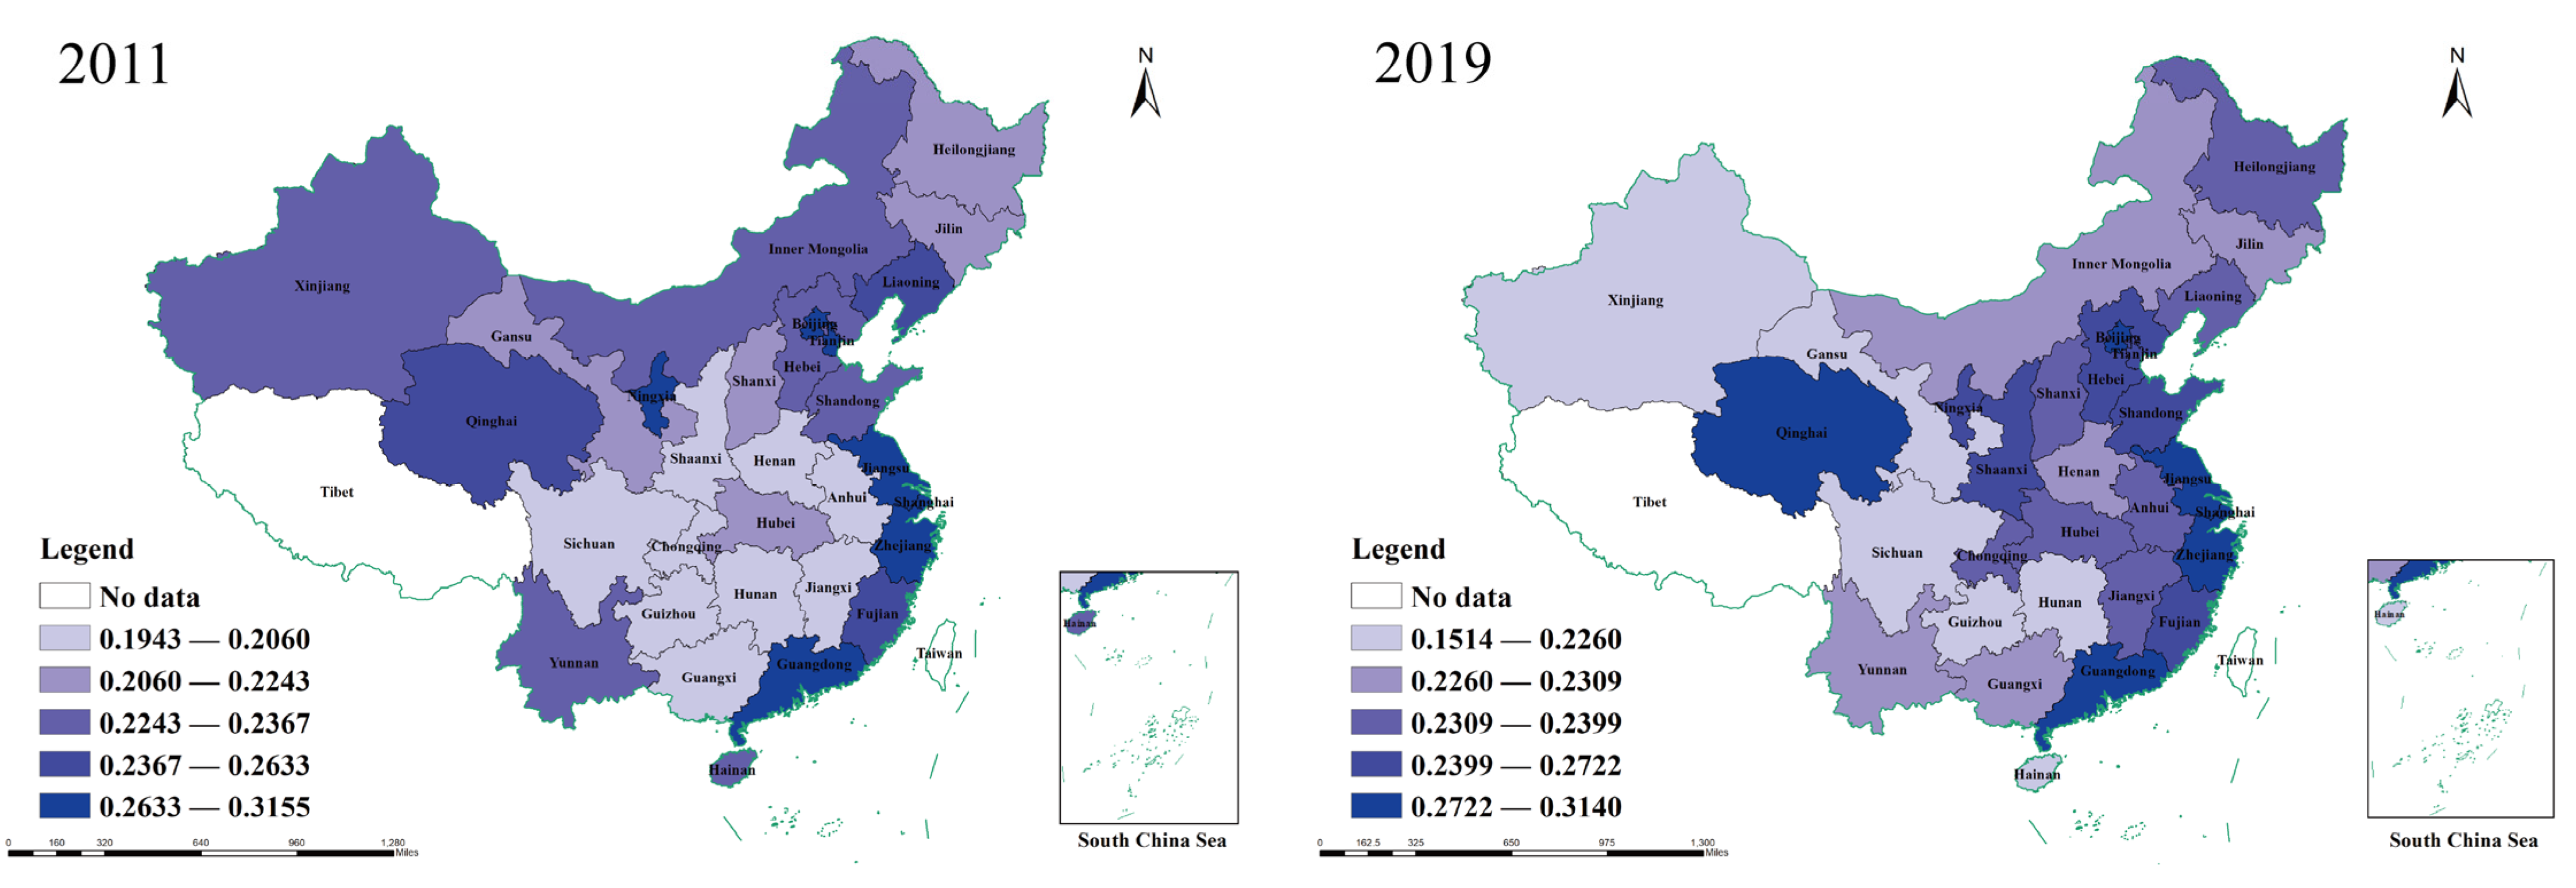
3.2.1. Coupling Coordination Degree Analysis between Dimensions

China has abundant RE resources, similar to the characteristics of RE resources in the EU and the US. In response to the global call for a systematic solution to the problem of climate change, China, the European Union, the United States, and other regions have proposed various policies (e.g., renewable energy law, renewable portfolio standard, and REPowerEU) to promote the development of the RE industry. It is worth noting that despite the development and implementation of RE development strategies, many barriers to promoting RE development (e.g., technical, economic support) remain.
In general, improving the comprehensive development level of regional RE requires coordinated development among the dimensions of economy, society, technology, energy, and environment. Based on this requirement, Table 3 shows the quantitative calculation results of the CCD between various dimensions from 2011 to 2019. In the process of the comprehensive development of regional RE in China, the overall development of each dimension is still in the stage of low-level coupling (0~0.3). This shows that the benign interaction between the economic, social, technological, energy and environmental dimensions involved in the comprehensive development of RE at the current stage is low. There is only limited interaction and mutual influence between the dimensions. This is similar to the findings of Liu et al. [3].
To better distinguish the differences in the CCD of different provinces between dimensions, this study uses the Jenks natural breakpoint method to divide different provinces into Class I areas (0.2738–0.3133), Class II areas (0.2407–0.2737), Class III areas (0.2144–0.2406), and Class IV areas (0.2036–0.2143) (Table 4).
Table 5 shows the mean values of subsystem evaluation indicators for the four types of regions. Specifically, the indicators of the environment (0.1173), science and technology (0.1017), economy (0.0918), and energy (0.1202) in the Class I areas are balanced. Compared with the first four evaluation indicators, the social benefit index (0.0477) is a shortcoming of the whole system. Compared with the Class I areas, the environment (0.0823), science and technology (0.0642), and economic indicators (0.0715) are lower in the Class II areas. The energy (0.1250) and social development indicators (0.0475) are similar to those of the Class I areas. Among the Class III areas, the environment (0.1019) and energy indicators (0.0978) are relatively high compared with other indicators. Science and technology (0.0493), economic (0.0356), and social indicators (0.0282) are the shortcomings of the entire system. The Class IV areas are similar to the Class III areas. The science and technology (0.0471), economic (0.0346), and social development indicators (0.0248) are short-board indicators, and the environment (0.0869) and energy indicators (0.0956) are generally lower than those in the Class III area. In general, the overall coordination degree of regional RE development is closely related to the contribution and balance of each dimension index. When the benefit index of each dimension is higher and the difference is more negligible, the CCD of comprehensive development will be higher.
In addition, Figure 5 compares the comprehensive development level of RE in each region and the CCD of each dimension. Compared with the provinces in the inland region, the CCD of the provinces located in the southeast coastal region is relatively high, similar to the regional characteristics of the comprehensive development of RE. It is also confirmed that improving the CCD can improve the comprehensive development level of regional RE. Therefore, it is practical to improve the comprehensive development level of regional RE by balancing the coordinated development relationship between the dimensions of RE. Gan et al. [60] also supported this view in the study of the urbanization level.
Figure 6 shows the variation in CCD between dimensions. During the period 2011–2019, the peak of the nuclear density curve gradually increased, while the width gradually decreased. This shows that the gap between the CCD of RE development levels in most provinces is narrowing and tends to be concentrated and stable. As time goes by, the peak of the curve moves to the right. This shows that the CCD of each area gradually increases. Notably, the nuclear density curve gradually evolved from a single peak to an apparent double peak during the development process. This shows that some provinces have gradually formed a “leader” effect in CCD development. In addition, Figure 7 shows the spatial distribution characteristics of CCD in each region. The CCD in each region has gradually evolved from a “basin-like” distribution to a spatial distribution pattern of high in the east and low in the west. This feature is consistent with the spatial distribution evolution characteristics of the comprehensive development of regional RE, further indicating the positive synchronous development relationship between the comprehensive development level of RE and CCD.
In terms of expansion, the evolution of this spatial distribution pattern may be that in the early stage of RE development, energy advantages dominated the coupling coordination. The onshore wind and solar energy in the western region and the offshore wind energy in the coastal areas have driven the industrial construction and investment of regional RE and promoted regional economic development and scientific and technological progress. The intervention of RE, the improvement in scientific and technological levels, and the improvement in the economy have promoted the stable development of society, thereby further improving the level of urbanization. Simultaneously, the development of technology and RE has improved the regional environment. However, with the gradual development of RE, the dominance of energy has gradually weakened, and the status of economic and technological factors has gradually become prominent. In recent years, due to severe population loss and other problems in the western region, energy-driven economic investment and scientific and technological investment have gradually decreased, and the overall development of society has been restricted. At the same time, the limitations of cross-regional transmission grids and the reverse distribution pattern of power supply and demand have significantly increased the economic investment in RE in the eastern coastal areas and some central regions. The rapid consumption of energy generated by population inflow has also driven the innovative development of RE technology in the eastern region, which has led to the overall transfer of the coupling and coordination of regional RE to the east.

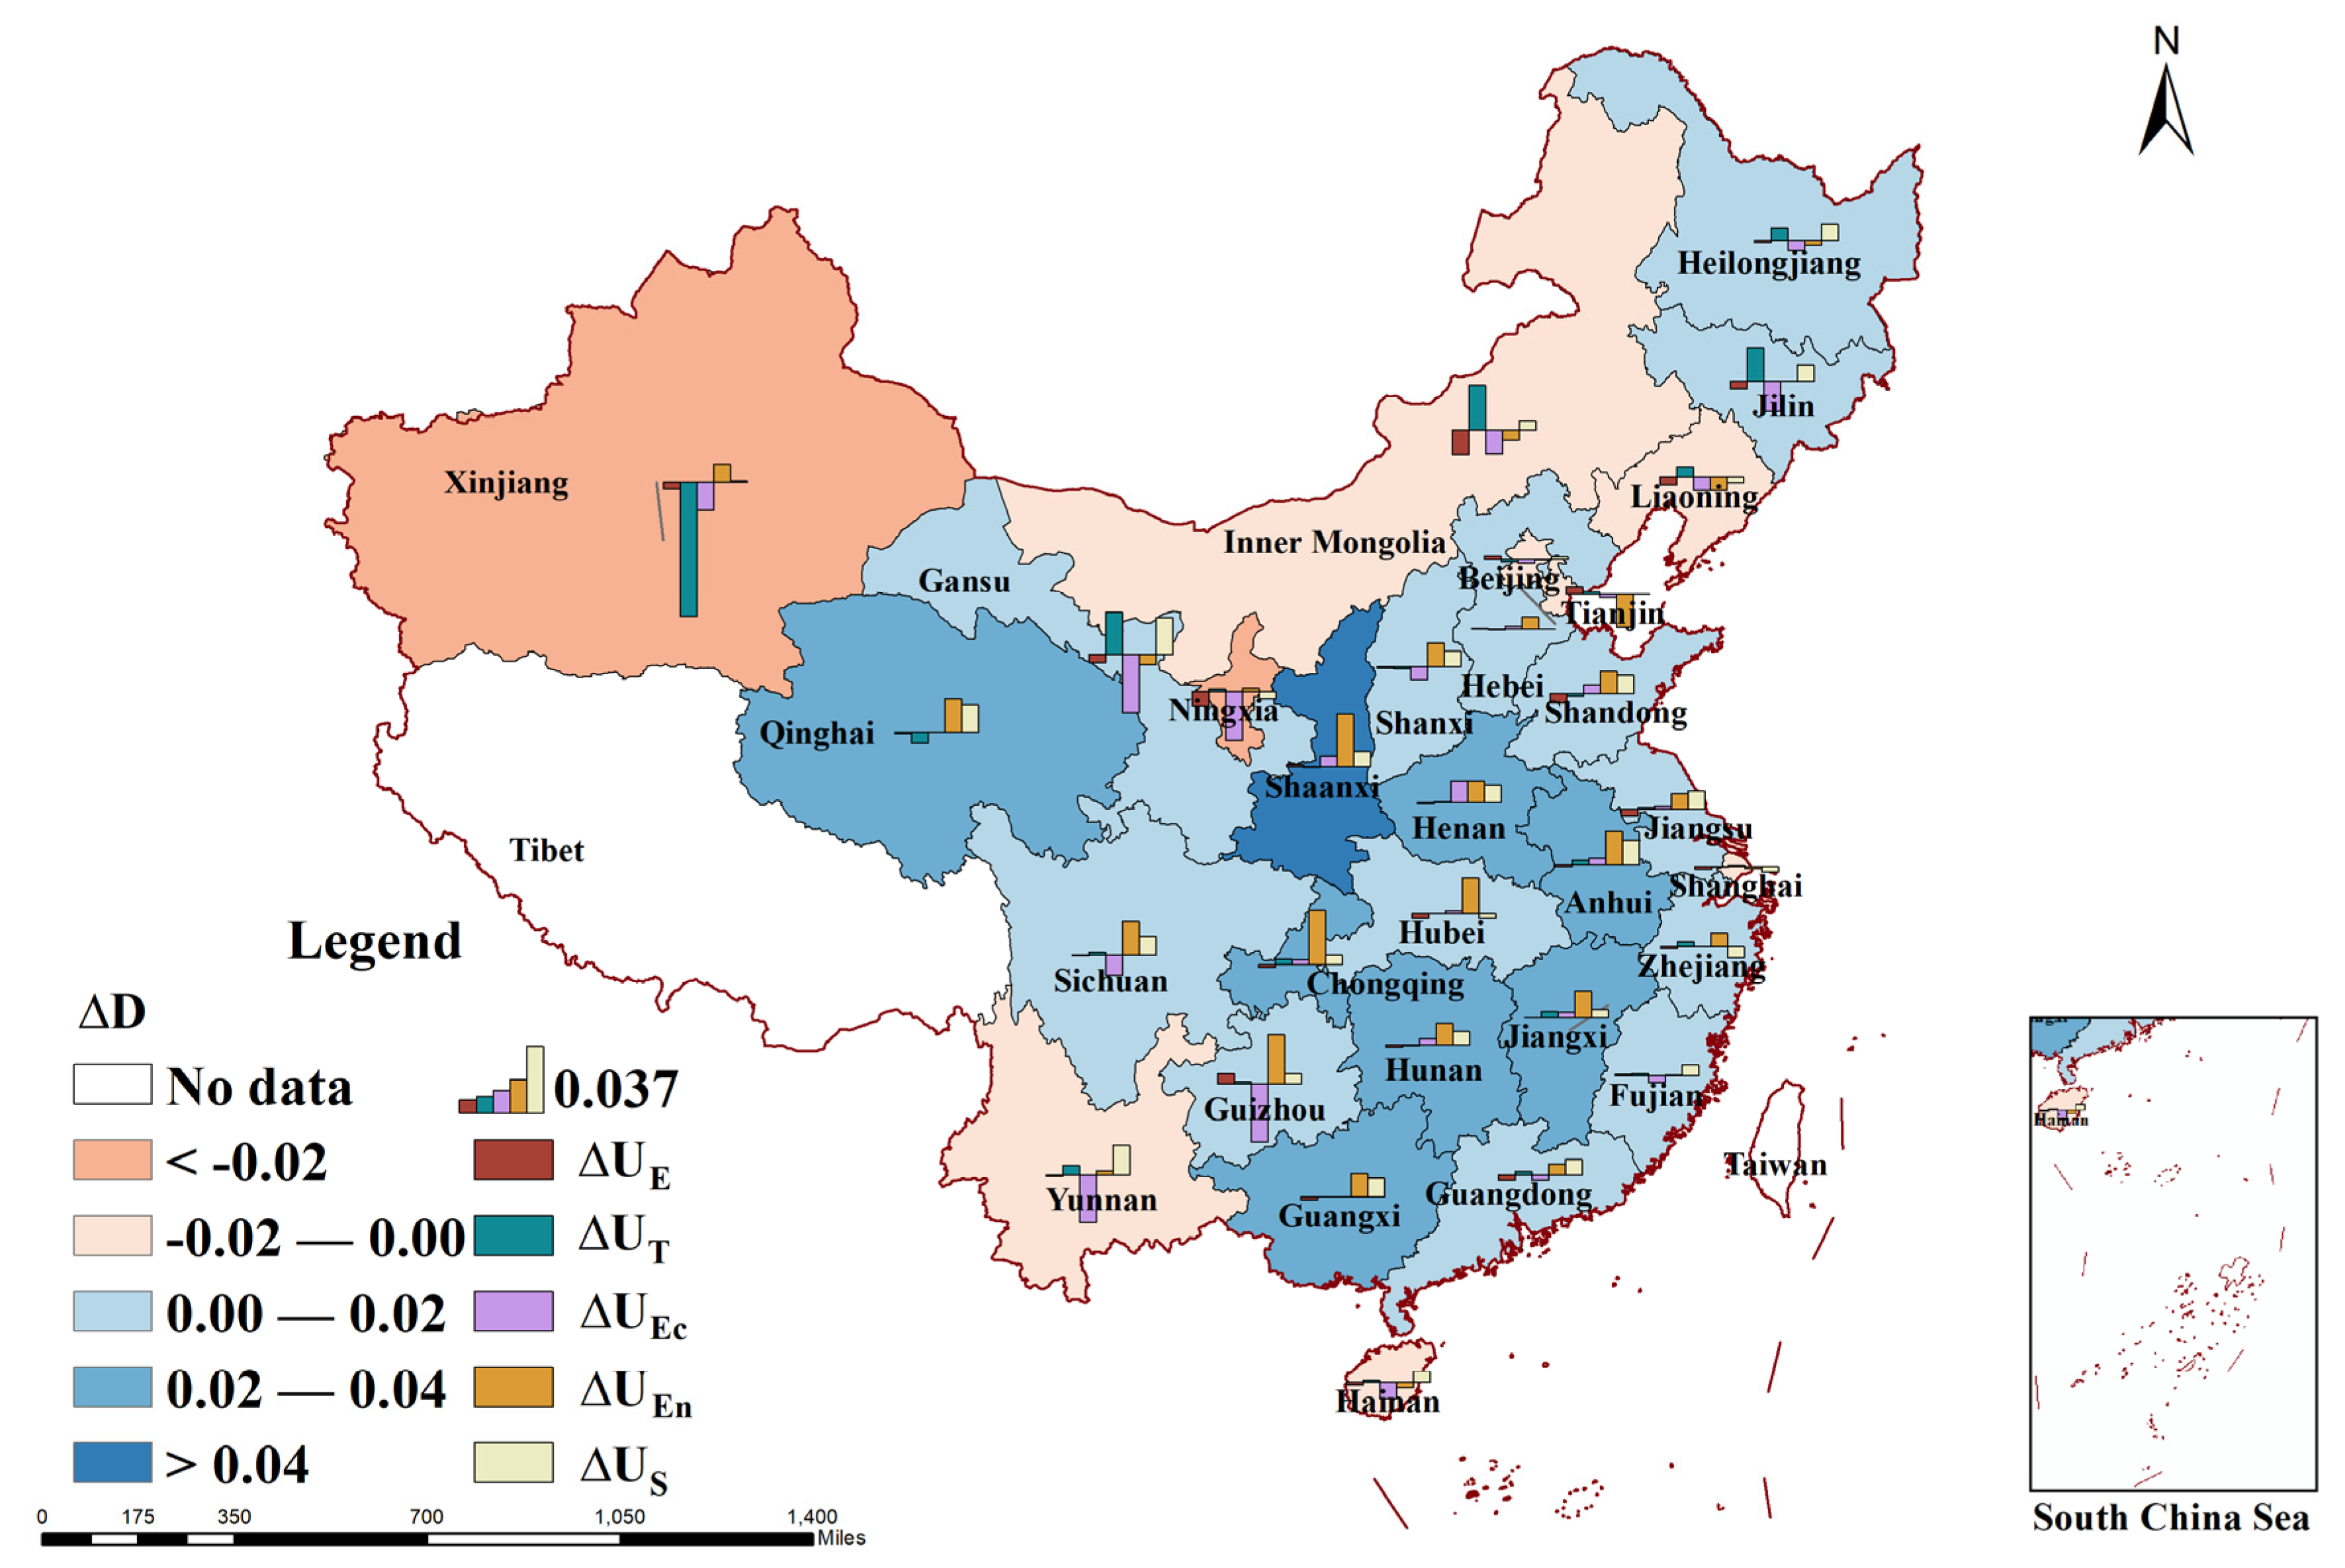
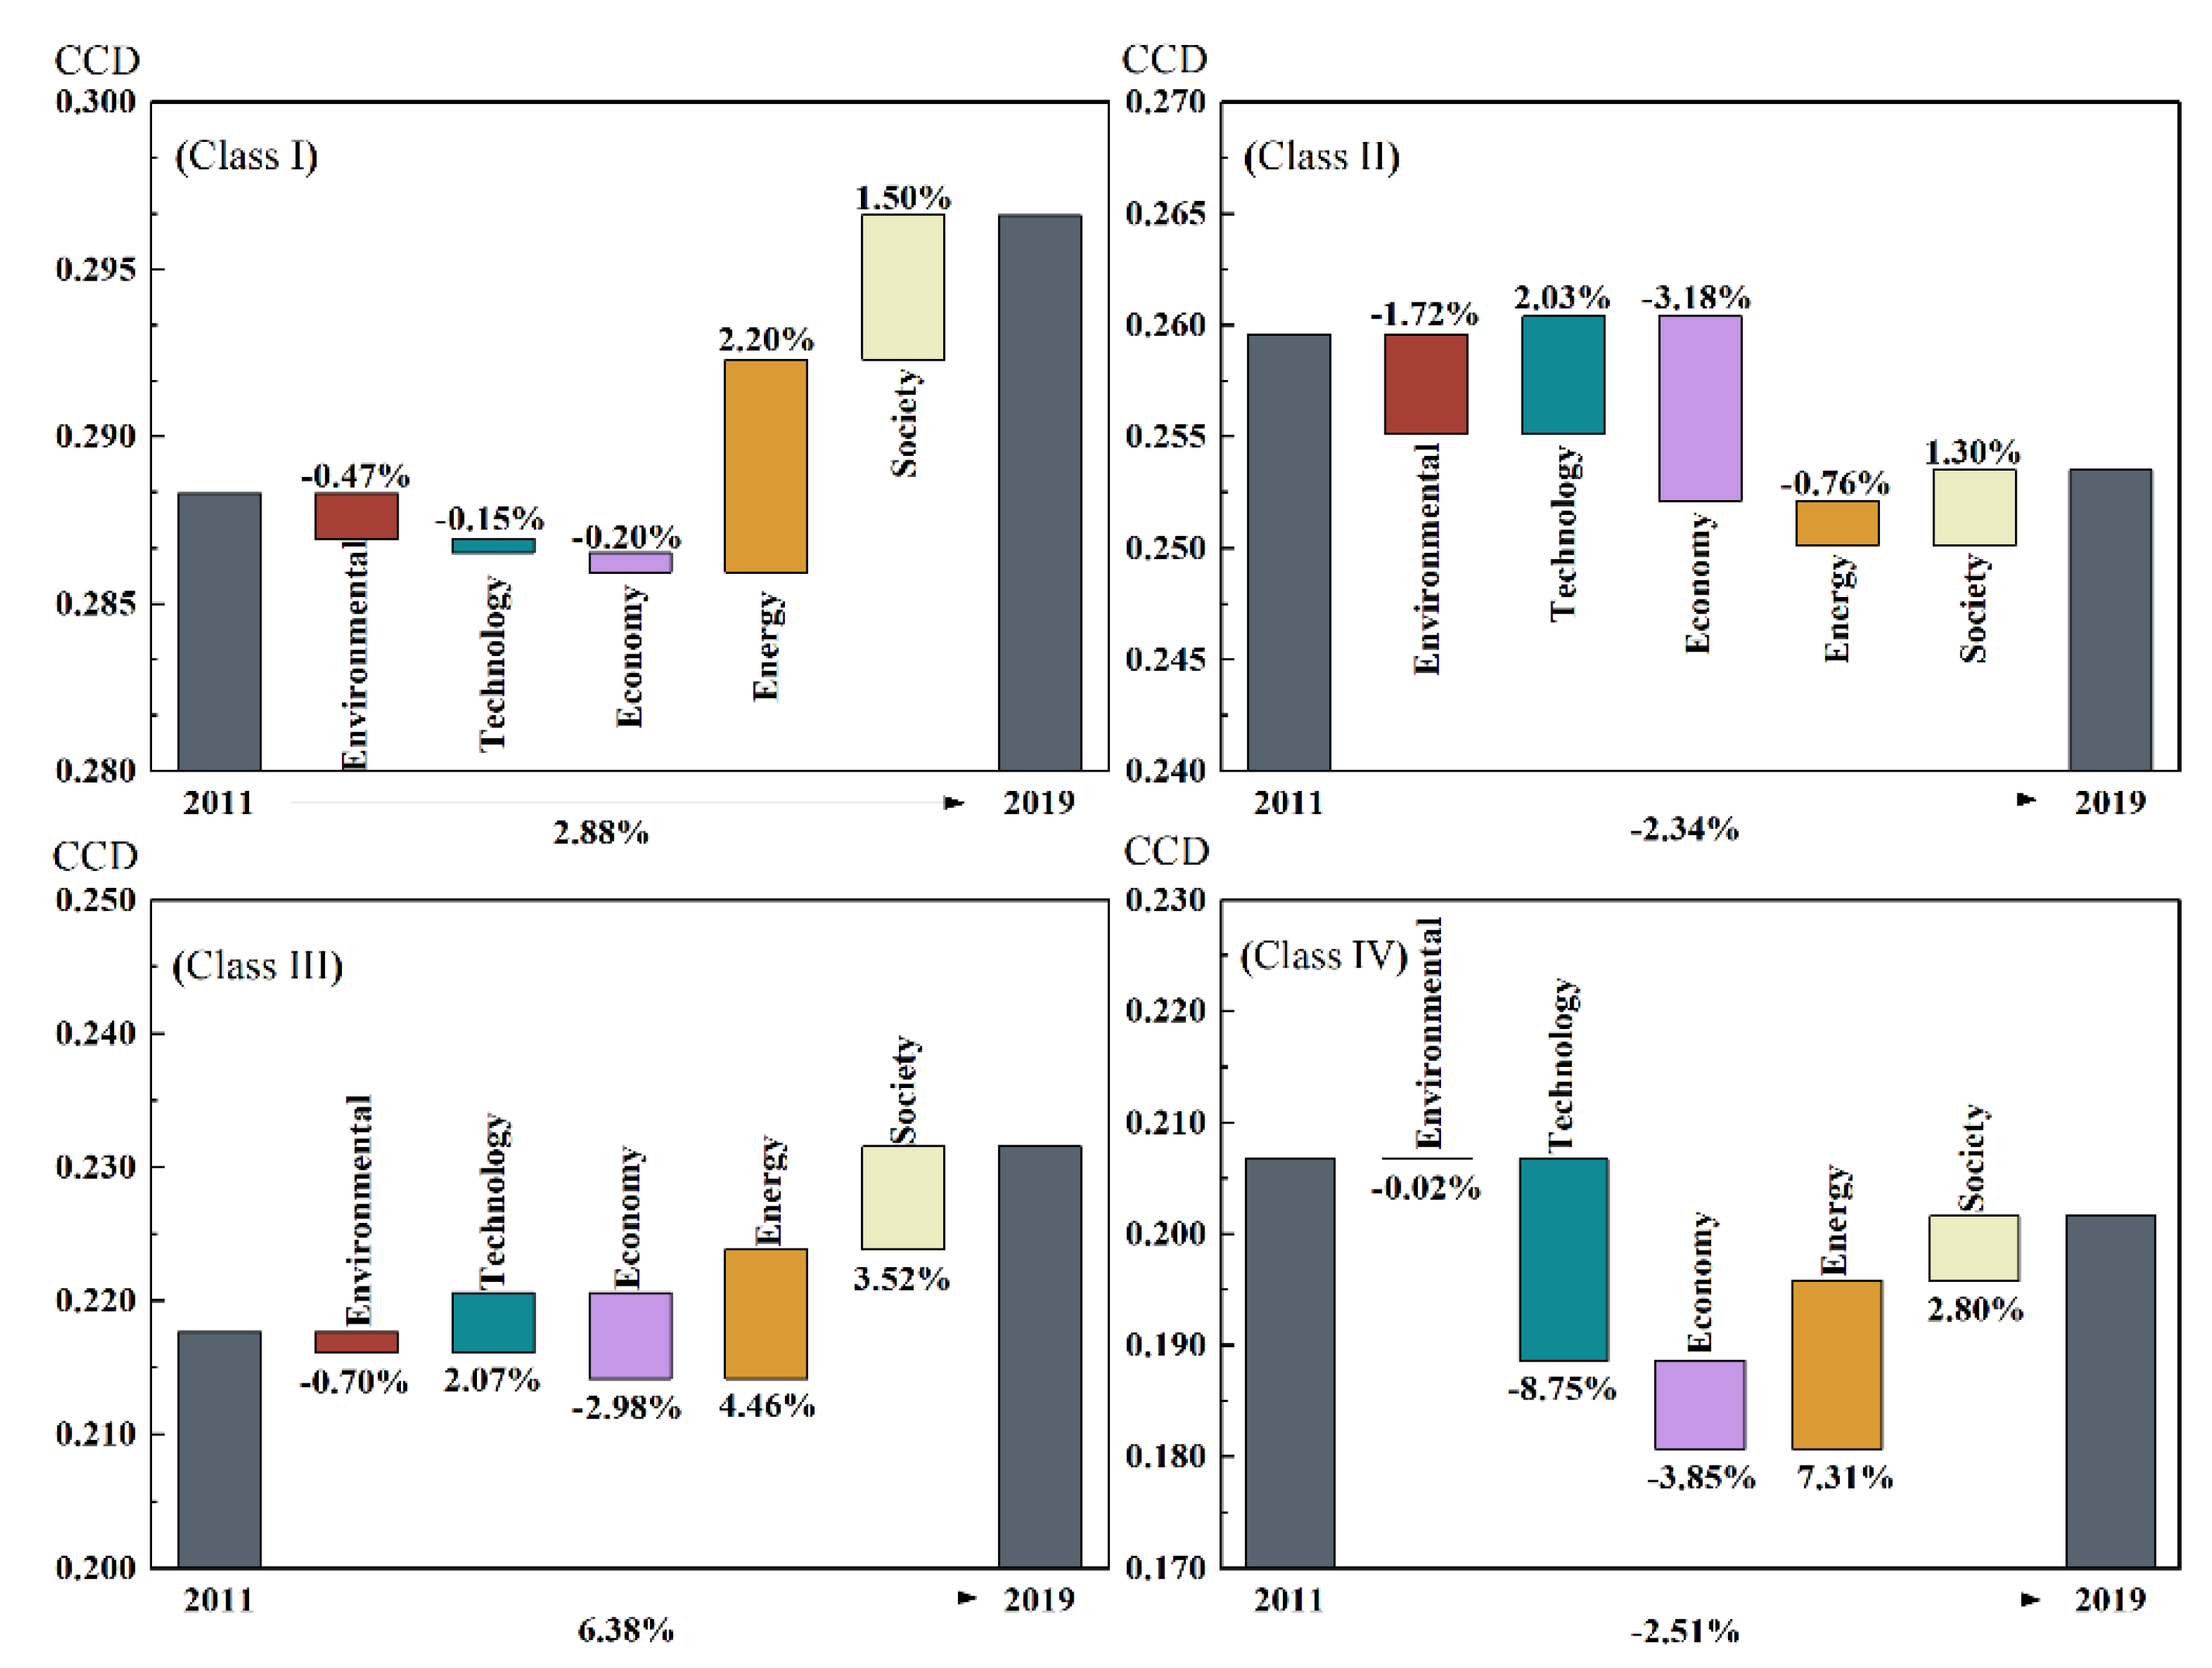
3.2.2. Decomposition Analysis of the Dimension Contribution Degree

This paper decomposes the changes in regional CCD from 2011 to 2019 to study the contribution changes of each dimension in the process of regional coupling and coordinated development (Figure 8). The results show that the CCD increases in provinces in Class I and Class III regions are 2.88% and 6.38%, respectively. The CCD declines of provinces in Class II and Class IV regions are 2.34% and 2.51%, respectively. In addition, the variation degree of the dimensional contribution of the CCD in different regions is still quite different.
It is worth noting that environmental sustainability and economic benefits in all regions limit the degree of coupling and coordination of comprehensive RE development to varying degrees, indicating that economic development in most regions is still at the expense of increasing environmental pressure. China is in the late stage of industrialization, and there is still a rigid demand for fossil energy consumption. In the power generation process to promote the utilization of RE, fossil energy power generation still dominates with cost and resource advantages. In addition, fossil power generation has practical problems such as a large installed capacity base and short service life of stock units. At the same time, there are still many practical problems in RE development, such as the large-scale abandonment of wind and light, a continuous increase in the gap in subsidy funds, an imperfect electricity-trading market mechanism, and a fragile ecological environment [61,62,63]. In other words, the coordinated development of RE remains a considerable challenge at both the economic and environmental levels. In addition, social development has become an important driving force for the coordinated development of RE. Urbanization construction at the current stage has gradually achieved intensive and efficient development. Residents with high income levels are increasingly aware of environmental protection and highly accept low-carbon lifestyles in their daily lives [64,65].
For Class I, the CCD increased 2.88% from 2011 to 2019, mainly relying on energy (2.20%) and social development (1.50%) to drive the overall CCD improvement. The environment, technology, and economy have slightly hindered the CCD. Most Class I region provinces are mainly concentrated on the eastern coast, with a relatively high degree of wealth. Social development welfare has been significantly improved in recent years, thus making up for the shortcomings of the social dimension in the overall CCD balance. At the same time, the strategic layout of China’s offshore wind power is close to the power load center, which has led to a substantial increase in the installed capacity of offshore wind power in recent years. Therefore, the contribution of the energy dimension to the comprehensive development of regional RE has been improved. For the Class II region, its CCD decreased by 2.34% from 2011 to 2019, and technological and social development are the key to improving its CCD, contributing 2.03% and 1.30% to the improvement in the CCD, respectively. The environment, economy, and energy hinder the CCD, reducing it by 1.72%, 3.18%, and 0.76%, respectively. The significant decline in economic benefits is the main reason for the decline in CCD in such regions. For the Class III region, its coupling coordination increased by 6.38% from 2011 to 2019. Technology, energy, and social development have contributed to the rapid improvement in CCD, contributing 2.07%, 4.46%, and 3.52%, respectively. However, the environment and economy hinder its coordinated development, with the degree of obstruction being −0.70% and −2.98%, respectively. The lower economic level is the main reason for restricting the region’s coordinated development of RE. For the Class IV region, the CCD decreased by 2.51% from 2011 to 2019. Among them, relying on energy and social development contributed more positively to the change in the overall CCD, contributing 7.31% and 2.80%, respectively. The restrictive effect on the environment is only a slight 0.02%, but technology and economy have severely restricted the coordinated development of RE in such regions, contributing −8.75% and −3.85%, respectively. The reduction in science and technology investment is a critical factor in declining coupling coordination in such regions.
Since the CCD between dimensions is consistent with the comprehensive development level of regional RE, the dominant factors affecting CCD change can indirectly reflect the key factors affecting the comprehensive development level of RE. Economy and technology are essential factors to ensure RE development, which most researchers also recognize (e.g., Muhammed et al. [64] and Wang et al. [65]). Therefore, for Class II and Class III regions, accelerating economic construction is the key to balancing RE development. For Class IV, prioritizing technology development and increasing technological innovation vitality are the keys to improving RE development.
Figure 9 shows the changes in CCD in each province and the influence of decomposition factors. During the study period, CCD increased in most provinces, with the most significant increase in Shaanxi Province, followed by some provinces in the central region. At the same time, the CCD in Xinjiang, Ningxia, Inner Mongolia, Liaoning, Yunnan, Hainan, Tianjin, Beijing, and Shanghai gradually decreased. Among them, Xinjiang and Ningxia had the most apparent decline. For most provinces, the energy dimension was the dominant factor promoting the positive development of the CCD. However, there were significant regional differences in the impact of economic dimensions on CCD. The economic development of the provinces located in the western and northeastern regions dramatically restricted the improvement in CCD. In contrast, the provinces in the central and eastern regions showed a positive promotion effect. It is worth noting that Xinjiang’s investment in science and technology seriously inhibited the further development of local CCDs. Therefore, investment in science and technology and talent is the key to improving the comprehensive development level of Xinjiang’s RE.

4. Conclusions and Policy Implications

4.1. Conclusions

For the low-carbon transformation of China’s current energy system, RE has become a necessary force to replace fossil energy with its advantages of being nonpolluting and environmentally friendly. Based on the panel data of 30 provinces in China from 2011 to 2019, this study constructed a multidimensional comprehensive development evaluation system for RE. It calculated the comprehensive degree of RE development in each region. This paper explores the coupling and coordination relationship between various dimensions. It quantitatively identifies the dominant factors that affect the changes in the coupling and coordination relationship of the comprehensive development of RE in different regions. This provides directions for further improving the development level of RE in various regions. The specific conclusions are as follows:
(1) The overall development of China’s RE is at a relatively low level (0.3558), and the development of the RE industry is still in its infancy. The spatial distribution of provinces with a high level of comprehensive regional RE development shifted to the east. Moreover, the development potential difference between regions is still apparent. As of 2019, the leading provinces in the comprehensive development of RE (>0.40) include Qinghai, Beijing, Jiangsu, Guangdong, Zhejiang, and Shanghai and play the role of leaders in the comprehensive development of RE. These regions benefited from resource endowment and social development, with an average contribution of 2.20% and 1.50%, respectively. At the same time, limited by environmental sustainability, the average contribution is −0.47%. The number of provinces with relatively backward comprehensive RE development (<0.30) decreased, including only Heilongjiang, Hunan, Liaoning, Sichuan, and Xinjiang. Among them, Heilongjiang, Liaoning, and Sichuan are mainly limited by economic benefits (−2.38%; −2.92%; and −5.51%), Hunan is mainly limited by environmental sustainability (−0.62%), and Xinjiang is mainly limited by technical support (−31.52%).
(2) The CCD between various dimensions in the comprehensive development of RE is low, and the overall development is still in the stage of low-level coupling. That is, regional RE has not achieved coordinated development. The distribution of CCD shows a spatial distribution characteristic that evolves from “basin type” to high in the east and low in the west. This result is consistent with the evolution characteristics of the spatial distribution of the comprehensive development level. Therefore, RE’s comprehensive development level can be achieved by balancing the coordination between dimensions.
(3) The increase in the CCD between dimensions in different regions is Class III>Class I > Class II > Class IV. Among them, the CCD of provinces in Class I and Class III regions is gradually increasing, and energy (2.20% and 4.46%) and society (1.50% and 3.52%) are the leading factors to promote their coordinated development. However, the CCD of the provinces in Class II and Class IV regions gradually decreased. Economic (−3.18%), science, and technology (−8.75%) are the dominant factors restricting the coordinated development of provinces in Class II and Class IV regions, respectively.

4.2. Policy Implications

The existence of regional differences in the coordinated development process between the comprehensive development level and dimensions of RE means that regional RE policies need to be more differentiated to achieve further sustainable and coordinated development.
(1) From the perspective of comprehensive RE development, provinces in the eastern and central regions need to rationally develop RE, including establishing a sound and efficient distributed RE development plan. The leading role of Beijing, Shanghai, Zhejiang, and Jiangsu provinces should be strengthened. Relevant departments in Sichuan, Guizhou, Liaoning, Jilin, and most central provinces should appropriately increase their investment in RE power. They should also improve the level of economic development in various regions, maintain the new normal development of the economy, and further strengthen economic exchanges between provinces, thereby providing stable economic support for the utilization of RE. An interregional innovation technology exchange mechanism should be established with the developed eastern provinces to realize the regional interaction of advanced technologies and low-carbon management experience in the RE industry. Northwestern provinces such as Inner Mongolia, Ningxia, Gansu, Qinghai, and Xinjiang need to increase technology investment in RE. This includes increasing the construction speed and scale of cross-regional high-voltage and ultrahigh-voltage power grids to increase the grid connection capacity and infrastructure support of RE power. At the same time, it taps its own potential for RE consumption and promotes nearby RE power consumption. Technical exchanges with technologically developed provinces should be strengthened, thereby increasing talent support and scientific research support related to RE development. In addition, the environmental protection expenditure of related industries should be appropriately increased, especially for high-polluting industries such as the coal chemical industry and coal power generation. They should reduce the overall level of pollutant emissions in the region and enhance the mechanism of environmental sustainability to force the sustainable development of RE.
(2) From the perspective of dimensional contribution and coordinated development, it is necessary to take location advantages and energy advantages to drive the rapid development of the wind power industry (onshore wind power + offshore wind power) in each province in the Class I regions. Furthermore, energy utilization efficiency and development potential should be improved, the construction of green digital centers should be promoted, and a green economy should be realized. They should continue to pay attention to and improve the construction of environmental protection facilities in the provinces in Class II areas, strengthen environmental protection publicity and education, and ensure the coordinated development of the ecological environment and economical construction. On the premise of ensuring energy advantages, actions taken should include improving the economic development level of provinces in Class III regions, vigorously promoting the market transactions of distributed power sources by using regional energy advantages, improving the business model of RE development, promoting economic development with energy advantages, and improving the quality of energy utilization with economic development. They should improve the quality of energy utilization and social urbanization through economic development and further accelerate the social development of the Class III areas. The scientific and technological investment of RE in the provinces in Class IV regions should be strengthened, the technological innovation capabilities of related enterprises should be enhanced, the introduction of talent should be increased, and the innovation vitality of talent should be stimulated. In addition, they should make up for the lagging development of RE caused by insufficient investment in science and technology.

Author Contributions

Methodology: W.L., Writing—Original draft preparation: W.L., Formal analysis: W.L.; Data curation: B.W.; Supervision: T.G.; Investigation: X.S., Writing—Reviewing and Editing: X.S.; Funding acquisition: Y.Z.; Supervision: H.D. All authors have read and agreed to the published version of the manuscript.

Funding

This work was supported by the National Natural Science Foundation of China (Grant No. 41971265, 71991484, 71991485).

Institutional Review Board Statement

Not applicable.

Informed Consent Statement

Not applicable.

Data Availability Statement

Not applicable.

Conflicts of Interest

The authors declare that they have no known competing financial interests or personal relationships that could have appeared to influence the work reported in this paper.

Appendix A

Table A1. Comprehensive development level of regional renewable energy from 2011 to 2019.
Province201120122013201420152016201720182019Mean
Beijing0.51230.49600.50430.51500.49900.50740.51340.51240.50630.5073
Qinghai0.41890.44280.49600.52670.51120.48430.52440.52990.54630.4978
Shanghai0.47840.46940.45640.47650.48110.46540.47260.46660.46480.4702
Guangdong0.45440.46470.47210.48710.46530.45530.48150.46730.47060.4687
Jiangsu0.43930.44100.45840.47760.47300.46500.49050.48930.48150.4684
Zhejiang0.43760.43160.43700.47690.46430.45590.49490.46730.46810.4593
Ningxia0.44850.42180.40510.48260.51290.47050.43890.42130.36370.4406
Gansu0.48050.43830.45280.47830.38600.37490.37890.37660.37410.4156
Tianjin0.41880.37440.37090.38910.38310.40440.37980.41020.39020.3912
Fujian0.38810.38250.38280.38180.37900.39510.40070.39100.39660.3886
Inner Mongolia0.41670.38750.38870.42750.39590.38800.38380.36880.32900.3873
Shandong0.32190.32130.33230.33510.33420.34620.38920.36040.36090.3446
Yunnan0.34170.33210.33000.36020.36950.32820.34120.32840.32000.3390
Hebei0.32880.33150.29150.31450.31640.31560.35090.37550.36830.3326
Hainan0.34860.32710.31670.32000.30470.30810.30210.37710.31920.3248
Xinjiang0.30200.30670.34200.36420.37720.31750.31740.30060.28270.3234
Liaoning0.34630.33690.33310.31270.28630.27130.29950.30290.29690.3095
Hubei0.29220.27560.29260.32230.30500.31420.32930.31240.31960.3070
Guangxi0.27570.27550.28670.28890.34570.30130.35410.30400.32180.3059
Sichuan0.27200.26680.34560.34810.33210.29890.30200.28380.29260.3047
Anhui0.24620.26320.26960.31090.30000.31670.35110.33410.33410.3029
Jiangxi0.26110.25380.26170.28510.29750.34800.35050.32720.34070.3029
Chongqing0.26330.27920.28580.28530.32360.28730.30830.34530.32310.3001
Jilin0.31620.30090.29550.28800.26980.28490.30400.31370.31020.2981
Shaanxi0.23910.23630.26550.28000.27570.30950.32620.33170.35470.2910
Henan0.25700.23860.25060.28340.26370.30960.34300.33000.32780.2893
Heilongjiang0.29600.29800.30360.28600.26680.26230.28280.30000.29910.2883
Hunan0.26250.24200.24920.29720.29110.26530.30270.30060.29900.2788
Shanxi0.26040.25070.24410.28070.26670.26640.27590.28860.30190.2706
Guizhou0.22470.27880.24780.28900.27150.25220.25100.24330.32540.2649
Mean0.34500.33880.34560.36570.35830.35230.36800.36530.36300.3558

References

  1. Yu, S.; Hu, X.; Li, L.; Chen, H. Does the development of renewable energy promote carbon reduction? Evidence from Chinese provinces. J. Environ. Manag. 2020, 268, 110634. [Google Scholar] [CrossRef]
  2. Cheng, Y.; Yao, X. Carbon intensity reduction assessment of renewable energy technology innovation in China: A panel data model with cross-section dependence and slope heterogeneity. Renew. Sustain. Energy Rev. 2021, 135, 110157. [Google Scholar] [CrossRef]
  3. Liu, W.; Fan, W.; Hong, Y.; Chen, C. A study on the comprehensive evaluation and analysis of China’s renewable energy development and regional energy development. Front. Energy Res. 2021, 9, 635570. [Google Scholar] [CrossRef]
  4. Musial, W.; Ziolo, M.; Luty, L.; Musial, K. Energy policy of European Union member states in the context of renewable energy sources development. Energies 2021, 14, 2864. [Google Scholar] [CrossRef]
  5. Tabassum, S.; Rahman, T.; Islam, A.U.; Rahman, S.; Dipta, D.R.; Roy, S.; Mohammad, N.; Na-war, N.; Hossain, E. Solar energy in the United States: Development, challenges and future prospects. Energies 2021, 14, 8142. [Google Scholar] [CrossRef]
  6. Borawski, P.; Wyszomierski, R.; Beldycka-Borawska, A.; Mickiewicz, B.; Kalinowska, B.; Dunn, J.; Rokicki, T. Development of renewable energy sources in the European Union in the context of sustainable development policy. Energies 2022, 15, 1545. [Google Scholar] [CrossRef]
  7. Habel, S.; Hakala, E. Policy coherence for sustainable development and environmental security: A case study of European Union policies on renewable energy. Environ. Policy Gov. 2021, 31, 633–646. [Google Scholar] [CrossRef]
  8. Cucchiella, F.; D’Adamo, I.; Gastaldi, M. Future trajectories of renewable energy consumption in the European Union. Resources 2018, 7, 10. [Google Scholar] [CrossRef]
  9. Foster, N.; Orrell, A.; Homer, J.; Tagestad, J. The “perfect storm” for distributed wind markets. Renew. Energy 2020, 145, 1033–1039. [Google Scholar] [CrossRef]
  10. Abramic, A.; Mendoza, A.G.; Haroun, R. Introducing offshore wind energy in the sea space: Canary Islands case study developed under maritime spatial planning principles. Renew. Sustain. Energy Rev. 2021, 145, 111119. [Google Scholar] [CrossRef]
  11. Golombek, R.; Lind, A.; Ringkjob, H.K.; Seljom, P. The role of transmission and energy storage in European decarbonization towards 2050. Energy 2022, 239, 122159. [Google Scholar] [CrossRef]
  12. Hazboun, S.O.; Boudet, H.S. Public preferences in a shifting energy future: Comparing public views of eight energy sources in North America’s pacific northwest. Energies 2020, 13, 1940. [Google Scholar] [CrossRef]
  13. Streimikiene, D.; Balezentis, T.; Volkov, A.; Morkunas, M.; Zickiene, A.; Streimikis, J. Barriers and drivers of renewable energy penetration in rural areas. Energies 2021, 14, 6452. [Google Scholar] [CrossRef]
  14. Zimon, G.; Zimon, D. The impact of purchasing group on the profitability of companies operating in the renewable energy sector-The case of Poland. Energies 2020, 13, 6588. [Google Scholar] [CrossRef]
  15. Zimmerman, M.G.; Reames, T.G. Where the wind blows: Exploring barriers and opportunities to renewable energy development on United States tribal lands. Energy Res. Soc. Sci. 2021, 72, 101874. [Google Scholar] [CrossRef]
  16. Helman, U.; Kaun, B.; Stekli, J. Development of long-duration energy storage projects in electric power systems in the United States: A survey of factors which are shaping the market. Front. Energy Res. 2020, 8, 539752. [Google Scholar] [CrossRef]
  17. Sun, X.; Lian, W.; Duan, H.; Wang, A. Factors affecting wind power efficiency: Evidence from provincial-level data in China. Sustainability 2021, 13, 12759. [Google Scholar] [CrossRef]
  18. Li, L.; Ren, X.; Yang, Y.; Zhang, P.; Chen, X. Analysis and recommendations for onshore wind power policies in China. Renew. Sustain. Energy Rev. 2018, 82, 156–167. [Google Scholar] [CrossRef]
  19. Kirmani, S.; Irfan, M.; Ahmad, S. IEEE in performance enhancement methodologies for grid connected photovoltaic systems. In Proceedings of the 12th IEEE International Conference Electronics, Energy, Environment, Communication, Computer, Control, New Delhi, India, 17–20 December 2015. [Google Scholar]
  20. Zhang, S.; Andrews-Speed, P.; Zhao, X. Political and institutional analysis of the successes and failures of China’s wind power policy. Energy Policy 2013, 56, 331–340. [Google Scholar] [CrossRef]
  21. Bamati, N.; Raoofi, A. Development level and the impact of technological factor on renewable energy production. Renew. Energy 2020, 151, 946–955. [Google Scholar] [CrossRef]
  22. Clausen, L.T.; Rudolph, D. Renewable energy for sustainable rural development: Synergies and mismatches. Energy Policy 2020, 138, 111289. [Google Scholar] [CrossRef]
  23. Zhang, C.X.; Zhou, D.Q.; Wang, Q.W.; Ding, H.; Zhao, S.Q. Will fiscal decentralization stimulate renewable energy development? Evidence from China. Energy Policy 2022, 164, 112893. [Google Scholar] [CrossRef]
  24. Mukeshimana, M.C.; Zhao, Z.Y.; Nshimiyimana, J.P. Evaluating strategies for renewable energy development in Rwanda: An integrated SWOT—ISM analysis. Renew. Energy 2021, 176, 402–414. [Google Scholar] [CrossRef]
  25. Wang, Y.; Zhang, D.; Ji, Q.; Shi, X. Regional renewable energy development in China: A multi-dimensional assessment. Renew. Sustain. Energy Rev. 2020, 124, 109797. [Google Scholar] [CrossRef]
  26. Yu, S.; Zheng, Y.; Li, L. A comprehensive evaluation of the development and utilization of China’s regional renewable energy. Energy Policy 2019, 127, 73–86. [Google Scholar] [CrossRef]
  27. Liang, Y.; Yu, B.; Wang, L. Costs and benefits of renewable energy development in China’s power industry. Renew. Energy 2019, 131, 700–712. [Google Scholar] [CrossRef]
  28. Sun, Y.; Wang, R.; Li, J.; Liu, J. GIS-based multiregional potential evaluation and strategies selection framework for various renewable energy sources: A case study of eastern coastal regions of China. Energy Sci. Eng. 2017, 5, 123–140. [Google Scholar] [CrossRef]
  29. Singh, R.; Prakash, O. Wind energy potential evaluation for power generation in selected districts of Jharkhand. Energy Sources Part A 2018, 40, 673–679. [Google Scholar] [CrossRef]
  30. Sun, J.; Sun, D.; Guo, S. Evaluation on the efficiency of biomass power generation industry in China. Sci. World J. 2014, 2014, 831372. [Google Scholar] [CrossRef]
  31. Dong, F.; Pan, Y. Evolution of renewable energy in BRI countries: A combined econometric and decomposition approach. Int. J. Environ. Res. Public Health 2020, 17, 8668. [Google Scholar] [CrossRef]
  32. Zheng, S.; Yang, J.; Yu, S. How renewable energy technological innovation promotes renewable power generation: Evidence from China’s provincial panel data. Renew. Energy 2021, 177, 1394–1407. [Google Scholar] [CrossRef]
  33. Bai, C.; Feng, C.; Du, K.; Wang, Y.; Gong, Y. Understanding spatial-temporal evolution of renewable energy technology innovation in China: Evidence from convergence analysis. Energy Policy 2020, 143, 111570. [Google Scholar] [CrossRef]
  34. Khezri, M.; Heshmati, A.; Khodaei, M. The role of R&D in the effectiveness of renewable energy determinants: A spatial econometric analysis. Energy Econ. 2021, 99, 105287. [Google Scholar]
  35. Han, D.; Li, T.; Feng, S.; Shi, Z. Does renewable energy consumption successfully promote the green transformation of China’s industry? Energies 2020, 13, 229. [Google Scholar] [CrossRef]
  36. Zhang, P. Do energy intensity targets matter for wind energy development? Identifying their heterogeneous effects in Chinese provinces with different wind resources. Renew. Energy 2019, 139, 968–975. [Google Scholar] [CrossRef]
  37. Solangi, Y.A.; Longsheng, C.; Shah, S.A.A.; Alsanad, A.; Ahmad, M.; Akbar, M.A.; Gumaei, A.; Ali, S. Analyzing renewable energy sources of a developing country for sustainable development: An integrated fuzzy based-decision methodology. Processes 2020, 8, 825. [Google Scholar] [CrossRef]
  38. Ji, Q.; Zhang, D. How much does financial development contribute to renewable energy growth and upgrading of energy structure in China? Energy Policy 2019, 128, 114–124. [Google Scholar] [CrossRef]
  39. Zhao, X.; Luo, D. Driving force of rising renewable energy in China: Environment, regulation and employment. Renew. Sustain. Energy Rev. 2017, 68, 48–56. [Google Scholar] [CrossRef]
  40. Khribich, A.; Kacem, R.H.; Dakhlaoui, A. Causality nexus of renewable energy consumption and social development: Evidence from high-income countries. Renew. Energy 2021, 169, 14–22. [Google Scholar] [CrossRef]
  41. Chen, Y. Factors influencing renewable energy consumption in China: An empirical analysis based on provincial panel data. J. Clean. Prod. 2018, 174, 605–615. [Google Scholar] [CrossRef]
  42. Park, J.-I.; Kim, T. Institutional improvement measures for environmental assessment in the pur-suit of eco-friendly ocean renewable energy development in South Korea. Renew. Sustain. Energy Rev. 2016, 58, 526–536. [Google Scholar] [CrossRef]
  43. Vural, G. Analyzing the impacts of economic growth, pollution, technological innovation and trade on renewable energy production in selected Latin American countries. Renew. Energy 2021, 171, 210–216. [Google Scholar] [CrossRef]
  44. Bistline, J.E. Economic and technical challenges of flexible operations under large-scale variable renewable deployment. Energy Econ. 2017, 64, 363–372. [Google Scholar] [CrossRef]
  45. Matei, I. Is there a Link between Renewable Energy Consumption and Economic Growth? A Dynamic Panel Investigation for the OECD Countries. Revue D Econ. Polit. 2017, 127, 985–1012. [Google Scholar] [CrossRef]
  46. Meleddu, M.; Pulina, M. Public spending on renewable energy in Italian regions. Renew. Energy 2018, 115, 1086–1098. [Google Scholar] [CrossRef]
  47. Ehigiamusoe, K.U.; Dogan, E. The role of interaction effect between renewable energy consumption and real income in carbon emissions: Evidence from low-income countries. Renew. Sustain. Energy Rev. 2022, 154, 111883. [Google Scholar] [CrossRef]
  48. Liu, Y.; Yu, B.; Jia, X.-l. Research on the external environment cost for renewable energy. In Proceedings of the 18th International Conference on Management Science and Engineering, Rome, Italy, 13–15 September 2011. [Google Scholar]
  49. Lin, B.; Moubarak, M. Renewable energy consumption—Economic growth nexus for China. Renew. Sustain. Energy Rev. 2014, 40, 111–117. [Google Scholar] [CrossRef]
  50. Sadorsky, P. Renewable energy consumption and income in emerging economies. Energy Policy 2009, 37, 4021–4028. [Google Scholar] [CrossRef]
  51. Yang, J.; Zhang, W.; Zhang, Z. Impacts of urbanization on renewable energy consumption in China. J. Cleaner Prod. 2016, 114, 443–451. [Google Scholar] [CrossRef]
  52. Sun, X.; Zhang, Z. Coupling and coordination level of the population, land, economy, ecology and society in the process of urbanization: Measurement and spatial differentiation. Sustainability 2021, 13, 3171. [Google Scholar] [CrossRef]
  53. Gai, M.; Zhang, F. Regional carbon emissions, economic development and environmental protection coupling in Liaoning province. Sci. Geogr. Sin. 2018, 38, 764–772. [Google Scholar]
  54. Li, J.; Yuan, W.; Qin, X.; Qi, X.; Meng, L. Coupling coordination degree for urban green growth between public demand and government supply in urban agglomeration: A case study from China. J. Environ. Manag. 2022, 304, 114209. [Google Scholar] [CrossRef] [PubMed]
  55. Li, W.; Dong, F.; Ji, Z. Research on coordination level and influencing factors spatial heterogeneity of China’s urban CO2 emissions. Sustain. Cities Soc. 2021, 75, 103323. [Google Scholar] [CrossRef]
  56. Ang, B.W. LMDI decomposition approach: A guide for implementation. Energy Policy 2015, 86, 233–238. [Google Scholar] [CrossRef]
  57. Lorente, A.G.; Lopez, M.H.; Alvarez, F.J.M.; Jimenez, J.M. Differences in electricity generation from renewable sources from similar environmental conditions: The cases of Spain and Cuba. Sustainability 2020, 12, 5190. [Google Scholar] [CrossRef]
  58. Muhammed, G.; Tekbiyik-Ersoy, N. Development of renewable energy in China, USA, and Brazil: A comparative study on renewable energy policies. Sustainability 2020, 12, 9136. [Google Scholar] [CrossRef]
  59. Wang, P.; Zhang, Z.J.; Zeng, Y.L.; Yang, S.C.; Tang, X. The effect of technology innovation on corporate sustainability in Chinese renewable energy companies. Front. Energy Res. 2021, 9, 638459. [Google Scholar] [CrossRef]
  60. Gan, L.; Shi, H.; Hu, Y.; Lev, B.; Lan, H.X. Coupling coordination degree for urbanization city-industry integration level: Sichuan case. Sustain. Cities Soc. 2020, 58, 102136. [Google Scholar] [CrossRef]
  61. Kaldellis, J.K.; Zafirakis, D. Prospects and challenges for clean energy in European Islands. The TILOS paradigm. Renew. Energy 2020, 145, 2489–2502. [Google Scholar] [CrossRef]
  62. Yadav, A.; Pal, N.; Patra, J.; Yadav, M. Strategic planning and challenges to the deployment of renewable energy technologies in the world scenario: Its impact on global sustainable development. Environ. Dev. Sustain. 2020, 22, 297–315. [Google Scholar] [CrossRef]
  63. Singh, S.; Fozdar, M. Double-sided bidding strategy for power suppliers and large buyers with amalgamation of wind and solar based generation in a modern energy market. IET Gener. Transm. Dis. 2020, 14, 1031–1041. [Google Scholar] [CrossRef]
  64. Pan, A.; Zhang, W.N.; Xie, Q.Z.; Dai, L.; Zhang, Y.Y. Do carbon emissions accelerate low-carbon innovation? Evidence from 285 Chinese prefecture-level cities. Environ. Sci. Pollut. Res. 2021, 28, 50510–50524. [Google Scholar] [CrossRef] [PubMed]
  65. Slupik, S.; Kos-Labedowicz, J.; Trzesiok, J. Energy-related behaviour of consumers from the Silesia province (Poland)-towards a low-carbon economy. Energies 2021, 14, 2218. [Google Scholar] [CrossRef]
Figure 1. The index system of the comprehensive development level of regional renewable energy.
Sustainability 14 11122 g001
Figure 2. Criterion layer weights.
Sustainability 14 11122 g002
Figure 3. Nuclear density map of the national renewable energy comprehensive development level from 2011 to 2019.
Sustainability 14 11122 g003
Figure 4. Spatial distribution comparison map of the regional comprehensive development level of renewable energy.
Sustainability 14 11122 g004
Figure 5. Comparison of the coupling coordination degree and the comprehensive development level of renewable energy in each region.
Sustainability 14 11122 g005
Figure 6. Coupling coordination degree kernel density change diagram of the renewable energy development subsystem.
Sustainability 14 11122 g006
Figure 7. Spatial distribution of the regional coupling coordination degree.
Sustainability 14 11122 g007
Figure 8. Coupling coordination degree decomposition results in various dimensions of regional renewable energy comprehensive development.
Sustainability 14 11122 g008
Figure 9. Coupling coordination degree decomposition and distribution of renewable energy development level subsystem.
Sustainability 14 11122 g009
Table 1. Coupling coordination degree division stages.
Coupling Coordination StageD
Low-level coupling stage0 < D ≤ 0.3
Antagonistic phase stage0.3 < D ≤ 0.5
Grinding adaptation stage0.5 < D ≤ 0.8
High-level coupling stage0.8 < D ≤ 1.0
Note: The standard for the CCD stage division comes from the literature [55].
Table 2. Combination weights based on AHP-EM ensemble evaluation.
IndicatorsMeasurement StandardWeightIndicatorsMeasurement StandardWeight
Economic benefitsElectricity economy0.0933Energy endowmentEnergy development efficiency0.0673
Economic basis0.0528Energy development potential0.0700
Economic and trade0.0824Energy production efficiency0.0895
Social developmentSocial employment0.0411Energy consumption potential0.0650
Urbanization0.0319Environmental sustainabilityEnvironmental spending0.0366
Personnel income0.0410Electricity carbon intensity0.0417
Technology investmentElectric power interconnected rate0.0253SO2 emission intensity0.0196
Talent support0.0714NOx emission intensity0.0165
Research investment0.0525Dust emission intensity0.0251
Power grid construction0.0493Air quality0.0277
Table 3. Coupling coordination degree of the comprehensive development of regional renewable energy.
201120122013201420152016201720182019
Max0.31550.30930.31210.31450.31030.31390.31450.31520.3140
Min0.19430.18270.19510.18730.20710.20010.19990.16130.1514
Mean0.23730.23510.24250.24710.24500.24440.24990.24680.2442
Note: Numerical statistics of all provinces in the current year.
Table 4. Regional classification of the coupling coordination degree.
Regional LevelCCDArea
Class I0.2738–0.3133Beijing, Shanghai, Guangdong, Jiangsu, Zhejiang, and Qinghai
Class II0.2407–0.2737Tianjin, Ningxia, Fujian, Shandong, and Inner Mongolia
Class III0.2144–0.2406Liaoning, Hebei, Yunnan, Gansu, Shaanxi, Hainan, Shanxi, Chongqing, Hubei, Heilongjiang, Guangxi, Sichuan, Jilin, Jiangxi, and Anhui
Class IV0.2036–0.2143Henan, Hunan, Guizhou, and Xinjiang
Note: Average value of provinces in 2011–2019.
Table 5. Mean values of subsystem indices in four types of regions.
Regional LevelEnvironmentTechnologyEconomyEnergySociety
Class I0.11730.10170.09180.12020.0477
Class II0.08230.06420.07150.12500.0475
Class III0.10190.04930.03560.09780.0282
Class IV0.08690.04710.03460.09560.0248
Note: Average value of provinces in 2011–2019.
Publisher’s Note: MDPI stays neutral with regard to jurisdictional claims in published maps and institutional affiliations.

