Article

Influence of Pig Slurry Application Techniques on Soil CO2, N2O, and NH3 Emissions

1
Institute for Soil Sciences, Centre for Agricultural Research, Eötvös Loránd Research Network, Herman O. St. 15, 1022 Budapest, Hungary
2
Doctoral School of Environmental Sciences, ELTE Eötvös Loránd University, Pázmány P. Promenade 1/A, 1117 Budapest, Hungary
3
National Laboratory for Water Science and Water Security, Institute for Soil Sciences, Centre for Agricultural Research, Herman O. St. 15, 1022 Budapest, Hungary
*
Author to whom correspondence should be addressed.
Sustainability 2022, 14(17), 11107; https://doi.org/10.3390/su141711107
Submission received: 29 July 2022 / Revised: 30 August 2022 / Accepted: 2 September 2022 / Published: 5 September 2022
(This article belongs to the Special Issue Effects of Climate Change on Soil Properties)

Abstract

:
Greenhouse gas (GHG) emissions from agricultural soils can accelerate climate change, therefore, different soil fertilization techniques should be assessed before application to reduce GHG emissions. Pig slurry applications can greatly influence soil carbon dioxide (CO2), nitrous oxide (N2O), and ammonia (NH3) emissions of arable fields; thus, it is important to find site-specific techniques to lessen any negative environmental impacts. In this study, we examined the short-term effect of pig slurry application techniques of spreading and injection on soil greenhouse gas and NH3 emissions under different irrigation amounts. We used the dynamic chamber method with in-situ gas analyzers. Our study showed that there were elevated emissions during the first week after slurry application; however, the difference between GHG emissions of spreading and injection treatments were not significant. Elevated GHG emissions (213–338% and 250–594% in the case of CO2 and N2O emissions, respectively) were observed under dry circumstances compared to irrigated treatments, as well as significantly higher NH3 emissions occurred for surface spreading under non-irrigated (dry) circumstances compared to other treatments. There were no statistically significant differences between the soil chemistry of different application techniques. However, pig slurry increased the available nitrogen forms (ammonium- and nitrate-nitrogen), which caused N2O and NH3 peaks regardless of treatment type. Leachate chemistry was more affected by irrigation strategies than application techniques. Our study highlights the importance of soil conditions at the time of application, rather than the application technique for fertilization using pig slurry.

1. Introduction

Greenhouse gas (GHG) and ammonia (NH3) emissions from the agricultural sector are an increasing concern for environmental issues, because of their contribution to climate change and acid deposition [1].
Carbon dioxide (CO2) has a great role in the biosphere with an increasing atmospheric concentration due to human activities; hence, it is the most researched GHG during recent decades [1]. Nitrous oxide (N2O) is part of the nitrogen cycle influenced by anthropogenic modifications in nutrient supply. Its concentration in the atmosphere has also increased since the industrial revolution. Besides its greenhouse effect, N2O contributes to stratospheric ozone depletion, thus, understanding the background processes is required [2,3] to develop reducing strategies. CO2 and N2O emissions of agriculture can originate from land-use changes, different tillage methods, or fertilization management. The main sources of NH3 from the agricultural sector are animal husbandry and volatilization after fertilization events [4]. Although its atmospheric concentration was not increased during the last century, NH3 has a role in air pollution and acid deposition. It contributes to eutrophication, soil and water acidification. Moreover, it has direct toxicity to plant surfaces and after deposition it can be a source of secondary N2O emission. Therefore, the development of reducing techniques is desirable [5,6].
There are several techniques used to examine soil-derived GHG and NH3 emissions, which are currently not standardized. One of the most commonly used methods for such investigations is the incubation chamber technique, e.g., using a static or dynamic chamber [7,8,9,10]. In these closed system chambers, gas concentrations change during a gas-specific incubation time and air samples can be collected with airtight syringes and quantified later using gas chromatography, or immediate analysis can be performed using in situ gas-specific or multigas analyzers [11,12,13]. Gas emission values can be calculated using linear or quadratic equations based on the initial and final GHG concentrations [14,15].
There are several techniques used to enrich soils with nutrients providing better plant growth and higher crop yields. Mineral (calcium ammonium nitrate, urea, etc.) and organic (pig slurry, cattle slurry, manure, etc.) fertilizers are applied all over the world depending on soil types and cultivated crops. With the increasing food demand and more intensive animal husbandry occurring worldwide, the increasing amounts of secondary products such as manure must be resolved. An apparent solution is to use animal manure as a fertilizer in crop production. Organic and mineral fertilizers have different C:N ratios that can affect soil GHG emissions [16]. The organic matter of different manures, compost, and slurry has a main role in CO2 and N2O emissions, since higher SOC might causes higher emissions [17]. Lower C:N ratios might result in higher NH3 emissions, while aeration is also an important factor for NH3 and N2O emissions [18].
Pig slurry is commonly used as an organic liquid fertilizer. The quantification of the proportion of different fertilizers in global nutrient supplies can be difficult, thus, often only estimates are available. For example, in Hungary, around 2.1–4.6% of the total nitrogen input comes from pig slurry [19]. Worldwide, pig manure is not the most common source of nitrogen; it contributes around 10% to total manure production, compared to cattle slurry which is around 44% [20]. Pig slurry enriches soils with nutrients (nitrogen and carbon supply) and promotes microbiological processes [21,22,23,24], consequently influencing CO2, N2O, and NH3 emissions [25,26]. The nitrogen content of pig slurry not only ensures balanced crop production and yields but also is a danger for nitrogen losses such as NH3 emissions and nitrate (NO3) leaching to the surface and groundwater reservoirs [27,28]. Nitrogen forms, such as ammonium (NH4+), nitrite (NO2), and nitrate (NO3) leached from soils are pollutants of the environment causing eutrophication of surface waters [29,30,31] and acidification of soils [32,33].
Pig slurry application techniques may result in changes in the chemical properties of soil and soil water and soil GHG and NH3 emissions [34,35,36], therefore, the appropriate choice of these techniques could be a form of CO2 emission and reactive nitrogen (N2O and NH3) loss mitigation policy. The most common techniques of pig slurry application are surface spray/spread, trailing shoes and trailing hose, incorporation, and row injection (shallow, deep, open slot, etc.) [34,37]. Some studies report higher GHG and NH3 emissions of soils under surface spray than injection techniques [36,37,38]. However, others found that utilizing slurry applications may result in mitigation of NH3 but can cause elevated GHG emissions [39], or injection can result in elevated N2O emissions rather than surface techniques [40]. Surface spray techniques of pig slurry can promote soil GHG and NH3 emissions due to higher evaporation rates and higher exposure to environmental conditions, while injections may cause elevated emissions, especially N2O because of their positive effect on the anaerobic soil environment and denitrification processes [41,42]. Environmental drivers such as air temperature (Ta) and precipitation are coupled with soil water content (SWC) and soil temperature (Ts) that alter CO2 emissions and reactive nitrogen loss of soils [43]. In most ecosystems, higher SWC and Ts are considered as facilitating factors of GHG and NH3 emissions, but decreases in NH3 emissions are also reported after heavy rainfalls, especially in the case of surface applications [39].
The proposed usage (especially field applications), the different pre-treatments (e.g., acidification, digestion), and storage methods (outdoor and deep-pit storage) of pig slurry can be considered as environmental hot-spots [44]. According to numerous pig slurry treatment scenarios, these factors have negative effects on global warming potential with great variability in the simulated results [44], and these techniques used by farmers can significantly affect GHG emissions [45]. Timing of slurry application regarding ideal weather conditions is a key question to minimize nitrogen losses. For example, in EU countries legislation requires the development of future emission limits, especially for NH3 emissions (Directive (EU) 2016/2284).
There are a number of publications on the effect of slurry application techniques on GHG and NH3 emissions but there are still uncertainties and unknown processes yet to be understood; thus, further laboratory and field studies are required. The objective of this experiment was to investigate the short-term effect of two different pig slurry applications of surface spreading and soil injection on (i) CO2 and N2O emissions; (ii) NH3 emissions; and (iii) soil chemical properties and nitrogen leaching of a sandy soil. To better understand the effect of the application techniques on soil GHG and NH3 emissions, we also used three irrigation strategies, one of which was the non-irrigated control during the experiment. We hypothesized that GHG and NH3 emissions can be minimized based on the pig slurry application technique.

2. Materials and Methods

2.1. Experimental Setup and Pig Slurry Application Techniques

We investigated two application techniques of pig slurry of (i) the surface spread (S) and (ii) row injection (I) for a 14-day-long period after fertilization. Because the highest NH3 emission occurs in the first week after application of pig slurry, we opted to measure the soil GHG and NH3 emissions frequently during the first two weeks of the experiment. With this experiment, our aim was to determine the short-term response of bare sandy soil to different fertilization techniques.
For pre-conditioning, packed soil columns were set up four days before the measurements started. We used 18 pieces of plastic columns with a height of 60 cm and a diameter of 20 cm. The bottoms of the columns were closed using airtight cups with a lockable water sampling orifice (d = 22 mm). The cups were filled with small-sized (d = 5–10 mm) gravel (2500 g in each cup) as a filter layer to prevent charge leakage. Under the gravel, dense woven mesh was placed to prevent the gravel from leaving the cup. The columns were filled with less than 2 mm grain-sized and homogenized sandy soil. To simulate original soil conditions, we applied sand with higher carbon and nitrogen content for the upper 25 cm and a leaner sandy soil below 25 cm of the columns. The soil chemical parameters of organic carbon content (SOC) and the main nitrogen forms of total nitrogen (Ntot), ammonium (NH4-N), and nitrate-nitrogen (NO3-N) of the two sand layers are provided in Table 1.
Basic soil physical parameters such as soil texture, bulk density, and porosity of undisturbed soils are provided in Table 2. These measurements are based on former investigations of the exact experimental location that the soil in this study was collected from [46].
We installed these assembled soil columns under a foil tent with open sidewalls preventing natural precipitation. A meteorological station was available under the foil tent, which provided us with air temperature data.
At the beginning of the experiment, we irrigated each column until gravitational water drainage occurred, then we sealed the sampling orifices. This soil moisture condition was considered to be close to the field capacity (~16.0–18.0%) for the used soil type. The following day we applied the pig slurry using the two application techniques (i.e., spreading (S) and injection (I)) to the columns. The same amount of pig slurry as in the spreading technique was injected at the depth of 10 cm below the soil column surface. Regarding the S treatment, we poured the slurry onto the soil column surface, and waited for the liquid to infiltrate. All column setups were prepared in three replicates. The slurry dose was 150 kgN ha−1 active ingredient uniformly, which was chosen as an average quantity allowed under field conditions on sandy soils. Dry matter, Ntot and total ammonium-nitrogen (NTAN) content, organic matter, raw ash content, and pH of the purchased slurry were 35.4 g kg−1, 3.5 g kg−1, 2.2 g kg−1, 26.2 g kg−1, 9.2 g kg−1, and 6.45, respectively. We took initial measurements of GHG and NH3 emissions one day before fertilization application (Day 0); right after the fertilization (Day 1); and daily measurements were performed during the first week, then three times during the second week. Daily measurements lasted for 6 h and 10 measurement days were initiated in total for the two-week-long investigation time.

2.2. Irrigation Strategies

To simulate different initial soil moisture conditions, we used three irrigation strategies on S and I slurry application techniques. We regularly irrigated with normal (N) and extreme (E) levels of tap water beside a non-irrigated treatment (D). The D strategy simulated a two-week-long dry period (0 mm water added), the N strategy of 500 mL tap water simulated a wet spring period (15.9 mm during 3 h on a day), which can be regularly the case in springs, and the E strategy of 1000 mL tap water represented heavy rainfall events (31.8 mm during 3 h on a day). We irrigated the columns on Days 2, 3, 5, 8, and 10 during the experiment. Table 3 summarizes the total of six treatments with the two slurry application techniques and three different irrigation strategies.

2.3. CO2, N2O, and NH3 Emission Measurements

We determined the CO2 emissions of the soil columns using the EGM-5 (PPSYSTEMS, Amesbury, MA, USA) infrared analyzer [47]. The gas incubation time was 2 min per measurement, where the CO2 emissions of soil columns were estimated using a linear equation. The measurement range of the device was 0–5000 ppm and the accuracy was <1% of the reference gas. Auto-calibrations to the 0 ppm base concentration were initiated between measurements randomly by the instrument.
We measured the N2O and NH3 emissions of each soil column with a PICARRO G2508 (PICARRO, Santa Clara, CA, USA) multigas analyzer [48] based on the dynamic chamber method [49]. The gas incubation time was set at 13 min and emissions were estimated using linear equations. The measurement range of the instrument was 0.300–200 ppm for N2O and 0–300 ppb for NH3; measurement accuracy was <25 ppb for N2O and <5 ppb for NH3 measurements.
We measured soil GHG and NH3 emissions 10 times in every column during the duration of the experiment.

2.4. Soil Chemical Property Measurements

Besides the determination of initial soil chemical properties of the arable field (representing 0–25 and 25–55 cm depths), we collected individual samples from each column at the end of the experiment. We chose sampling depths of 0–5, 15–20, 35–40, and 50–55 cm to investigate the soil carbon and nitrogen profile along soil depths. SOC, Ntot, NH4-N, and NO2+/NO3-N contents of soil samples were analyzed using wet chemical methods. Before analysis, samples were sieved below 2 mm. The amount of Ntot was determined using the modified Kjeldahl method (ISO 11261:1995) and the SOC was measured using wet digestion using the Tyurin method [50,51]. Briefly, during the measurement process, the total nitrogen content (Ntot) of the samples is converted first into (NH4)2SO4 and then into NH3. After steam distillation, the soil Ntot-content was determined using titration. The NH4-N and NO3-N contents were determined using steam distillation and titration using compound-specific chemicals. The Tyurin method is a wet combustion method. The SOC was oxidized using potassium dichromate solution with sulphuric acid. After oxidation, excess dichromate was calculated using titration with Mohr’s salt solution.

2.5. Nitrogen Leaching Measurements

We collected leachates via water sampling orifices on Days 3, 5, 7, and 9 concurrently with irrigation events to investigate nitrogen leaching of the irrigated treatments. All water samples were immediately frozen, then analyzed for NH4+, NO2, and NO3 content using a UV-1800 UV/Visible scanning spectrophotometer (Shimadzu, Japan) based on standardized methods (ISO 7150-1, ISO 13395:1996). We used standard solutions for calibrations of each determinant. In the case of NH4+, NO3, and NO2 measurements, the spectrophotometer was set to 655, 410, and 540 nm, respectively.

2.6. Statistical Analysis

We used GraphPad Prism for Windows, version 9.0.2 (161) February 2021, (GraphPad Software, San Diego, CA, USA) to perform the statistical analyses. We used raw data to build GHG and NH3 emission datasets and the negative emission values were filtered. We determined dataset distributions using the D’Agostino and Pearsons test. According to the dataset distributions we utilized the Kruskall–Wallis method with Dunn’s multiple comparisons to compare gas emission or leachate data. Analysis of GHG and NH3 emission dependency on air temperature were investigated using Pearson’s or Spearman’s correlation depending on the normality of the data distribution.

3. Results

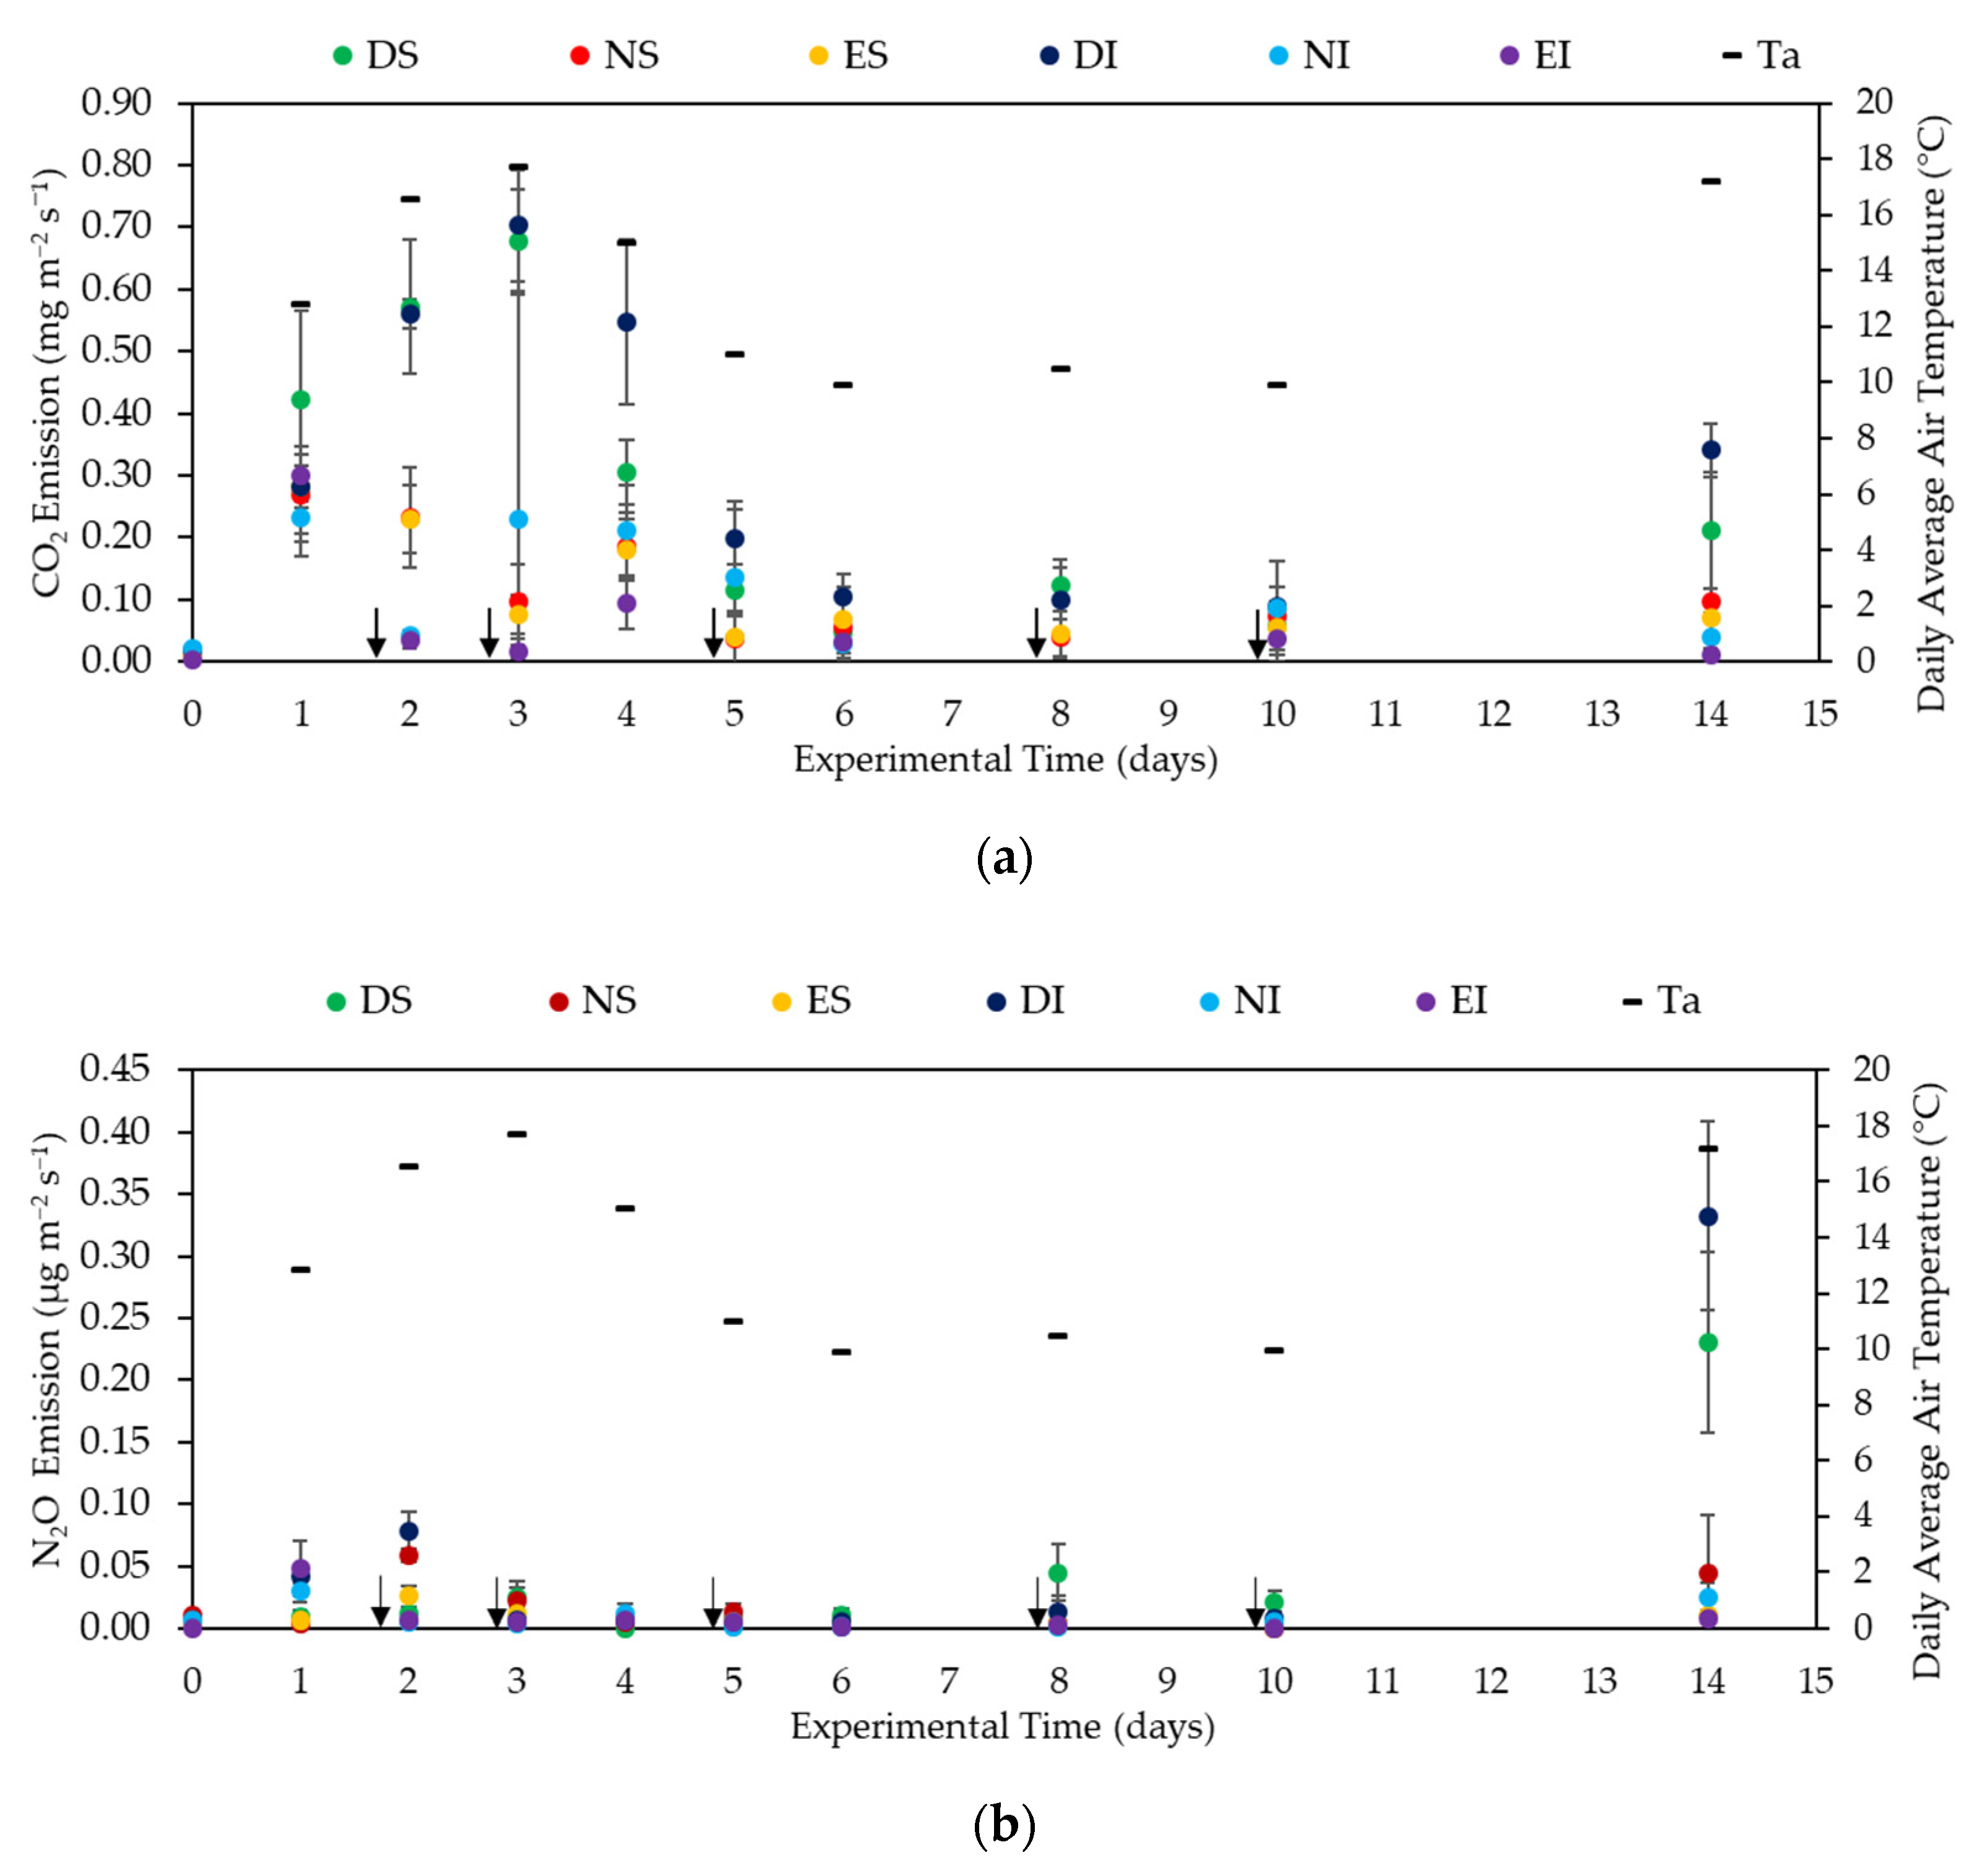
3.1. GHG and NH3 Emissions of Soils

CO2 emissions of soils increased right after fertilization on Day 1 and peaked on Day 3 in the case of DS and DI. There was a second CO2 emission peak for these treatments on Day 14. CO2 emission of soils showed a permanent decrease after Day 1 for all irrigated treatments (Figure 1a).
The N2O emissions of soils also increased after fertilization (Day 1) and peaked on Day 2 in the cases of NS, ES, and DI. A second N2O peak occurred in NS, DS, NI, and DI on Day 14 (Figure 1b).
The NH3 emissions of soils increased right after fertilization until Day 3 for NI, DS, DI, and till Day 4 in the case of NS. A permanent decrease in soil NH3 emissions occurred in ES and EI after Day 1 (Figure 1c).
The type of pig slurry application technique did not affect soil CO2 emissions under N, E, and D (p > 0.05) irrigation strategies. Although there were differences between non-irrigated and irrigated soils in the case of the I treatments, tendencies were not clear. The CO2 emissions of soils were significantly higher in DI compared to NI (p < 0.01) and EI (p < 0.001), but NI and EI did not differ (p > 0.05). The irrigation showed no effect on the CO2 emissions of any S treatments (p > 0.05) (Table 4).
There were no significant differences in soil N2O emissions of the two application techniques under N (p > 0.05), E (p > 0.05), and D (p > 0.05) irrigation strategies, although the emissions were almost two times higher in NS than in NI. In the case of S treatments, soils of DS had significantly higher N2O emissions (p < 0.05) than ES. According to statistical analysis, I treatment irrigations did not affect the N2O emissions of soils (p > 0.05), although the mean emissions were considerably higher for DI than for the other treatments (Table 4).
The pig slurry application technique affected the NH3 emissions of soils in the case of the D irrigation strategy only. Soils of DS had significantly higher NH3 emissions than DI (p < 0.001), however, there were no differences between the two techniques under N (p > 0.05) and E (p > 0.05) irrigations. The irrigation had no effect on NH3 emissions of soils in the case of the I application (p > 0.05), but it promoted changes in soils with the S technique. Soils of DS had significantly higher NH3 emissions than NS (p < 0.01) or ES (p < 0.001); still, there was no difference between NS and ES (p > 0.05) (Table 4).

3.2. Environmental Drivers of Soil GHG and NH3 Emissions

According to the literature, Ta correlated well with Ts [52] and both of these parameters are drivers of GHG and NH3 emissions. We consider Ta as a representation of a basic environmental driver of soil-derived emissions. All measured gases depended on this factor in some treatments. There were significant correlations between CO2 emissions of soils and Ta in DS (p < 0.01) and DI (p < 0.001) treatments, while no significant correlations were observed in the other cases. Soil N2O emissions significantly depended on Ta in NS (p = 0.01) and ES (p = 0.001) treatments only. The NH3 emission dependency of soils on Ta showed similarities with CO2 findings, as emissions in NS, DS, and DI were significantly driven by Ta (p < 0.05, p < 0.05, and p < 0.05, respectively) (Table 5).

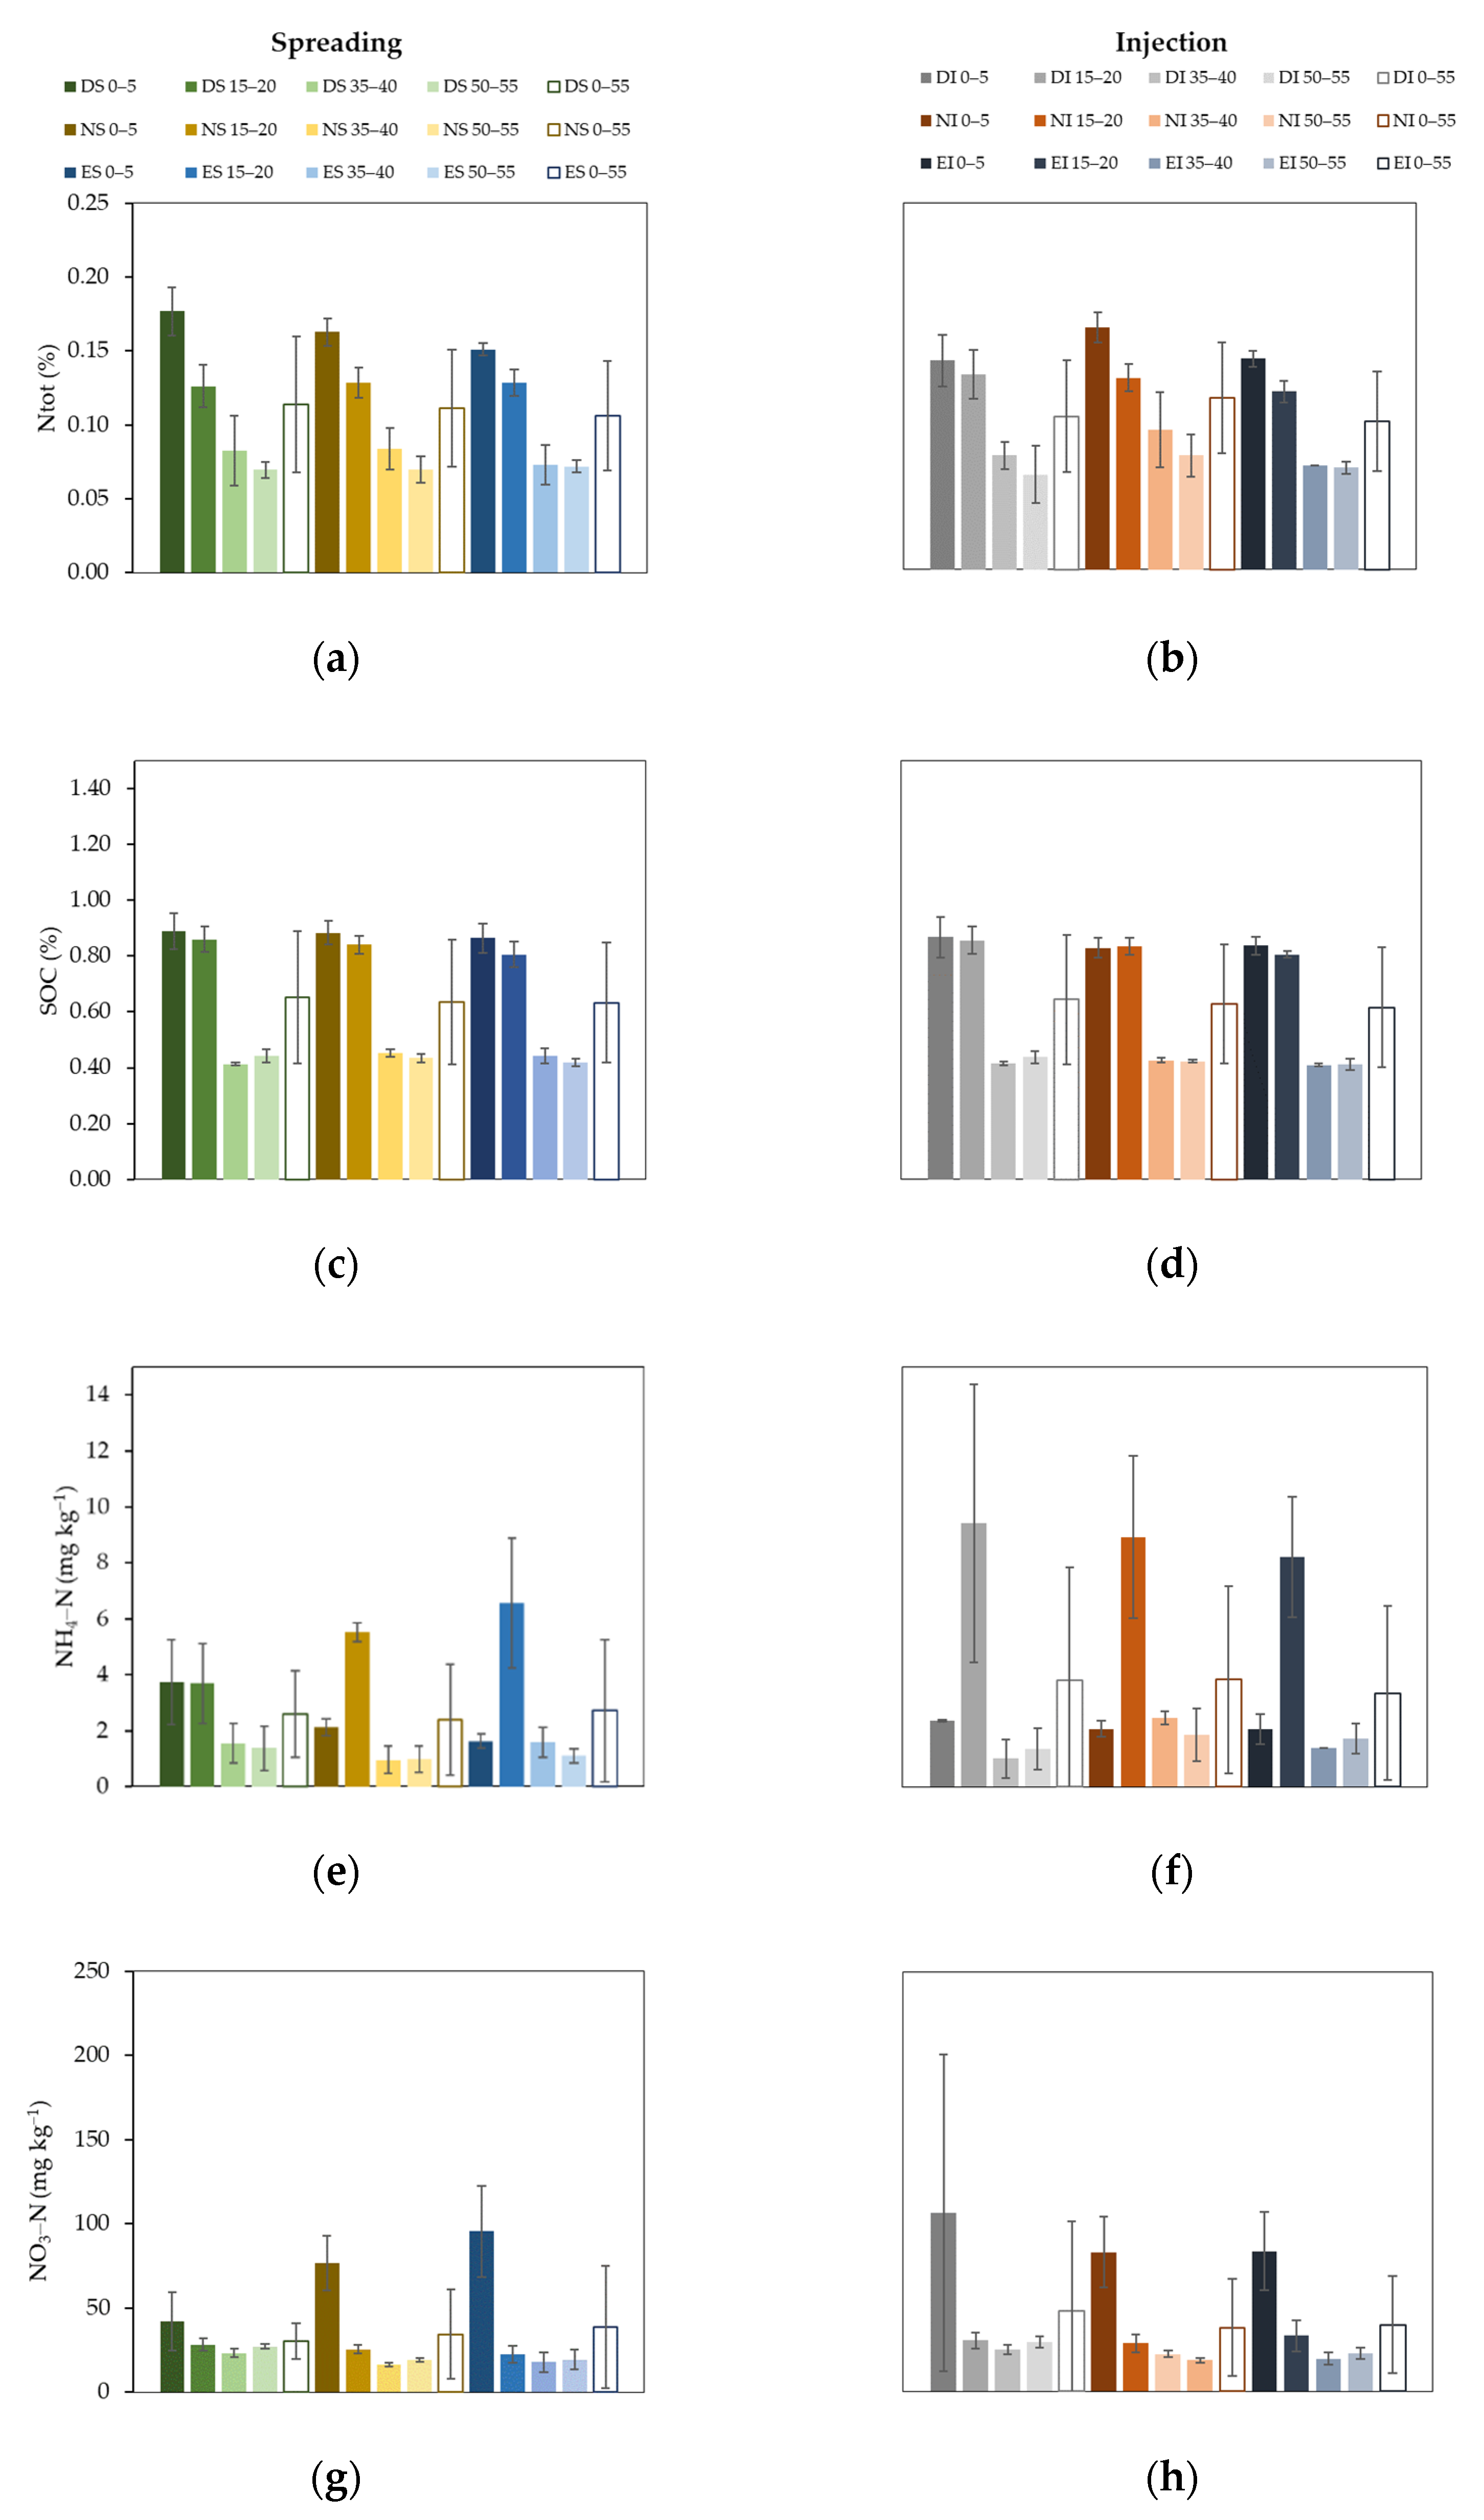
3.3. Soil Chemical Properties

The soil chemical properties of the soil columns under different treatments were similar at the end of the experiment. There were no significant differences between the treatments’ SOC (p > 0.05), Ntot (p > 0.05), NH4-N (p > 0.05), and NO3-N contents (p > 0.05).
Regarding the soil chemical properties of the four different depths of each experimental column, vertical heterogeneity was observed. Mean SOC and Ntot contents showed similarities with the initial conditions (Table 1) for all six treatments. SOC contents of soils were higher in the upper two layers (0–5 and 15–20 cm) than in the lower ones (35–40 and 50–55 cm), and the values collected at the end of the experiment were comparable with the initial conditions. The highest Ntot contents were found in the surface layer (0–5 cm) and decreased with depth. The different slurry application techniques did not change the values of SOC or nitrogen contents. The NH4-N content was the highest in the second (15–20 cm) layer of the soil columns, and the NO3-N was the highest in the surface (0–5 cm) layer with elevated values compared to the initial conditions (Figure 2).

3.4. Nitrogen Leaching from Soils

Soil water leachate was collected and analyzed after each irrigation event. The pig slurry application technique influenced the NH4+ content of the leachate under the N irrigation strategy only. NH4+ concentrations of water samples were significantly higher in NS than NI (p < 0.05), however, the difference was not significant between ES and EI (p > 0.05). The irrigation strategy also affected the NO3 leaching in the case of the S technique, as leachate from NS had a significantly higher (p < 0.01) NO3 content than ES. There were no significant differences between the NO3 content of NI and EI, although NI had a somewhat higher NO3 content. The pig slurry application technique did not affect the mean NO3 content of the water samples under N (p > 0.05) or E (p > 0.05) irrigation strategies (Table 6).
The pig slurry application technique did not affect the mean NO2 concentration of leachate under N (p > 0.05) or E (p > 0.05) irrigation strategies. A significant difference between NO2 contents of leachate samples was observed only in the case of NI and EI (p < 0.001; Table 6).

4. Discussion

4.1. GHG and NH3 Soil Emission Trends

After the pig slurry application, elevated CO2, N2O, and NH3 emissions were observed, especially during the first few days of the experiment. Rochette et al. [25] found that 50% of the total investigated CO2 emission occurred in the first two weeks and 70% in the first 40 days after the manure application, which was longer lasting than in the case of the NH3 emissions. Clemens et al. [53] also found peaks of soil N2O emissions right after the slurry application, although it had a more permanent effect on the emissions, as they did not decrease even after 20 days. In our study, there was a second peak after a permanent decrease in CO2 and N2O emissions coinciding with other studies [54], that can be a sign of unfinished microbial processes/dynamics of denitrification [55]. The increase in air temperature may be causing elevated emissions, as temperature is one of the main drivers of CO2 but also can be a determinant of N2O emissions [43,56,57]. Higher storage temperatures can promote NH3 and N2O emissions. The differences in the underlying microbial processes of the emissions (such as nitrifier denitrification or incomplete denitrification) depending on the actual temperature can be investigated further [58]. Soil NH3 emissions are particularly affected by Ts, while N2O is more dependent on SWC, Ts, and NH4-N content [59]. Thus, applying pig slurry under colder weather conditions, and the immediate incorporation into the soil, can further reduce NH3 emissions [60,61].
Similar to our results, other researchers found that after slurry spreading soil NH3 emissions peaked after the application, in some cases during the first 24 h, then the emissions decreased permanently [62,63].

4.2. Pig Slurry Application Techniques

During our experiment, the application techniques did not affect significantly soil CO2 and N2O emissions in the short-term. Observations on this topic in the current literature are not straightforward as few studies report a reducing effect of injection on soil GHG emissions [64,65], while several others found contrary results [66,67,68,69,70], and some concluded no difference [53,64] between spreading or injecting pig slurry to the soils. The spreading application technique may enhance N2O emissions due to elevated evaporation, while injection techniques promote an anoxic soil environment, which is a key factor of denitrification processes that are responsible for soil N2O emissions. Injection may reduce NH3 emissions and promote N2O emissions compared to the soil surface spreading, due to promoting less aerobic conditions and denitrification [54]. In treatments with no irrigation performed (D), we found a similar pattern, as DI reduced NH3 and increased N2O emissions.
The reduction in NH3 emissions due to injecting pig slurry into the soil can be also dependent on slurry dry matter and NH4-N content [71]. The incorporation of pig slurry into the soil after the surface technique might have an additional inhibitory effect on NH3 production [72].

4.3. Effect of Irrigation on Soil GHG and NH3 Emissions

It is generally accepted that GHG emissions of soils depend on environmental drivers such as SWC, Ts, and Ta [73,74,75]. In the case of CO2, there is an optimum SWC when elevated emissions can occur [76], and high SWC conditions promote N2O emissions [77]. During our experiment, there was a tendency that non-irrigated treatments with lower SWC had the highest GHG emissions compared to irrigated ones. Other researchers concluded contrary results, that intensive rainfalls caused elevated CO2 and N2O peaks [78,79,80], however, too high SWC could also inhibit CO2 emissions [80]. In our study, non-irrigated treatments might have been close to the optimum SWC condition promoting CO2 emissions. The lower N2O emissions of irrigated treatments compared to non-irrigated ones can be the result of nutrient leaching of topsoil or the effect of the drying and rewetting cycle. The soil environment of irrigated treatments could have promoted N2 emission rather than N2O [81]. Other studies also concluded that irrigation and elevated SWC enhance N2O emissions in general, although a too high frequency of irrigation can prevent higher N2O emissions, due to processes causing reduction of N2O to N2 and the disturbing effect of drying–rewetting cycles compared to lower frequency irrigations [82,83]. In our experiment, these irrigation effects could be detected only between irrigated and D strategies but there was no difference between E and N strategies as the frequency of irrigation was the same in these treatments, and only the amount of water added was different. The similarity in GHG emissions of E and N irrigation strategies can be explained by the type of the applied soil. Sandy soils are quite permeable and they cannot hold water well, thus, they are less likely to have high SWC permanently promoting N2O emissions, especially close to the soil surface.
In our study, the S technique initiated elevated NH3 emissions compared to I, similar to several other results [67,68,72]. Dry treatment of the spreading (DS) application technique caused elevated NH3 emissions in the present study, while normal and extreme strategies resulted in lower soil emissions, especially in the case of I application. Sanz-Cobena et al. [39] found that heavy rainfalls may strongly influence the abating effect of the injecting technique on NH3 emissions, compared to spreading, due to nitrogen leaching. However, irrigation strategies eliminated the effect of different application techniques on the measured emissions, which highlights that the actual weather condition is an essential factor for the emissions when the slurry application is being performed.
The rainfall pattern (or irrigation frequency) might influence soil emissions, such as interference with soil environmental characteristics (soil evaporation, temperature, or microbiology). This might be an explanation for the outstanding NH3 emissions in non-irrigated (e.g., DS) compared to the irrigated treatments. Some studies reported similar conclusions [39], although Sänger et al. [84] found that the rainfall pattern does not influence GHG emissions on average. According to Gu et al. [85], soil type is also an influencing factor besides rainfall pattern. In the case of clay loam soil, the high precipitation scenario resulted in elevated NH3 and N2O emissions compared to lower precipitation amounts. In turn, reduced emissions were occurring under high precipitation on sandy soil [85], which is consistent with the findings of our experiment.

4.4. Soil Chemical Property Changes at Different Depths

Vertical heterogeneity in the soil chemical properties of the columns was examined. However, we found that the initial soil chemical parameters of the two soil layers was one of the major determinants of the soil chemical distribution pattern rather than the slurry application technique. The similarity of initial and final soil chemical properties could be caused by great NH3 and N2O emissions in D treatments and nitrogen leaching in irrigated treatments. The NO3-N content of the soil columns was the highest at the surface, which may promote denitrification processes in the upper layers [86], due to available nutrient sources, explaining N2O emissions in the non-irrigated (D) treatments [70]. The slightly higher NO3-N content of DI could cause higher N2O emissions compared to other treatments, but elevated emissions for DS were not the result of soil chemical properties. The elevated NH3 emissions of DS compared to DI or other treatments could not be explained by soil chemical parameters. We consider that in this case the evaporation of the nutrient-rich surface was the main cause.
The leachate chemistry was also influenced by the simulated precipitation conditions. the NH4+ content of leachates was influenced by the slurry application technique in some cases, while the NO3 content of leachates was influenced by irrigation strategies. Daudén et al. [87] found that an increase in irrigation reduced the NO3 content of the leachate, which is similar to our findings. However, other researchers noted that higher water applications can result in elevated NO3 leaching [88,89]. Surprisingly, the NO3 content of the leachate was higher in the N than in the E irrigation treatment, although it must be noted that the variability of data within a given treatment was high.

4.5. Proposed Techniques to Mitigate NH3 and GHG Emissions

Based on the current literature, there are conflicting results on emission mitigation methods depending on applied techniques, weather, soil conditions, etc. Dry matter content of the applied slurry, the application techniques, and weather conditions are the main factors of NH3 losses from soils [90]. Anaerobic digestion of organic fertilizers may result in a decrease in GHG emissions, but an increase in NH3 emissions. The separation of the solid–liquid phase can reduce the NH3 promoting effect, concurrent with the reduction in GHG emissions [90,91]. The acidification and composting of pig manure prior to application might also reduce NH3 and GHG emissions [92]. According to a recent meta-analysis, acidification alone can reduce both NH3 and GHG emissions, while other techniques (different applications, separation, storage type, etc.) can negatively affect some of the GHGs [70].

5. Conclusions

The effects of pig slurry application on soil GHG and NH3 emissions was established under different slurry application techniques and irrigation strategies in sandy soils. The pig slurry injection was proven to be more adequate compared to spreading in regard to NH3 emissions from the investigated sandy soil under dryer soil conditions. However, under the irrigated conditions the differences were no longer significant. The pig slurry application techniques did not affect the GHG emissions of the experimental sandy soil in the short-term during our experiment.
The slurry application caused elevated NH4-N and NO3-N contents in the soils, and an increase in NO3 leaching was observed under lower than extreme irrigation conditions. Nitrogen leaching of soils was more dependent on precipitation amounts in the spreading application technique compared to the injection.
In our soil column experiment, we tried to simulate field conditions and we found that the pig slurry injection may be preferable under dry conditions regarding NH3 emissions. However, we also found that under irrigation or higher precipitation occasions the time of slurry application should not be limited in terms of CO2 and N2O emissions.
This study was a microcosm type of investigation simulating field conditions with three replicates under a controlled environment. Therefore, this setup is a good way to better understand the field processes; however, field conditions can be more heterogenic and further studies with higher number of replications should be implemented to draw more conclusive deductions. Overall, our study showed that a controlled column experiment can be a great tool to be used prior to slurry applications. Although the current study involved sandy soil only, this type of experiment enables us to further study different soil environmental parameters, such as different soil types more relevant to a specific location.

Author Contributions

Conceptualization, E.T., Z.B. and Á.H.; methodology, E.T., Z.B. and M.D.; formal analysis, M.D.; investigation, E.T., Z.B. and M.D.; writing—original draft preparation, E.T. and M.D.; writing—review and editing, B.P., Z.B. and Á.H.; visualization, M.D.; supervision, Z.B.; project administration, E.T.; funding acquisition, E.T. All authors have read and agreed to the published version of the manuscript.

Funding

This research was funded by the Ministry of Agriculture, Kossuth Lajos sq. 11, 1055 Budapest, Hungary. Tasks related to the definition of agri-environmental indicators for the pig sector MgF/27-1/201. The research presented in the article was carried out within the framework of the Széchenyi Plan Plus program with the support of the RRF 2.3.1 21 2022 00008 project. This material is based upon work supported by the Hungarian National Research Fund (OTKA/NKFI) project OTKA FK-131792. The APC was funded by Á.H. and Z.B.

Institutional Review Board Statement

Not applicable.

Informed Consent Statement

Not applicable.

Data Availability Statement

Not applicable.

Acknowledgments

We would like to thank Szandra Baklanov and Emese Ujj for their support with experiment implementation and measurements. We would like to thank András Makó and Gyöngyi Barna for providing background soil physical properties of the experimental site.

Conflicts of Interest

The authors declare no conflict of interest. The funders had no role in the design of the study; in the collection, analyses, or interpretation of data; in the writing of the manuscript; or in the decision to publish the results.

References

  1. Ciais, P.; Sabine, C.; Bala, G.; Bopp, L.; Brovkin, V.; Canadell, J.; Chhabra, A.; DeFries, R.; Galloway, J.; Heimann, M.; et al. Carbon and Other Biogeochemical Cycles. In Climate Change 2013: The Physical Science Basis; Cambridge University Press: Cambridge, UK, 2013; pp. 465–570. [Google Scholar]
  2. Portmann, R.W.; Daniel, J.S.; Ravishankara, A.R. Stratospheric ozone depletion due to nitrous oxide: Influences of other gases. Philos. Trans. R. Soc. London Ser. B Biol. Sci. 2012, 367, 1256–1264. [Google Scholar] [CrossRef] [PubMed]
  3. Galloway, J.N.; Dentener, F.J.; Capone, D.G.; Boyer, E.W.; Howarth, R.W.; Seitzinger, S.P.; Asner, G.P.; Cleveland, C.C.; Green, P.A.; Holland, E.A.; et al. Nitrogen Cycles: Past, Present, and Future. Biogeochemistry 2004, 70, 153–226. [Google Scholar] [CrossRef]
  4. Buijsman, E.; Maas, H.F.M.; Asman, W.A.H. Anthropogenic NH3 emissions in europe. Atmos. Environ. 1987, 21, 1009–1022. [Google Scholar] [CrossRef]
  5. Guthrie, S.; Giles, S.; Dunkerley, F.; Tabaqchali, H.; Harshfield, A.; Ioppolo, B.; Manville, C. Impact of Ammonia Emissions from Agriculture on Biodiversity: An Evidence Synthesis; RAND Corporation: Santa Monica, CA, USA, 2018. [Google Scholar] [CrossRef]
  6. Martikainen Pertti, J. Nitrous Oxide Emission Associated with Autotrophic Ammonium Oxidation in Acid Coniferous Forest Soil. Appl. Environ. Microbiol. 1985, 50, 1519–1525. [Google Scholar] [CrossRef]
  7. Pumpanen, J.; Kolari, P.; Ilvesniemi, H.; Minkkinen, K.; Vesala, T.; Niinistö, S.; Lohila, A.; Larmola, T.; Morero, M.; Pihlatie, M.; et al. Comparison of different chamber techniques for measuring soil CO2 efflux. Agric. For. Meteorol. 2004, 123, 159–176. [Google Scholar] [CrossRef]
  8. Hensen, A.; Skiba, U.; Famulari, D. Low cost and state of the art methods to measure nitrous oxide emissions. Environ. Res. Lett. 2013, 8, 025022. [Google Scholar] [CrossRef]
  9. Scotto di Perta, E.; Fiorentino, N.; Carozzi, M.; Cervelli, E.; Pindozzi, S. A Review of Chamber and Micrometeorological Methods to Quantify NH3 Emissions from Fertilisers Field Application. Int. J. Agron. 2020, 2020, 8909784. [Google Scholar] [CrossRef]
  10. Heinemeyer, A.; McNamara, N.P. Comparing the closed static versus the closed dynamic chamber flux methodology: Implications for soil respiration studies. Plant Soil 2011, 346, 145–151. [Google Scholar] [CrossRef]
  11. Harmon, T.C.; Dierick, D.; Trahan, N.; Allen, M.F.; Rundel, P.W.; Oberbauer, S.F.; Schwendenmann, L.; Zelikova, T.J. Low-cost soil CO2 efflux and point concentration sensing systems for terrestrial ecology applications. Methods Ecol. Evol. 2015, 6, 1358–1362. [Google Scholar] [CrossRef]
  12. Diefenderfer, H.L.; Cullinan, V.I.; Borde, A.B.; Gunn, C.M.; Thom, R.M. High-frequency greenhouse gas flux measurement system detects winter storm surge effects on salt marsh. Glob. Chang. Biol. 2018, 24, 5961–5971. [Google Scholar] [CrossRef]
  13. Pedersen, J.M.; Feilberg, A.; Kamp, J.N.; Hafner, S.; Nyord, T. Ammonia emission measurement with an online wind tunnel system for evaluation of manure application techniques. Atmos. Environ. 2020, 230, 117562. [Google Scholar] [CrossRef]
  14. Jassal, R.S.; Black, T.A.; Nesic, Z.; Gaumont-Guay, D. Using automated non-steady-state chamber systems for making continuous long-term measurements of soil CO2 efflux in forest ecosystems. Agric. For. Meteorol. 2012, 161, 57–65. [Google Scholar] [CrossRef]
  15. Kroon, P.S.; Hensen, A.; van den Bulk, W.C.M.; Jongejan, P.A.C.; Vermeulen, A.T. The importance of reducing the systematic error due to non-linearity in N2O flux measurements by static chambers. Nutr. Cycl. Agroecosyst. 2008, 82, 175–186. [Google Scholar] [CrossRef]
  16. Meijide, A.; Díez, J.A.; Sánchez-Martín, L.; López-Fernández, S.; Vallejo, A. Nitrogen oxide emissions from an irrigated maize crop amended with treated pig slurries and composts in a Mediterranean climate. Agric. Ecosyst. Environ. 2007, 121, 383–394. [Google Scholar] [CrossRef]
  17. Verdi, L.; Mancini, M.; Ljubojevic, M.; Orlandini, S.; Marta, A. Greenhouse gas and ammonia emissions from soil: The effect of organic matter and fertilisation method. Ital. J. Agron. 2018, 11, 260–266. [Google Scholar] [CrossRef]
  18. Jiang, T.; Schuchardt, F.; Li, G.; Guo, R.; Zhao, Y. Effect of C/N ratio, aeration rate and moisture content on ammonia and greenhouse gas emission during the composting. J. Environ. Sci. 2011, 23, 1754–1760. [Google Scholar] [CrossRef]
  19. Aujeszky Pál, Á.K.; Bárdos Csilla, D.-B.N.; Fekete-Fábián Zsófia, F.L.; Halmi Erzsébet, P.Á.; Polgár Ágnes, S.Z.; Temesvári Tímea, V.N.; Zách, D. Környezeti helyzetkép, 2018; KSH-Hungarian Central Statistical Office: Budapest, Hungary, 2019; pp. 51–57.
  20. Zhang, B.; Tian, H.; Lu, C.; Dangal, S.R.S.; Yang, J.; Pan, S. Global manure nitrogen production and application in cropland during 1860–2014: A 5 arcmin gridded global dataset for Earth system modeling. Earth Syst. Sci. Data 2017, 9, 667–678. [Google Scholar] [CrossRef]
  21. Lourenzi, C.R.; Ceretta, C.A.; da Silva, L.S.; Trentin, G.; Girotto, E.; Lorensini, F.; Tiecher, T.L.; Brunetto, G. Soil Chemical Properties Related to Acidity Under Successive Pig Slurry Applications. Rev. Bras. Ciência Do Solo 2011, 35, 1827–1836. [Google Scholar] [CrossRef]
  22. Plaza, C.; Senesi, N.; García-Gil, J.C.; Brunetti, G.; D’Orazio, V.; Polo, A. Effects of Pig Slurry Application on Soils and Soil Humic Acids. J. Agric. Food Chem. 2002, 50, 4867–4874. [Google Scholar] [CrossRef]
  23. Chikuvire, T.J.; Muchaonyerwa, P.; Zengeni, R. Long-term effects of pig slurry application on selected soil quality parameters and tissue composition of maize in a subhumid subtropical environment. S. Afr. J. Plant Soil 2019, 36, 143–148. [Google Scholar] [CrossRef]
  24. Navroski, D.; Filho, A.C.; Barbosa, G.M.C.; Moreira, A. Soil attributes and microbial diversity on 28 years of continuous and interrupted for 12 months of pig slurry application. Chil. J. Agric. Res. 2021, 81, 27–38. [Google Scholar] [CrossRef]
  25. Rochette, P.; Angers, D.A.; Côté, D. Soil Carbon and Nitrogen Dynamics Following Application of Pig Slurry for the 19th Consecutive Year I. Carbon Dioxide Fluxes and Microbial Biomass Carbon. Soil Sci. Soc. Am. J. 2000, 64, 1389–1395. [Google Scholar] [CrossRef]
  26. Zhang, T.; Liu, H.; Luo, J.; Wang, H.; Zhai, L.; Geng, Y.; Zhang, Y.; Li, J.; Lei, Q.; Bashir, M.A.; et al. Long-term manure application increased greenhouse gas emissions but had no effect on ammonia volatilization in a Northern China upland field. Sci. Total Environ. 2018, 633, 230–239. [Google Scholar] [CrossRef] [PubMed]
  27. Cavanagh, A.; Gasser, M.O.; Labrecque, M. Pig slurry as fertilizer on willow plantation. Biomass Bioenergy 2011, 35, 4165–4173. [Google Scholar] [CrossRef]
  28. Mantovi, P.; Fumagalli, L.; Beretta, G.P.; Guermandi, M. Nitrate leaching through the unsaturated zone following pig slurry applications. J. Hydrol. 2006, 316, 195–212. [Google Scholar] [CrossRef]
  29. Camargo, J.A.; Alonso, Á. Ecological and toxicological effects of inorganic nitrogen pollution in aquatic ecosystems: A global assessment. Environ. Int. 2006, 32, 831–849. [Google Scholar] [CrossRef]
  30. Glibert, P.M. Eutrophication, harmful algae and biodiversity—Challenging paradigms in a world of complex nutrient changes. Mar. Pollut. Bull. 2017, 124, 591–606. [Google Scholar] [CrossRef]
  31. Wang, F.L.; Alva, A.K. Leaching of Nitrogen from Slow-Release Urea Sources in Sandy Soils. Soil Sci. Soc. Am. J. 1996, 60, 1454–1458. [Google Scholar] [CrossRef]
  32. Cervantes, F.J. Anthropogenic sources of N-pollutants and their impact on the environment and on public health. In Environmental Technologies to Treat Nitrogen Pollution; Fabio, B., Ed.; IWA Publishing: London, UK, 2009. [Google Scholar]
  33. Tian, D.; Niu, S. A global analysis of soil acidification caused by nitrogen addition. Environ. Res. Lett. 2015, 10, 024019. [Google Scholar] [CrossRef]
  34. Dennehy, C.; Lawlor, P.G.; Jiang, Y.; Gardiner, G.E.; Xie, S.; Nghiem, L.D.; Zhan, X. Greenhouse gas emissions from different pig manure management techniques: A critical analysis. Front. Environ. Sci. Eng. 2017, 11, 11. [Google Scholar] [CrossRef]
  35. Ferm, M.; Kasimir-Klemedtsson, Å.; Weslien, P.; Klemedtsson, L. Emission of NH3 and N2O after spreading of pig slurry by broadcasting or band spreading. Soil Use Manag. 1999, 15, 27–33. [Google Scholar] [CrossRef]
  36. Carozzi, M.; Ferrara, R.M.; Rana, G.; Acutis, M. Evaluation of mitigation strategies to reduce ammonia losses from slurry fertilisation on arable lands. Sci. Total Environ. 2013, 449, 126–133. [Google Scholar] [CrossRef] [PubMed]
  37. Misselbrook, T.; Smith, K.; Johnson, R.A.; Pain, B. Slurry application techniques to reduce ammonia emissions: Results of some UK field-scale experiments. Biosyst. Eng. 2002, 81, 313–321. [Google Scholar] [CrossRef]
  38. Severin, M.; Fuß, R.; Well, R.; Garlipp, F.; Van den Weghe, H. Soil, slurry and application effects on greenhouse gas emissions. Plant Soil Environ. 2016, 61, 344–351. [Google Scholar] [CrossRef]
  39. Sanz-Cobena, A.; Misselbrook, T.H.; Hernáiz, P.; Vallejo, A. Impact of rainfall to the effectiveness of pig slurry shallow injection method for NH3 mitigation in a Mediterranean soil. Atmos. Environ. 2019, 216, 116913. [Google Scholar] [CrossRef]
  40. Flessa, H.; Beese, F. Laboratory Estimates of Trace Gas Emissions following Surface Application and Injection of Cattle Slurry. J. Environ. Qual. 2000, 29, 262–268. [Google Scholar] [CrossRef]
  41. Comfort, S.D.; Kelling, K.A.; Keeney, D.R.; Converse, J.C. Nitrous Oxide Production from Injected Liquid Dairy Manure. Soil Sci. Soc. Am. J. 1990, 54, 421–427. [Google Scholar] [CrossRef]
  42. Lovanh, N.; Warren, J.; Sistani, K. Determination of ammonia and greenhouse gas emissions from land application of swine slurry: A comparison of three application methods. Bioresour. Technol. 2010, 101, 1662–1667. [Google Scholar] [CrossRef]
  43. Dencső, M.; Horel, Á.; Bogunovic, I.; Tóth, E. Effects of Environmental Drivers and Agricultural Management on Soil CO2 and N2O Emissions. Agronomy 2021, 11, 54. [Google Scholar] [CrossRef]
  44. Yuan, Z.; Pan, X.; Chen, T.; Liu, X.; Zhang, Y.; Jiang, S.; Sheng, H.; Zhang, L. Evaluating environmental impacts of pig slurry treatment technologies with a life-cycle perspective. J. Clean. Prod. 2018, 188, 840–850. [Google Scholar] [CrossRef]
  45. Rigolot, C.; Espagnol, S.; Robin, P.; Hassouna, M.; Béline, F.; Paillat, J.M.; Dourmad, J.Y. Modelling of manure production by pigs and NH3, N2O and CH4 emissions. Part II: Effect of animal housing, manure storage and treatment practices. Animal 2010, 4, 1413–1424. [Google Scholar] [CrossRef] [PubMed]
  46. Makó, A.; Ryżak, M.; Barna, G.; Polakowski, C.; Rajkai, K.; Bakacsi, Z.; Hernádi, H.; Beczek, M.; Sochan, A.; Mazur, R.; et al. Experiences of soil physical measurements with laser diffractometer and their application possibilities in soil water management research. Sci. Et Secur. 2022, 2, 476–490. [Google Scholar] [CrossRef]
  47. Kandel, T.P.; Gowda, P.H.; Northup, B.K. Influence of Tillage Systems, and Forms and Rates of Nitrogen Fertilizers on CO2 and N2O Fluxes from Winter Wheat Cultivation in Oklahoma. Agronomy 2020, 10, 320. [Google Scholar] [CrossRef]
  48. Christiansen, J.R.; Outhwaite, J.; Smukler, S.M. Comparison of CO2, CH4 and N2O soil-atmosphere exchange measured in static chambers with cavity ring-down spectroscopy and gas chromatography. Agric. For. Meteorol. 2015, 211–212, 48–57. [Google Scholar] [CrossRef]
  49. Pavelka, M.; Acosta, M.; Kiese, R.; Altimir, N.; Brümmer, C.; Crill, P.; Darenova, E.; Fuß, R.; Gielen, B.; Graf, A.; et al. Standardisation of chamber technique for CO2, N2O and CH4 fluxes measurements from terrestrial ecosystems. Int. Agrophys. 2018, 32, 569–587. [Google Scholar] [CrossRef]
  50. Akhtar, M.; Hussain, F.; Qureshi, T.M.; Ashraf, M.Y.; Akhter, J.; Haq, A. Rapid and Inexpensive Steam Distillation Method for Routine Analysis of Inorganic Nitrogen in Alkaline Calcareous Soils. Commun. Soil Sci. Plant Anal. 2011, 42, 920–931. [Google Scholar] [CrossRef]
  51. Jankauskas, B.; Jankauskiene, G.; Slepetiene, A.; Fullen, M.A.; Booth, C.A. International Comparison of Analytical Methods of Determining the Soil Organic Matter Content of Lithuanian Eutric Albeluvisols. Commun. Soil Sci. Plant Anal. 2006, 37, 707–720. [Google Scholar] [CrossRef]
  52. Zheng, D.; Hunt, E.; Running, S. A daily soil temperature model based on air temperature and precipitation for continental applications. Clim. Res. 1993, 2, 183–191. [Google Scholar] [CrossRef]
  53. Clemens, J.; Vandré, R.; Kaupenjohann, M.; Goldbach, H. Ammonia and Nitrous Oxide Emissions after Landspreading of Slurry as Influenced by Application Technique and Dry Matter-Reduction. II. Short Term Nitrous Oxide Emissions. Z. Für Pflanz. Und Bodenkd. 1997, 160, 491–496. [Google Scholar] [CrossRef]
  54. Wulf, S.; Maeting, M.; Clemens, J. Application technique and slurry co-fermentation effects on ammonia, nitrous oxide, and methane emissions after spreading: II. Greenhouse gas emissions. J. Environ. Qual. 2002, 31, 1795–1801. [Google Scholar] [CrossRef]
  55. Nguyen, Q.V.; Wu, D.; Kong, X.; Bol, R.; Petersen, S.O.; Jensen, L.S.; Liu, S.; Brüggemann, N.; Glud, R.N.; Larsen, M.; et al. Effects of cattle slurry and nitrification inhibitor application on spatial soil O2 dynamics and N2O production pathways. Soil Biol. Biochem. 2017, 114, 200–209. [Google Scholar] [CrossRef]
  56. Kong, D.; Liu, N.; Wang, W.; Akhtar, K.; Li, N.; Ren, G.; Feng, Y.; Yang, G. Soil respiration from fields under three crop rotation treatments and three straw retention treatments. PLoS ONE 2019, 14, e0219253. [Google Scholar] [CrossRef] [PubMed]
  57. Cui, P.; Fan, F.; Yin, C.; Song, A.; Huang, P.; Tang, Y.; Zhu, P.; Peng, C.; Li, T.; Wakelin, S.A.; et al. Long-term organic and inorganic fertilization alters temperature sensitivity of potential N2O emissions and associated microbes. Soil Biol. Biochem. 2016, 93, 131–141. [Google Scholar] [CrossRef]
  58. Wang, Y.; Zhu, Z.; Li, X.; Yang, J.; Liang, L.; Sui, Q.; Wang, B.; Dong, H. NH3, N2O, and NO emissions from digested pig slurry stored under different temperatures: Characteristics and microbial mechanisms. J. Clean. Prod. 2021, 319, 128560. [Google Scholar] [CrossRef]
  59. Guo, Y.; Ji, Y.; Zhang, J.; Liu, Q.; Han, J.; Zhang, L. Effects of water and nitrogen management on N2O emissions and NH3 volatilization from a vineyard in North China. Agric. Water Manag. 2022, 266, 107601. [Google Scholar] [CrossRef]
  60. Novak, S.M.; Fiorelli, J.L. Greenhouse gases and ammonia emissions from organic mixed crop-dairy systems: A critical review of mitigation options. Agron. Sustain. Dev. 2010, 30, 215–236. [Google Scholar] [CrossRef]
  61. Pedersen, J.; Feilberg, A.; Nyord, T. Effect of storage and field acidification on emissions of NH3, NMVOC, and odour from field applied slurry in winter conditions. J. Environ. Manag. 2022, 310, 114756. [Google Scholar] [CrossRef]
  62. Carozzi, M.; Ferrara, R.; Fumagalli, M.; Sanna, M.; Chiodini, M.; Perego, A.; Chierichetti, A.; Brenna, S.; Rana, G.; Acutis, M. Field-scale ammonia emissions from surface spreading of dairy slurry in Po Valley. Ital. J. Agrometorology 2012, 17, 25–34. [Google Scholar]
  63. Congreves, K.A.; Grant, B.B.; Dutta, B.; Smith, W.N.; Chantigny, M.H.; Rochette, P.; Desjardins, R.L. Predicting ammonia volatilization after field application of swine slurry: DNDC model development. Agric. Ecosyst. Environ. 2016, 219, 179–189. [Google Scholar] [CrossRef]
  64. Thomsen, I.K.; Pedersen, A.R.; Nyord, T.; Petersen, S.O. Effects of slurry pre-treatment and application technique on short-term N2O emissions as determined by a new non-linear approach. Agric. Ecosyst. Environ. 2010, 136, 227–235. [Google Scholar] [CrossRef]
  65. Webb, J.; Pain, B.; Bittman, S.; Morgan, J. The impacts of manure application methods on emissions of ammonia, nitrous oxide and on crop response—A review. Agric. Ecosyst. Environ. 2010, 137, 39–46. [Google Scholar] [CrossRef]
  66. Aita, C.; Gonzatto, R.; Miola, E.C.C.; dos Santos, D.B.; Rochette, P.; Angers, D.A.; Chantigny, M.H.; Pujol, S.B.; Giacomini, D.A.; Giacomini, S.J. Injection of Dicyandiamide-Treated Pig Slurry Reduced Ammonia Volatilization without Enhancing Soil Nitrous Oxide Emissions from No-Till Corn in Southern Brazil. J. Environ. Qual. 2014, 43, 789–800. [Google Scholar] [CrossRef] [PubMed]
  67. Duncan, E.W.; Dell, C.J.; Kleinman, P.J.A.; Beegle, D.B. Nitrous Oxide and Ammonia Emissions from Injected and Broadcast-Applied Dairy Slurry. J. Environ. Qual. 2017, 46, 36–44. [Google Scholar] [CrossRef] [PubMed]
  68. Aita, C.; Chantigny, M.H.; Gonzatto, R.; Miola, E.C.C.; Rochette, P.; Pujol, S.B.; dos Santos, D.B.; Giacomini, D.A.; Giacomini, S.J. Winter-Season Gaseous Nitrogen Emissions in Subtropical Climate: Impacts of Pig Slurry Injection and Nitrification Inhibitor. J. Environ. Qual. 2019, 48, 1414–1426. [Google Scholar] [CrossRef]
  69. Dittmer, K.M.; Darby, H.M.; Goeschel, T.R.; Adair, E.C. Benefits and tradeoffs of reduced tillage and manure application methods in a Zea mays silage system. J. Environ. Qual. 2020, 49, 1236–1250. [Google Scholar] [CrossRef]
  70. Emmerling, C.; Krein, A.; Junk, J. Meta-Analysis of Strategies to Reduce NH3 Emissions from Slurries in European Agriculture and Consequences for Greenhouse Gas Emissions. Agronomy 2020, 10, 1633. [Google Scholar] [CrossRef]
  71. Loyon, L.; Guiziou, F. Ammonia volatilization from different pig slurries applied on wheat stubble using different land spreading techniques under French conditions. Agric. Ecosyst. Environ. 2019, 280, 114–117. [Google Scholar] [CrossRef]
  72. Fangueiro, D.; Pereira, J.L.S.; Macedo, S.; Trindade, H.; Vasconcelos, E.; Coutinho, J. Surface application of acidified cattle slurry compared to slurry injection: Impact on NH3, N2O, CO2 and CH4 emissions and crop uptake. Geoderma 2017, 306, 160–166. [Google Scholar] [CrossRef]
  73. Furon, A.C.; Wagner-Riddle, C.; Smith, C.R.; Warland, J.S. Wavelet analysis of wintertime and spring thaw CO2 and N2O fluxes from agricultural fields. Agric. For. Meteorol. 2008, 148, 1305–1317. [Google Scholar] [CrossRef]
  74. Hursh, A.; Ballantyne, A.; Cooper, L.; Maneta, M.; Kimball, J.; Watts, J. The sensitivity of soil respiration to soil temperature, moisture, and carbon supply at the global scale. Glob. Chang. Biol. 2017, 23, 2090–2103. [Google Scholar] [CrossRef]
  75. Jena, J.; Ray, S.; Srichandan, H.; Das, A.; Das, T. Role of Microorganisms in Emission of Nitrous Oxide and Methane in Pulse Cultivated Soil Under Laboratory Incubation Condition. Indian J. Microbiol. 2013, 53, 92–99. [Google Scholar] [CrossRef] [PubMed]
  76. Säurich, A.; Tiemeyer, B.; Dettmann, U.; Don, A. How do sand addition, soil moisture and nutrient status influence greenhouse gas fluxes from drained organic soils? Soil Biol. Biochem. 2019, 135, 71–84. [Google Scholar] [CrossRef]
  77. Bracken, C.J.; Lanigan, G.J.; Richards, K.G.; Müller, C.; Tracy, S.R.; Grant, J.; Krol, D.J.; Sheridan, H.; Lynch, M.B.; Grace, C.; et al. Sward composition and soil moisture conditions affect nitrous oxide emissions and soil nitrogen dynamics following urea-nitrogen application. Sci. Total Environ. 2020, 722, 137780. [Google Scholar] [CrossRef] [PubMed]
  78. Ball, B.C.; Scott, A.; Parker, J.P. Field N2O, CO2 and CH4 fluxes in relation to tillage, compaction and soil quality in Scotland. Soil Tillage Res. 1999, 53, 29–39. [Google Scholar] [CrossRef]
  79. Schwenke, G.D.; Herridge, D.F.; Scheer, C.; Rowlings, D.W.; Haigh, B.M.; McMullen, K.G. Greenhouse gas (N2O and CH4) fluxes under nitrogen-fertilised dryland wheat and barley on subtropical Vertosols: Risk, rainfall and alternatives. Soil Res. 2016, 54, 634–650. [Google Scholar] [CrossRef]
  80. Zheng, P.; Wang, D.; Yu, X.; Jia, G.; Liu, Z.; Wang, Y.; Zhang, Y. Effects of drought and rainfall events on soil autotrophic respiration and heterotrophic respiration. Agric. Ecosyst. Environ. 2021, 308, 107267. [Google Scholar] [CrossRef]
  81. Firestone, M.; Davidson, E. Microbiological Basis of NO and N2O Production and Consumption in Soil. Exch. Trace Gases Between Terr. Ecosyst. Atmos. 1989, 47, 7–21. [Google Scholar]
  82. Owens, J.; Clough, T.J.; Laubach, J.; Hunt, J.E.; Venterea, R.T.; Phillips, R.L. Nitrous Oxide Fluxes, Soil Oxygen, and Denitrification Potential of Urine- and Non-Urine-Treated Soil under Different Irrigation Frequencies. J. Environ. Qual. 2016, 45, 1169–1177. [Google Scholar] [CrossRef]
  83. Mumford, M.T.; Rowlings, D.W.; Scheer, C.; De Rosa, D.; Grace, P.R. Effect of irrigation scheduling on nitrous oxide emissions in intensively managed pastures. Agric. Ecosyst. Environ. 2019, 272, 126–134. [Google Scholar] [CrossRef]
  84. Sänger, A.; Geisseler, D.; Ludwig, B. Effects of rainfall pattern on carbon and nitrogen dynamics in soil amended with biogas slurry and composted cattle manure. J. Plant Nutr. Soil Sci. 2010, 173, 692–698. [Google Scholar] [CrossRef]
  85. Gu, C.; Riley, W.J. Combined effects of short term rainfall patterns and soil texture on soil nitrogen cycling—A modeling analysis. J. Contam. Hydrol. 2010, 112, 141–154. [Google Scholar] [CrossRef] [Green Version]
  86. Rochette, P.; van Bochove, E.; Prévost, D.; Angers, D.A.; Côté, D.; Bertrand, N. Soil Carbon and Nitrogen Dynamics Following Application of Pig Slurry for the 19th Consecutive Year II. Nitrous Oxide Fluxes and Mineral Nitrogen. Soil Sci. Soc. Am. J. 2000, 64, 1396–1403. [Google Scholar] [CrossRef]
  87. Daudén, A.; Quílez, D.; Vera, M.V. Pig Slurry Application and Irrigation Effects on Nitrate Leaching in Mediterranean Soil Lysimeters. J. Environ. Qual. 2004, 33, 2290–2295. [Google Scholar] [CrossRef] [PubMed]
  88. Waddell, J.T.; Gupta, S.C.; Moncrief, J.F.; Rosen, C.J.; Steele, D.D. Irrigation- and Nitrogen-Management Impacts on Nitrate Leaching under Potato. J. Environ. Qual. 2000, 29, 251–261. [Google Scholar] [CrossRef]
  89. Pang, X.P.; Letey, J.; Wu, L. Irrigation Quantity and Uniformity and Nitrogen Application Effects on Crop Yield and Nitrogen Leaching. Soil Sci. Soc. Am. J. 1997, 61, 257–261. [Google Scholar] [CrossRef]
  90. Vandré, R.; Clemens, J.; Goldbach, H.; Kaupenjohann, M. NH3 and N2O Emissions after Landspreading of Slurry as Influenced by Application Technique and Dry Matter-Reduction. I. NH3 Emissions. Z. Für Pflanz. Und Bodenkd. 1997, 160, 303–307. [Google Scholar] [CrossRef]
  91. Holly, M.A.; Larson, R.A.; Powell, J.M.; Ruark, M.D.; Aguirre-Villegas, H. Greenhouse gas and ammonia emissions from digested and separated dairy manure during storage and after land application. Agric. Ecosyst. Environ. 2017, 239, 410–419. [Google Scholar] [CrossRef]
  92. Cao, Y.; Wang, X.; Liu, L.; Velthof, G.L.; Misselbrook, T.; Bai, Z.; Ma, L. Acidification of manure reduces gaseous emissions and nutrient losses from subsequent composting process. J. Environ. Manag. 2020, 264, 110454. [Google Scholar] [CrossRef]
Figure 1. (a) Daily mean CO2, (b) N2O (b,c), and NH3 emissions of soils under spreading (S) and injection (I) slurry application techniques, under dry (D), normal (N), and extreme (E) irrigation strategies. Ta represents daily average air temperature, while arrows indicate irrigation events.
Sustainability 14 11107 g001aSustainability 14 11107 g001b
Figure 2. Soil chemical properties of the treatments: (a,b) total nitrogen (Ntot), (c,d) soil organic carbon (SOC), (e,f) NH4+, and (g,h) NO3 content collected at four different depths in each treatment. S: spreading application technique; I: injection application technique; N irrigation: 15.9 mm tap water; E irrigation: 31.8 mm tap water per irrigation event; D: without irrigation.
Sustainability 14 11107 g002
Table 1. Initial chemical parameters of the sandy soils at the upper and lower parts of the soil columns.
Soil LayerNtotNH4+-NNO3-NSOC
%mg kg−1mg kg−1%
Upper layer (0–25 cm)0.1283.2019.090.74
Lower layer (25–60 cm)0.0642.207.980.41
Ntot refers to total nitrogen content, SOC is the soil organic carbon content, NH4-N is ammonium-, and NO3-N is nitrate-nitrogen contents.
Table 2. Soil physical properties of the different soil layers used in the experiment.
Soil LayerClaySiltSandBulk DensityPorosityVWC
%%%g cm−3%%
Upper layer5.7712.1082.131.66 ± 0.0537.5 ± 2.013.5 ± 2.3
Lower layer6.7311.5781.701.67 ± 0.0336.9 ± 1.513.9 ± 3.5
VWC is the initial mean volumetric water content of the soil.
Table 3. Description of the study treatments (irrigation strategies and slurry application techniques).
TreatmentIrrigation StrategyApplication Technique
DSDry (0 mm)Spreading (150 kg ha−1)
NSNormal (15.9 mm)Spreading (150 kg ha−1)
ESExtreme (31.8 mm)Spreading (150 kg ha−1)
DIDry (0 mm)Injection (150 kg ha−1)
NINormal (15.9 mm)Injection (150 kg ha−1)
EIExtreme (31.8 mm)Injection (150 kg ha−1)
Abbreviation of the two pig slurry applications (S—surface spreading; I—soil injection) under three irrigation strategies (D—dry condition with no water additions; N—500 mL; E—1000 mL water added at given days).
Table 4. Mean greenhouse gas emissions of CO2 and N2O, and NH3 emissions.
TreatmentCO2 (mg m−2 s−1)N2O (µg m−2 s−1)NH3 (µg m−2 s−1)
DS0.254 ± 0.233 ab0.042 ± 0.072 a0.361 ± 0.349 a
NS0.109 ± 0.096 bc0.017 ± 0.024 ab0.042 ± 0.043 b
ES0.113 ± 0.095 abc0.008 ± 0.008 b0.031 ± 0.046 b
DI0.294 ± 0.235 a0.055 ± 0.105 ab0.008 ± 0.008 b
NI0.111 ± 0.138 bc0.009 ± 0.011 b0.012 ± 0.014 b
EI0.087 ± 0.130 c0.009 ± 0.016 b0.010 ± 0.012 b
S: spreading application technique I: injection application technique; D: no irrigation (0 mm tap water); N: regular irrigation with 15.9 mm tap water; E: regular irrigation with 31.8 mm tap water; a, b, c letters indicate significant differences between treatments (rows) (p < 0.05) for each gas emission type. n = 25 ± SD.
Table 5. Correlations (r) of CO2, N2O, and NH3 emissions with daily average air temperature (Ta).
Correlation of Soil Emissions with Ta
TreatmentCO2N2ONH3
DS0.63 *0.220.80 *
NS0.200.56 **0.50 *
ES0.110.94 ***0.06
DI0.81 ***0.410.60 *
NI0.030.470.42
EI0.050.670.42
* is the level of significance at p < 0.05, ** at p < 0.01, and *** at p < 0.001; S: spreading application technique; I: injection application technique; D: without irrigation; N irrigation: 15.9 mm tap water; and E irrigation: 31.8 mm tap water per irrigation event.
Table 6. Mean leachate chemistry (ammonium, nitrite, and nitrate) during the experiment.
Mean Leachate Chemistry
TreatmentNH4+ (mg L−1)NO2 (mg L−1)NO3 (mg L−1)
NS0.29 ± 0.09 a0.73 ± 1.65 ab347.45 ± 263.98 a
ES0.16 ± 0.11 b0.36 ± 0.32 a142.43 ± 102.41 b
NI0.15 ± 0.04 b0.13 ± 0.18 b279.38 ± 100.53 a
EI0.17 ± 0.08 b3.40 ± 5.58 a148.51 ± 150.43 ab
S: spreading application technique; I: injection application technique; normal (N) irrigation: 15.9 mm tap water; extreme (E) irrigation: 31.8 mm tap water; a, b letters indicate significant differences between treatments (rows) (p < 0.05) for each water chemical parameter. n = 14 ± SD.
Publisher’s Note: MDPI stays neutral with regard to jurisdictional claims in published maps and institutional affiliations.

