Article

Food Systems in Informal Urban Settlements—Exploring Differences in Livelihood Welfare Factors across Kibera, Nairobi

by
Katrine Soma
1,*,
Valerie Cornelia Johanna Janssen
1,
Oscar Ingasia Ayuya
2 and
Benson Obwanga
3
1
Wageningen Economic Research, Wageningen University & Research (WUR), Droevendaalsesteeg 4, 6708 PB Wageningen, The Netherlands
2
Department of Agricultural Economics and Agribusiness Management, Egerton University, Egerton P.O. Box 536-20115, Kenya
3
Department of Biological and Biomedical Sciences Technology, Laikipia University, Nyahururu P.O. Box 1100-20300, Kenya
*
Author to whom correspondence should be addressed.
Sustainability 2022, 14(17), 11099; https://doi.org/10.3390/su141711099
Submission received: 7 July 2022 / Revised: 26 August 2022 / Accepted: 2 September 2022 / Published: 5 September 2022
(This article belongs to the Topic Sustainable Development and Food Insecurity)

Abstract

:
The number and sizes of informal settlements are expected to increase drastically in the future, and dramatically so in Sub-Saharan Africa, where migration from rural to urban areas is increasing, and poverty and food insecurity threaten livelihoods. Data sources explaining livelihood factors in informal settlements are scarce, and often highly disputed. In this study, Kibera is investigated, one of the largest informal settlements in Africa. The main aim is to analyze differences in livelihood factors across the villages in Kibera, and to explain some of the existing discrepancies in food security levels among its population. In particular, livelihood factors such as tribe, welfare and trust can explain some of the variation in food security across 12 of the 13 villages located in Kibera. The analyses inform of significant differences across the villages when it comes to, among others, income, food insecurity, ownership of land in rural areas, tribal background and trust levels in strangers and community leads. To reach the millions of people living in informal settlements now, and increasingly so in the future, it is advised that research and implementation go hand in hand, with enhanced understanding of the complexities within rural–urban food systems to ensure solutions that are affordable and accessible to low-income groups. On this pathway to fight poverty and hunger in the future, today’s policies and programs must take such complexities into account to positively contribute to strengthening the resiliency and sustainability of rural–urban food systems by ensuring an increase in welfare levels with zero climate impact.

1. Introduction

The African continent is urbanizing faster than other continents, with the expectation that more than half of the Sub-Saharan Africa’s (SSA) population will live in urban areas by 2030 [1,2,3]. Of the total urban residents living in Sub-Saharan Africa, it has been estimated that more than 70% live in informal settlements or slums [3,4]. In Kenya, about 60–80% of the population live in informal settlements [2,5,6]. In the capital city Nairobi, about half of the people live in at least 100 slums and squatter settlements [6], including the major slums called Kibera, Mathare, Korogocho, Kangemi, Kawangware, Mukuru and Kiambio [ibid.]. Because of the informal character of these settlements, information is not selected regularly and facts are frequently disputed.
This is also the case in Kibera, one of the largest informal settlements in Africa. A lack of systematic data collection has made it complicated to officially confirm the complexities of livelihood, which has led to many misconceptions and misinformation about the size of the location, its exact population, poverty status, land and property ownership, etc. Often rough estimates are based on assumptions of the shares of the total population in Nairobi, or research conducted in one of the 13 villages of Kibera is assumed to be representative of Kibera as a whole. For instance, the true population size in Kibera is highly disputed [7]. According to the literature, different authors have given varying estimates of the population in Kibera [7,8,9]. The total population of residents in Kibera in 2019 according to the national census was only 185,777 [10]. Notably, this estimate is questioned [11]. Other sources report differently, including estimates of between 235,000 and 270,000 [12] and for some NGOs, they report up to 1,5 million [13]. In some of the literature, the assumed high population of Kibera has given it the reputation of being the largest slum in the region and the second largest in Africa after Cape Town, South Africa [14,15]. In contrast, others believe that the actual population estimates in Kibera most probably are too high [16]. Not knowing the exact number of people living in Kibera, it also becomes unclear how livelihood welfare factors, such as income, food security, access to energy, etc., vary across the 13 villages of Kibera.
Against this background, in this article the main aim is to analyze the differences in livelihood factors across the villages in Kibera, and to explain some of the existing discrepancies in food security levels among its population. The specific research questions are:
(1)
Who are the people living in Kibera, and how are tribes distributed across the villages?
(2)
How do selected welfare factors vary across Kibera, such as income, land and source of electricity?
(3)
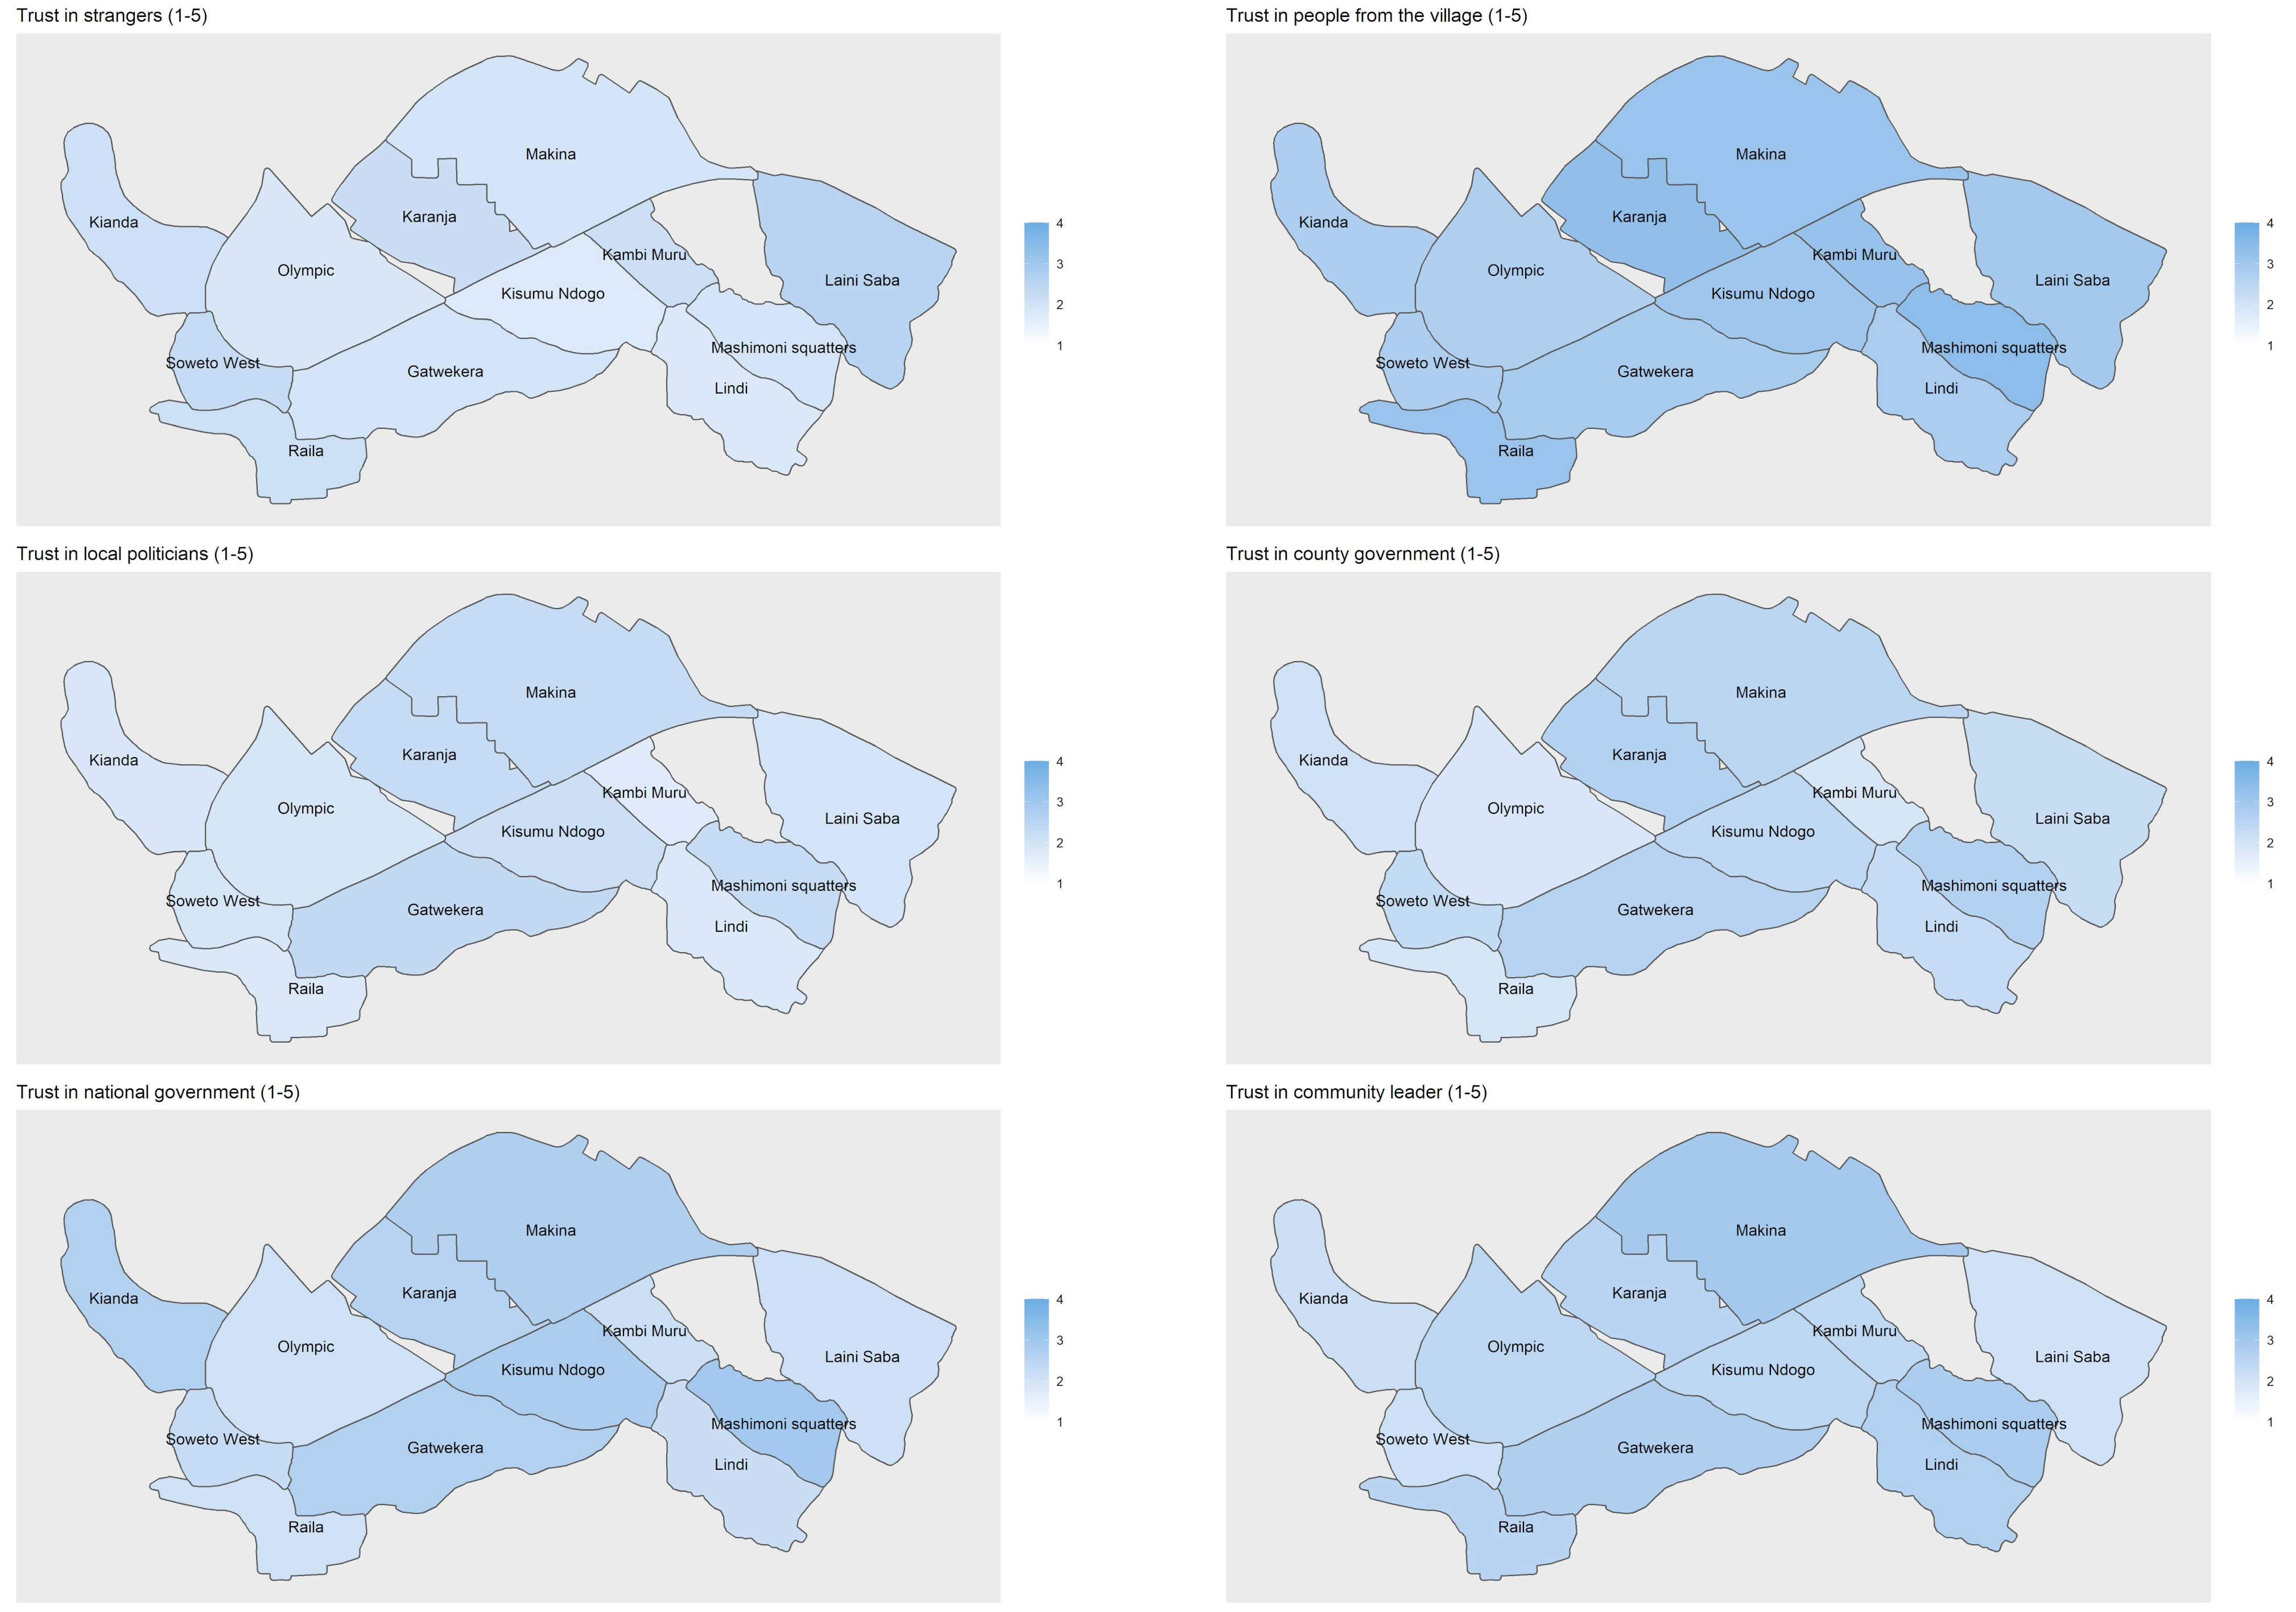
How do trust levels differ for various actors across the villages of Kibera?
(4)
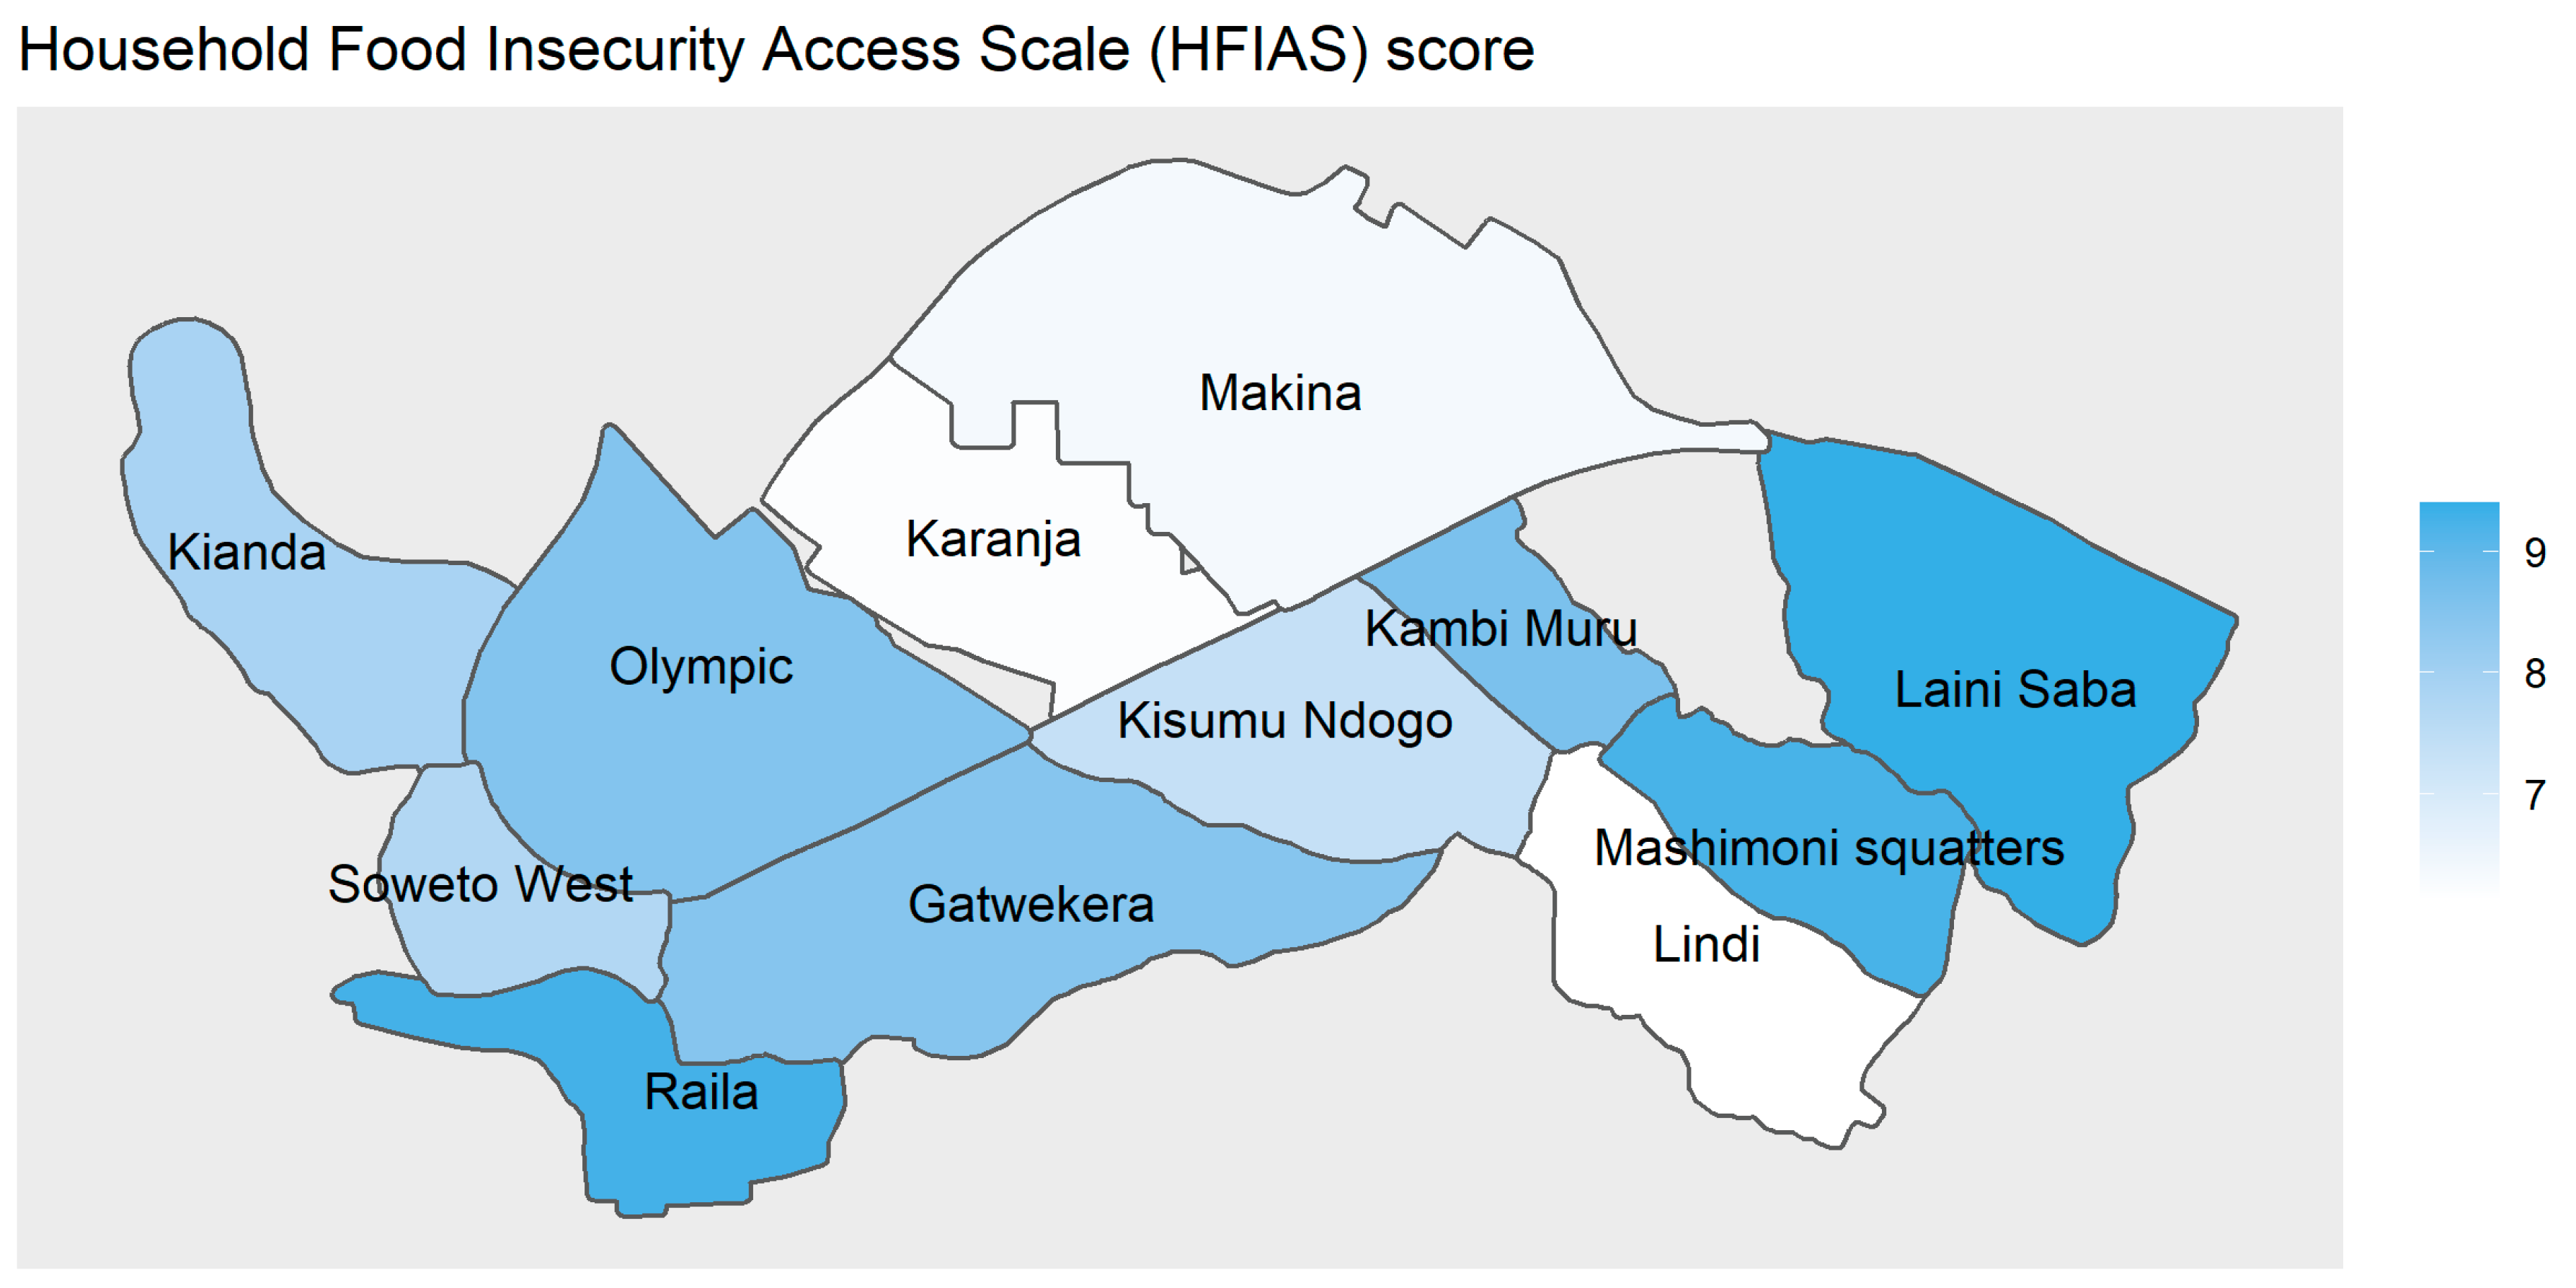
To which extent do levels of food insecurity vary across the Kibera villages?
In this study, a food system approach was applied to account for the complexities of the explanatory variables of food insecurity in Kibera. In this approach, targeting a minimum of 30 households in each village with variable representativeness across gender, age and tribe, a total of 386 households distributed across the villages in Kibera were interviewed to contribute to the analyses, and their locations were identified. The livelihood factors are further presented visually to illustrate the variations across the Kibera informal settlement visually, supported by tests of significance between each single village and the average values for Kibera. The enhanced understanding of the variabilities of livelihood welfare factors fills some of the information gaps, and provides increased opportunities for more targeted future support, development and investments, which again can enhance the resiliency of the food systems and livelihood.
The article is structured as follows. A food system approach is introduced in Section 2. Subsequently, the methodological approach and materials are provided in Section 3, followed by Section 4 presenting the main results of the household survey. Based on the results, the livelihood welfare factors analyzed across the Kibera villages are discussed in Section 5, before the main concluding remarks and recommendations are provided in Section 6.

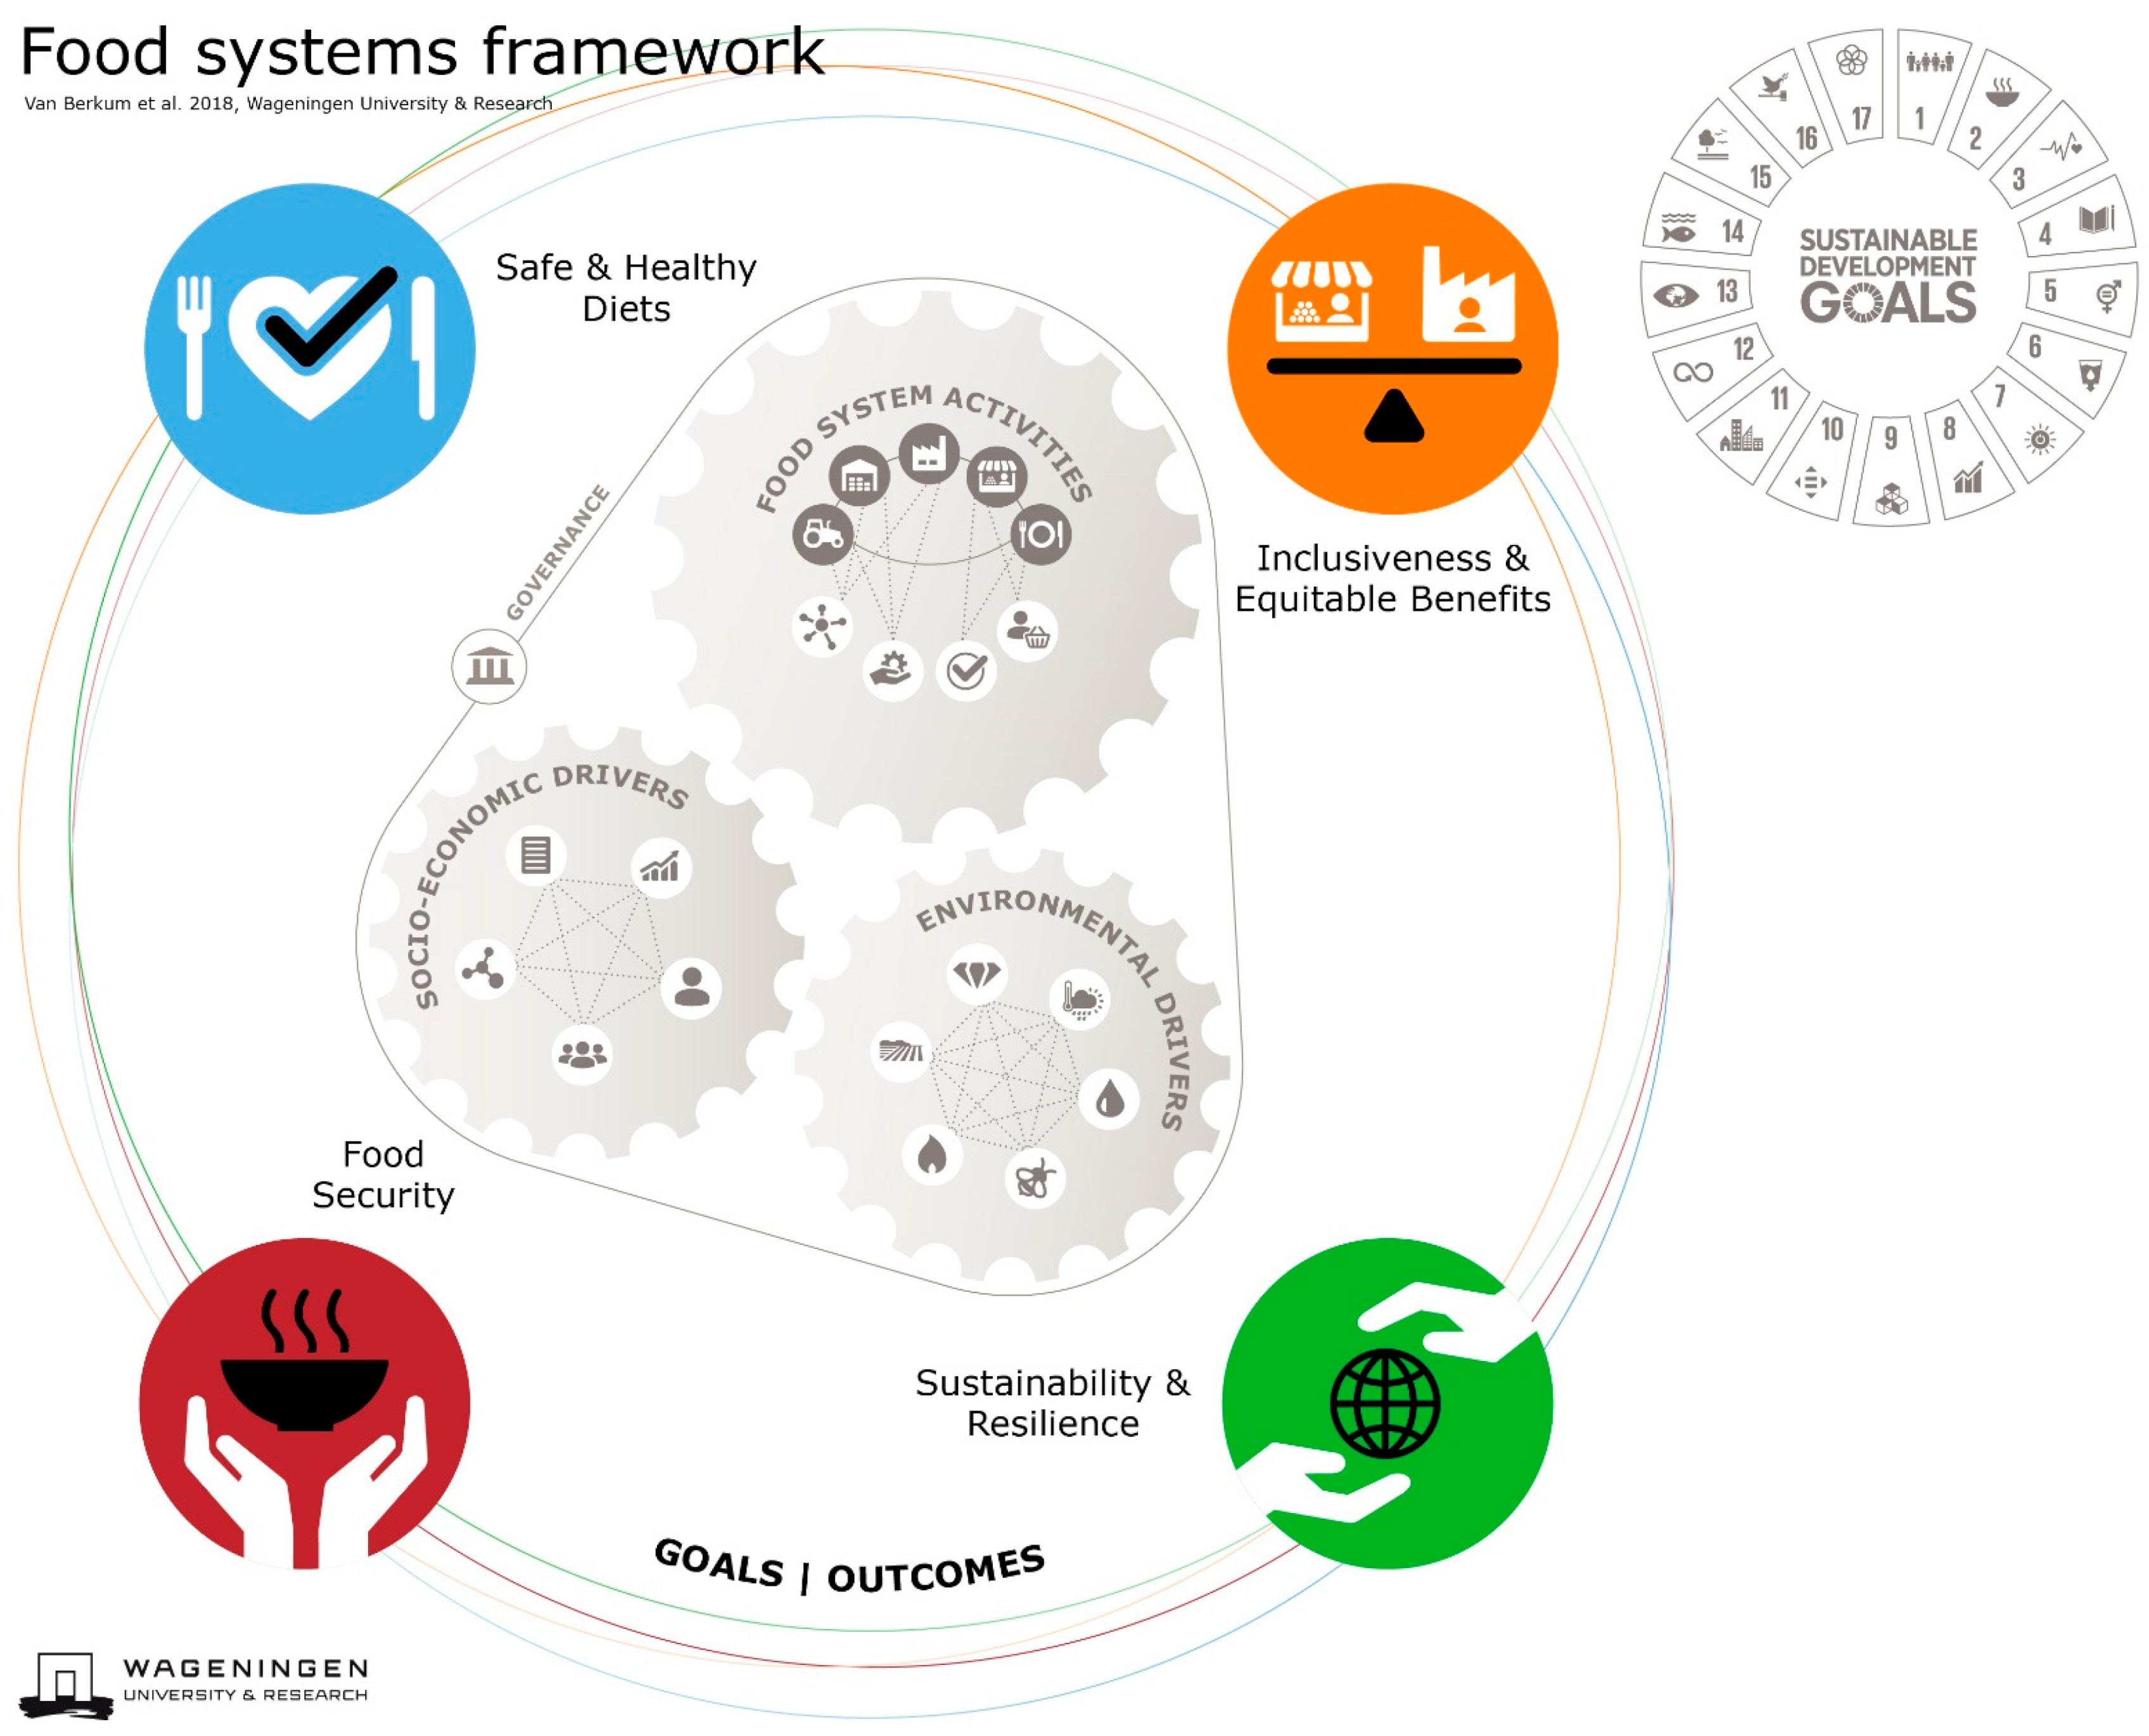
2. A Food System Approach

A food system approach was applied in this study to explore a set of livelihood factors and their explanatory potential for the levels of food insecurity in the informal settlement of Kibera (Figure 1) [17,18]. In a food system approach, the outcomes can be observed alongside all of the Sustainable Development Goals (SDGs) introduced by the United Nations General Assembly (UN-GA), for which food security, safe and healthy diets, inclusiveness and equitable benefits, as well as sustainability and resiliency, are the immediate outcomes. The dynamics of food system activities related to, among others, the value-chain with production, trading and consumption, as well as banking, laws and regulations’ facilities, are highly interlinked with the dynamics of socio-economic and environmental drivers. While the socio-economic drivers include specifications of the policy regime and levels of conflicts, the dynamics of the environmental drivers define the quality of water, climate adaptability, biodiversity and soil conditions, among others [19]. The drivers have strong influences in context-specific food systems. While it is generally acknowledged that the food systems are complex, it is not possible to analyze every single causal relationship in every study.
The target group of this study is the households in Kibera [20,21]. Stakeholder participation in cities is recommended to deal with the complexities involved, such as food insecurity, poverty, health problems and environmental issues [22]. The households are suffering from the substantial impacts of lacking inclusiveness and equitable benefits, lacking safe and healthy diets, suffering from food insecurity, vulnerability to lacking sustainability and resiliency, for which climate change and environmental degradation will harm the groups substantially.
The definition of the role of a household head is disputed [23], and it is unclear why some interviewees said they were household heads and others not, probably because of different interpretations about what a household head’s role is. Institutional theory informs about the structures influencing the contexts for acting, involving both informal and formal rules that encourage or restrain peoples’ behaviors [24]. In institutional theory, an emphasis has been put on the difference between individual and social values (see, e.g., [25]. Taking a citizen’s role implies that a ‘we’ perspective is applied when considering the needs of your family, your community, your city or your country [26].
Institutional factors also include rural–urban interactions and inter-relationships, in relation to, among others, money flow, migration, food trade and land ownership [18]. Social capital is the basis of commitments, cooperation and trust, and has been shown to have an influencing role in Kibera as an explanatory factor for food security [21,27]. Hence, the specific relationships investigated in this study include food security, reflecting on the ‘inclusiveness and equitable benefits’ and ‘sustainability and resilience’ outcomes, following the food system approach to assist the visibility of the interrelationships of a larger system [28]. As such, food security does not operate in isolation from other factors, but is highly interrelated with other welfare factors, such as income and relations with rural areas and backgrounds. A food system approach makes such complexities visible and logical.
A food system approach investigates multiple factors, activities and outcomes of a food system; covering biophysical, economic, political and social factors, food-related production, processing, distribution, preparation and consumption activities, as well as socioeconomic, climate and environmental outcomes [12,19]. The literature on food systems conceptualizes the food system differently, including some of the literature having a strong emphasis on natural resources [29], and others focusing on consumers and diets [30]. Others again investigate the bottlenecks and opportunities with food systems [31]. Van Berkum et al. [17] provide a generic framework for food systems focusing on how different types of policy incentives or business innovations can influence the relationships between multiple stakeholders (input providers, farmers, traders, public officials, processors, retailers), and can impact on the interactions of different components (consumption, distribution, value chain, production). Several surveys explore how to support a food system transition towards sustainability and resilience following the SDGs [32], and specifically focusing on urban—rural food system interactions [18,33].

3. Methodological Approach
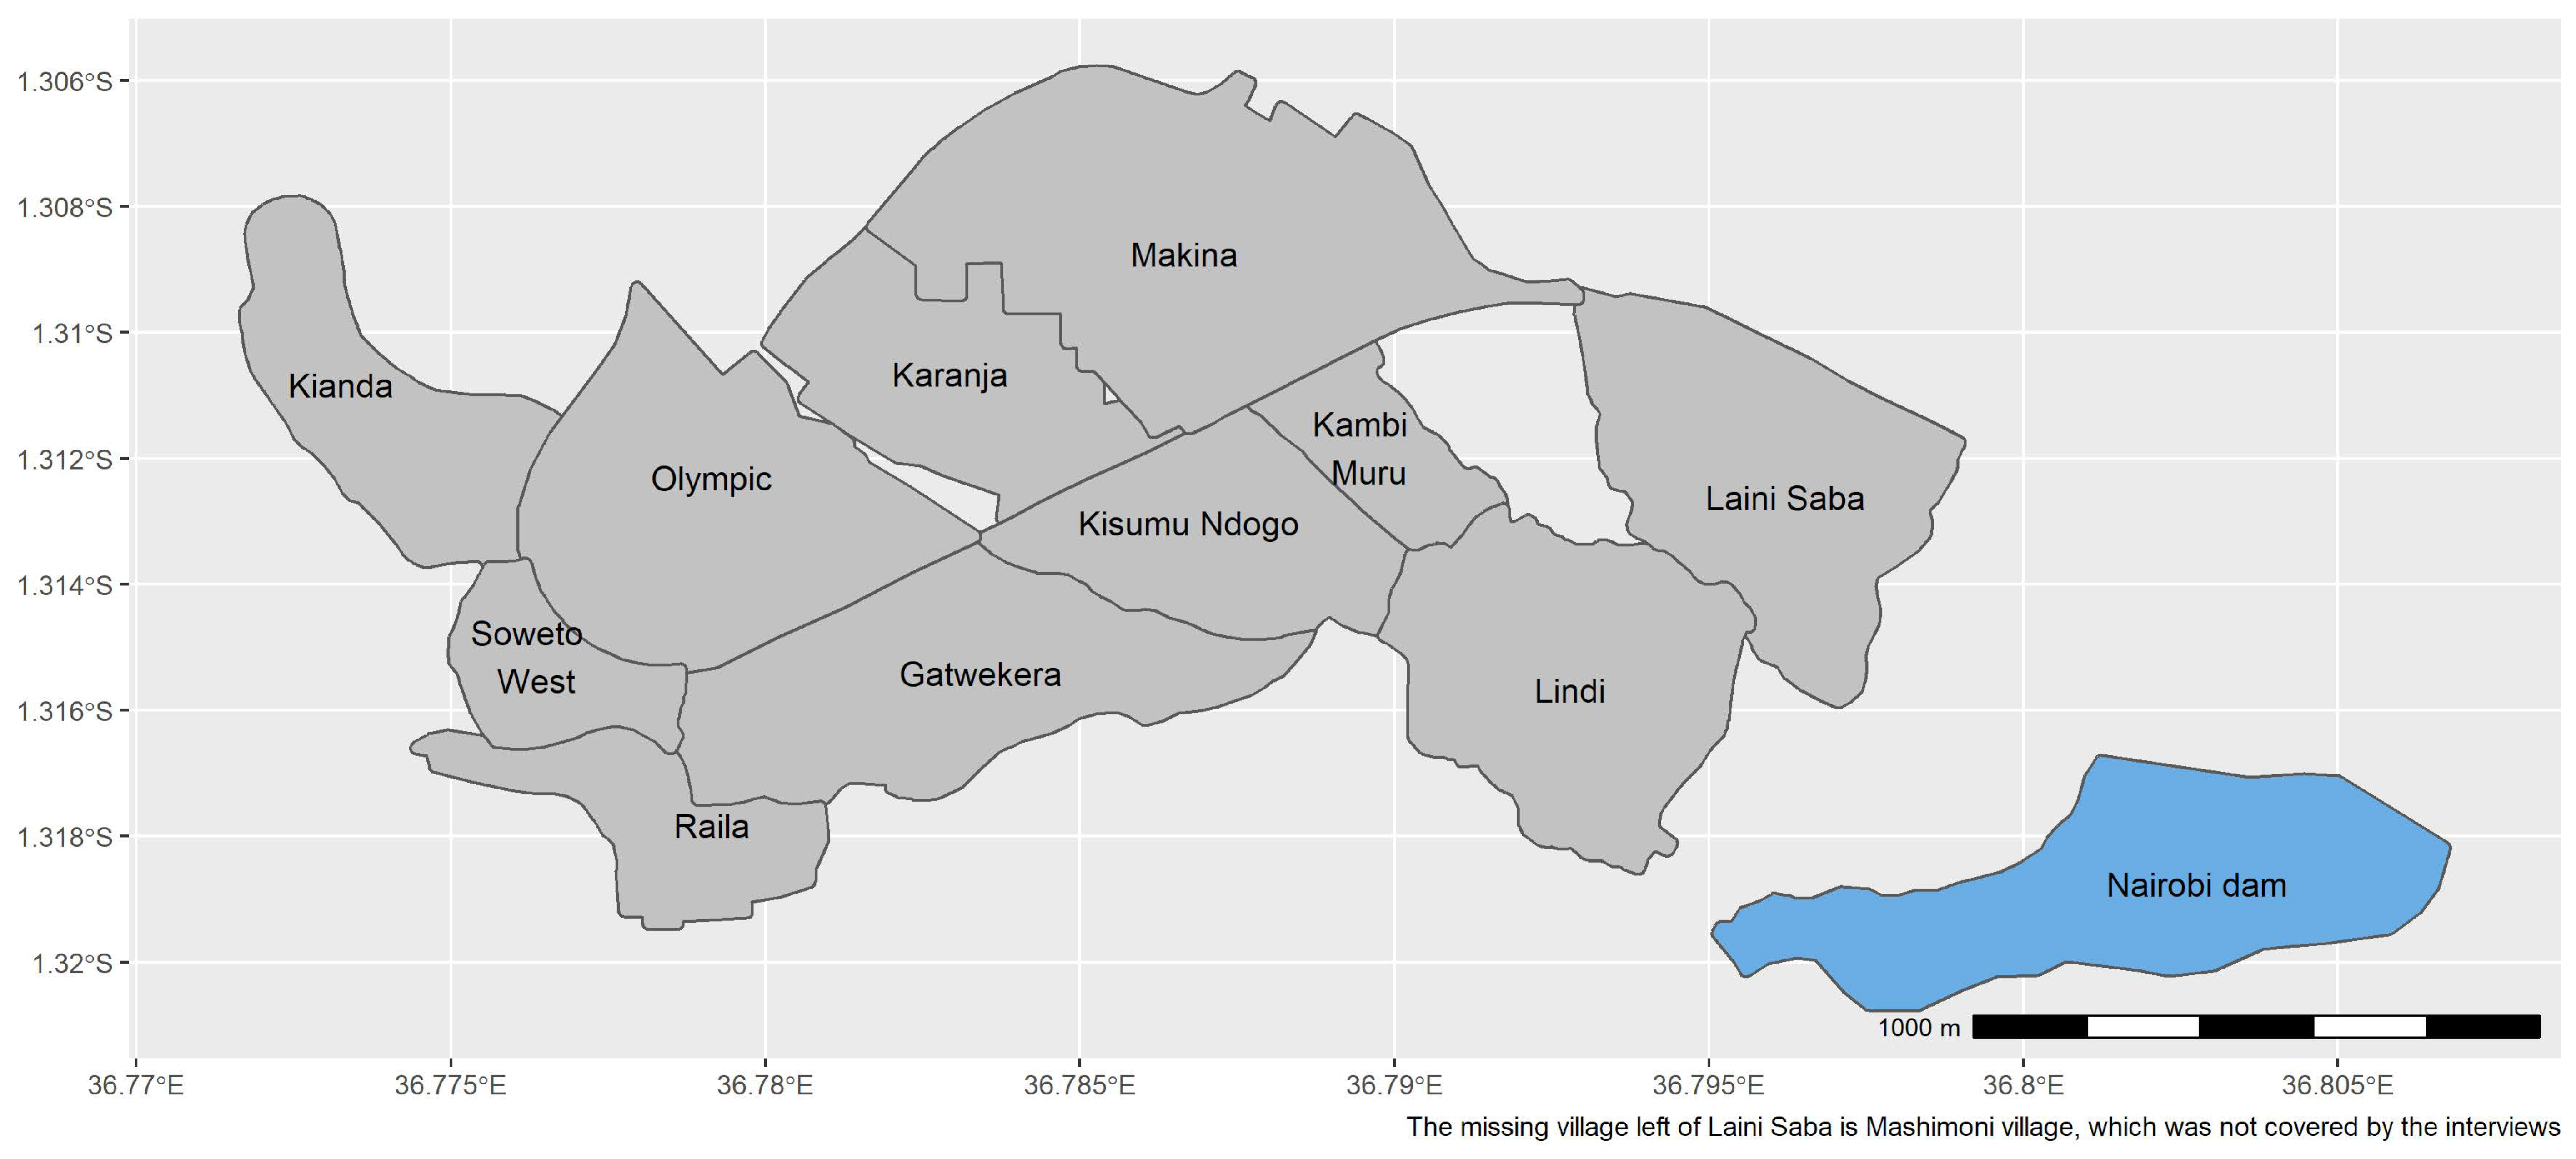
In this section, the study area is presented on a map, and the data collection and the statistical analyses applied are explained. Two documentaries have been made to explain the food system dynamics in Kibera (see Supplementary Materials below: Videos S1 and S2).

3.1. Study Area

Kibera can be divided into 13 villages, for which 12 were included in this study (Figure 2). The missing village, Mashimoni, was not covered by the study because of security reasons. During the interviews, Global Positioning System (GPS) locations of the interviewed respondents were registered.

3.2. Data Collection and Statistical Analysis

The selection of the households to be interviewed personally by in-depth interviews in August 2020 was performed by so-called random walks. Within each village, a selection of about 30–35 households were interviewed, taking into account a spread of gender, age and tribe. Although the sample size per village was small, it was possible to determine significant differences between them. Notably, with larger samples, more significant results would have been identified. To detect locations by GPS, an Open Data Kit (ODK) mobile-phone platform was applied.
A semi-structured questionnaire was prepared, including both open- and close-ended questions. Covering livelihood factors such as income, education, background and relations with rural areas, as well as questions about trust, consumption preferences, food security and many more, the dataset is comprehensive and unique of its kind and has contributed to other studies as well [18,19]. Some of the variables were obtained as monetary units, others as percentages, numbers of people and times of travel (Appendix A). In two cases, a scale was applied; (1) to take account of trust levels, a scale of 1 to 5 was applied, for which 1 equals low trust, 2 equals some trust, 3 equals moderate trust, 4 equals reasonable trust, and 5 equals a high trust level. (2) a Household Food Insecurity Access Scale (HFIAS) was applied as a proxy for food security in this study, developed by USAID [34]. When calculating the HFIAS in this study, a total of eight questions were scored from 0 to 3, with 3 being the highest frequency of occurrence. Adding all of the scores, the total HFIAS can range from 0 to 24, indicating the degree to which respondents have inadequate access to food. Following this approach, various food consumption-related questions with different intensities were asked, including: In the past four weeks:
  • Did you worry that your household would not have enough food? How often?
  • Were you or any household member not able to eat the kinds of foods you preferred because of a lack of resources? How often?
  • Did you or any household member have to eat a limited variety of foods due to a lack of resources? How often?
  • Did you or any household member have to eat some foods that you really did not want to eat because of a lack of resources to obtain other types of food? How often?
  • Did you or any household member have to eat smaller meals than you felt you needed because there was not enough food? How often?
  • Did you or any household member have to eat fewer meals in a day because there was not enough food? How often?
  • Was there ever no food to eat of any kind in your household because of lack of resources to get food? How often?
  • Did you or any household member go to sleep at night hungry because there was not enough food? How often?
  • Did you or any household member go a whole day and night without eating anything because there was not enough food? How often?
After pre-testing on 16 respondents, appropriate modifications were implemented. Stata software [35] was used for the data processing and analysis after data collection, and maps were made using a statistical program called “R” [36].
The final samples per village are provided in Table 1. The sample size per village was mostly 30 households interviewed, although in Gatwekera, Kianda, Laini Saba and Soweto West the numbers were higher, which is explained by the need to interview some more households to reduce any dominance of gender, age and tribe in the sample, and in Kisumu Ndogo the sample was lower than 30, due to the difficulty in finding people willing to spend two hours to respond to this questionnaire. The table also provides the share of households participating with male heads, and the mean age of the household head, across the different villages.
A t-test was performed for each variable against the average of Kibera to detect the variabilities across the villages, to test the hypothesis: Is the livelihood factor identified at village level significantly different from the average of Kibera? The livelihood factors include a series of variables listed in Appendix A, Table A1, bundled within the following categories: (1) Households origin (tribe), (2) Household practices, (3) Household characteristics, (4) Household welfare, (5) Household use of energy source, (6) Trust relations on a scale from 1 (low) to 5 (high) and (7) Food insecurity. By means of the descriptive statistical analysis, the levels of significance are presented by p-values to illustrate the exact discrepancies with the Kibera average (Appendix A, Table A1). Stars indicate the p-value of the t-test on the difference in means between the village of interest and the other villages within Kibera, where + = p < 0.1, * = p < 0.05, ** = p < 0.01, *** = p < 0.001, with * = p < 0.1 indicating some significance, ** = p < 0.05 indicating quite some significance and *** = p < 0.01 indicating high significance in the difference of the specific village value compared to the Kibera average.

4. Results

In this section, the results are presented on maps covering the 12 villages investigated in Kibera. The darker the blue color is, the higher the value of the respective variable. Note that the scale of each map is different, and as such the colors do not represent similar value categories across the maps. The results of the t-test and the numeric values of the estimates are presented in Table A1 in Appendix A. Each sub-section that follows addresses one of the four research questions listed in the introduction.

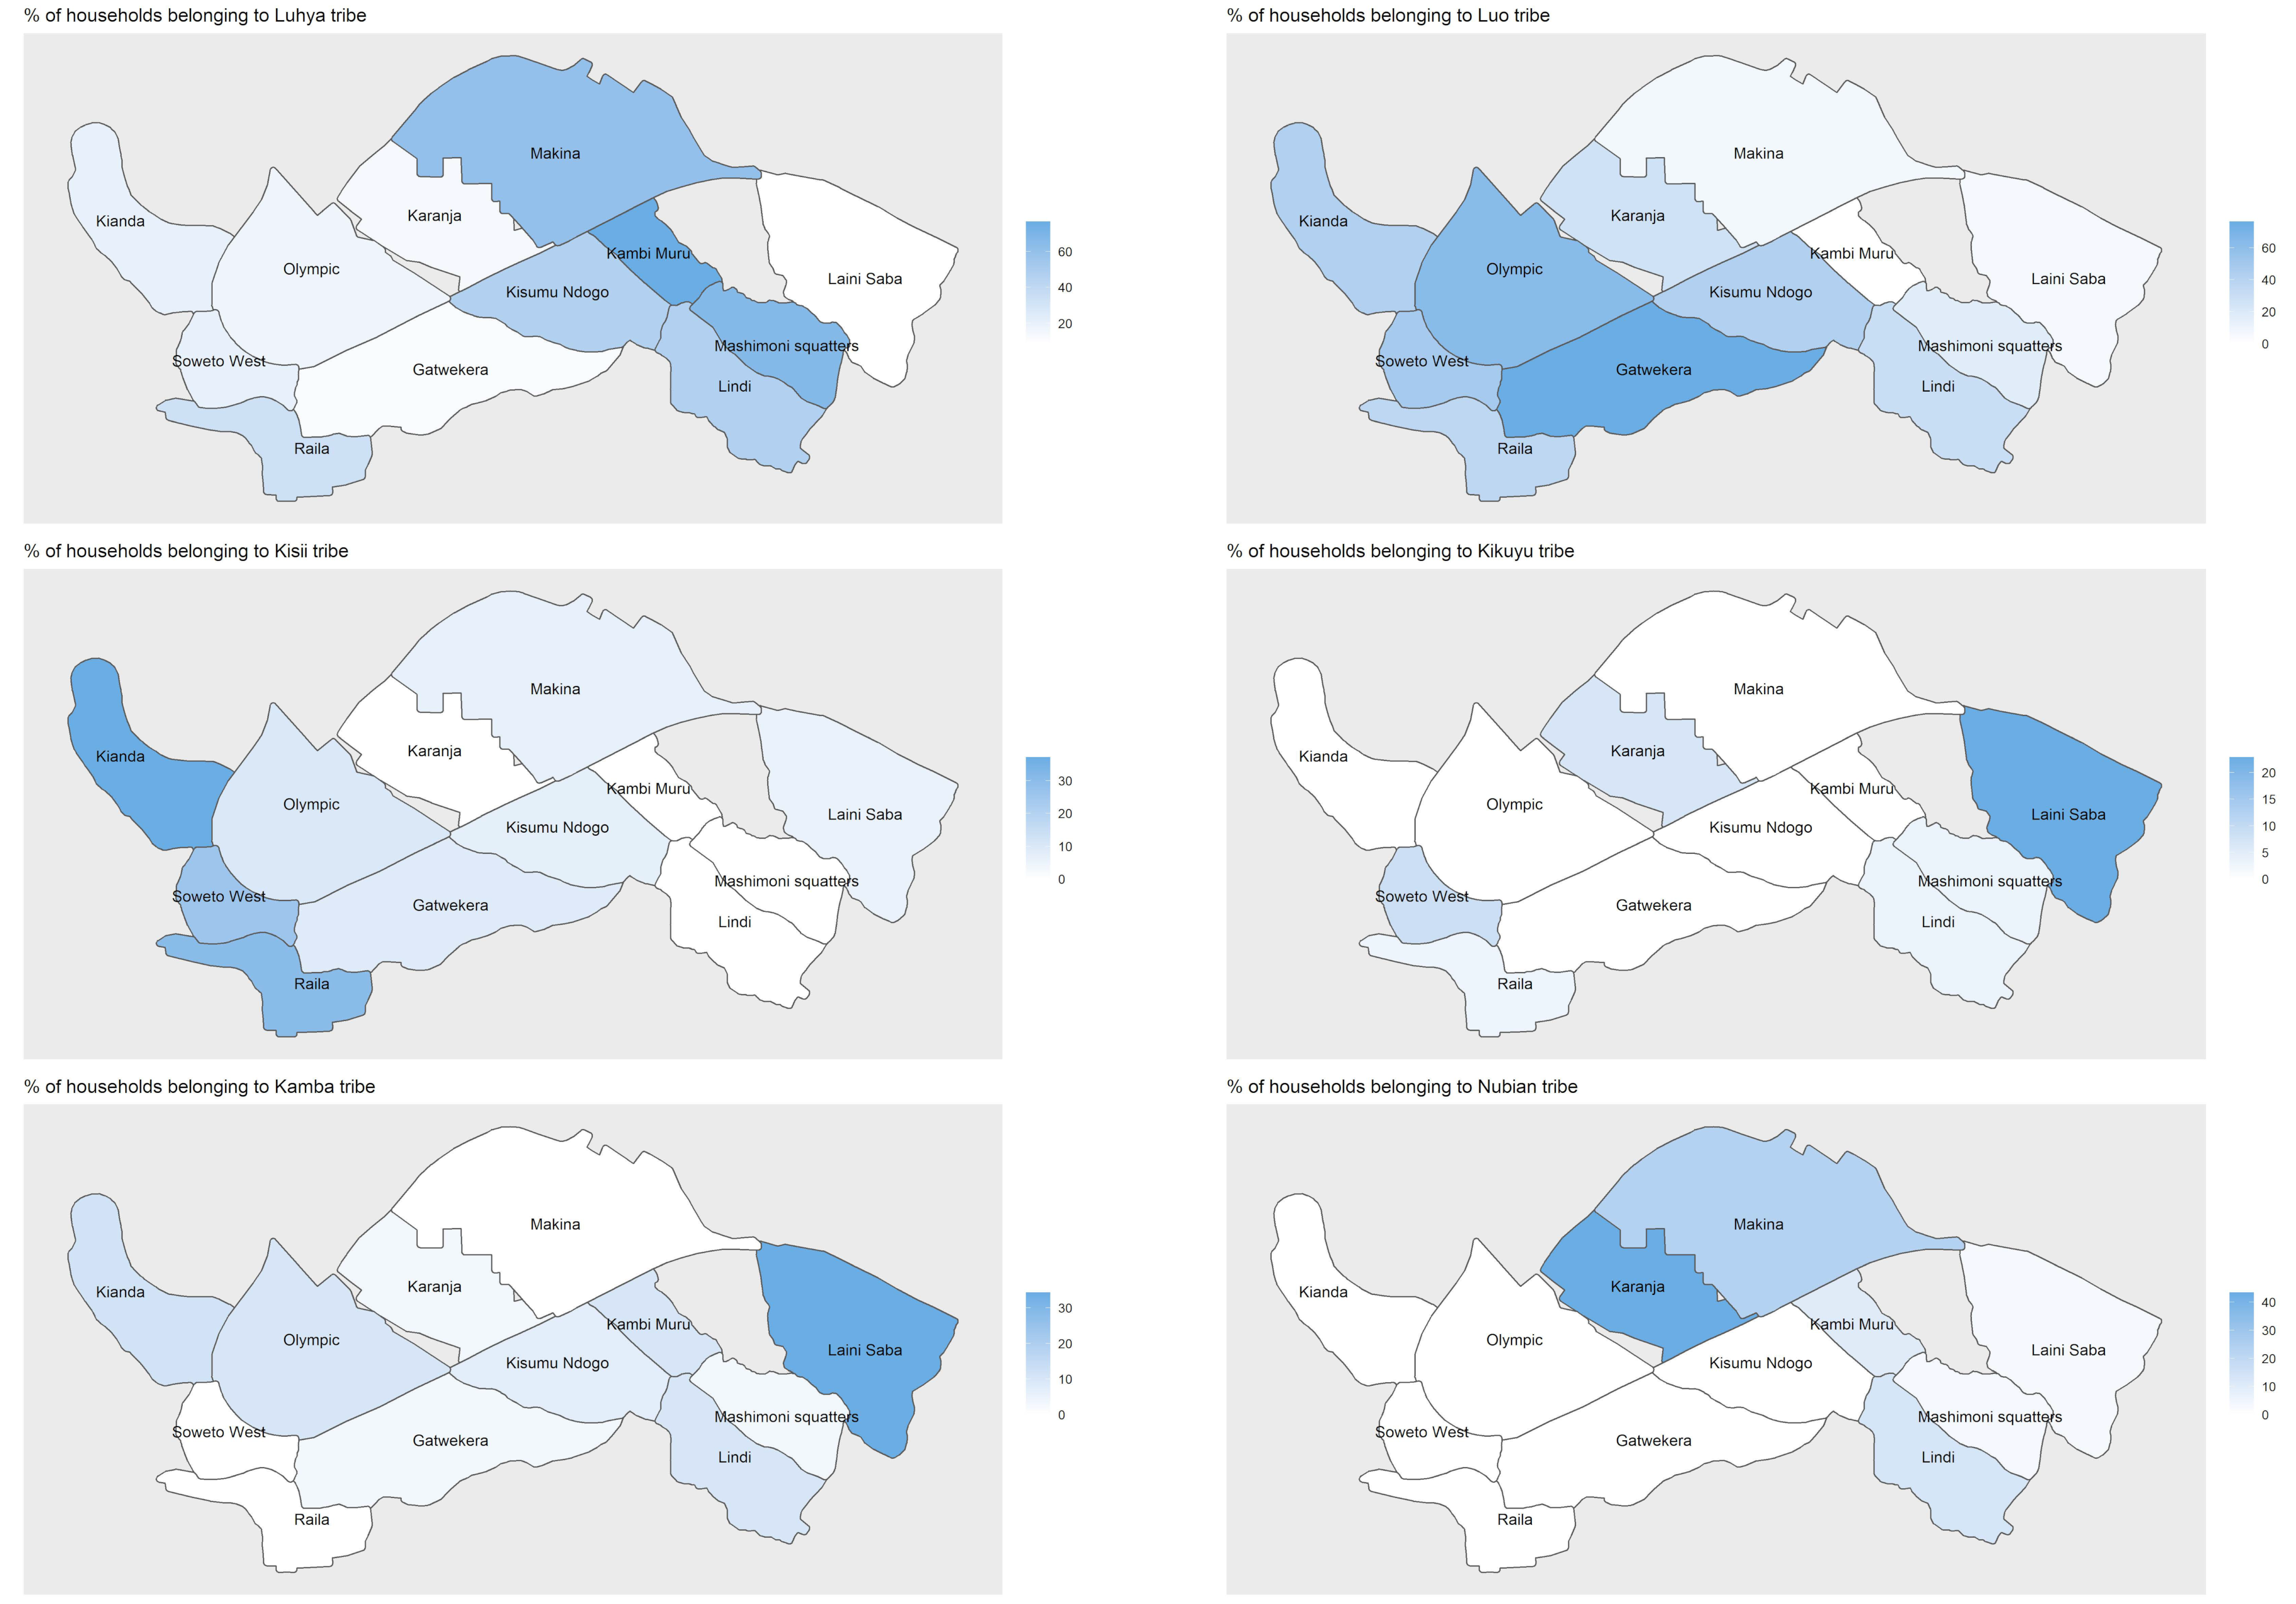
4.1. Who Are the People Living in Kibera, and How Are Tribes Distributed across the Villages?

Tribes. There is a large diversity of tribes in Kibera. Overall, based on the random sample of this study, the selected households consisted of 131 representing the Luhya tribe (34%) and 127 representing the Luo tribe (33%), which were the most prevalent tribes in Kibera, followed by a total of 42 households representing the Kisii tribe (11%), and a total of 30 households representing each of the Nubian and Kamba tribes (8% each), while the Kikuyus only contributed with about 15 interviews (4%) of the total sample (Table A1).
Across the villages, significant differences in the composition of tribes compared with the average of Kibera were shown for Soweto West where there were more Luos (49%) and Kisiis (26%) and fewer Luhyas (20%) (see Appendix A). Moreover, in Laini Saba there were more Kikuyus (23%) and Kambas (34%), whereas Kisumu Ndogo followed by Lindi showed a very similar composition of tribes to Kibera overall. The share of Luos was highest in Gatwekera (76%), followed by Olympic (63%) and Soweto West (49%), while the share of Luhyas was highest in Kambi Muru (77%), followed by Mashimoni Squatters (67%) and Makina (60%). Although the largest share of Kisiis was identified in Kianda (37%) and Raila (30%), the shares of Luos and Luhyas were relatively high in both these villages as well. The share of Nubians was highest in Karanja (43%) (see Figure 3).
Household practices. On average in Kibera, the number of years a household head has lived in Kibera is 21 years. The share of household heads indicating they adopt the same practices as their neighbors, was estimated to be 45% on average. The average a household head visited the rural area of belonging was 1.6 times a year, whereas the share of household heads who feel connected to Western Kenya was as high as 75% on average. (Table A1).
Karanja showed a relatively high significant discrepancy across most of the household practice factors compared with the Kibera values on average (see Appendix A). This is not surprising, given that Nubians who are born in Kibera and do not originate from Kenya dominate this village. Accordingly, the inhabitants have lived longer in Karanja (32 years) than Kibera on average, they share fewer cultural practices with their neighbors (40%) and connect less than average to Western Kenya (40%). The number of visits to the rural area was higher because they perceive Kibera as their ancestral land and refer to this as their ‘rural area’. Notably, the area also has an influx of other tribes who have strong linkages with their rural homes and hence influence the outcome.
Comparing the differences in values across the villages, the household heads in Raila and Kianda on average moved to Kibera most recently (13 and 15 years, respectively). Moreover, the share of neighbors sharing the same cultural practices was highest in Gatwekera (67%) compared to the other villages, followed by Lindi (50%). The lowest sharing of cultural practices is in Laini Saba, where the tribes do not connect with Western Kenya, i.e., where the Kikuyus and the Kambas were dominant (38%). Looking at the differences between the villages, Makina’s inhabitants visited their rural areas less frequently (0.9 times per year) in comparison with the other villages. Overall, in all of the villages the share of people who connected with Western Kenya is high, between 63% in Makina and 97% in Gatwekera, except for Karanja (20%) and Laini Saba (20%). This is logical, given the estimates of tribe dominance across the different villages which do not originate from the west (see Figure 4).
Household characteristics. Some core household characteristics variables included household size, which on average was 4.6 people in Kibera, and education level of household heads, with an average of 49% who achieved secondary education (4 years or higher). While on average 67% of the household heads in Kibera are married, only 3% of the household heads interviewed were women. (Table A1).
Across the villages, it appears that household size varies, and in Laini Saba and Lindi the sizes were lower on average (4.0 and 3.8, respectively), whereas in Mashimoni Squatters and Olympic they were significantly higher (5.8 and 5.2, respectively). Three of these villages also differed when it came to education. Whereas in Mashimoni Squatters and Laini Saba only 27% and 29%, respectively, have achieved secondary education, in the Olympic village a total of 77% have achieved secondary education or higher, which was a lot more than average. Moreover, only in Gatwekera was the number of married household heads significantly higher with 85% of the household heads being married, compared with the average of 67%. Overall, female household heads were very rare, and there were no significant differences between the villages in the share of female-headed households, as shown in Appendix A. In some villages, no female household heads were included in the study, although a large share of interviewees were women who responded on behalf of the household head (see Figure 5).

4.2. How Do Selected Welfare Factors, such as Income, Land and Source of Electricity Vary across Kibera?

Income and landownership. In Kibera, the mean income was based on the average income of the household sample included in this study, which is KES13,166 per month (about EUR132). A total of 36% of the household heads indicated that their income was enough to cover their food needs. About 50% of the respondents indicated that they owned land in rural areas with an average size of 1.48 hectares. (Table A1).
Looking at the differences across the villages, first, the study shows that the spatial patterns regarding education level closely resemble the patterns for income. The highest monthly income was found in the Olympic village (KES17,053), whilst the lowest incomes were identified in Laini Saba (KES9,840). Second, the share of households who indicated their income was enough to cover their food needs and utilities costs was highest in Lindi (50%), followed by Makina (47%) and Gatwekera (47%). Notably, although no significant difference with the average was shown, the villages Kisumu Ndogo, Kambi Muru and Mashimoni Squatters indicated most frequently that their income was not enough (25%, 27% and 27%, respectively) (see Appendix A). Third, probably the most influencing factor for welfare in Kenya, i.e., the owning of land in rural areas, showed a lot of variability, which was shown to be significantly differentiated in Gatwekera, Kambi Muru, Karanja, Kianda, Laini Saba and Lindi. Compared with the shares of households owning land in rural areas on average in Kibera (51%), the shares were higher for Gatwekera (65%), Kambi Muru (67%) and Kianda (69%), and lower in Karanja (33%), Laini Saba (31%) and Lindi (33%). However, only in Lindi did the average size of land differ significantly from the average (3.33 hectares) (see Figure 6).
Spending and loans. On average in Kibera overall, the share of income sent to rural areas as remittances was 6%. A total of 56% of the households received food gifts as a source to strengthen their food security. Of the respondents, 13% indicated having savings, while 35% had a loan (Table A1).
Across the villages in Kibera, the share of income sent to rural areas was significantly higher in Gatwekera (9%), and significantly lower in Laini Saba, where only 3% of income was sent to rural areas. The share of respondents who reported receiving food gifts from rural areas differed a lot across the villages. The receivers of food gifts were significantly higher than average in Gatwekera (79%) and Olympic (77%), and significantly lower than average in Karanja (20%), Kisumu Ndogo (39%) and Makina (40%) (see Appendix A). When it comes to savings, only Mashimoni Squatters is significantly different than the Kibera on average, with only 3% of households having savings. In addition, the share of households with loans was significantly higher compared to the mean in the Olympic village, where over half of the respondents had taken a loan (53%) (see Figure 7).
Energy sources. In Kibera the most used energy sources for cooking and light, among others, include: (1) accessed steady electricity network; (2) charcoal; (3) paraffin; and (4) liquefied petroleum gas (LPG). Looking at Kibera on average, a total of 49% reported having access to the electricity network, and 19% made use of charcoal, 40% made use of paraffin and 36% made use of LPG (Table A1).
First, the share of households accessing the electricity network was significantly higher than average in Makina (77%), Karanja (67%) and Kambi Muru (63%), and significantly lower than average in Laini Saba (17%) and Mashimoni Squatters (27%) (see Appendix A). Second, the use of charcoal was significantly higher than average among the households in Olympic village (33%) and significantly lower than average in Laini Saba (3%). Third, the use of paraffin was significantly higher among the households in Raila (55%) and Laini Saba (54%), while significantly lower in the Olympic (23%). Fourth, the use of LPG as energy source is only significantly different in Mashimoni Squatters where it is lower than average (17%) (see Figure 8).

4.3. How Do Trust Levels Differ for Various Actors across the Villages of Kibera?

Trust levels. The level of trust was identified by asking the household heads to judge on a scale of 1–5, for which 1 is the lowest and 5 the highest trust level. On average in Kibera as a whole, people had the highest trust in people from the village (3.01), followed by trust in the national government (2.43) and the county government (2.27). The lowest trust was given to local politicians (2.01) and strangers (2.05) (Table A1).
Looking at differences across the villages, although all of the villages gave high scores to people from the village, the trust in people from the village was significantly higher in Mashimoni Squatters compared to the other villages (3.40) (see Appendix A). In addition, for the trust in national government, the Mashimoni Squatters provided a significantly higher score (2.97), whereas trust in the national government was significantly lower than average in Raila (2.06). Moreover, the trust levels of the county government varied to a great extent across the villages, with significantly higher scores compared to the average in Kibera in Mashimoni Squatters (2.62), Gatwekera (2.59) and Karanja (2.62), and significantly lower scores in Kambi Muru (1.90), Olympic (1.85) and Raila (1.91). Gatwekera informed of a significantly higher trust level of local politicians (2.32) compared with the average level in Kibera. Regarding community leaders, trust was significantly higher in Makina (2.93) but significantly lower in Laini Saba (2.06) and Soweto West (2.09). Finally, trust in strangers was only significantly higher in Laini Saba (2.54) (see Figure 9).

4.4. To which Extent Do Levels of Food Insecurity Vary across the Kibera Villages?

Food insecurity. Looking at the food insecurity access scale (HFIAS) score in Kibera as a whole, the average was 7.93. The food security status was further classified into four groups, for which the highest shares of the population fell in the categories; mildly food insecure (41%) and moderately food insecure (43%). In the categories severely food insecure and food secure, the shares were 3% and 13%, respectively. It was significantly higher compared to the average in Laini Saba (9.40) and significantly lower in Lindi (6.13), Karanja (6.20) and Makina (6.37) (Table A1). In addition, the villages Mashimoni Squatters (9.23) and Raila (9.27) were relatively food insecure according to these estimates, although not significantly different from the average (see Figure 10).
Food security is only one of several outcomes in a food system approach (Figure 1). In this study, food security is addressed in terms of access to food. As such, the outcome of a food system in terms of ‘safe and healthy diets’ has not been addressed directly, but the ‘inclusiveness and equitable benefits’ outcome has been addressed to the core, and the ‘sustainability and resilience’ outcome has been addressed in terms of source of energy, thus linking this with climate change.
It is unclear how to judge the average absolute HFIAS value to be low or high (7.93) on a scale from 0 to 24. Reasoning from the results of this study, however, it is confirmed that the average income (Figure 6) per household member (Figure 5) adds up to EUR0.95 per day (i.e., 95KES per day). Based on the literature, it appears that while Kibera has provided cheap housing for thousands of Nairobi residents, an endemic poverty exists in the informal settlements with more than half of the households living below the official poverty line of USD1 per day, which must also cover non-essentials such as water, healthcare and education [37]. Given this low share to be spent on food, the absolute value is thus reflected in a location with high food insecurity.
Reflecting on the ‘inclusiveness and equitable benefits’ outcome of a food system, it is confirmed that a large variability exists within slums such as Kibera. Note that this study was conducted during the COVID-19 epidemic, so the reasons for low food access could be explained by this. However, it appears that for Laini Saba, a total of 17 welfare factors differs from the average, including less land owned in rural areas, lower income, lower education, low household sizes, low connection with neighbors and higher trust of strangers. Laini Saba is also dominated by different tribes with less connection to Western Kenya. At the other end, the Olympic village seemed to be at the higher end in Kibera, with higher income and education levels compared to the average in Kibera, and with more loans and more food gifts. The knowledge of diversity within Kibera is critically important to projects, programs and investments targeting the most food-insecure people.
Looking at the use of an energy source as indicator of the ‘environmental’ and ‘resilience’ outcomes with a focus on climate mitigation and adaptation levels, the variability across Kibera villages is high. The use of LPG is the most sustainable alternative for an energy source in Kenya, because it emits less carbon-dioxide than most conventional fossil fuels and no black carbon, which is the second biggest contributor to climate change [38]. In Kibera, the variability of energy use is low across the villages, and the average among household users is estimated to be 36%. A large share of the households (48%) has access to steady electricity, and may tap this from the Kenyan electricity network, which is sourced from hydro and fossil fuel (thermal) and may provide the second-most climate friendly option [39]. Moreover, paraffine is used by almost equally as many households (40%), which is not a good option for the climate because it releases carcinogenic substances when it burns and creates air pollution and toxic fumes when it encounters oxygen in the water or air [40]. As many as 20% report that they make use of charcoal, which not only releases planet-warming greenhouse gases into the atmosphere, but also accelerates biodiversity loss. The potential to increase sustainability and resiliency in Kibera is huge.

5. Discussing Differences in Livelihood Welfare Factors across Kibera and Food System Outcomes

According to the literature, the food situation in Kibera is characterized by households running out of food items to feed children, reliance on a limited number of foods, running out of money to buy food, cutting the size of meals or skipping meals due to lack of money to buy food and children going to bed hungry [15]. The issue of food insecurity becomes even more critical when the issues of orphans and victims of HIV-AIDs comes into the picture [41]. Cases of lack of important nutrients and micronutrients are reported, while possible contamination of food due to poor hygiene and sanitary conditions have been reported to be the cause of high infant-mortality rates [3,41]. Poverty is further manifested in a lack of access to basic requirements including water, electricity and sanitation [7,37].
Kibera slid into poverty in the late 1930s, which to a great extent was caused by the shortage of clean water becoming the biggest challenge [37]. After World War II and after Kenya’s independence from British colonial rule in 1963, rural to urban migration and the severe housing shortages in Nairobi caused an influx of Africans renting houses from the Nubians in Kibera [7,37]. Subsequently, the Government of Kenya upgraded Kibera by dividing it into villages, lowering the status of the housing units of the Nubians, and building residential housing in part of the areas, leaving the present Kibera for Kenyan tribes to settle [37]. The literature does not inform about discrepancies of food security and livelihood factors across the villages in Kibera.
Differences across the Kibera villages. Aiming at analyzing the differences in livelihood factors across the villages in Kibera, and to explain some of the existing discrepancies in food security levels among its population, this study has unraveled some critical discrepancies to consider in further transitioning towards the Sustainable Development Goal 2 (SDG2): zero hunger. Some of the differences can be explained by the different tribes in Kenya, which can be clustered according to the degrees to which their language has similarities, and traditionally join efforts during conflicts and elections. As such, the Luo, Luhya and Kisii tribes in Kibera all have roots in Western Kenya and share similar backgrounds. Likewise, the Kikuyu and Kamba tribes hold similar relationships, both originating from the mountain areas north of Nairobi and eastern part of the country, respectively. In addition, there is a tribe referred to as the Nubians, consisting of an Islamized mix of Nubian people of Sudanese, Ugandan and Congolese origin [7]. The Nubians were World War I veterans given temporary residence permits by the British colonial government between 1912 and 1934 to avoid provocations in native reserves occupied by indigenous ethnic groups of Kenya [7,42].
According to the literature, most landlords are Kikuyu and Nubians [43]. It is therefore striking that Laini Saba, with the highest share of Kikuyus, represents the very poorest of the villages. Looking at the results (Table A1), in Laini Saba the food insecurity index scored the highest, and they have the lowest ownership of land in rural areas, as well as lowest income and education level, lowest sharing of cultural practices, fewest visits to Western Kenya and lowest access to stable electricity compared with the average in Kibera. Moreover, they use almost no charcoal but more paraffin than average, while they trust strangers more and community leads less than the average household head in Kibera. The explanations of this confirm that strong links with rural areas, including ownership of land, as well as close relationships with the neighbors are increasing food security. In addition, while Kikuyus are more represented in Laini Saba (23%) than in other villages, there are more Kambas (34%), and this consequently affects the outcomes of the study.
The other tribe which highly differs from the rest is thus the Nubian tribe, who foremost live in Karanja, representing 43% of its sample population. The inhabitants of Karanja are found to have lived more years in Kibera than average (31.7 years), with the lowest connection with Western Kenya (40% of the population) and owning less land in rural areas than average (33% of the population). These findings can be explained by the literature. The Nubians were the original settlers to Kibera, for whom the original name was Kibra which means a bushy place or land of forest [7]. The initial judgement by the British who considered the Nubians a better class of African, with the Nubians themselves living with higher standards in the same way as white people at the time, created an impetus for future challenges with the Kenyan indigenous population [44]. The change of administration in the Kibera area in the beginning of 1928 from a military to civil society was lacking local authority to administer the area, which led to an administrative grey area where tax was not collected. This opened the area up to the indigenous tribes of Kenya who intensively moved into Nairobi in search of work [45]. Given the difficulties in resettling the Nubian population in Kibera, the government stopped distributing residence permits to family members of the war veterans and neglected the steady supply of water and sewerage to force the residents to resettle elsewhere, with an intention of eventually dismantling Kibera as a housing site and opening the area for the expansion of Nairobi City [6,44].
In all the other villages, the Luos or Luhyas are highest represented. Often both tribes are highly represented, although the Luos dominate the most in Gatwekera (76%), and the Luhyas in Kambi Muru (77%). The most discrepant villages in this category according to the welfare factors investigated are the villages Gatwekera, Mashimoni Squatters and Olympic. In Gatwekera, the inhabitants are more than average connecting with Western Kenya, with significantly higher ownership of rural land, sending of income and receiving food gifts in return. They are also more frequently marrying and trusting the county government and local politicians more than other villages. Looking at the income and education level, Olympic is the most well off, receiving more food gifts than average from rural areas, and having more access to loans. Both the Olympic, which is dominated by Luos, and the Mashimoni Squatters, which is dominated by Luhyas, have a significantly larger number of household members than average. However, the Mashimoni Squatters share less cultural practices among neighbors, and have lower education, lower savings, lower access to electricity, but have more trust in people from the village, the national government and the county government than average. The village most in line with the average of Kibera is Kisumu Ndogo, for which only two variables differed significantly from average, namely stronger connection with Western Kenya and receiving food gifts more frequently.
Food system outcomes. Following the logic of the food system approach, the vulnerability of the urban population to food insecurity can be compounded by climate change, rising food prices, emergencies and shifting demographics [4]. A food system approach is designed to cover interrelationships and complexities, for which food security is only one of several outcomes explaining its resiliency (Figure 1) [17,18]. The complexities in Kibera must be regarded as relatively high [27]. In the following, the reasoning covers the main outcomes of the food system: (1) food security, (2) sustainability and resiliency and (3) inclusiveness and equitable benefits.
First, food insecurity variability across the villages was confirmed in this study (Figure 10), with Laini Saba counting as the most food insecure, and Lindi as the relatively most food secure village. The rural inhabitants of Kenya are migrating into Kibera in search of employment and cheap housing. The villagers of Kibera confirm the strong correlations between income, employment and food security. Informal micro-enterprises help the Nairobi slum residents fight their way against poverty [7]. Although Kibera is regarded as a settlement with high poverty levels, it has been projected that more than 7300 enterprises exist [16]. Income is largely derived from wage employment and small businesses or micro-enterprises which include selling of groundnuts, fish, or fresh vegetables, preparing and selling street foods, making shoes and furniture, sewing, brewing alcohol, prostitution, selling drugs and medicinal plants, operating kiosks and construction [7,16,46].
Some households practice farming as a source of income, although this is prone to pollution and theft [37,47]. Chickens are the most kept livestock, although ducks, sheep and goats are also common [48]. Sack gardening has been identified as a viable livelihood strategy in Kibera which can improve household food security [37,47]. Most farmed crops include maize, beans, arrow roots, Irish potatoes, pigeon peas, pumpkins, cassava, bananas and sugar cane. As such the main activity for women is self-employment selling vegetables or fish, and cooking local food. On average the income of women is 42% lower than that of men [16]. Furthermore, despite the high levels of poverty in Kibera, studies show that the Kibera population make sacrifices to take their children to low-cost private schools and even pay extra tuition and buy books [7]. Access to viable income, employment and finance to invest are among the main critical factors for change towards increased food security among the inhabitants of Kibera.
Second, to obtain sustainability and resiliency, it is necessary to investigate the environmental drivers that are evidently influential to the livelihood of Kibera. The food system approach, integrating sustainability and food security, and addressing rural–urban interrelationships in terms of migration, food access and remittances, is highly useful to increase the understanding of such complex systems [18]. Food insecurity is a matter of sustainability and is highly interwoven with the SDGs [49]. According to the literature, the poverty levels have pushed residents to resort to using sources of fuel such as firewood and charcoal, exposing them to further poor living conditions [42]. In this study, the differences in use of energy source have been analyzed across the villages, showing that Laini Saba has a very different consumption pattern than the other villages, with more use of paraffin, less use of charcoal and with less access to steady electricity. Use of paraffin is also shown to be higher in Raila village, and lower in the Olympic village. Note that the Olympic village reported using more charcoal than any other village based on the sample of interviews. Use of LPG as energy source is rather stable, with only the Mashimoni Squatters using less than average.
Offering alternative sources of energy, for instance such as solar based, could have a large climate impact given the large number of households, if first the households currently using paraffin and charcoal as energy source are targeted. Obviously, poverty alleviation and climate adaptation strategies must go together, as it is not sufficient to target the climate challenges by, for instance, restraining use of charcoal without accessibility to alternative green energy sources for these vulnerable groups [50]. In other words, the bill to pay for climate change lies with the countries and companies who caused it, not the people who have been excluded from the welfare caused by climate change, with no equitable benefits whatsoever [51]. The enhancement of welfare for the people of Kibera should be ensured by zero climate emissions.
Third, inclusiveness and equitable benefits are related to the formality of settlements. In Sub-Saharan Africa, 86% of all employment consists of an informal workforce [52]. Based on the literature, informal settlements consist of informal businesses, and informal workers, for which the informal businesses can be defined along three criteria [53,54]: (1) legal informality referring to not officially being registered, (2) fiscal informality referring to non-payment of taxes, an operational bank account and maintenance of bookkeeping, and (3) labor informality referring to lacking contracts and benefits for employees. The informal workforce is employed by the informal businesses. In Kibera, all of these dimensions of informality exist, although informality in this context also covers formality applications in the forms of, for instance, use of a mobile telephone banking and payment system, and registration of companies. However, most residents work for an informal occupation, which is never recorded by official employment statistics.
The explanatory factors of the role of the informal businesses in the economy have been distinguished by the following factors in the literature [53,54]: (1) Exclusion, when businesses are excluded from state benefits due to high entry costs, (2) Exit (escape), when businesses voluntarily choose to operate informally after assessing the costs and benefits of formalization, (3) Dualism, when businesses are forced to operate informally due to the lack of an established formal sector, and (4) Structuralism, when businesses provide low-cost inputs and flexibility to the formal sector. For the Kibera case, the structuralism judgement is highly valid, given the duality in the Kenyan economy, with affordable and accessible food products made available by the informal economy to millions of the inhabitants in Kenya. Moreover, formality is often linked with foreign influence, grounded in the public administration system defined by the colonists, thus outsiders [27]. Notably, in the apparent chaos which externals cannot fully understand, in Kibera the norms and rules are the driving forces, maintaining order and supporting development.
Notably, the informal sector is a container term comprising everything from traditional communities with high social capital, as well criminal gangs, although this share is expected to be very low. This study confirms high levels of social capital in Kibera [21], based on the trust levels confirmed, which are shown to differ across the villages. Cooperation with the informal sector, to strengthen the resiliency of future food systems, will require insights into where and when the social capital is high. This is because with high trust levels, the impacts towards the realization of the SDGs can become significantly stronger.
This survey has contributed to filling an information gap apparent in the Kibera informal settlement. However, because of the informality of Kibera, some challenges appeared with the data collection. For instance, in a few cases, discrepancies existed between the detected location of households by means of a GPS and the village definition. The reasons why include that households belong to villages outside of the defined borders. Note that the areas are small, the whole of Kibera is about 2.5 km2, and the borders of villages are not formally defined, so human relations appear more definitive than the borders on the ground. Based on the reasoning that the respondents identify with the village of their response more than the physical location of their house, the village names as reported by the respondents themselves were applied instead of the GPS locations in unclear cases. Another limitation of the study is related to the sample size in each village. The average is 32 households per village, which is relatively small to claim the answers are fully representative. However, compared with existing data, the data collected in this study fill urgent data gaps.

6. Concluding Remarks

Kibera can be described as a densely populated informal settlement where residents face a range of challenges including high levels of poverty, food insecurity, insecure land tenure, lack of adequate housing, poor infrastructure and drainage, frequent threats of violence, high crime rates, poor environmental conditions and inadequate access to basic goods and services that include sanitation, health care and education and frequent outbreaks of water-borne diseases [6,9,47].
In this study a food system approach [17,18] is applied to deal with the high complexity levels, to resolve some of the misunderstandings of informal settlements by investigating differences in livelihood factors across the villages in Kibera, and to explain some of the existing discrepancies in food security levels among its population. To reach the Sustainable Development Goals (SDGs), including SDG1: No poverty, SDG2: Zero hunger and SDG11: Sustainable cities and communities, the application of the food system approach in this study assists by providing a holistic approach addressing the complexities of interrelationships of the different factors in Kibera. In a series of maps, it is illustrated that livelihood factors differ across the 12 villages, including income levels, food insecurity levels, access to electricity, ownership of land in rural areas and food gifts received. (Appendix A).
The results of this study, aimed at analyzing differences in livelihood factors across the villages in Kibera, and at explaining some of the discrepancies in food security levels among its population, have shown that:
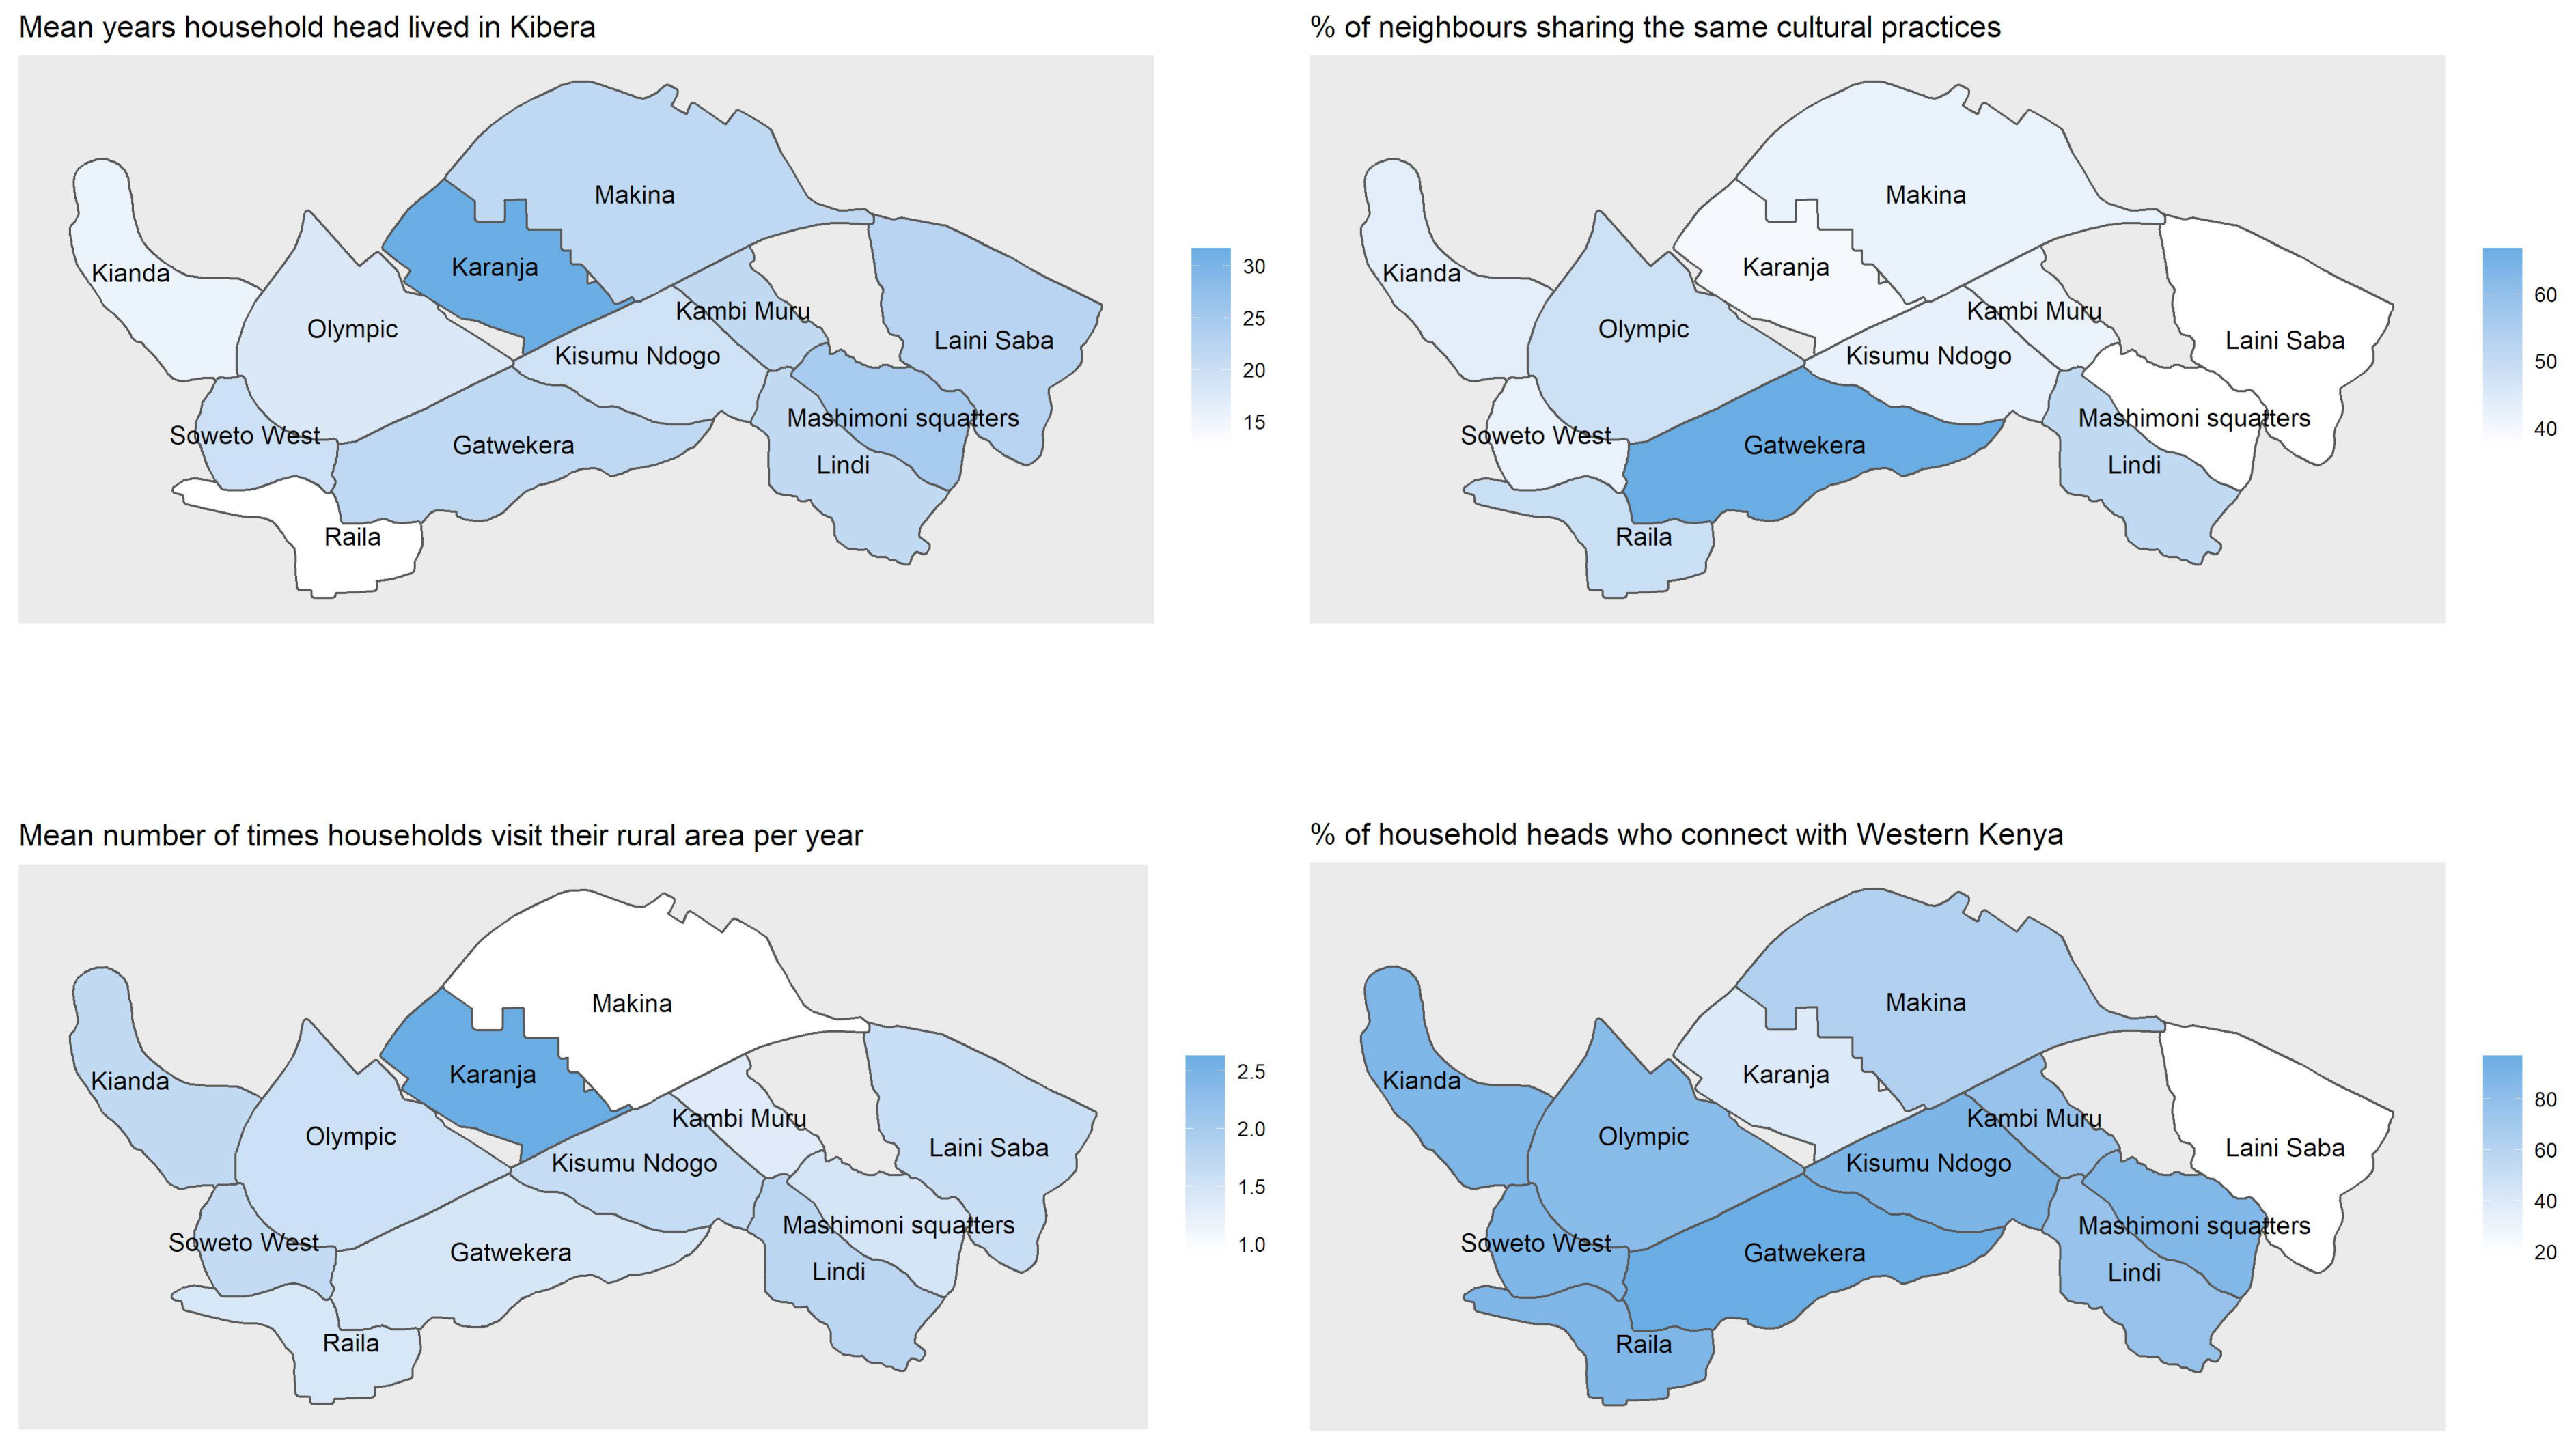
  • The differences across villages in Kibera are large and can be linked with the dominant tribe in the specific village. For instance, two villages (Laini Saba and Karanja) are dominated by tribes with less connectivity to rural areas in Western Kenya, with Laini Saba having a majority of Kamba and Kikuyu tribes who relate to the region of Mount Kenya and Eastern Kenya, and Karanja having most of the Nubians, who are not originally from Kenya, but were World War I veterans given temporary residence permits by the British colonial government between 1912 and 1934 [7,44]. The Luos and Luhyas are tribes from Western Kenya who in varying degrees dominate the other villages. Notably, also within these villages a series of welfare factors differ significantly, for instance, connection with Western Kenya, owning land in rural areas, access to steady electricity and trust in county government;
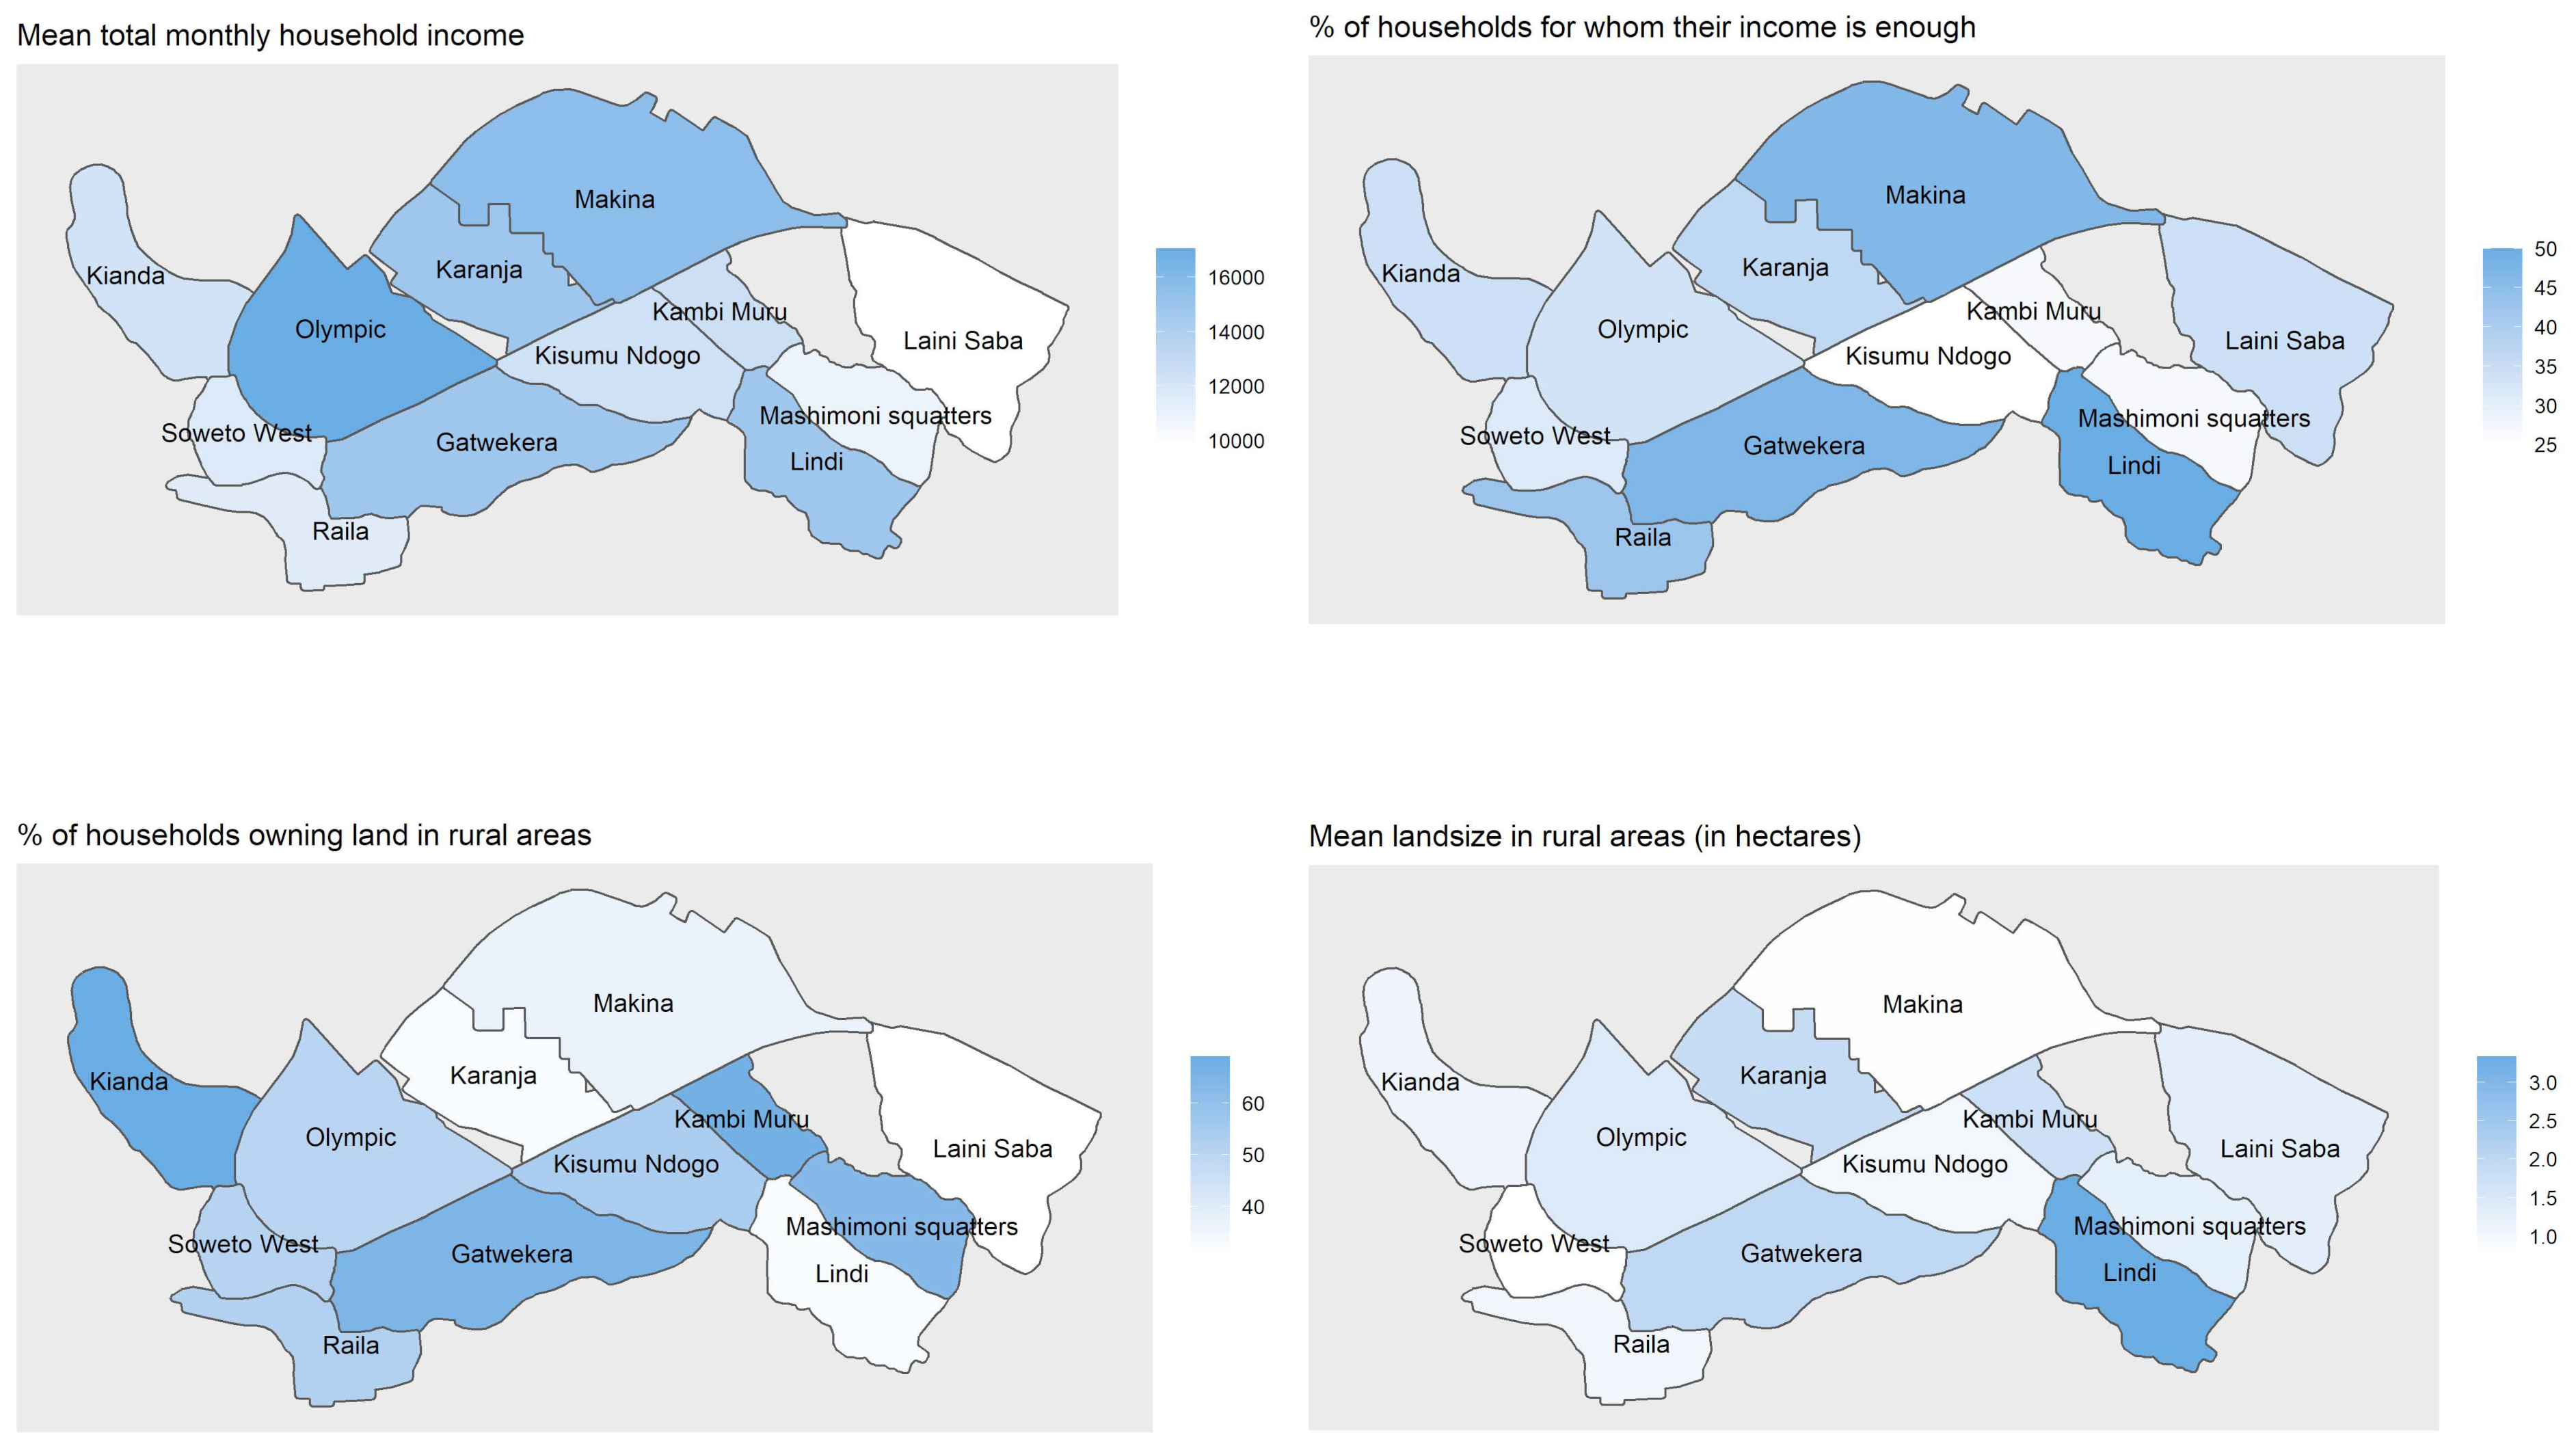
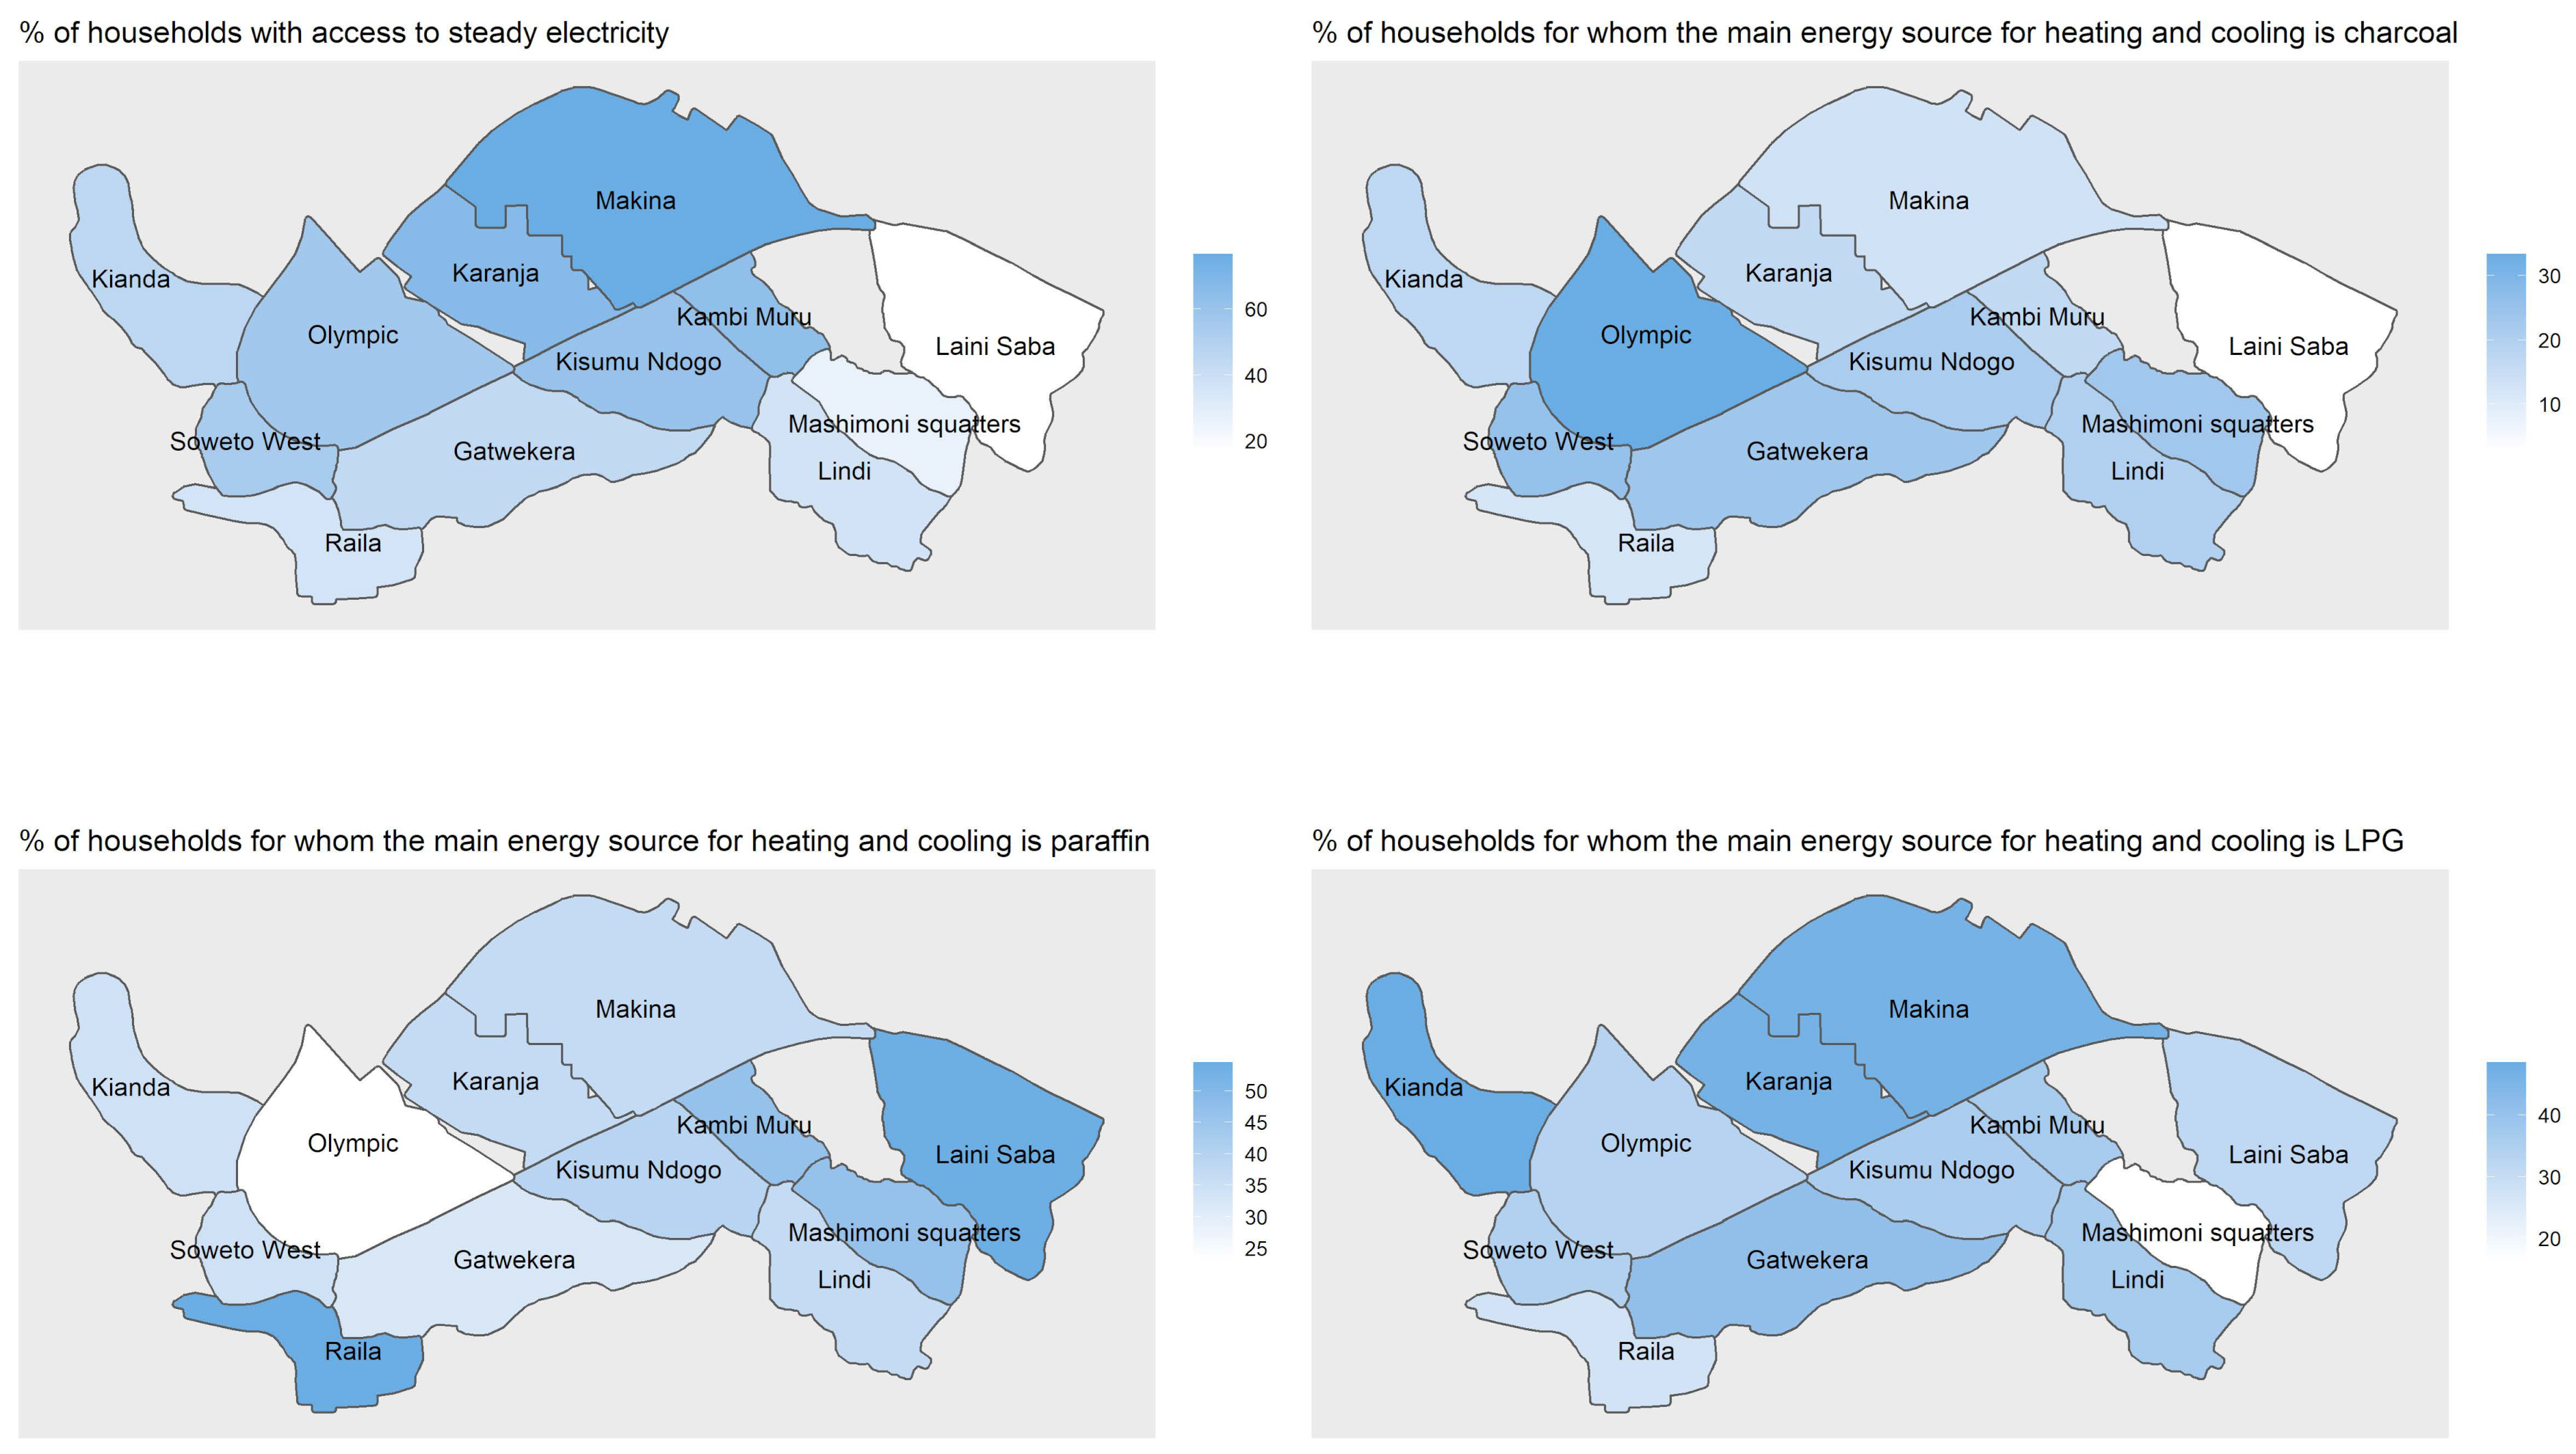
  • The selected income factors differ across the villages, with Laini Saba having the lowest, and Olympic having the highest average income levels. The variability in owning land in rural areas is high, ranging from a total of 69% owning land in Kianda, to only 33% owning land in Laini Saba. In addition, access to electricity varied highly across the villages, for which Makina ranged the highest, with 77% having access, to only 17% having access in Laini Saba;
  • The trust levels, ranging from 1 to 5 on a scale where 1 refers to lowest level of trust, and 5 the highest, was shown to be highest for ‘people from the village’, followed by ‘community leader in Kibera’. However, looking at the variability across the villages, the trust in the county government was significantly different from the average for a total of six villages. Only in Laini Saba was the trust in strangers higher than average;
  • Food insecurity measured on a HFIAS scale showed variability, with Laini Saba ranging the highest and Karanja, Makina and Lindi lowest, confirming higher food security in these three villages than average.
This study puts the informal settlements high up on the agenda as an area for fighting poverty and hunger, and to shape useful strategies with real impacts on the millions of people living in urban slums all over the world. People from rural areas are confronted with less land available to be split among family members due to generations with large numbers of children, resulting in extensive migration into cities in search for work. Eventually, Africa’s population is expected to double by 2050, for which two-thirds of this increase is projected in urban areas [55]. At the same time, the largest share of the world’s undernourished people is living in Eastern Africa [56].
With a new world order as a result of the war in Ukraine, it is further of interest to investigate how self-sustainable Kenya is, to feed its future population with reduced grain imports, increased grain and fuel prices because of this war, and the expectation of more frequent draughts threatening future crops.
To reach the millions of people living in informal settlements, it is advised that research and implementation go hand in hand. The approach in this survey can be replicated in future in Kibera to take account of changes over time, or be conducted in any other informal settlement to learn more about the differences in livelihood factors on a larger scale, across Kenya, or Sub-Saharan Africa, to assist any future investment programs aiming at zero hunger. This implies that solutions are searched for in close cooperation with local communities to arrive at affordability and accessibility of food products for low-income groups. To obtain real impacts, an in-depth understanding of the food system, including food security and resiliency and sustainability interrelationships, can ensure today’s policies and programs will contribute to fight poverty and hunger in a sustainable manner in future. Against this background, further research is advised on the following selected topics:
  • Outcomes of the food system were investigated in this study along with food security, inclusiveness and equitable benefits and sustainability and resiliency, but did not directly take safe and healthy diets into account. Although this was covered more substantially in the paper by Ayuya et al. [20] on fish nutrition in Kibera, it is recommended to further investigate safe and healthy diets, including the consumption of indigenous vegetables in informal settlements;
  • To achieve higher welfare with no increase in climate emissions it is recommended to investigate bottlenecks such as access to finance and access to affordable green energy-based innovations and their differences across villages, as well as to analyze the climate and welfare impacts of such innovations;
  • To achieve real impact, the informal economy must be understood and recognized as an equal partner. It is advised to investigate the potential to invest and set up business opportunities among the lowest income groups, in communities with high social capital [21].

Supplementary Materials

The following supporting information can be downloaded online. Video S1: Documentary of Kibera (Kibra): https://www.youtube.com/watch?v=K_goJu2encg&t=7s; Video S2: Documentary of Nyeri-Kibera food system: https://www.youtube.com/watch?v=b4oGoYuCnJ0.

Author Contributions

This paper was compiled and written by K.S., with inputs from all co-authors. While V.C.J.J. contributed with all the maps and inputs to the tests, O.I.A. contributed with interviews of all the households, and text contributions. B.O. contributed with a literature review. All authors were involved in the research design and paper conceptualization. All authors have read and agreed to the published version of the manuscript.

Funding

The Wageningen University & Research Programme on “Food Security and Valuing Water” that is supported by the Dutch Ministry of Agriculture, Nature and Food Security, in a project called Feeding cities and migration settlements (2282700540).

Institutional Review Board Statement

The data collection adhered to the Egerton University Data Policy.

Informed Consent Statement

The research sought informed consent from respondents by using a consent form during the interviews. Further, all research assistants were trained on ethical procedures and measures to protect confidentiality.

Data Availability Statement

All the data used in this survey is listed in Appendix A.

Acknowledgments

The authors would like to acknowledge the Wageningen University & Research Programme on “Food Security and Valuing Water” that is supported by the Dutch Ministry of Agriculture, Nature and Food Security, in a project called Feeding cities and migration settlements (2282700540). The authors would also like to sincerely thank Tinka Koster of Wageningen Economic Research (WUR), who assisted in preparing the household survey. Special appreciation also goes to the enumerators who played a big role in data collection. Special thanks go to Gabriel Francis Mwangi, who invited us to Kibera, set up the logistics of interviews and introduced us to the households to be interviewed. Finally, the authors would like to thank all the households who contributed with the interviews.

Conflicts of Interest

The authors declare no conflict of interest.

Appendix A. Statistical Tests of Discrepancies between Livelihood Factors in a Village and the Average in Kibera

Table A1. Means of livelihood factors across 12 villages of Kibera. Stars indicate the p-value of the t-test on the difference in means between of the village of interest and the other villages within Kibera, where + = p < 0.1, * = p < 0.05, ** = p < 0.01, *** = p < 0.001.
Kibera (total)GatwekeraKambi
Muru
KaranjaKiandaKisumu
Ndogo
Laini
Saba
LindiMakinaMashimoni
Squatters
OlympicRailaSoweto
West
Figure 3: Households (hh) origin (tribe)
% of hh belonging to the tribe Luhya34%12%**77%***13%*20%+46% 9%***47% 60%**67%***17%*33% 20%+
% of hh belonging to the tribe Luo33%76%***0%***27% 43% 43% 6%***30% 7%**17%*63%***36% 49%*
% of hh belonging to the tribe Kikuyu4%0% 0% 7% 0% 0% 23%***3% 0% 3% 0% 3% 9%
% of hh belonging to the tribe Kisii12%9% 0%*0%*37%***7% 6% 0%*7% 0%*10% 30%***26%**
% of hh belonging to the tribe Nubian8%0%+10% 43%***0%+0% 3% 13% 23%***3% 0% 0%+0%+
% of hh belonging to the tribe Kamba8%3% 10% 3% 11% 7% 34%***10% 0%+3% 10% 0%+0%+
Figure 4: Household (hh) practices
Mean years hh lived in Kibera20.721.47 21.2 31.7***15.4*19.4 22.4 21.1 21.4 24.5 17.9 12.8**19.9
% of neighbors sharing the same cultural practices45%67%***42% 40% 44% 43% 38%+51% 42% 38%+48% 49% 42%
Mean number of times hh visit their rural area per year1.601.44 1.33 2.63**1.69 1.64 1.60 1.77 0.93+1.47 1.57 1.42 1.66
% of hh head who connect with Western Kenya75%97%**77% 40%***89%*89%+20%***77% 63% 87% 83% 88%+89%*
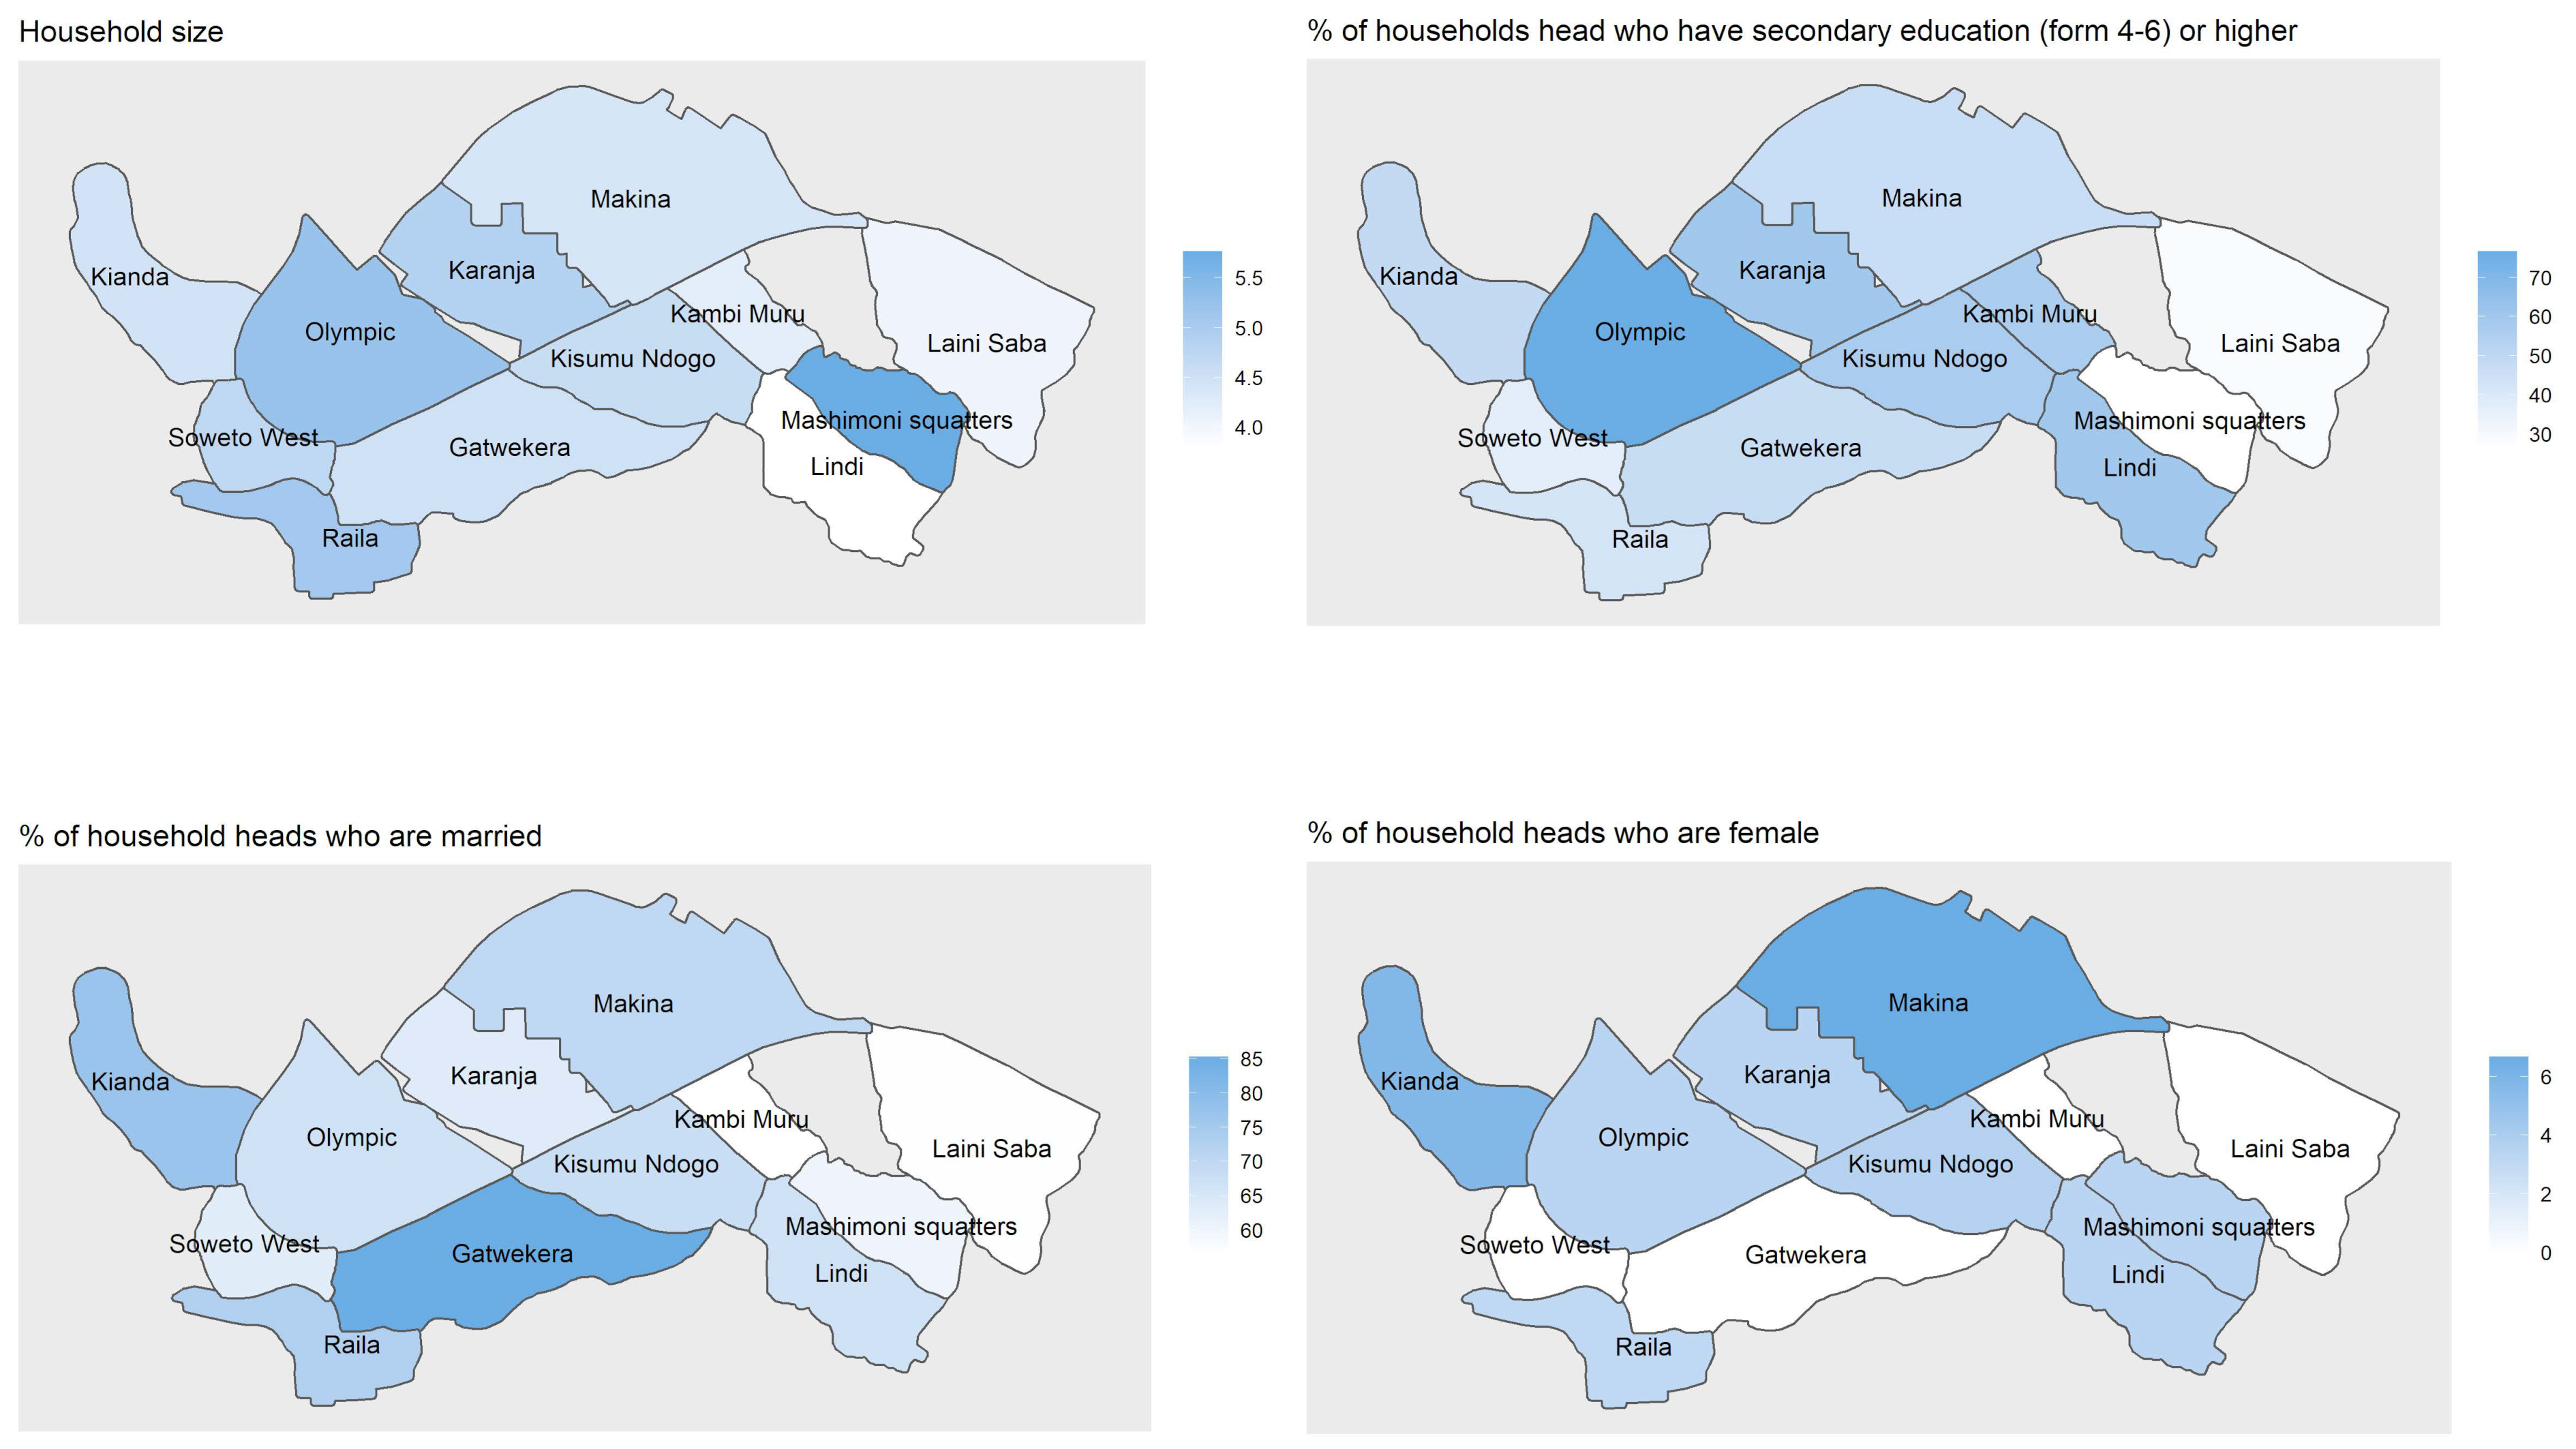
Figure 5: Household (hh) characteristics
Household size4.634.50 4.20 4.90 4.50 4.60 4.00+3.80*4.40 5.80**5.20+5.10 4.70
% of hh heads who have secondary education (from 4–6 years) or higher48%47% 57% 60% 49% 57% 29%*60% 47% 27%*77%**42% 37%
% of hh heads who are married67%85%*57% 63% 77% 68% 57% 67% 70% 60% 67% 73% 63%
% of hh heads who are female3%0% 0% 3% 6% 4% 0% 3% 7% 3% 3% 3% 0%
Figure 6: Household (hh) welfare
Mean monthly income (KES)13,09414,726 12,555 14,827 12,267 12,411 9840*14,703 15,578 10,843 17,053*11,506 11,684
% of hh for whom their income is enough 36%47% 27% 37% 34% 25% 34% 50% 47% 27% 33% 42% 31%
% of hh owning land in rural areas 51%65%+67%+33%*69%*54% 31%*33%*37% 63% 50% 52% 51%
Mean land size in rural areas (hectares)1.411.97 1.74 1.85 1.10 1.03 1.31 3.33**0.83 1.27 1.43 1.06 0.78
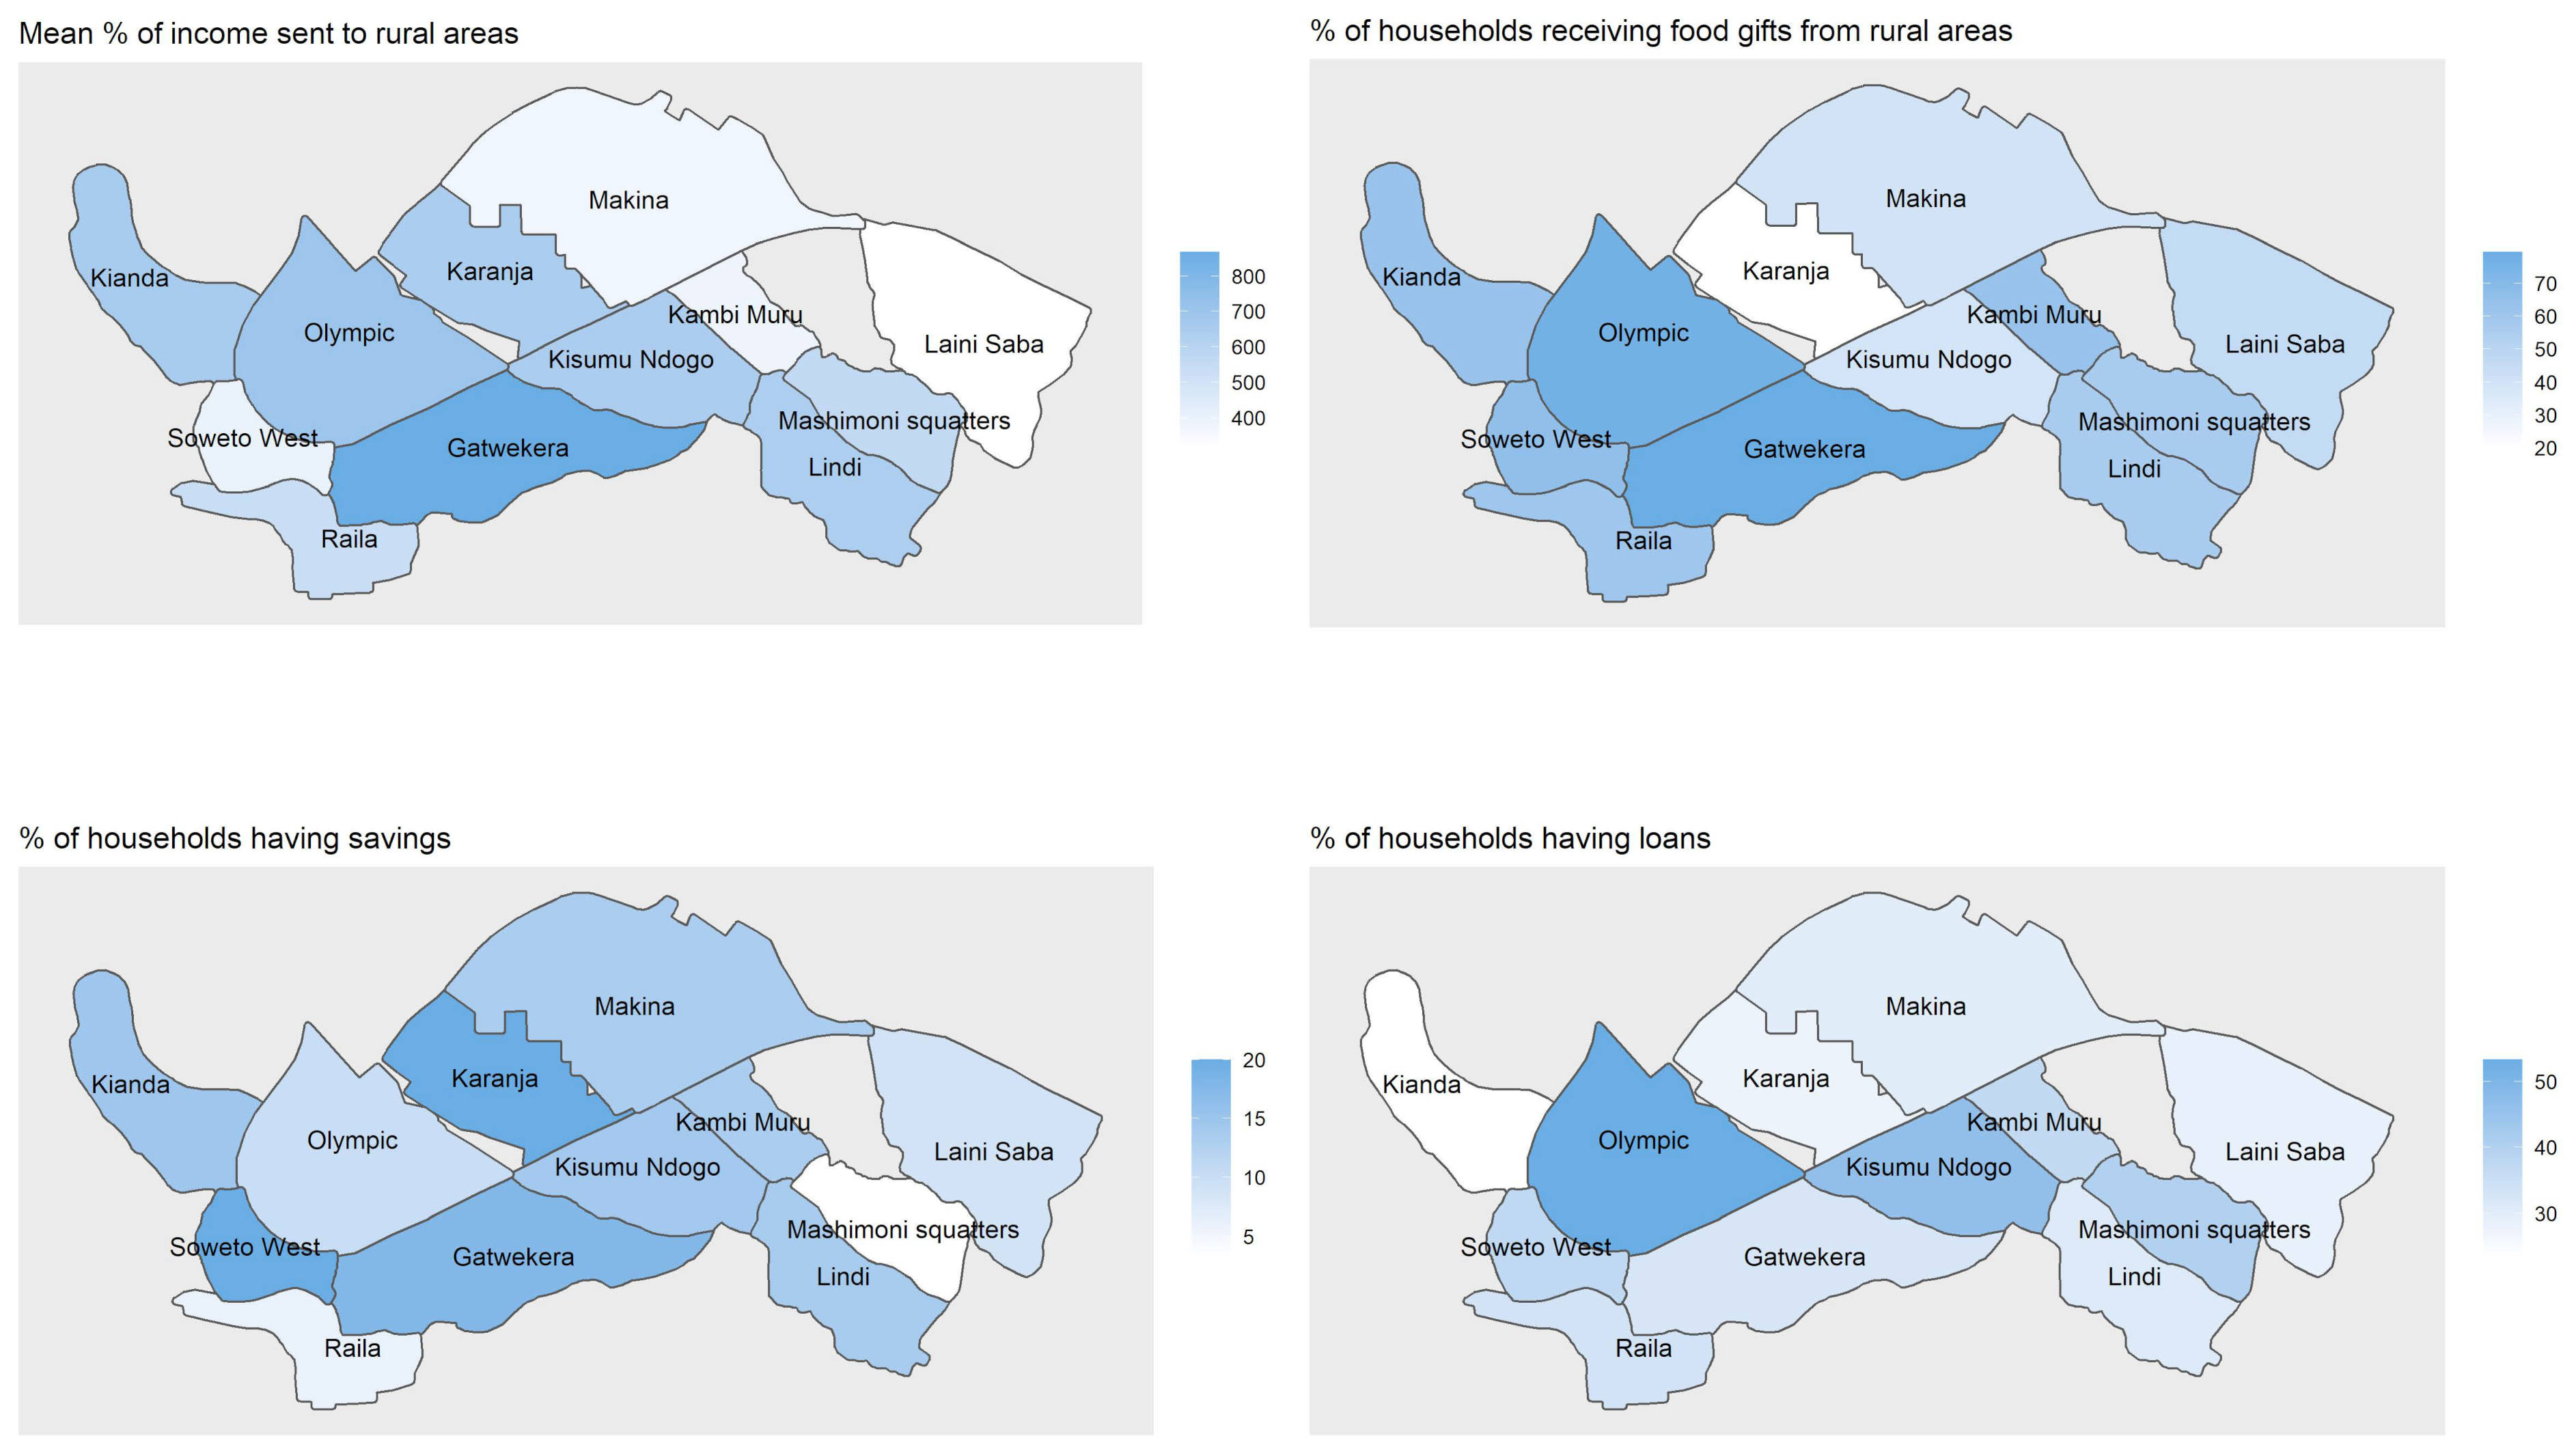
Figure 7: Household (hh) spending and loans
Mean % of income sent to rural areas6%9%*4% 6% 7% 6% 3%*6% 4% 6% 7% 5% 4%
% of hh receiving food gifts56%79%**63% 20%***63% 39%+46% 57% 40%+57% 77%*61% 66%
% of hh having savings13%18% 13% 20% 15% 14% 9% 14% 13% 3% 10% 6% 20%
% of hh having loans35%32% 37% 28% 24% 46% 29% 31% 30% 40% 53%*33% 37%
Figure 8: Household (hh) use of energy source
% of hh having access to steady electricity48%44% 63%+67%*46% 61% 17%***37% 77%**27%*57% 36% 54%
% of hh using of charcoal as energy source19%24% 17% 17% 17% 21% 3%*20% 13% 23% 33%*12% 26%
% of hh using paraffin as energy source40%32% 47% 37% 34% 39% 54%+37% 37% 47% 23%+55%+34%
% of hh using LPG as energy source36%41% 37% 47% 49% 36% 31% 37% 47% 17%*33% 27% 34%
Figure 9: Trust relations on a scale from 1 (low) to 5 (high)
Trust in strangers (1–5)2.061.97 2.13 2.17 2.11 1.75 2.54**1.79 1.97 1.97 1.87 2.09 2.26
Trust in people from the village (1–5)3.012.88 3.20 3.30 2.77 3.04 2.94 2.83 3.13 3.4+2.73 3.15 2.77
Trust in national government (1–5)2.422.64 2.130 2.57 2.66 2.79 2.09 2.17 2.72 2.97*2.07 2.06+2.24
Trust in county government (1–5)2.272.59+1.90+2.62+2.06 2.39 2.23 2.27 2.47 2.62+1.85+1.91+2.30
Trust in local politicians (1–5)2.012.32 1.70 2.23 1.86 2.14 1.97 1.83 2.27 2.23 1.89 1.82 1.91
Trust in community leader (1–5)2.462.73 2.37 2.53 2.15 2.44 2.06+2.63 2.93*2.80 2.43 2.52 2.09+
Figure 10: Food insecurity
Hh Food Insecurity Access Scale (HFIAS) scores7.978.47 8.63 6.20*7.89 7.36 9.40+6.13*6.37+9.23 8.50 9.27 7.71

References

  1. Archambault, C.S.; De Laat, J.; Zulu, E.M. Urban services and child migration to the slums of Nairobi. World Dev. 2012, 40, 1854–1869. [Google Scholar] [CrossRef]
  2. Gallaher, C.M.; Kerr, J.M.; Njenga, M.; Karanja, N.K.; WinklerPrins, A.M.G.A. Urban agriculture, social capital, and food security in the Kibera slums of Nairobi, Kenya. Agric. Hum. Values 2013, 30, 389–404. [Google Scholar] [CrossRef]
  3. Olack, B.; Feikin, D.R.; Cosmas, L.O.; Odero, K.O.; Okoth, G.O.; Montgomery, J.M.; Breiman, R.F. Mortality Trends Observed in Population-Based Surveillance of an Urban Slum Settlement, Kibera, Kenya, 2007–2010. PLoS ONE 2014, 9, e85913. [Google Scholar] [CrossRef]
  4. Beyer, L.I.; Chaudhuri, J.; Kagima, B. Kenya’s focus on urban vulnerability and resilience in the midst of urban transitions in Nairobi. Dev. South Afr. 2016, 33, 3–22. [Google Scholar] [CrossRef]
  5. Crow, B.; Odaba, E. Access to water in a Nairobi slum: Women’s work and institutional learning. Water Int. 2010, 35, 733–747. [Google Scholar] [CrossRef]
  6. Achungo, B.C. The Social Transformation of the people living in Kibera Slum in Nairobi County following the Kenya Slum upgrading programme. Master’s Thesis, University of Nairobi, Nairobi, Kenya, 11 July 2014. [Google Scholar]
  7. Kibere, F.N. The Capability of Mobility in Kibera’ Slum’, Kenya: An Ethnographic Study of How Young People Use and Appropriate New Media and ICTS. Ph.D. Thesis, University of Leicester, Leicester, UK, 6 June 2016. [Google Scholar]
  8. Ngongo, C.J.; Mathingau, F.A.; Burke, H.; Brieger, W.; Frick, K.; Chapman, K.; Breiman, R. Community Par-ticipation to refine measures of socio-economic status in urban settings in Kenya. Int. Q. Community Health Educ. 2008, 28, 33–49. [Google Scholar] [CrossRef] [PubMed]
  9. Seal, D.; Bown, R.T.; Parker, A.H. Penetrometer tests on 109 pit latrines in Kibera, Nairobi, Kenya. Water SA 2018, 44, 1816–7950. [Google Scholar] [CrossRef]
  10. KNBS. Kenya Population and Housing Census: Vol 1: Population by County and Sub-County; Kenya National Bureau of Statistics: Nairobi, Kenya, 2019; p. 49. [Google Scholar]
  11. Gulyani, S.; Talukdar, D. Informal Rental Markets: The Low-Quality, High-Price Puzzle in Nairobi’s Slums. In Urban Land Markets; Lall, S.V., Freire, M., Yuen, B., Rajack, R., Helluin, J.J., Eds.; Springer: Dordrecht, The Netherlands, 2009; pp. 191–223. [Google Scholar]
  12. Marras, S. Mapping the Unmapped; University of Milano-Bicocca: Milano, Italia, 2012; p. 4. Available online: http://mapkiberaproject.yolasite.com/resources/Kibera_mapping_the_unmapped.pdf (accessed on 19 August 2022).
  13. Lunch Bowl Network. 1.5 mill Luncbowl. Facts and Information about Kibera. 2015. Available online: http://www.lunchbowl.org/the-kibera.html (accessed on 19 August 2022).
  14. De Bercegol, R.; Monstadt, J. The Kenya slum electrification program. Local politics of electricity networks in Kibera. Energy Res. Soc. Sci. 2018, 41, 249–258. [Google Scholar] [CrossRef]
  15. Ongosi, A.N.; Gericke, G.; Mbuthia, E.; Oelofse, A. Food variety, dietary diversity and perceived hunger among lactating women (0-6 months postpartum) in a low socio-economic area in Nairobi, Kenya. Afr. J. Food Agric. Nutr. Dev. 2014, 14, 8663–8675. [Google Scholar] [CrossRef]
  16. Desgroppes, A.; Taupin, S. Kibera: The Biggest Slum in Africa? East Afr. Rev. 2011, 44, 23–33. [Google Scholar] [CrossRef]
  17. Van Berkum, S.; Dengerink, J.; Ruben, R. The Food Systems Approach: Sustainable Solutions for a Sufficient Supply of Healthy Food; Memorandum 2018-064; Wageningen Economic Research: Wageningen, The Netherlands, 2018; p. 34. [Google Scholar]
  18. Van Berkum, S.; Broeze, J.; Herens, M.; de Rooij, B.; Soma, K.; Roosendaal, L. Urbanisation, Migration and Food System Transformations: Concepts and Methodologies for a Better Understanding of the Dynamics of Urban Food Systems and Migration Settlements; REPORT 2020-046; Wageningen University and Research: Wageningen, The Netherlands; Wageningen Economic Research: The Hague, The Netherlands, 2020; p. 34. [Google Scholar]
  19. HLPE. Food Losses and Waste in the Context of Sustainable Food Systems; High Level of Experts on Food Security and Nutrition; Committee on World Food Security: Rome, Italy, 2014; p. 117. [Google Scholar]
  20. Ayuya, O.; Soma, K.; Obwanga, B. Socio-Economic Drivers of Fish Species Consumption Preferences in Kenya’s Urban Informal Food System. Sustainability 2021, 13, 5278. [Google Scholar] [CrossRef]
  21. Termeer, E.E.W.; Soma, K.; Motovska, N.; Ayuya, O.I.; Kunz, M.; Koster, T. Sustainable Development Ensued by Social Capital Impacts on Food Insecurity: The Case of Kibera, Nairobi. Sustainability 2022, 14, 5504. [Google Scholar] [CrossRef]
  22. Soma, K.; Dijkshoorn-Dekker, M.W.C.; Polman, N.B.P. Stakeholder contributions through transitions to-wards urban sustainability. Sustain. Cities Soc. 2018, 37, 438. [Google Scholar] [CrossRef]
  23. Brückweh, K. The Head of Household. Administory 2016, 1, 107–123. [Google Scholar] [CrossRef]
  24. Swaney, J.A. Elements of a Neoinstitutional Environmental Economics. J. Econ. Issues 1987, 21, 1739–1779. [Google Scholar] [CrossRef]
  25. Ostrom, E. Understanding Institutional Diversity; Princeton University Press: Oxford, UK, 2009; p. 357. [Google Scholar]
  26. Soma, K.; Vatn, A. Is there anything like a citizen? A descriptive analysis of instituting a citizen’s role to represent social values at the municipal level. Environ. Policy Gov. 2010, 20, 30–43. [Google Scholar] [CrossRef]
  27. Soma, K.; Obwanga, B.; Kanyuguto, C. A New Rural-Urban Fish Food System Was Established in Kenya–Learning from Best Practices. Sustainability 2021, 13, 7254. [Google Scholar] [CrossRef]
  28. Fresco, L.O.; Ruben, R.; Herens, M. Challenges and perspectives for supporting sustainable and inclusive food systems. GREAT Insights Mag 2017, 6, 13–15. [Google Scholar]
  29. UNEP. Food Systems and Natural Resources. In A Report of the Working Group on Food Systems of the International Resource Panel; Westhoek, H., Ingram, J., van Berkum, S., Özay, L., Hajer, M., Eds.; United Nations Environment Programme (UNEP): Geneva, Switzerland, 2016; p. 34. [Google Scholar]
  30. GLOPAN. Food Systems and Diets: Facing the Challenges of the 21st Century; Global Panel on Agriculture and Food Systems for Nutrition: London, UK, 2016; p. 133. [Google Scholar]
  31. Béné, C.; Mehta, L.; McGranahan, G.; Cannon, T.; Gupte, J.; Tanner, T. Resilience as a policy narrative: Po-tentials and limits in the context of urban planning. Clim. Dev. 2018, 10, 116–133. [Google Scholar] [CrossRef]
  32. Herrero, M.; Thornton, P.K.; Mason-D’Croz, D.; Palmer, J.; Bodirsky, B.L.; Pradhan, P.; Barrett, C.B.; Benton, T.G.; Hall, A.; Pikaar, I. Articulating the effect of food systems innovation on the Sustainable Development Goals. Lancet Planet Health 2021, 5, e50–e62. [Google Scholar] [CrossRef]
  33. Blay-Palmer, A.; Santini, G.; Dubbeling, M.; Renting, H.; Taguchi, M.; Giordano, T. Validating the City Region Food System Approach: Enacting Inclusive, Transformational City Region Food Systems. Sustainability 2018, 10, 1680. [Google Scholar] [CrossRef] [Green Version]
  34. Coates, J.; Swindale, A.; Bilinsky, P. Household Food Insecurity Access Scale (HFIAS) for Measurement of Food Access: Indicator Guide: Version 3; Food and Nutrition Technical Assistance Project; Academy for Educational Development: Washington, DC, USA, 2007. [Google Scholar] [CrossRef]
  35. R Core Team. R: A Language and Environment for Statistical Computing. R Foundation for Statistical Computing, Vienna, Austria. 2013. Available online: https://www.R-project.org/ (accessed on 1 June 2021).
  36. StataCorp. Stata Statistical Software: Release 14; StataCorp LP.: College Station, TX, USA, 2015. [Google Scholar]
  37. Gallaher, C.M. Livelihoods, Food Security and Environmental Risk: Sack Gardening in the Kibera Slums of Nairobi, Kenya. PhD Thesis, Michigan State University, East Lansing, MI, USA, 2012. [Google Scholar]
  38. Otene, I.J.J.; Murray, P.; Enongene, K.E. The Potential Reduction of Carbon Dioxide (CO2) Emissions from Gas Flaring in Nigeria’s Oil and Gas Industry through Alternative Productive Use. Environments 2016, 3, 31. [Google Scholar] [CrossRef]
  39. Tripathi, L.; Mishra, A.; Dubey, A.K.; Tripathi, C.; Baredar, P. Renewable energy: An overview on its contribution in current energy scenario of India. Renew. Sustain. Energy Rev. 2016, 60, 226–233. [Google Scholar] [CrossRef]
  40. Van Niekerk, A.; Govender, R.; Hornsby, N.; Swart, L. Household and caregiver characteristics and behav-iours as predictors of unsafe exposure of children to para n appliances. Burns 2017, 43, 866–876. [Google Scholar]
  41. Chege, P.M.; Kimiywe, J.O.; Ndung’U, Z. Influence of culture on dietary practices of children under five years among Maasai pastoralists in Kajiado, Kenya. Int. J. Behav. Nutr. Phys. Act. 2015, 12, 131. [Google Scholar] [CrossRef]
  42. Mutisya, E.; Yarime, M. Understanding the grassroots dynamics of slums in Nairobi: The dilemma of Kibera informal settlements. Int. Trans. J. Eng. Manag. Appl. Sci. Technol. 2011, 2, 197–213. [Google Scholar]
  43. Kihato, C.W. “Go back and tell them who the real men are!” Gendering our understanding of Kibera’s post-election violence. Int. J. Confl. Violence (IJCV) 2015, 9, 12–24. [Google Scholar]
  44. de Smedt, J.V.A. The Nubis of Kibera: A Social History of the Nubians and Kibera Slums. Ph.D. Thesis, Leiden University,, Leiden, The Netherlands, 12 May 2011. [Google Scholar]
  45. Elfversson, E.; Höglund, K. Home of last resort: Urban land conflict and the Nubians in Kibera, Kenya. Urban Stud. 2017, 55, 1749–1765. [Google Scholar] [CrossRef]
  46. Chege, P.; Kuria, E.; Kimiywe, J. A comparative study on dietary practices, morbidity patterns and nutrition status of HIV/AIDS infected and non-infected pre-school children in Kibera slum, Kenya. J. Appl. Biosci. 2010, 32, 2008–2014. [Google Scholar]
  47. Gallaher, C.M.; WinklerPrins, A.M.G.A.; Njenga, M.; Karanja, N.K. Creating Space: Sack Gardening as a Livelihood Strategy in the Kibera Slums of Nairobi, Kenya. J. Agric. Food Syst. Community Dev. 2015, 1–19. [Google Scholar] [CrossRef]
  48. Muneri, C.W. Health Risks Associated with Wastewater Used for Irrigation in Urban Agriculture, in Nairobi Kenya. Ph.D. Thesis, University of Nairobi, Nairobi, Kenya, 2011. [Google Scholar]
  49. Berry, E.M.; Dernini, S.; Burlingame, B.; Meybeck, A.; Conforti, P. Food security and sustainability: Can one exist without the other? Public Health Nutr. 2015, 18, 2293–2302. [Google Scholar] [CrossRef]
  50. Ndolo, G.M. An Assessment of Clean Energy Use for Cooking in Gatwekera of Kibera, Nairobi County. Ph.D. Thesis, University of Nairobi, Nairobi, Kenya, 11 December 2017. [Google Scholar]
  51. Sovacool, B.K. Clean, low-carbon but corrupt? Examining corruption risks and solutions for the renewable energy sector in Mexico, Malaysia, Kenya and South Africa. Energy Strat. Rev. 2021, 38, 100723. [Google Scholar] [CrossRef]
  52. ILO. Women and Men in the Informal Economy—A Statistical Picture, 3rd ed.; International Labour Office (ILO): Geneva, Switzerland, 2018; p. 164. Available online: https://www.ilo.org/wcmsp5/groups/public/---dgreports/---dcomm/documents/publication/wcms_626831.pdf (accessed on 6 July 2022).
  53. Mekonnen, D.A.; Termeer, E.; Soma, K.; van Berkum, S.; Piters, B.d.S. Wass How to Engage Informal Midstream Agribusiness in Enhancing Food System Outcomes: What We Know and What We Need to Know Better; Wageningen Economic Research: Wageningen, Netherlands, 2022. [Google Scholar] [CrossRef]
  54. Marusic, A.; Nielsen, W.; Ghossein, T.; Solf, S. Re-thinking the Approach to Informal Businesses: Typologies, Evidence and Future Exploration; The World Bank Group, Open Knowledge Repository: Washington, DC, USA, 2020; p. 28. Available online: https://openknowledge.worldbank.org/handle/10986/34814 (accessed on 6 July 2022).
  55. OECD/SWAC. Africa’s Urbanisation Dynamics; Africapolis, Mapping a New Urban Geography; West African Studies: Dakar, Senegal; OECD Publishing: Paris, France, 2020. [Google Scholar] [CrossRef]
  56. FAO. The State of Food Security and Nutrition in the World 2021; Transforming Food Systems for Affordable Healthy Diets; FAO: Rome, Italy, 2021; p. 240. Available online: https://www.fao.org/publications/sofi/2021/en/ (accessed on 19 August 2022).
Figure 1. A food system approach involving interactional dynamics between food system activities, socio-economic drivers and environmental drivers, and the governance therein. In transitioning towards the Sustainable Development Goals (SDGs), outcomes are observed in relation to safe and healthy diets, food security, inclusiveness and equitable benefits, as well as sustainability and resilience [17].
Sustainability 14 11099 g001
Figure 2. Map of Kibera indicating the 12 villages included in the analyses.
Sustainability 14 11099 g002
Figure 3. Main tribe distribution across 12 villages in Kibera.
Sustainability 14 11099 g003
Figure 4. Household practices across 12 villages in Kibera.
Sustainability 14 11099 g004
Figure 5. Household characteristics across 12 villages in Kibera.
Sustainability 14 11099 g005
Figure 6. Comparing income and landownership welfare factors across 12 villages in Kibera.
Sustainability 14 11099 g006
Figure 7. Comparing spending and loans welfare factors across 12 villages in Kibera.
Sustainability 14 11099 g007
Figure 8. Comparing electricity access and sources across 12 villages in Kibera.
Sustainability 14 11099 g008
Figure 9. Comparing trust levels across 12 villages in Kibera.
Sustainability 14 11099 g009
Figure 10. Comparing food insecurity across 12 villages in Kibera.
Sustainability 14 11099 g010
Table 1. Overview of number (N) of households interviewed, % of households represented by male, and mean age across 12 of the 13 villages of Kibera.
GatwekeraKambi
Muru
KaranjaKiandaKisumu
Ndogo
Laini
Saba
LindiMakinaMashimoni
Squatters
OlympicRailaSoweto
West
N343030352835303030303335
% Male0.820.830.770.690.820.830.670.770.770.600.750.74
Mean age36.843.239.531.536.837.936.136.442.133.534.238.7
Publisher’s Note: MDPI stays neutral with regard to jurisdictional claims in published maps and institutional affiliations.

