5.1. Results
The eco-efficiencies for the 284 Chinese cities are shown in the map below, based on their location. Their colors reveal the eco-efficiency and sub-efficiency according to our calculations. Our sample covered most Chinese cities, especially those in the eastern and interior region.
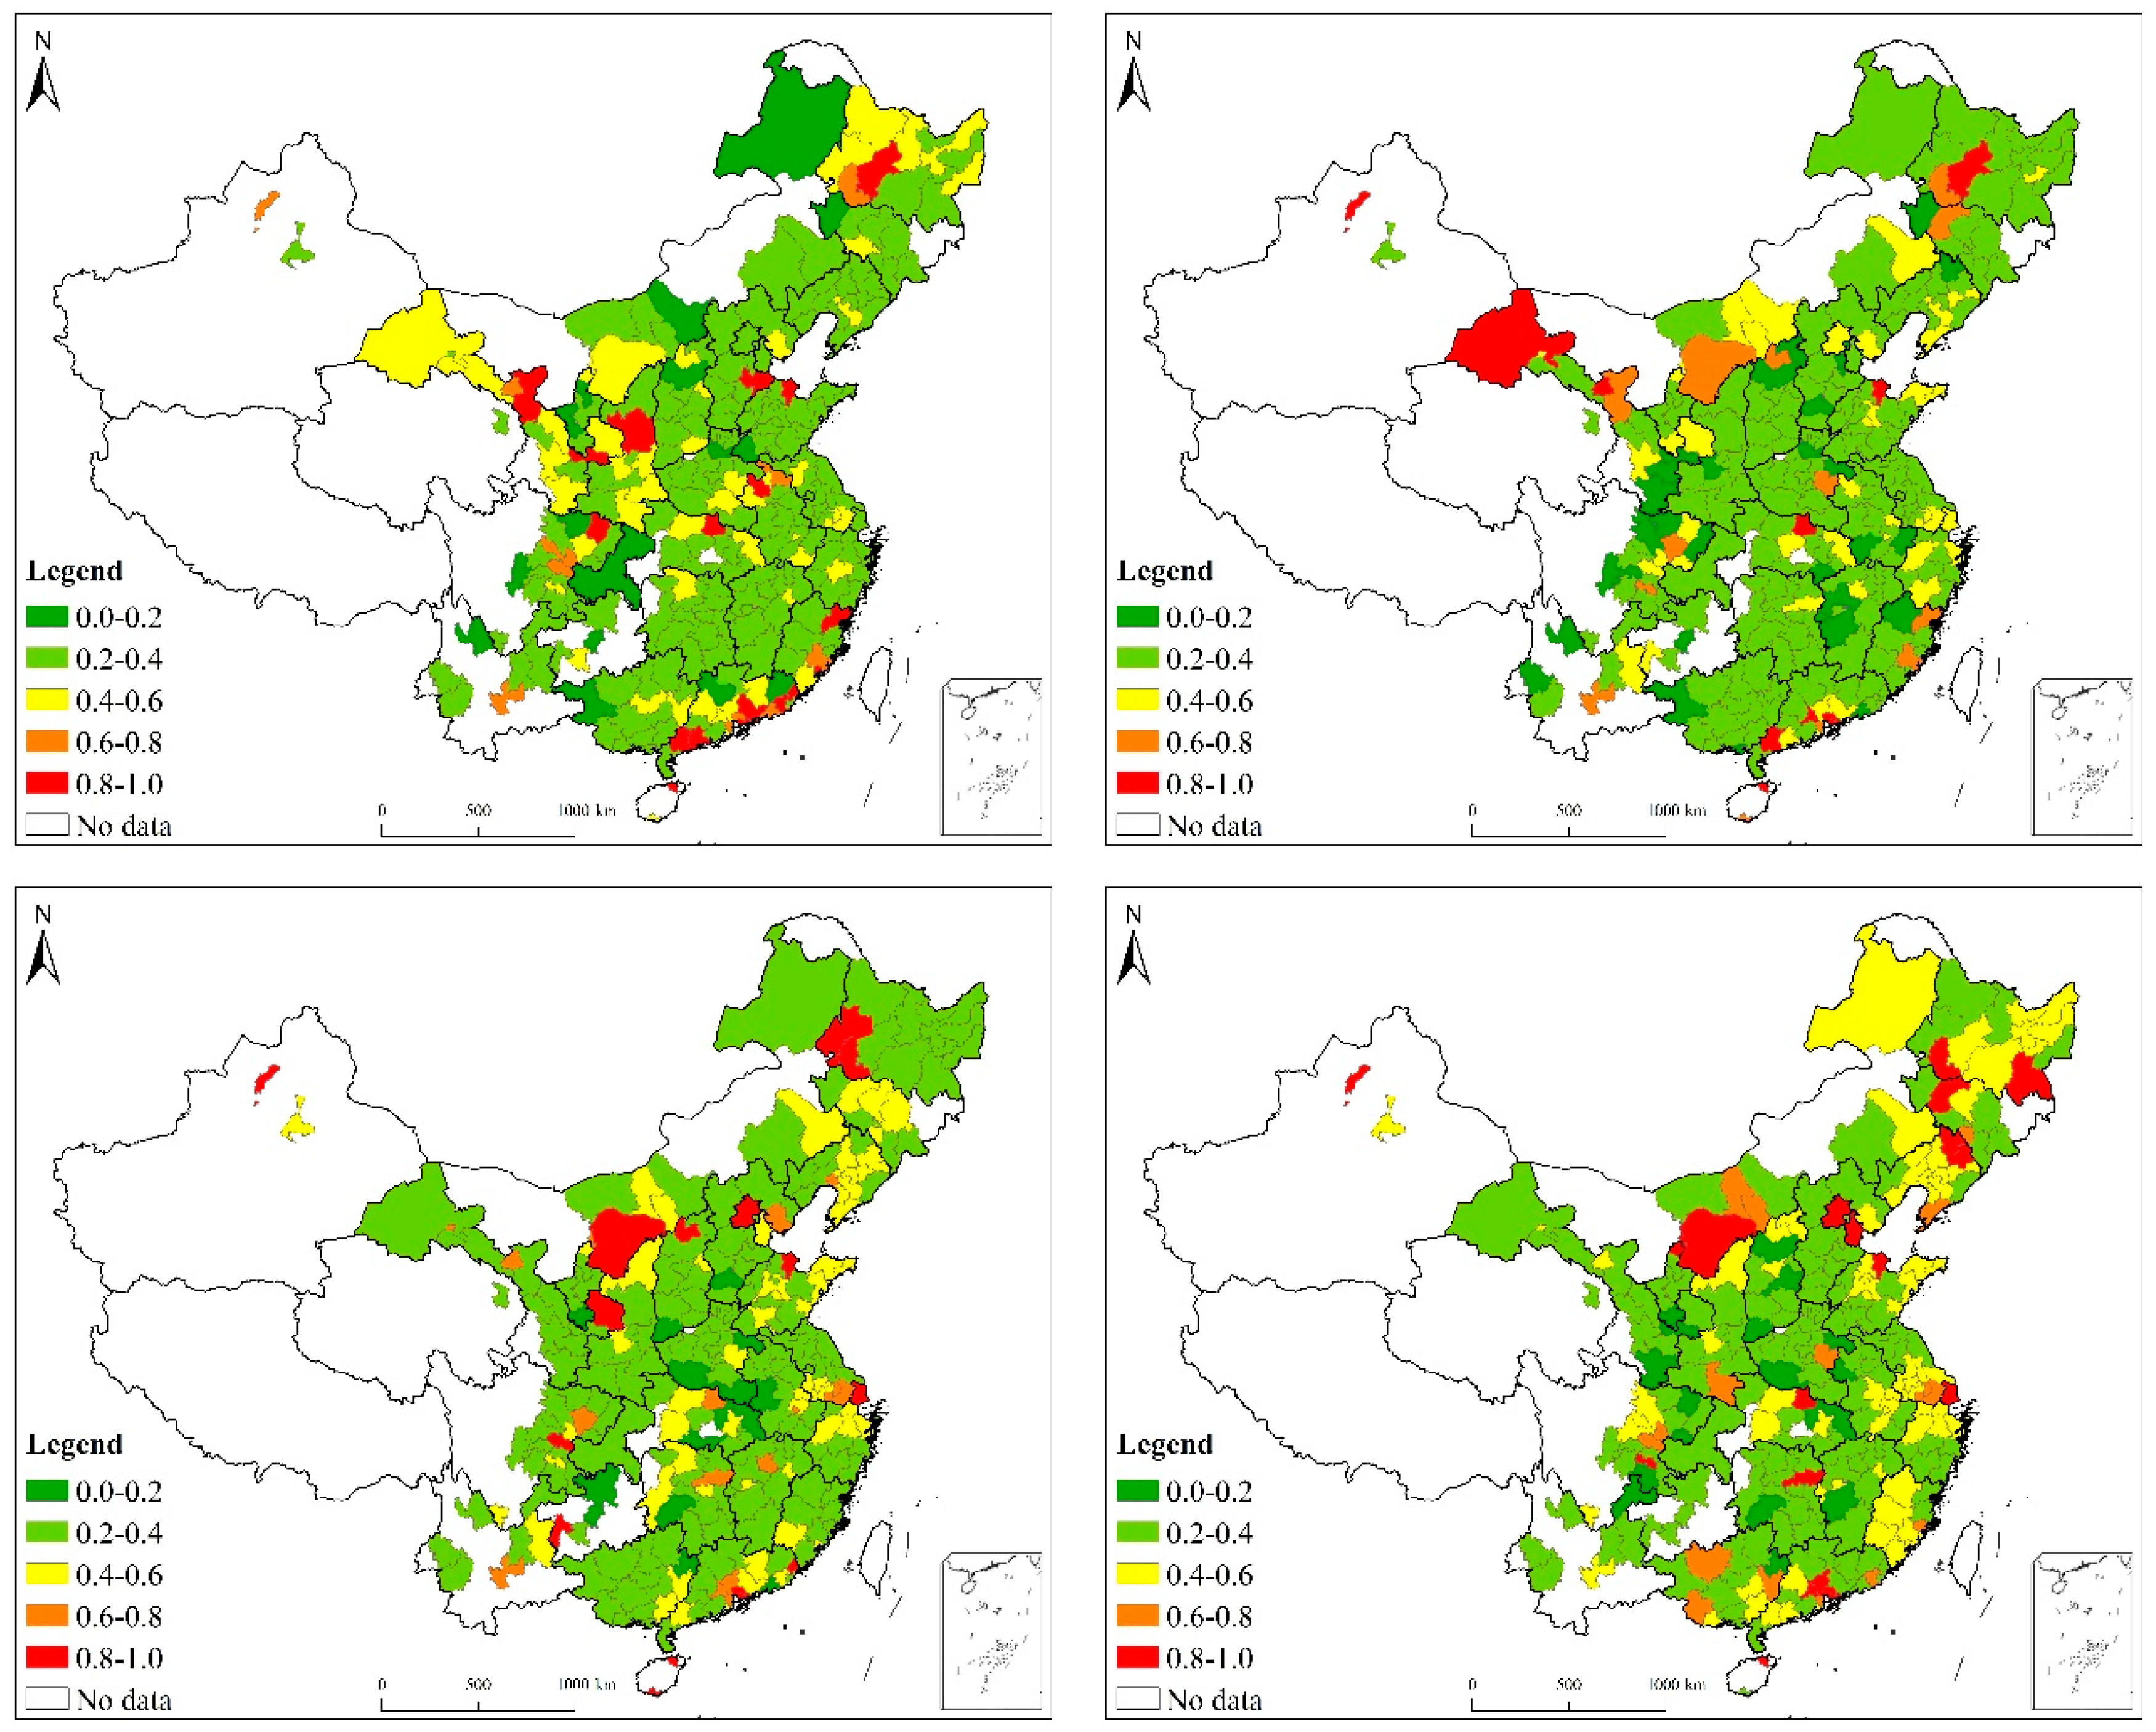
Figure 2 presents the result of sub-efficiency of step 1 in 4 different observation years. The first row shows the situations in 2005 and 2009, while the second row presents those in 2013 and 2016. In these pictures green is the most evident color, indicating that the performance of cities remains to some extent stable during the whole period. However, there is still some structural evolution at this stage. In the western area, the number of yellow and red cities, even in some eastern and coastal regions, tends to decrease, especially in the second decade of the 21st century. Only metropolitan cities such as Beijing, Shanghai, and some northeastern cities realize efficiency improvement in economic development during these 12 years.
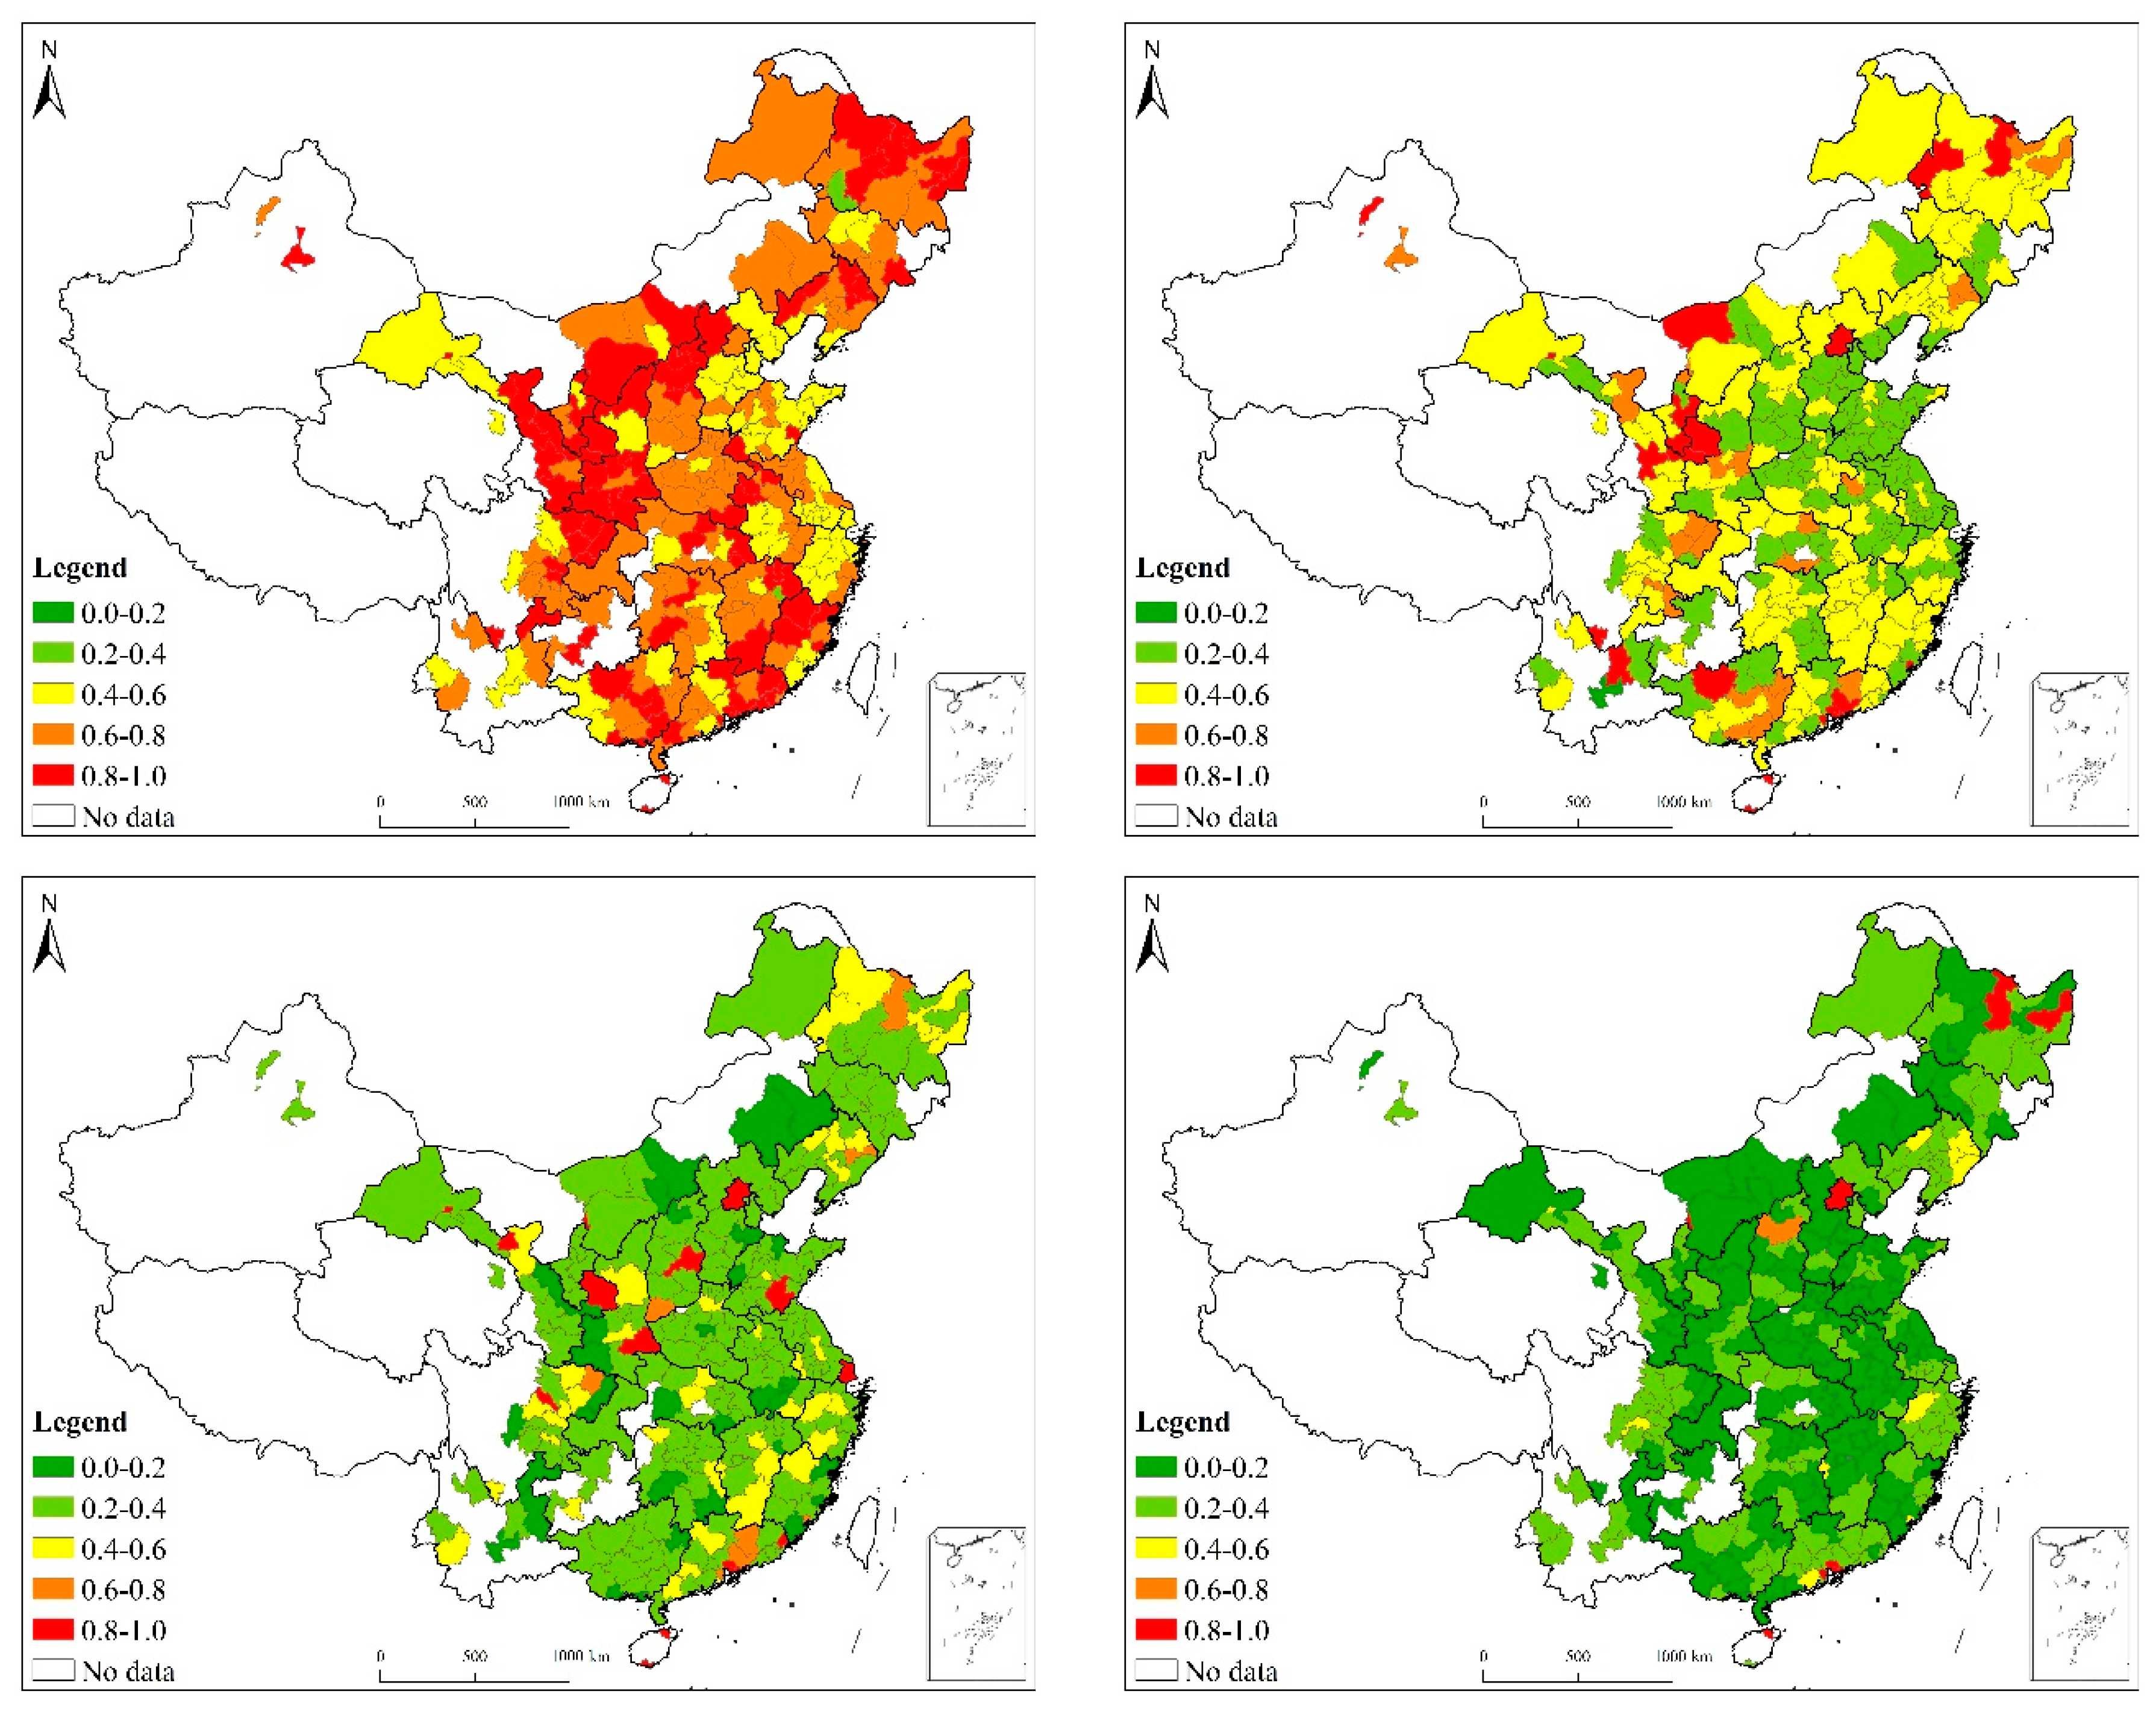
Figure 3 shows the results of sub-efficiency in step 2 for different years. In 2005, most Chinese cities had a sub-efficiency value of more than 0.4, causing the main colors of that figure to become yellow, orange, or even red, while the decreasing trend is quite obvious. In 2016 there were no more than ten cities whose color was not green, indicating that cities all around China have experienced a significant decline in their sustainable consumption and distribution the urban development process. This confirms that most Chinese cities did not perform better on municipal construction to make them more livable and sustainable. Only regions such as Beijing, Yangtze River Delta, Pearl River Delta, and some northeastern cities retained a relatively higher level of sub-efficiency at the end of the observation period.
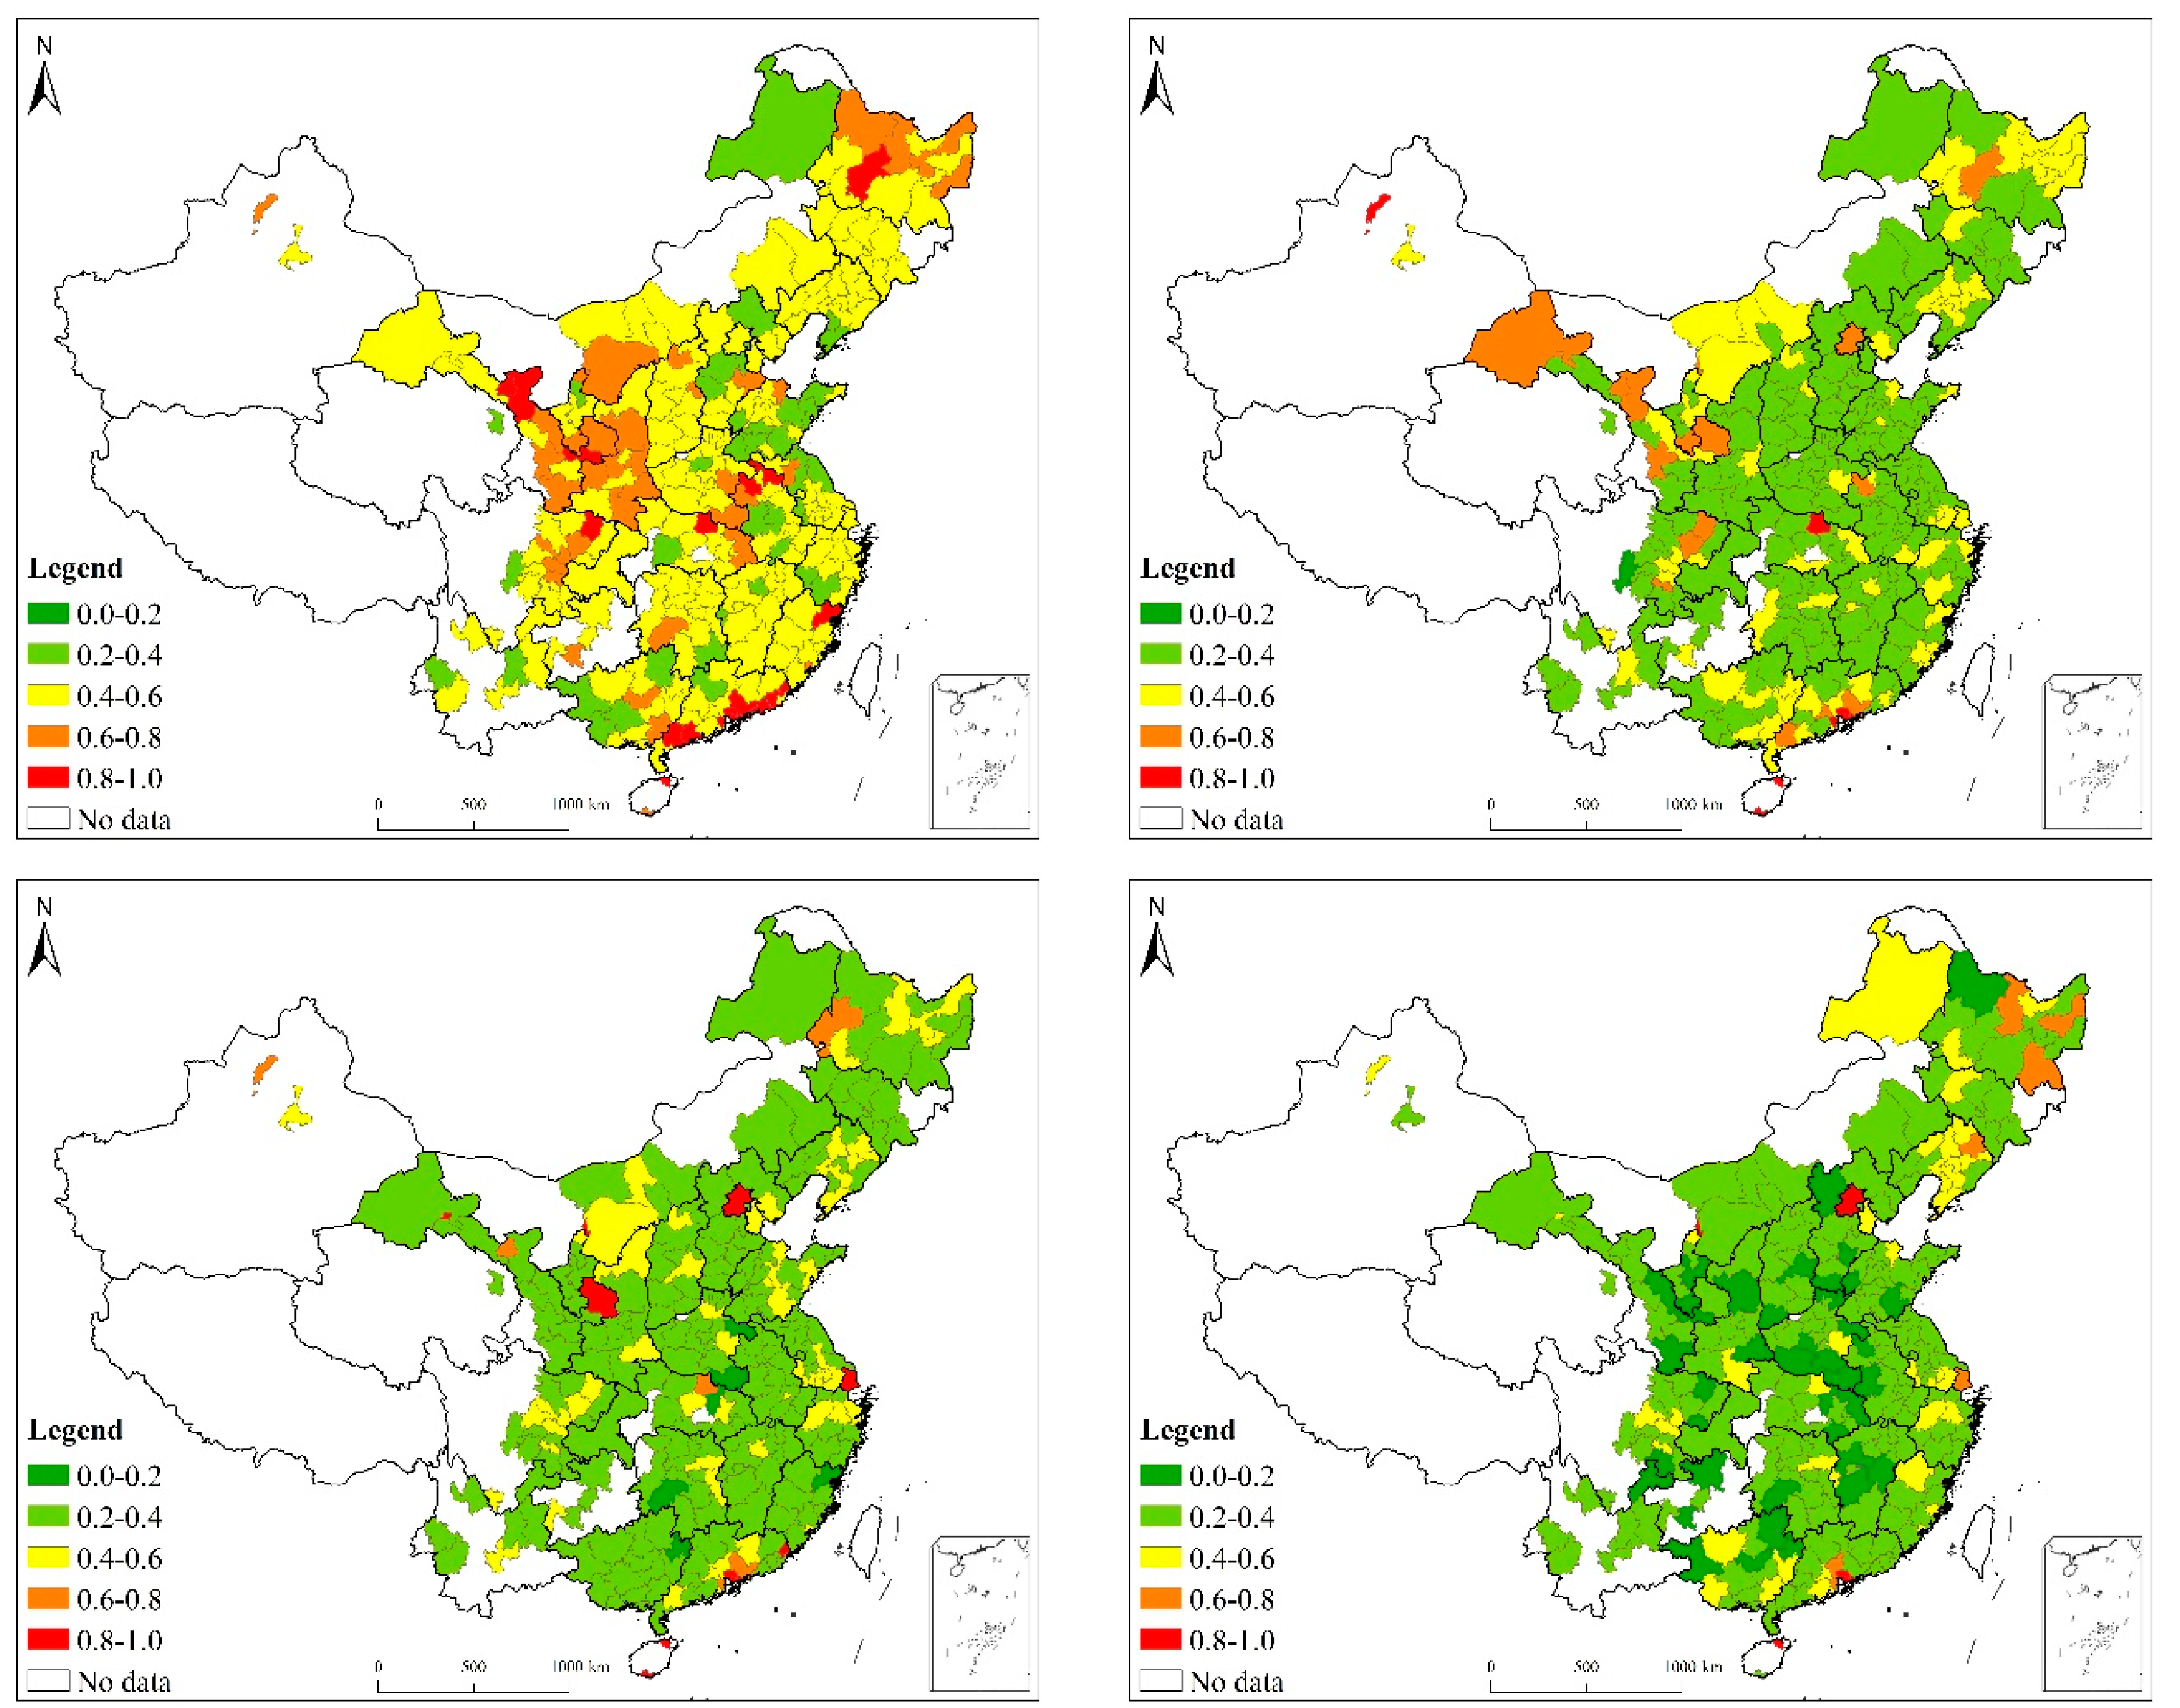
Summarizing both steps, the process efficiency of urban sustainable development could be calculated using the given algorithm. The results of eco-efficiency analysis are presented in
Figure 4. It can be seen that in the second stage, most Chinese cities experienced a decline in efficiency, the most significant of which is evident in the western and interior regions. Eastern and coastal cities also have decreased their efficiency to some extent, while most developed and promising municipalities such as Beijing, Shanghai, Guangzhou, and Shenzhen still retained high standards of eco-efficiency over time, especially in the 2010s.
Thereafter, the calculations can be described in aggregate terms. While computing the average of a certain group, we used population to obtain the weighted average to reflect the average efficiency of the whole sample or certain group. The results are presented in
Table 2. The eco-efficiency of Chinese cities declined during our observation period and the reason can be mainly attributed to the decline of sub-efficiency in step 2 of urban construction and pollution treatment. In step 1, which mainly reveals the efficiency of economic development, a slow increase was seen over the 12-year period, even though there was some fluctuation around 2008 as a result of the global financial crisis. As for the second stage, the sub-efficiency in this step experienced a dramatic decline and the downward trend is very stable, from more than 0.7 in the first year to only 0.28 at the end of the observation period in 2016. The reason for this decline might be attributed to the selection of variables in our model. The outputs in step 2 included variables of insurance coverage and number of middle school students, which were naturally increasing at a slower rate than GDP. It might also indicate that increases in social welfare development in Chinese cities was far behind the overall rate of economic growth, and the pollution treatment efficiency in most cities still lagged in comparison with modern metropolitan areas such as Shenzhen.
To highlight the findings of this study, the results are reported by representative samples or in groups instead of as a detailed city-to-city comparison. The results for individual cities are available in the
Appendix A. These Chinese cities can be grouped in terms of dimensions such as administrative levels (municipalities, provincial capital, vice-provincial cities, as well as prefecture-level and county-level cities. Our sample did not include county-level cities because of data availability), regions (eastern, northeastern, interior, and western regions) and different city clusters or groups.
The four municipalities included Beijing, Tianjin, Shanghai, and Chongqing, and these four cities have the highest administrative levels in China. Among the fifteen vice-provincial cities, ten of them (Shenyang, Changchun, Ha’erbin, Nanjing, Hangzhou, Jinan, Wuhan, Chengdu, Xi’an, and Guangzhou) are capital cities of their corresponding provinces, and the other five (Shenzhen, Dalian, Qingdao, Ningbo, and Xiamen) are specially designated in the state plan as key cities. These 19 cities might be able to benefit from resources coming from the central government to help promote urban sustainable development.
Figure 5,
Figure 6 and
Figure 7 report the average sub-efficiency and eco-efficiency levels of the different administrative city groups during the 2005–2016 period.
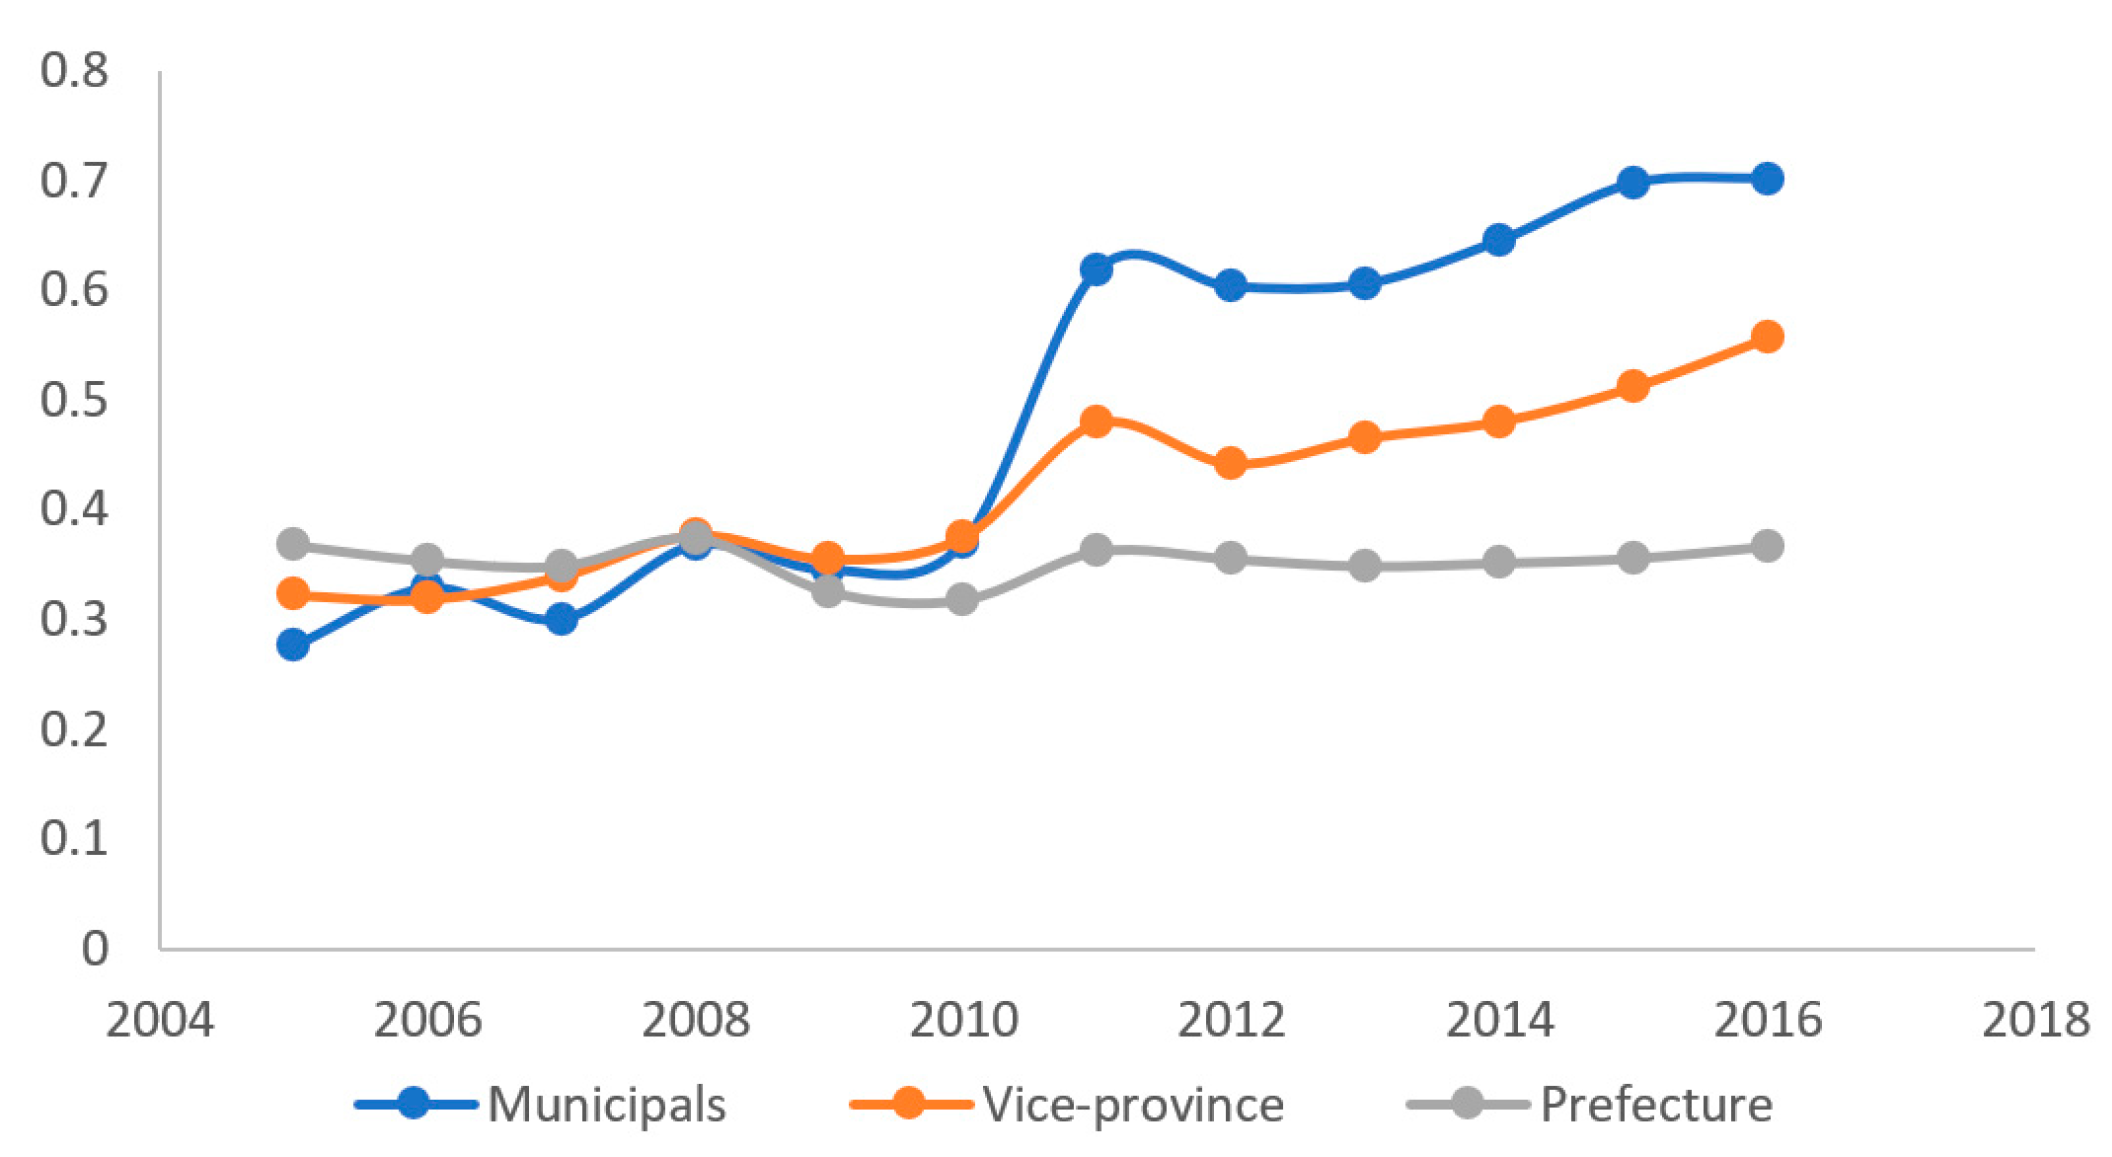
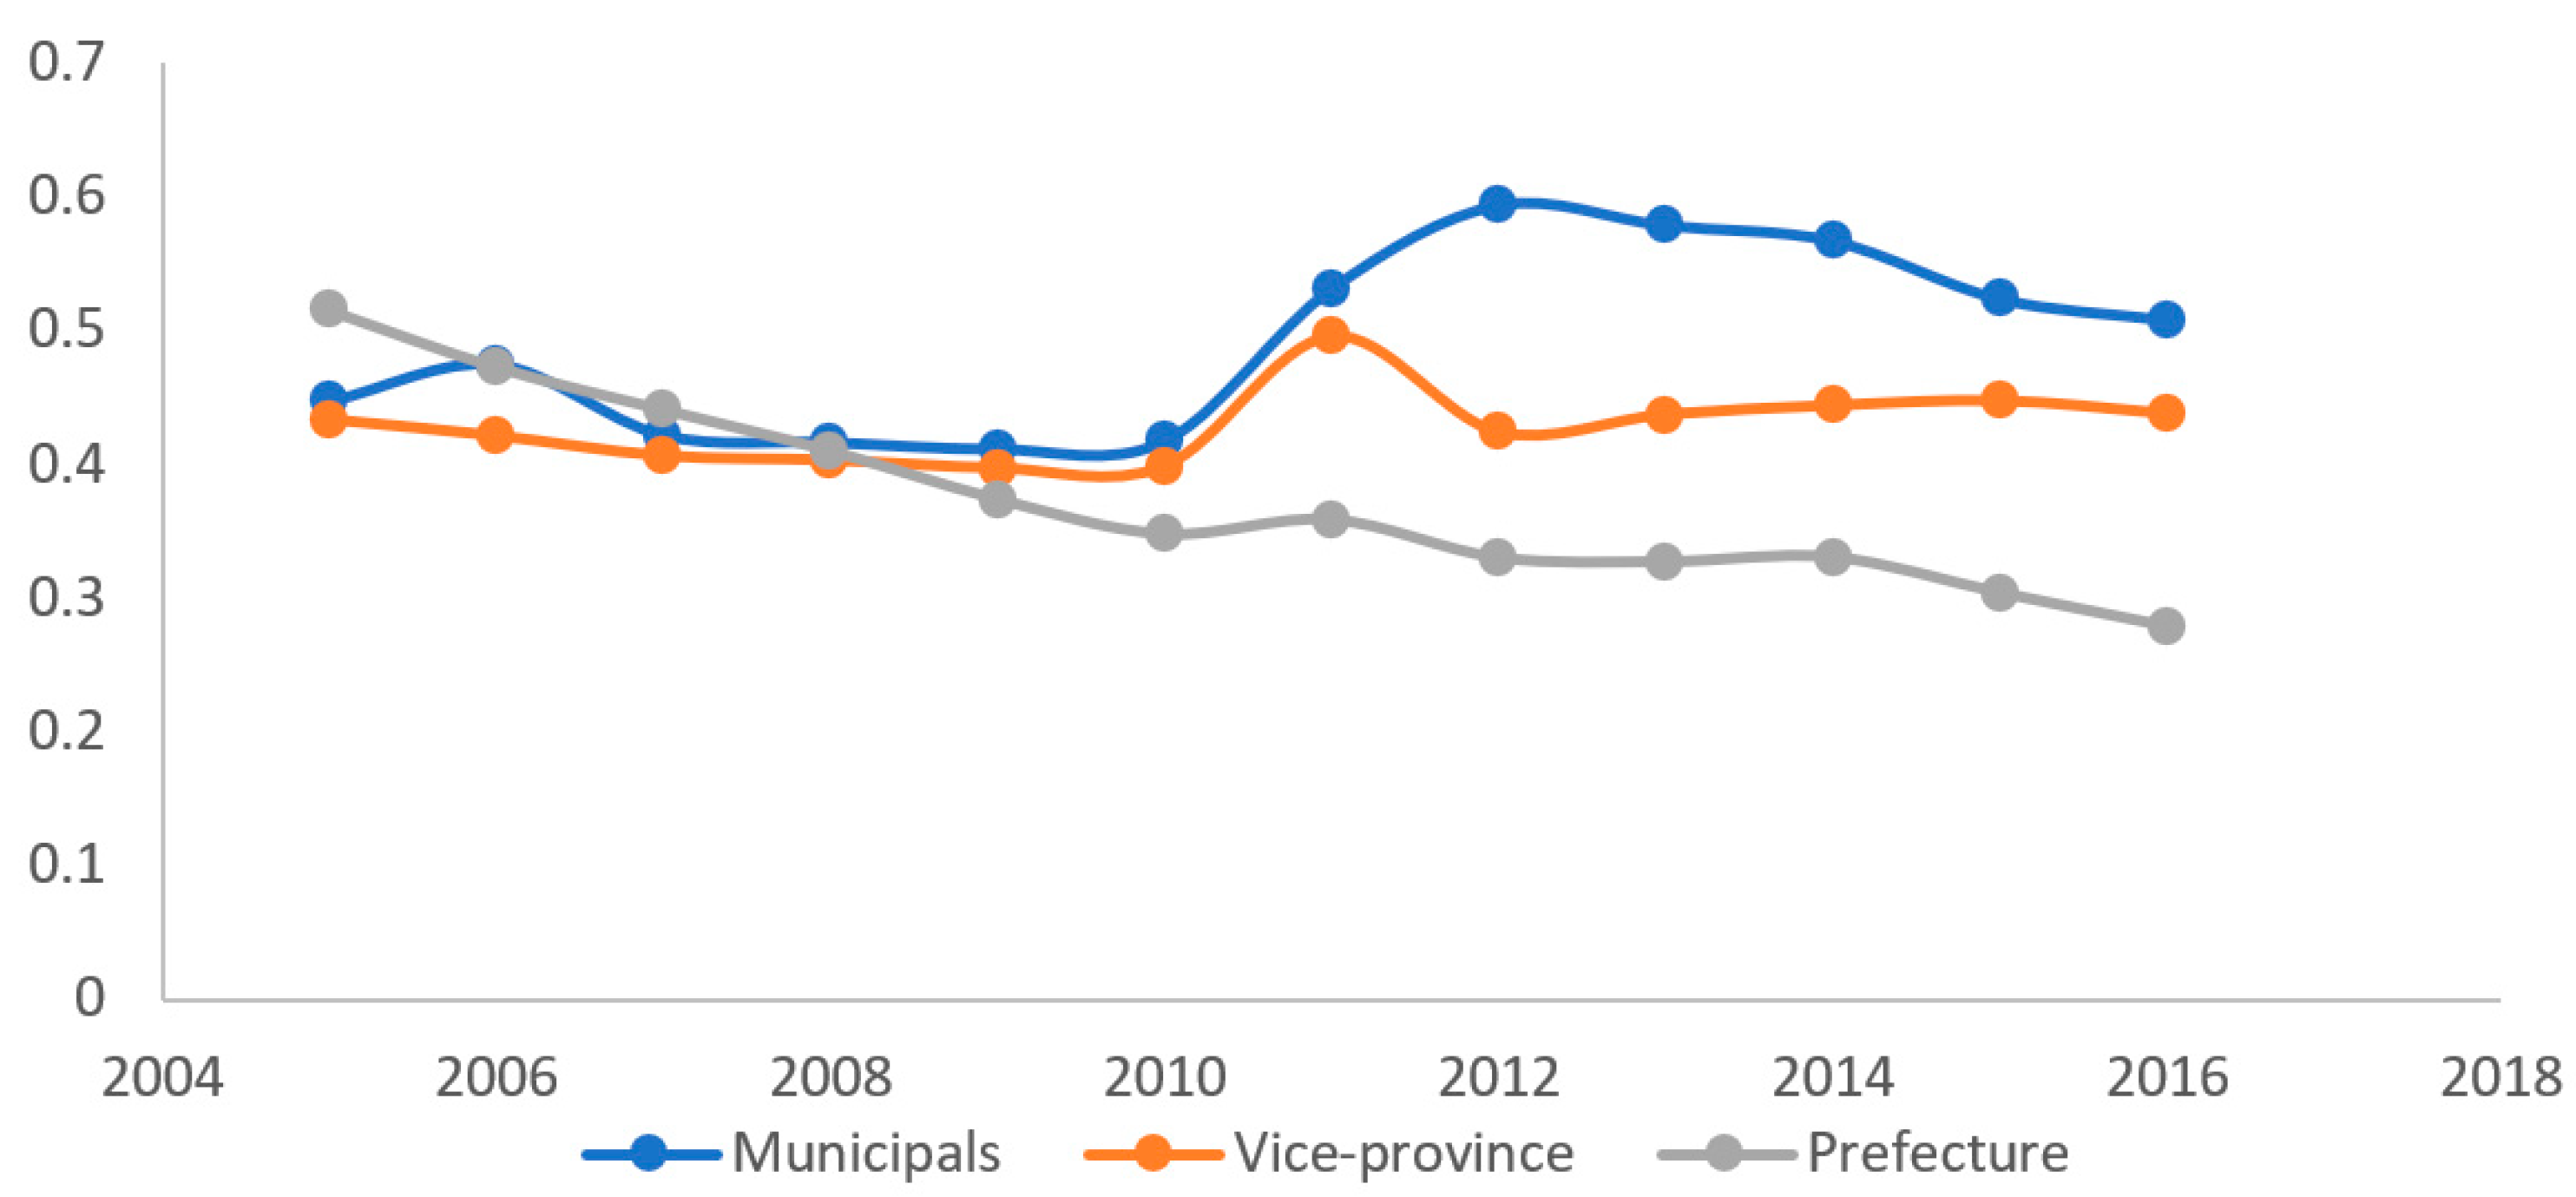
In
Figure 5, the economic growth sub-efficiency levels of the cities in different administrative levels remain almost the same in the first half of the period, while showing significant differences compared to those of prefecture cities in the second half of the period, which had an even higher economic growth sub-efficiency level at the beginning. However, in the second half of the period, cities with higher administrative levels performed better than cities with lower levels, confirming the economic growth efficiency in Chinese cities of various administrative levels. Prefecture-level cities did not make any improvement on efficiency during the observed period, while the efficiency values of the municipalities and vice-provincial cities in 2016 were almost double the efficiency values in 2005.
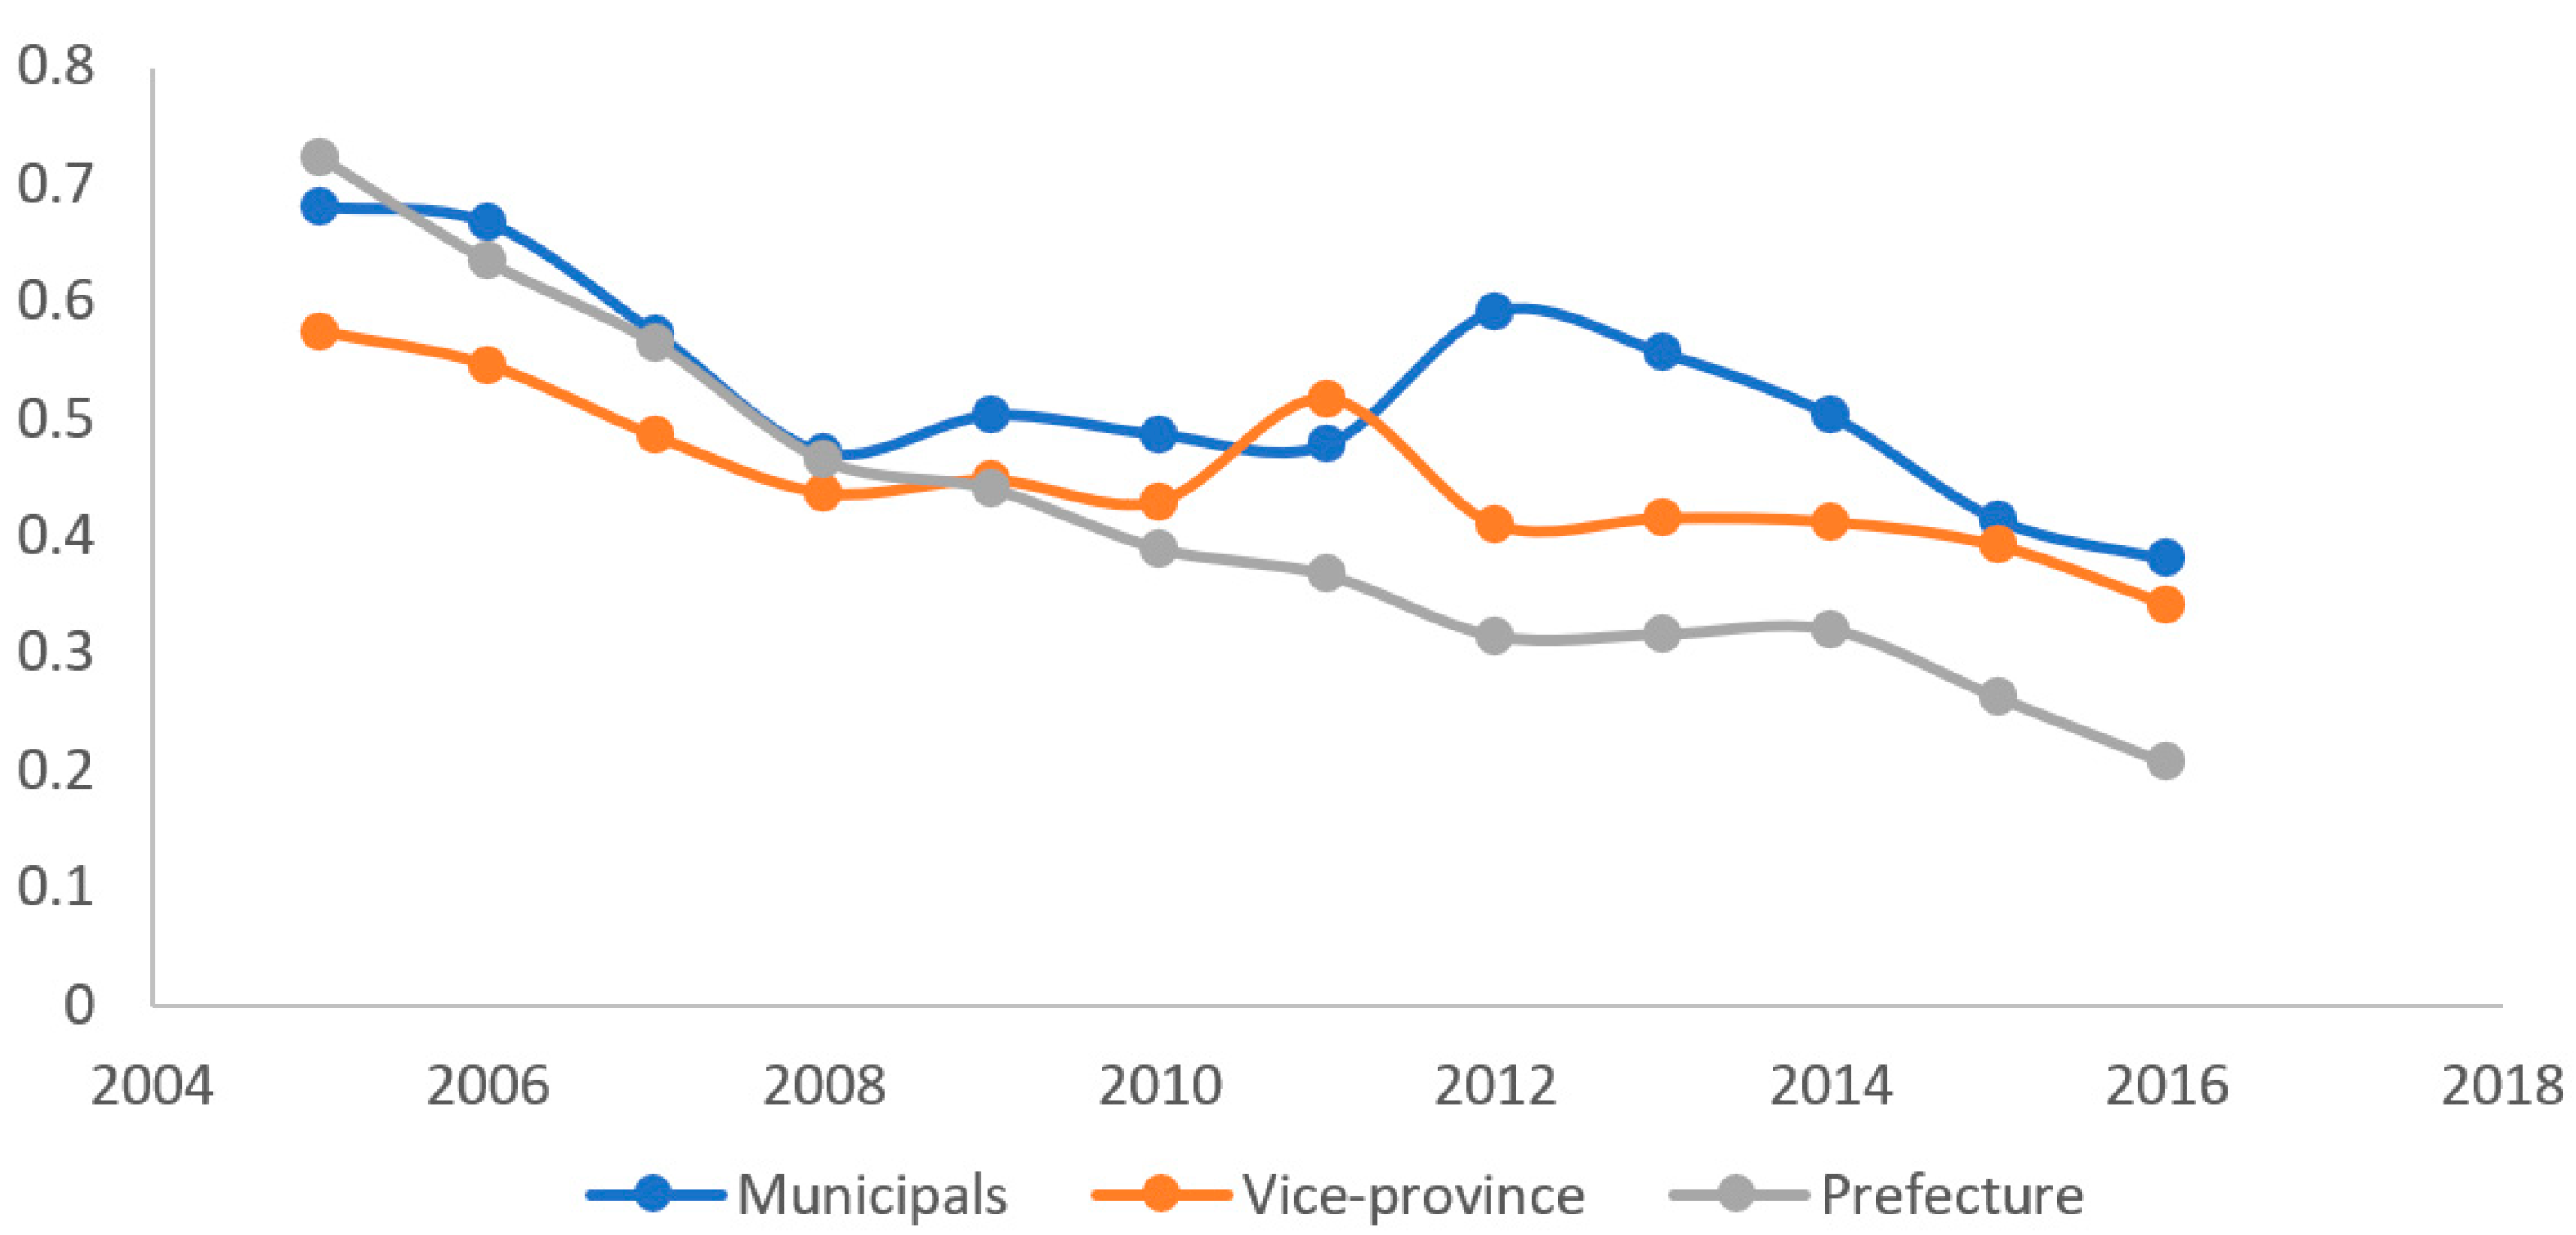
As for the sub-efficiency values of the second stage,
Figure 6 shows that the cities at different administrative levels all experienced dramatic declines during the whole period, while cities with higher administrative levels still performed better than the prefecture cities at the end of the observation period. Municipalities and vice-provincial cities even realized some rebound during the years of 2011 to 2012. Prefecture cities were in the first place among the three administrative levels initially but ended up in third place in 2016, the end of our observation period. These two sub-efficiency coefficients led to the final and combined eco-efficiency result, which is presented in
Figure 7, and it can be described as the combination of the results of both steps. Thus, cities with higher administrative levels showed significant advantages, which were mainly revealed in the second decade of the 21st century. This administrative advantage did make a great difference regarding the urban sustainability levels of the Chinese cities.
As for regional groups, most studies have conventionally divided China into the eastern, interior, and western regions. However, these divisions can no longer meet our needs due to changes in the real conditions. Recently, the National Bureau of Statistics started to utilize a four-group classification criterion. With this, the provinces and municipalities in China can be grouped by location into the following four regions: eastern, interior, western, and northeastern, as shown in
Table 3.
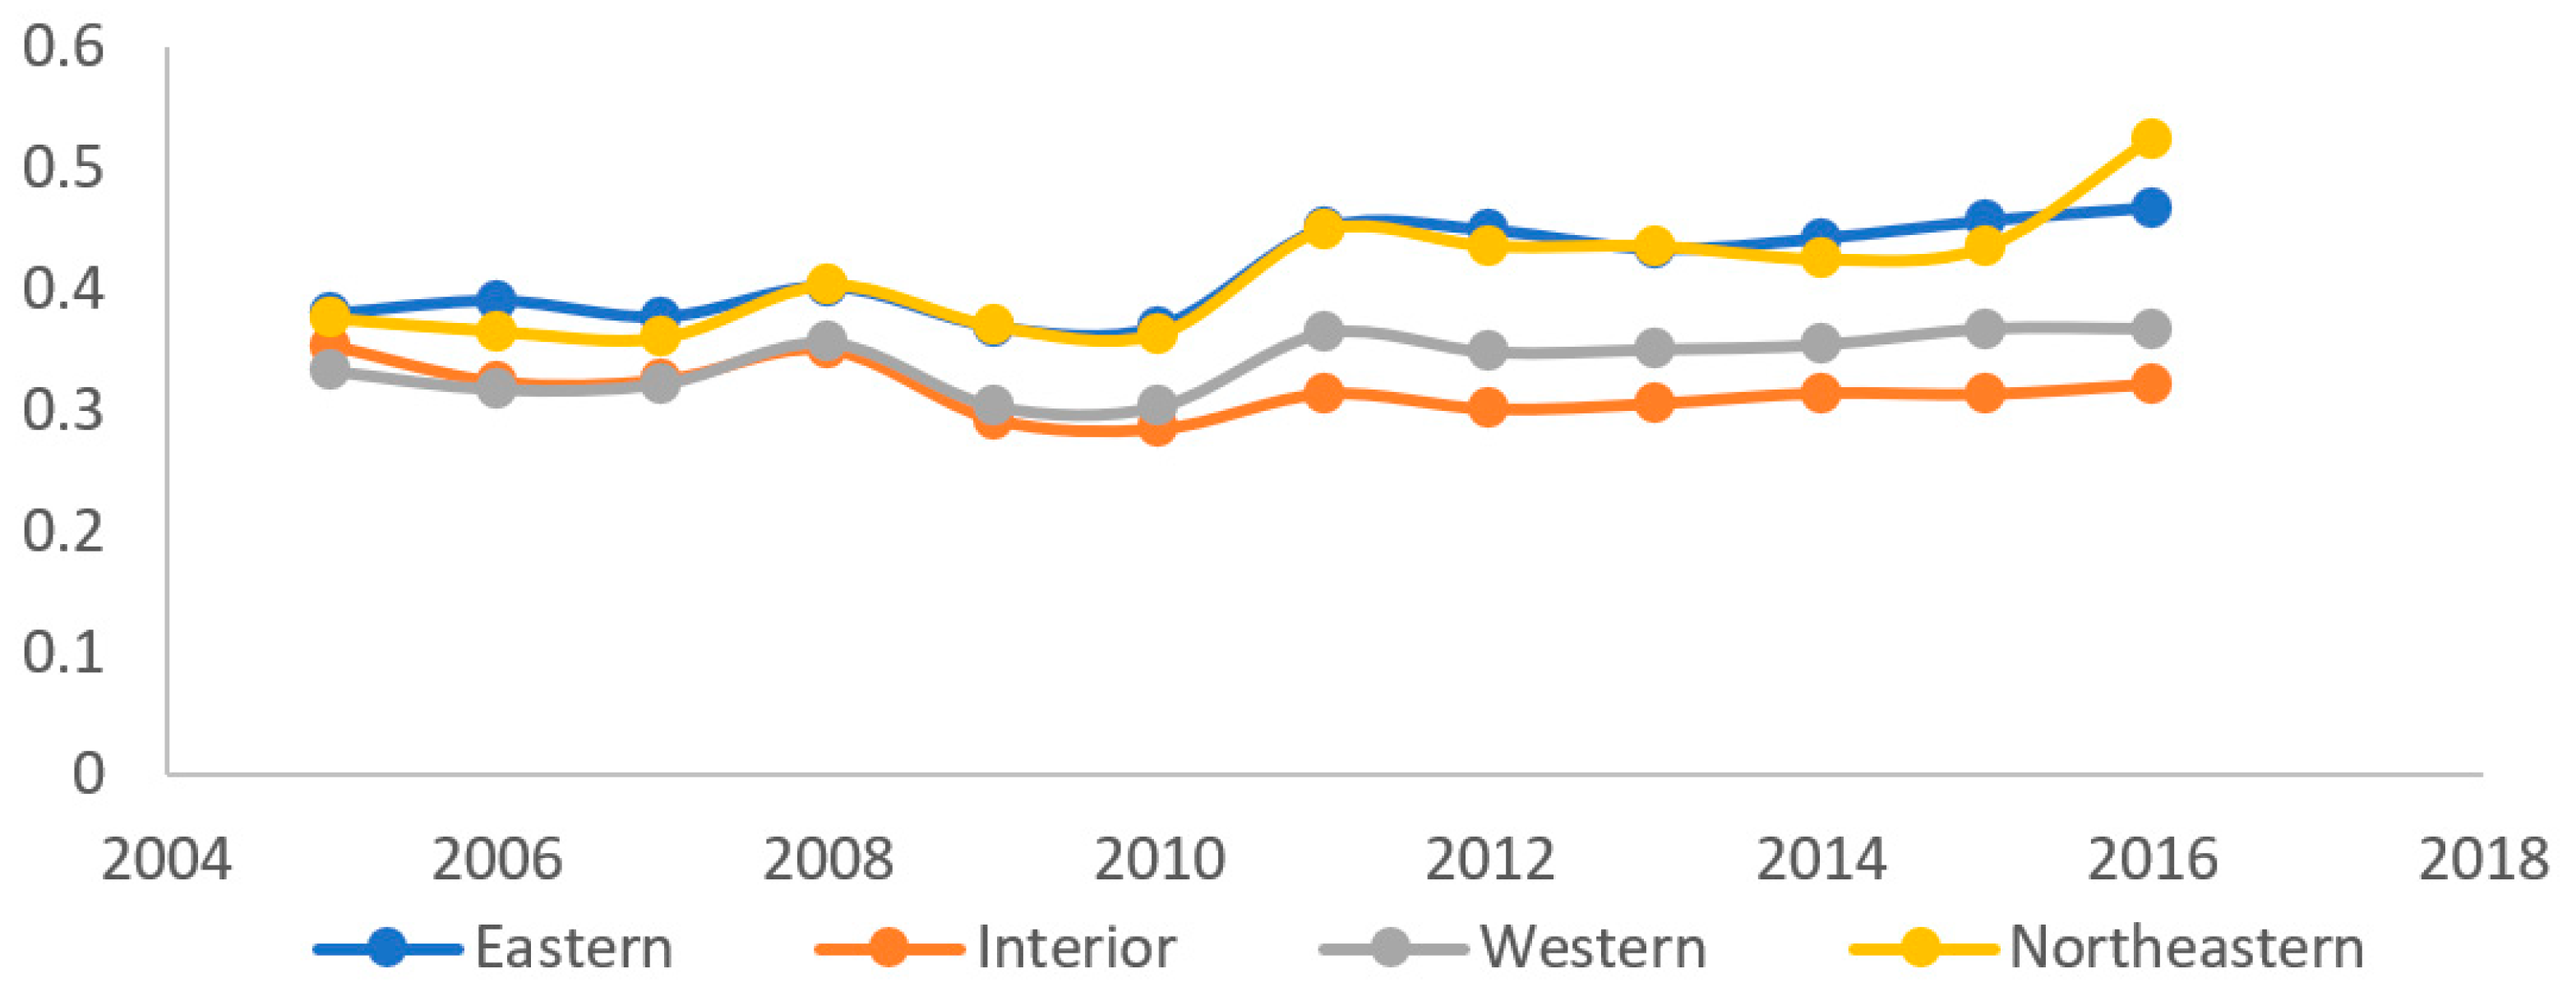
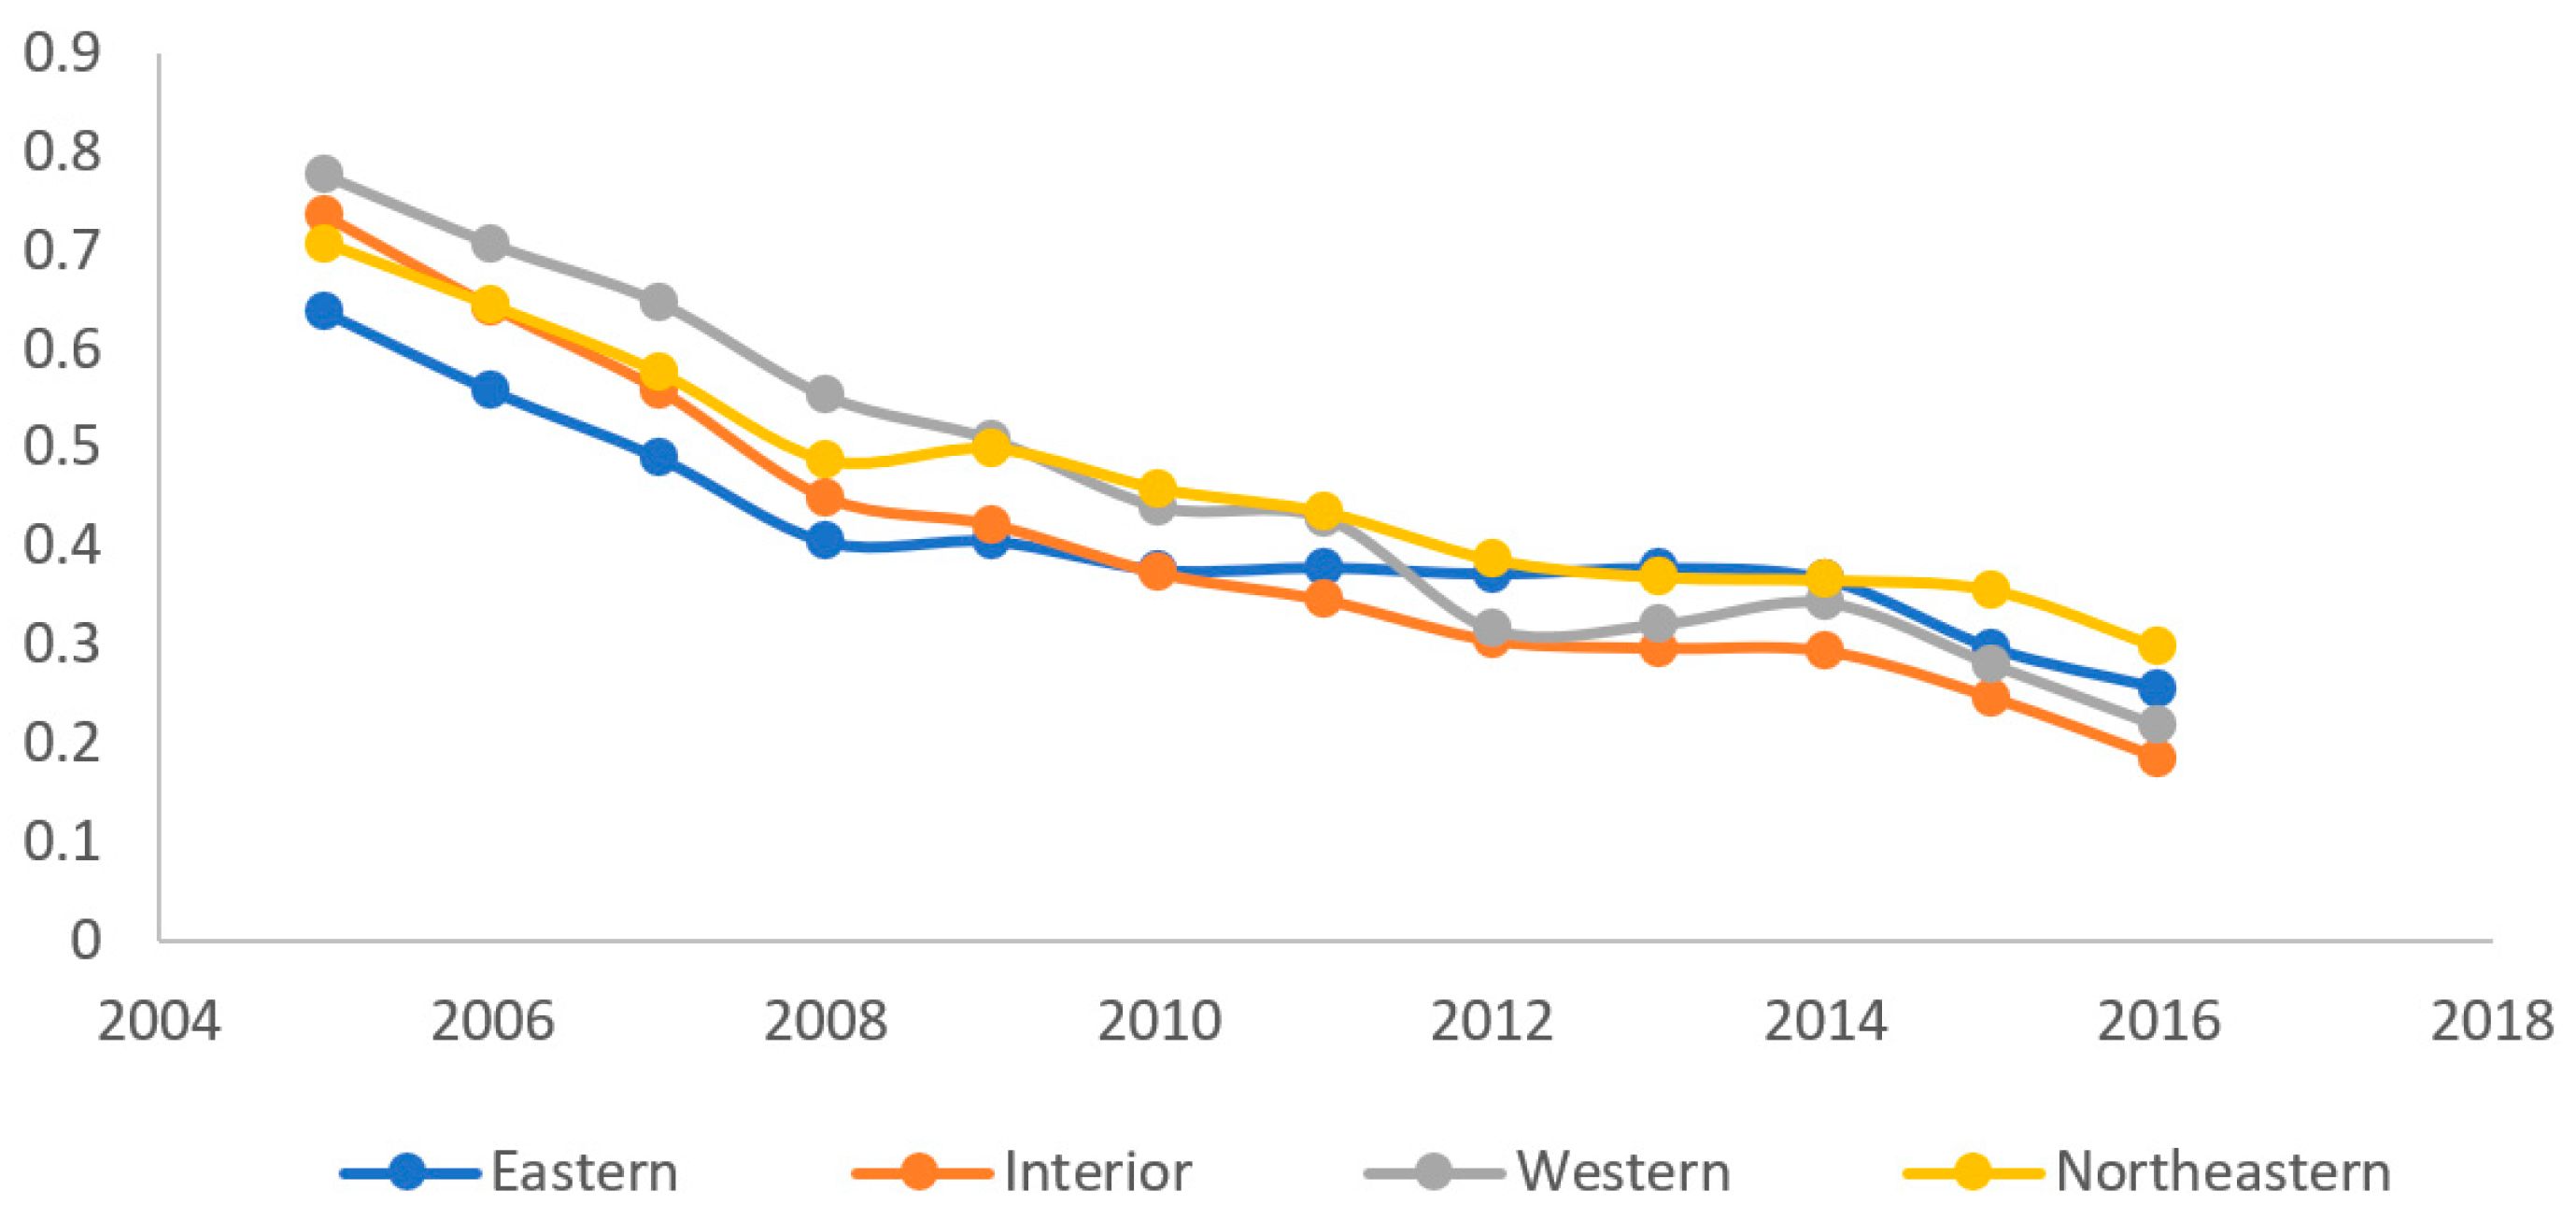
Figure 8,
Figure 9 and
Figure 10 show the population weighted average efficiency values of the cities in different Chinese regions during our observation period. There are significant differences among regions in terms of the sub- and eco-efficiency perspectives, and the regions took different paths during the 16 years. Interior and western cities showed some fluctuation during the 12 years but experienced little change without any advance overall. On the other hand, the northeastern and eastern cities had a relatively higher starting point in step 1 and widened their advantage over the interior and western cities during the observation period. For step 2, the sub-efficiency values of all four regions were declining, while these two regions started at a relatively low standard among the four regions but also ended up with the top two places in 2016, indicating that eastern and northeastern cities were also performing more efficiently while utilizing their economic outputs to carry out urban construction. According to the results, eastern and northeastern cities showed higher combined eco-efficiency levels at the aggregate level at the end year, and their advantage seemed to expand in the later years, which might be mostly due to their performances in the economic efficiency section. Starting from the last rank, the eastern area became one of the regions with the highest efficiency by the end of 2016. It is well known that unbalanced regional development has become an issue that is receiving increasing attention in China. The government made great efforts and attempts to promote development in the central and western parts of the country by introducing preferential policies and devoting significant resources. However, our calculations indicate that the efficiency levels of these regions continue to lag behind, and these gaps seem still to be widening in recent years and could do so even in the future.
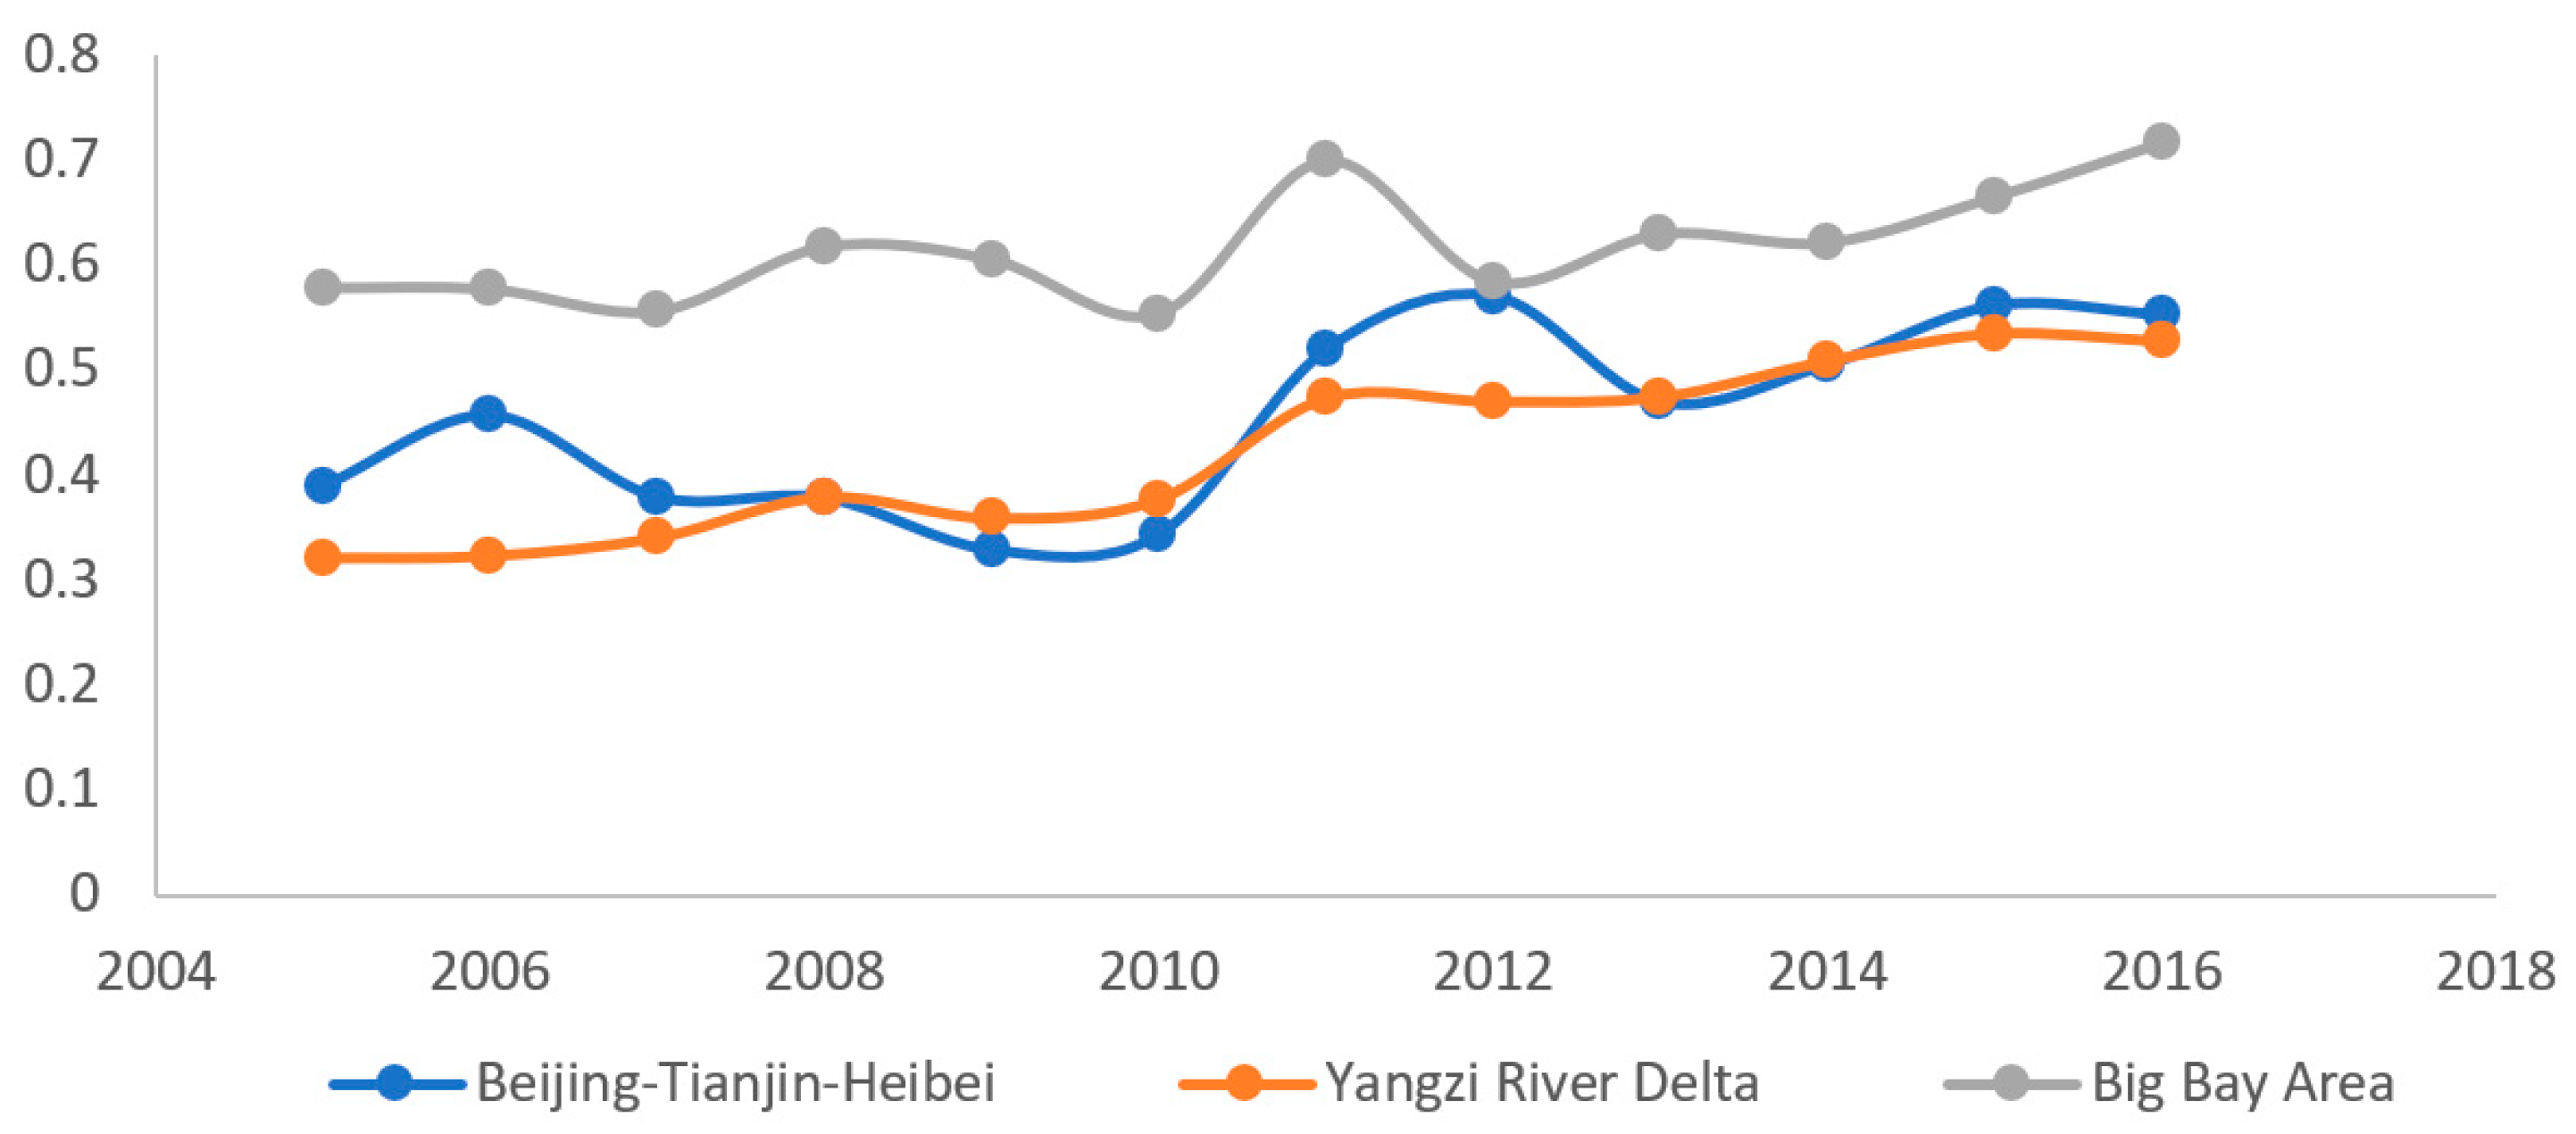
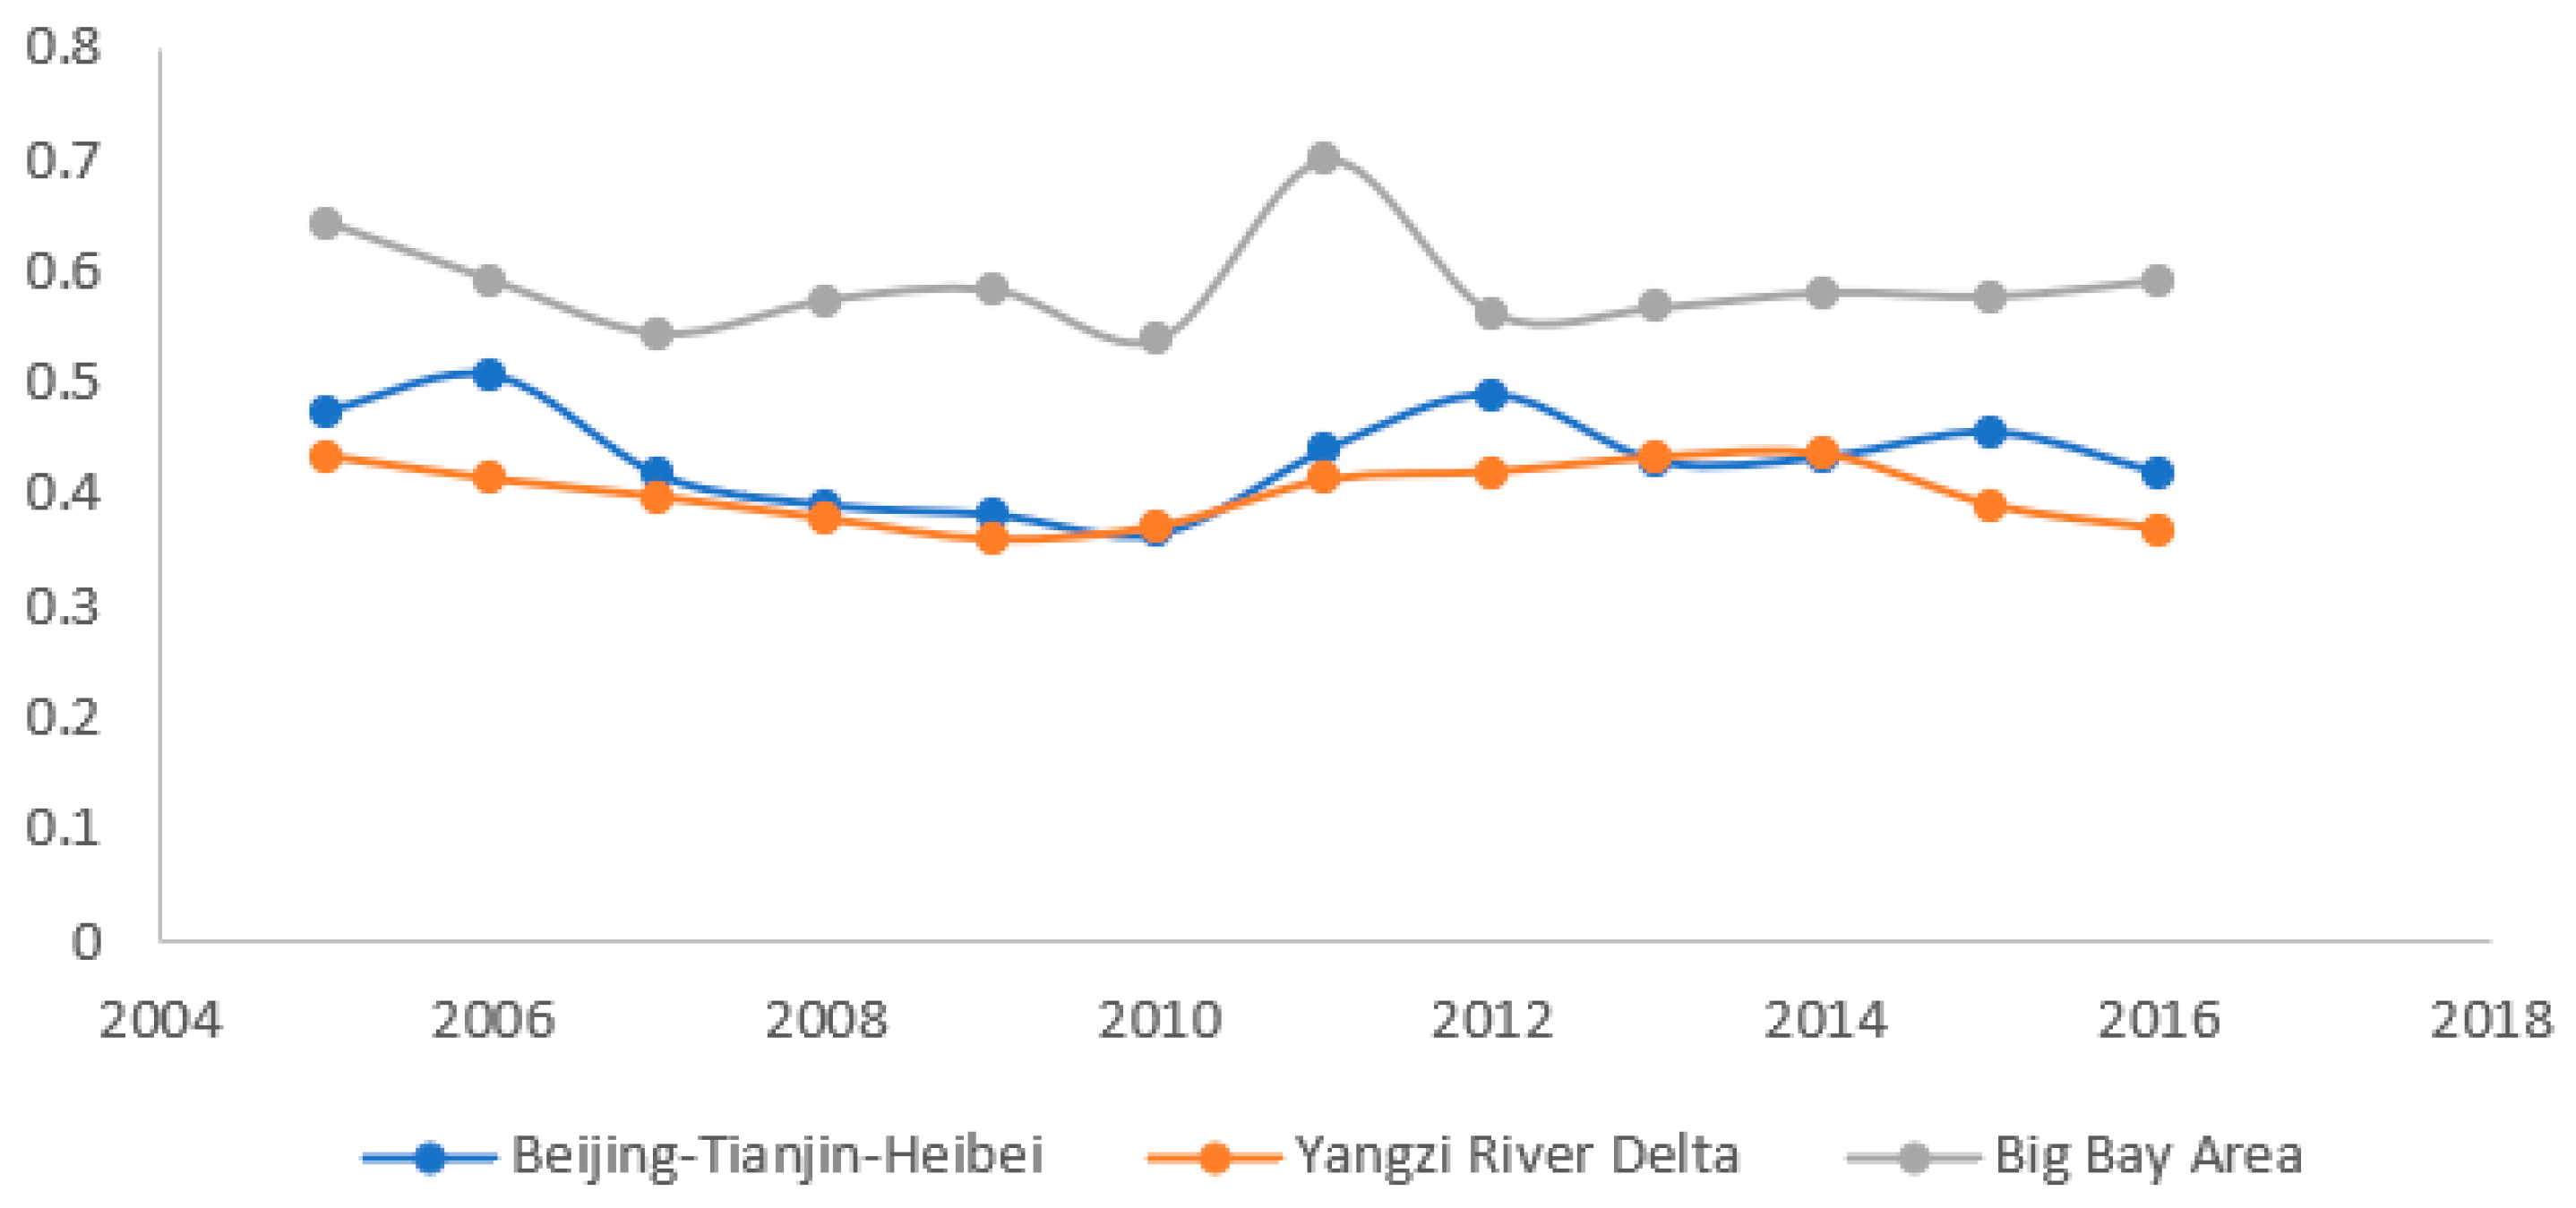
There is another trend that should be stressed regarding Chinese urban development, which is that the central government has been making a great effort to promote the formation and development of city agglomeration. The central government has approved development plans for more than 10 national-level city groups since 2018, and these covered more than 50% of the cities in our sample and more than 80% of the national population. Therefore, it is important to analyze the eco-efficiency results obtained from the perspective of city groups and clusters. Since there have been more than 10 city groups under planning, we chose the three largest and most important city groups in our sample (Beijing–Tianjin–Hebei, Yangtze River Delta, and the Guangdong–Hong Kong–Macao Greater Bay Area) to compare their eco-efficiency and sub-efficiency results.
Figure 11,
Figure 12 and
Figure 13 present the population weighted average results of the eco-efficiency and sub-efficiency calculations of the cities in the three largest clusters. It can be observed that the Guangdong–Hong Kong–Macao Greater Bay Area had the highest level of development and efficiency on urban sustainability among these three city groups and among all of the 13 Chinese city groups in terms of both economic growth and urban sustainable construction. Regarding the economic growth process, although there was some fluctuation around 2011, all three city groups still improved the efficiency of their economic development at the end of the observation period compared to the beginning of 2005. The second step and the combined eco-efficiency figures presented a similar condition, with the Big Bay Area being the most efficient group and the other two at almost the same level. We should also point out that these city groups were the top three according to our results and comparisons.
Since the selection of variables in our approach mainly referred to USI, it is natural to compare the results of our eco-efficiency and USI scores. We should point out that the two evaluation systems were built based on different frameworks. The USI approach calculates a weighted average of the output variables after standardized processing, which emphasizes the results of urban development without considering how much cost or input it takes to obtain the current level of achievement. The eco-efficiency measure in our study pays more attention to the efficiency of transferring inputs to outputs. This approach is important for evaluating urban sustainable development and observing the performance of Chinese cities with respect to both evaluation systems. The results are presented in
Table 4. For simplicity, we only report the result of the municipalities, vice-provincial cities, and provincial capital cities.
In
Table 4, metropolitan cities such as Beijing, Shanghai, Guangzhou, and Shenzhen, which are widely accepted as first-tier Chinese cities, performed well in terms of both the final score and from the process efficiency perspective, confirming their leading position throughout China. This is particularly true of Shenzhen, which ranked in first place in both lists, making it the city with the highest sustainability efficiency level. Big cities in coastal provinces (Nanjing, Hangzhou, Tianjin) and some tourist cities (Xiamen and Haikou) also performed well on the USI, with a relatively high efficiency in making full use of the resources to maximize their “revenue” from urban sustainable development (eco-efficiency). However, the eco-efficiency and USI results are not always in agreement. There were also some cities (Xi’an, Yinchuan, Guiyang), mainly in western China, that obtained a relatively good USI score with low eco-efficiency, indicating that their urban development is, to some extent, inefficient. Some interior and western cities (Chongqing, Shijiazhuang, and Nanning) showed an even poorer performance on both the USI score and eco-efficiency.


