Abstract
This paper deals with urban sustainable development in China. We propose a network data envelopment analysis (DEA) model with a slack-based measure (SBM) to analyze the eco-efficiency of 284 Chinese cities, enabling us to find a way to open the “black box” in conventional DEA models and introduce social well-being factors into the model, and depict the role of local government in providing public service and improving social well-beings. We set up a framework of urban development by dividing the process of into two steps. The first stage is a production system translating inputs and natural resources into GDP and waste production, which will be inputs to the second stage for distribution and consumption to realize social welfare and environmental protection. The results show eco-efficiency of Chinese cities experienced a significant decrease from 2005 to 2016, which should be mainly attributed to the distribution and consumption processes. Structural differences are described by regions, administrative level and clusters. These results are compared with an existing urban sustainability index system developed by McKinsey and an ANOVA approach is conducted to reveal differences between cities across regions and clusters. This article sheds new light on the understanding of urban sustainable construction and development in China regarding the service performance of local government.
1. Introduction
Urban sustainable development has increasingly attracted people’s attention, particularly after the United Nations announced in 2015 its sustainable development goals “to make cities and human settlements inclusive, safe, resilient and sustainable” [1]. It stated that more than two-thirds of the world’s population would be living in cities by 2050. With the world’s largest population, China has experienced dramatic growth in its urbanization rate in the past 40 years, when more than 400 million people moved into cities and became part of the urban population. However, it has been reported that many Chinese cities have inadequate water supplies and uncontrolled waste management problems [2,3], and scholars have become concerned about the extent to which China’s economic growth has benefited its citizens’ well-being, with local governments leading the process of urban development [4]. Individuals have started to realize that the development of a city is about more than economic growth. Conventional GDP per capita can no longer be the sole measurement of urban development. However, benchmarking the performance of urban development across dimensions that relate to the sustainability of the economy, energy, water, environment, and other types of systems requires a holistic approach. Accordingly, the research community has proposed different methods including analytic hierarchy processes (AHP) [5], indicator systems [6,7] and fuzzy evaluation methods [8] to measure the development of cities.
Eco-efficiency, initially described by Schaltegger and Sturm [9], is the ability to produce goods and services while minimizing inputs including natural resources and negative environmental impacts [10], and has been thought to be a good attempt to reflect the performance of urban development. Data envelopment analysis (DEA) has attracted great attention based on a total-factor production process to measure eco-efficiency [11]. However, in the context of urban development, there are weaknesses in the conventional DEA model that cannot be ignored. First, urban sustainability is a systematic process with a variety of both desirable and undesirable indicators in multiple stages of development. Overlooking the internal structure, conventional DEA models usually treat such systems as “black boxes” and do not explicitly consider undesirable indicators. Second, previous studies have generally evaluated eco-efficiency as a single process, focusing on the industrial sector, which directly generates waste, while omitting the fundamental role of government [12]. The government sector is significant, as it provides public goods and services for a sustainable production environment. How the government sector affects the industrial sector and how it allocates outputs in the production sector, as well as the efficiency in different stages, is still unknown. These facts and studies motivated us to use advanced DEA models to assess urban sustainable development, especially by revealing the internal relationship between the “black box” of urban construction and social welfare benefits.
In this paper, we apply a network DEA model with a slack-based measure (SBM) to 284 Chinese cities to assess their eco-efficiency. We define eco-efficiency as the efficiency of a city’s economic and social well-being development given the resource and environmental capacity constraints it faces. A network structure of the two-stage system is constructed to reveal a comprehensive structural measure of urban development. Each region is regarded as a two-stage network structure in which the first stage is characterized as the production system and the second stage as the consumption and distribution system. Indicators on different dimensions are suggested across this system after identifying inputs and outputs among different stages.
The contribution of this paper to the existing literature is as follows: first, most conventional DEA models consider the urban development system to be a “black box” and ignore the internal relationships among the different stages of urban development. This article sheds new light on the exploration of models attempting to integrate a clear structure into the urban development process to reflect internal interactions among different stages of production and social distribution. The role of the government in urban sustainable development is discussed in a new way, concentrating on the duty of public service provision to the citizenry—which is the elementary and final unit of the city—rather than to manufacturers and enterprises. Second, most current approaches are based on economic growth with constraints on environmental sustainability and energy use, with GDP considered their sole final output. In such analyses, the importance of social well-being indicators has, thus far, been underestimated. Therefore, we include public service indicators to reflect the performance of urban social welfare, such as numbers of doctors and students as well as pension coverage and green coverage, to reveal the social well-being of urban citizens, which we regard as the final output instead of GDP.
2. Literature Review
Urban sustainability is perhaps the most popular subject in sustainability development studies and has been analyzed in a variety of settings. Considering the broad definition of urban sustainability, researchers have used different perspectives on this topic, including analytic hierarchy processes (AHP) [5], indicator systems [6,7] and fuzzy evaluation methods [8]. However, these approaches have been criticized for lacking an objective standard of variable selection or being inaccurate and unconvincing because of data standardization or panel data co-integration.
Among all these researchers, eco-efficiency (initially described by Schaltegger and Sturm [9]) is considered an approach intended to promote a transformation towards sustainability [13]. Data envelopment analysis (DEA) has become one of the main techniques for measuring relative efficiency due to the seminal work of Charnes et al. [14]. With the increasing use of DEA, scholars noticed some weaknesses in the conventional DEA models while utilizing them in regional sustainable development. One of the challenging issues encountered in sustainability assessment is how to include in any model undesirable outputs, which are inevitable during the process of urban development and operation, such as carbon dioxide (CO2), sulfur dioxide (SO2), and other pollutants. Based on the seminal study by Tone and his coauthors [15,16], researchers have sought to widen the use of DEA methods for evaluating eco-efficiency by proposing an SBM for DEA to measure system efficiency [17,18,19]. Yin et al. [20] measured the eco-efficiency of 30 Chinese cities with a super-efficiency DEA model in which environmental pollution is considered an undesirable output, showing that almost half of the provincial capital cities are eco-efficient. Sueyoshi and Yuan [21,22] applied DEA models to assess municipal sustainable development in China incorporating undesirable outputs. Huang et al. [23] created composite eco-efficiency indicators by integrating eco-efficiency with economic, energy, and environmental efficiencies and used an SBM-DEA approach to assess the eco-efficiency of 30 Chinese provinces. Yu et al. [24] developed three DEA models that incorporated meta-frontier and undesirable outputs, including SBM, EBM, and MinDW and compared them among these three measures; an empirical approach measuring the eco-efficiency of 117 Chinese prefecture-level cities was also included. Ding et al. [25] proposed a non-radial and multi-objective generalized DEA model for economic–environmental efficiency evaluation to empirically measure the economic–environmental performance of Chinese provincial regions to illustrate their improved accuracy. As for the selection of variables in specific DEA models while evaluating urban sustainable development, capital, labor, energy consumption, and land used are commonly considered to be inputs for production, while GDP and the value added in industry are widely used desirable outputs, and CO2 emissions, SO2 emissions, and waste water discharge are commonly included as undesirable outputs [26,27].
Another weakness of the DEA models that has been widely criticized is that they utilize multiple inputs to produce multiple outputs, while urban sustainability development is a systematic process with a variety of indicators in multiple stages of development, with complex interactions and systematic structure. Overlooking these internal structures, conventional DEA models treat such systems as a one-stage step, which means that all inputs are used and all outputs are generated in a single process, regarding the production process as a “black box”, and therefore they are unable to reflect the relationships between the variables inside a given process [28]. In order to cope with such a weakness, several modified versions of DEA were put forward, such as the relational or centralized model and the non-cooperative model. These facts and studies motivate us to use advanced DEA models to assess urban sustainable development, especially by revealing the internal relationship in the “black box” of urban construction and social welfare benefits. Following the early attempt of taking the overall system into the component processes introduced by Charnes et al. [29], who found that army recruitment had two processes—that is, creating awareness through advertisements and creating contracts—measuring the efficiency by separating a large system into detailed smaller production processes has attracted increasing attention and has been adopted in many research fields [30,31].
Network DEA models were introduced to measure the eco-efficiency of countries, regions, and cities. Wu et al. [32] proposed a two-stage network DEA model to assess China’s regional energy saving and emission reduction efficiency, where the second stage disposes of the pollutants produced in the first stage to make it a two-stage structure. Li et al. [33] applied a DEA model in a two-stage setting to measure the regional economic and ecological efficiency of 31 Chinese administrative regions where the first stage modeled the ecological system and the second stage modeled the decontamination system, which included recycling and treating undesirable outputs coming from the first stage. Zhang et al. [34] adopted a three-stage DEA model to eliminate interference from the external environment and statistical noise and utilized it to assess the industrial eco-efficiency levels of 30 Chinese provinces. They concluded that their average industrial eco-efficiency level increases by 30% after eliminating the impacts from the external environment and statistical noise. Xiao et al. [27] present a two-stage network DEA framework incorporating government and industrial sectors and measured the eco-efficiency of 84 resource-based cities. However, the existing literature mainly focuses on the process of energy utilization and production, and there have been few articles paying enough attention on the process of urban social benefit and welfare distribution.
The literature above made great progress on the measurement of eco-efficiency, especially in China, using different approaches, including DEA. However, there are still some aspects that need improvement and consideration. First, the selection of the appropriate dimensions of urban development for modeling the system processes is critical for successful urban planning with the appropriate emphasis and connotation. The existing literature mainly uses GDP as the desirable output or even the final output in network DEA models, while this variable still needs distribution and consumption to truly benefit the citizens in the region or industry of concern. Second, although some scholars are beginning to consider the internal structural relationship between regional sustainable development and eco-efficiency, there still seem to be few studies that provide a systematic approach to reveal the process of urban sustainable development in China, especially taking the role of the local government in terms of public service provision into consideration. Given the challenge of providing a comprehensive model that takes the above perspectives into account, this study describes a convincing structure to develop a two-stage network DEA model for urban sustainable development process evaluation.
3. Framework and Formulation
3.1. Subsection Framework of Urban Sustainable Development
In this paper, we develop a framework to investigate the process of urban sustainable development, which is divided into two steps, i.e., economic production and distributive consumption, as is shown in Figure 1. The first step is to use the inputs and resources each city possesses, such as capital, population, and natural resources, to produce economic outputs, with constraints imposed on the natural resource use and environmental capacity. Then, in the second step, the economic outputs produced in the first stage, including government revenues and industrial waste emission and control, will be introduced as inputs to benefit social well-being and protect the urban environment. The eco-efficiency throughout the entire process is then evaluated as the weighted average of the sub-efficiencies of both steps.
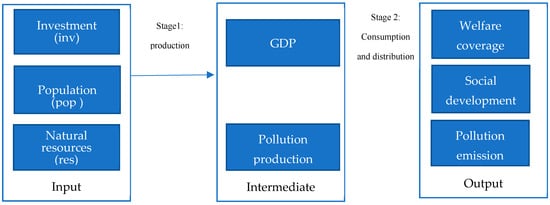
Figure 1.
Framework of urban sustainable development.
The reason and foundation of this two-step framework of urban sustainable development can be described and summarized as follows:
First, China has experienced dramatic economic growth since market reforms and openness that began in 1978. Among all these tasks, economic growth was fundamental and most important, influencing the performance measurements and promotions of local officials during these years. It is common knowledge that there is a competition among local Chinese officials and the most important evaluation criteria is the rate of local economic growth [35]. Although the Chinese central government has attempted to improve the performance appraisal of local officials [36], the real results of this still lack empirical evidence.
Additionally, there is a consensus that Chinese local governments have played an irreplaceable role in the process of urban sustainable development such as by investment promotion, infrastructure development, social welfare coverage, and environmental protection. Local governments make their own efforts and contribution by deeply engaging in the process of economic development including through public service supplements, industrial development funds, and land supply. Besides, local public services including health, education, and infrastructure are mostly dependent on the investment and maintenance of the local government. However, the fiscal decentralization reform that began in 1994 changed the fiscal structure and conditions of Chinese local governments, which have faced federal budgetary constraints while being responsible for providing most of the basic public goods and services to support urban sustainable development [37]. Such fiscal decentralization also promoted competition among local governments. The implementation of urban sustainable development is highly relevant to the financial input of local governments, which is closely related to economic development and the growth of cities, and has been encouraging Chinese urban economic development [38]. On the one hand, taxes that were divided into local income components included business and income taxes, which are closely related to local economic development performance. On the other hand, government officials also had to seek additional sources of revenue such as land transfer income and local government debt, which are also highly related to the condition and development of the local economy in a balanced budget. Therefore, the provision of public goods by the local government, which significantly influences welfare and urban construction, is highly dependent on the development of the local economy. Besides, there has also been criticism that local governments in China have preferred providing public service sectors which could benefit intermediate economic development while overlooking sectors needing long-term investment, such as education, health, and the environment, especially in rural regions [4]. Some scholars also criticized the low efficiency of fiscal expenditure of local governments in China [39]. Therefore, we set up our urban development model as a two-step system that includes economic development and municipal infrastructure processes. Economic development is a sine qua non prerequisite of the second step, which utilizes the positive achievements and copes with the negative output produced in step 1.
3.2. Network DEA Model with a Slack-Based Measure
We propose a slack-based measure (SBM) network DEA model to assess the efficiency of city resource allocation in pursuing sustainable development. The inputs and outputs, both desirable and undesirable, are assigned into different stages of the system, making the weights reflect the efficiency and returns on resource investments. Then, we evaluate the performance of these factors against the city’s sustainable development level using classification techniques. For the model described below, we make use of the following symbols and definitions:
| Efficiency associated with division k | |
| Desirable input variables of division k | |
| Desirable output variables of division k | |
| Undesirable outputs variables of division k | |
| Slack variable on the desirable input of division k | |
| Slack variable on the desirable output of division k | |
| Slack variable on the undesirable output of division k | |
| Intensive vector after linearization in division k, where | |
| Intensive vector corresponding to the inputs and outputs in division k | |
| tk | Variable for linear transformation of division k |
| Predefined weights to represent the contribution of division k to the efficiency of the system |
We consider a system composed of d divisions and m inputs and s outputs in all d divisions. For each division, we choose a slack-based measure with desirable and undesirable variables, as follows [15]:
s.t.
Model (1) is a nonlinear programming model that can be transformed to a linear programming model as shown below:
s.t.
Models (1) and (2) are both for non-oriented divisional efficiency. For the input-oriented divisional efficiency, our model becomes the following:
s.t.
Similarly, for output-oriented divisional efficiency, the model becomes the following:
s.t.
After we obtain the efficiencies of the individual stages, we apply the efficiency aggregation model (5) presented in [40] to calculate the systematic efficiency.
4. Research Design
4.1. Variable Selection
The system process of urban sustainable development shown above can be divided into two steps. We chose capital investment, population, electricity, land, and water as traditional inputs [41,42,43]. Electricity, land, and water variables are proxies for the natural resources used in urban development and should be considered for long-term sustainable development. As for the outputs of the first stage, they should reflect not only the achievement of economic production processes but also the industrial waste produced in the first process. Therefore, traditional GDP, as a desirable economic output, and industrial waste, dust production, and industrial SO2 production, as the undesirable outputs, are introduced into step 1. Recognizing the crucial role of the local government in the urban development process, which is mainly in charge of local pensions, health, and education systems, we introduced in this stage the available government revenues.
Industrial wastewater emissions, industrial dust emissions, and SO2 emissions are entered into the model as undesirable outputs in step 1. These outputs, both desirable and undesirable, are the results of the economic production process and should be regarded as intermediate products, which are outputs in step 1 and inputs in step 2 and will be utilized and disposed of in the second stage of this network structure.
Regarding the outputs in step 2, since social well-being is a dimension that has many aspects, the research community has not yet reached an agreement on a precise definition. According to the National Bureau of Statistics of China, national general public expenditure is mainly on education (14.61%), urban and rural community affairs (10.43%), agriculture, forestry, and water conservation (9.57%), healthcare (6.98%), transport (4.94%), and science and technology (3.99%) [44]. Based on the distribution of public finances, we adopted the urban sustainability index [7]. This study chose the number of middle school students, people receiving a pension/unemployment insurance, and buses as outputs of the second step. For undesirable outputs, the emission of industrial dust and industrial sulfur dioxide are introduced as outputs in step 2 to reflect the result of waste treatment and disposal in urban development.
While applying the DEA analysis, there should be no indication of multicollinearity among the variables introduced into the model. However, some abovementioned variables may reflect similar economic implications, thus they might present a relatively high correlation. Principal component analysis is used to reduce the dimensionality of the variables to cope with this issue. For example, the variables pertaining to construction land area, water consumption, and electricity consumption all reflect the use of natural resources to pursue economic growth and urban development. Thus, they show high correlations with each other. Similar conditions also appear among the outputs in the second stage, such as the number of pensions and unemployment benefits dispersed, doctors, buses, and green areas, representing the development of the social welfare system and residential facilities. Therefore, three compound variables are introduced into the model to help reflect the corresponding economic connotations. More details about the data selection and corresponding processing are listed and described in Table 1.

Table 1.
Summary of input and output indicators.
The inclusion of many variables in different dimensions naturally prompts questions of variable selection, decomposition of influence, and analysis of main effects for inputs and outputs. Global sensitivity and uncertainty analysis (GSUA) consider the probability distribution functions of all variables and their nonlinearity dependency on interactions. This should be done for any tracked indicator pattern or for a composite systemic indicator that combines them and has been updated to enhance the practicality of this method [45,46,47]. GSUA can extract drivers of patterns also considering their interdependencies. Since there is an uncertainty that needs to be characterized, it seems necessary to utilize a sensitivity analysis to verify the stability and robustness of model construction [48,49,50].
4.2. Data Sources and System Settings
As for the other aspects in this model, the time range from 2005 to 2016 was due to data availability. There are 284 Chinese cities in our database, containing more than 85% of China’s population. The data sources included the China City Statistical Yearbook and the China City Construction Statistical Yearbook. There were some missing values for some variables, such as the emission of SO2 due to regulation. When less than 10% of the values were missing, we used a random forest method to estimate them. Considering the network DEA model is a process that combines economic development and natural resource utilization, we chose an input orientation during the whole process.
The network DEA model was coded and solved by CPLEX 12.4 on the Dell Latitude E7470 with an Intel i7 2.20 GHz processor. The statistical analysis of the results was coded in R. To compare the performance of the measurement, we classified the cities based on their characteristics and eco-efficiency levels and then compared the classification results with the results obtained from the USI system, where the weight is determined by the assessments of experts.
5. Results and Discussion
5.1. Results
The eco-efficiencies for the 284 Chinese cities are shown in the map below, based on their location. Their colors reveal the eco-efficiency and sub-efficiency according to our calculations. Our sample covered most Chinese cities, especially those in the eastern and interior region. Figure 2 presents the result of sub-efficiency of step 1 in 4 different observation years. The first row shows the situations in 2005 and 2009, while the second row presents those in 2013 and 2016. In these pictures green is the most evident color, indicating that the performance of cities remains to some extent stable during the whole period. However, there is still some structural evolution at this stage. In the western area, the number of yellow and red cities, even in some eastern and coastal regions, tends to decrease, especially in the second decade of the 21st century. Only metropolitan cities such as Beijing, Shanghai, and some northeastern cities realize efficiency improvement in economic development during these 12 years.
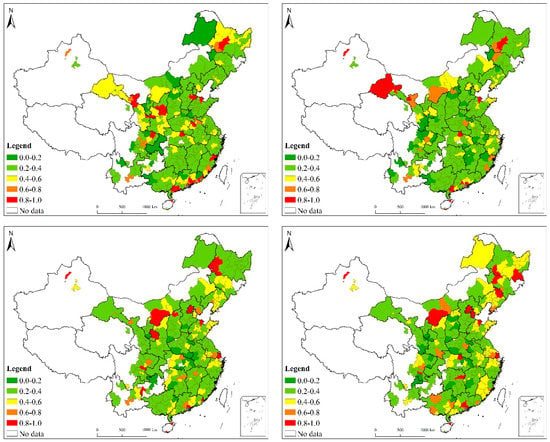
Figure 2.
Step1 sub-efficiency of cities in 4 different years.
Figure 3 shows the results of sub-efficiency in step 2 for different years. In 2005, most Chinese cities had a sub-efficiency value of more than 0.4, causing the main colors of that figure to become yellow, orange, or even red, while the decreasing trend is quite obvious. In 2016 there were no more than ten cities whose color was not green, indicating that cities all around China have experienced a significant decline in their sustainable consumption and distribution the urban development process. This confirms that most Chinese cities did not perform better on municipal construction to make them more livable and sustainable. Only regions such as Beijing, Yangtze River Delta, Pearl River Delta, and some northeastern cities retained a relatively higher level of sub-efficiency at the end of the observation period.
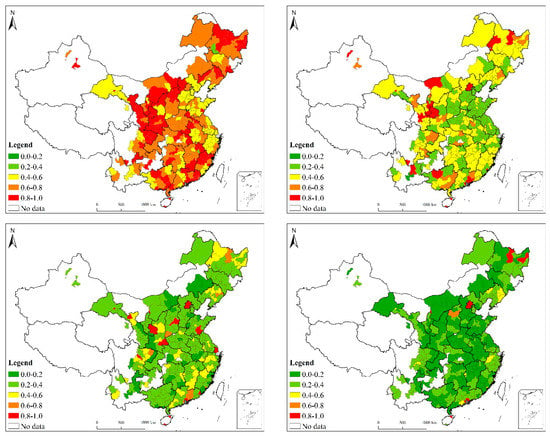
Figure 3.
Step 2 sub-efficiency of cities in 4 different years.
Summarizing both steps, the process efficiency of urban sustainable development could be calculated using the given algorithm. The results of eco-efficiency analysis are presented in Figure 4. It can be seen that in the second stage, most Chinese cities experienced a decline in efficiency, the most significant of which is evident in the western and interior regions. Eastern and coastal cities also have decreased their efficiency to some extent, while most developed and promising municipalities such as Beijing, Shanghai, Guangzhou, and Shenzhen still retained high standards of eco-efficiency over time, especially in the 2010s.
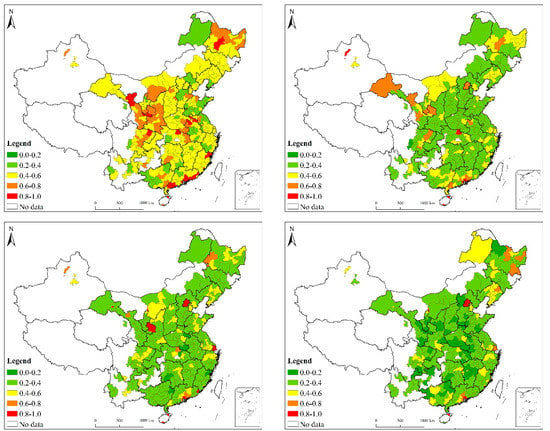
Figure 4.
Eco-efficiency of cities in 4 different years.
Thereafter, the calculations can be described in aggregate terms. While computing the average of a certain group, we used population to obtain the weighted average to reflect the average efficiency of the whole sample or certain group. The results are presented in Table 2. The eco-efficiency of Chinese cities declined during our observation period and the reason can be mainly attributed to the decline of sub-efficiency in step 2 of urban construction and pollution treatment. In step 1, which mainly reveals the efficiency of economic development, a slow increase was seen over the 12-year period, even though there was some fluctuation around 2008 as a result of the global financial crisis. As for the second stage, the sub-efficiency in this step experienced a dramatic decline and the downward trend is very stable, from more than 0.7 in the first year to only 0.28 at the end of the observation period in 2016. The reason for this decline might be attributed to the selection of variables in our model. The outputs in step 2 included variables of insurance coverage and number of middle school students, which were naturally increasing at a slower rate than GDP. It might also indicate that increases in social welfare development in Chinese cities was far behind the overall rate of economic growth, and the pollution treatment efficiency in most cities still lagged in comparison with modern metropolitan areas such as Shenzhen.

Table 2.
Eco-efficiency and sub-efficiency of cities in China during 2005 and 2016.
To highlight the findings of this study, the results are reported by representative samples or in groups instead of as a detailed city-to-city comparison. The results for individual cities are available in the Appendix A. These Chinese cities can be grouped in terms of dimensions such as administrative levels (municipalities, provincial capital, vice-provincial cities, as well as prefecture-level and county-level cities. Our sample did not include county-level cities because of data availability), regions (eastern, northeastern, interior, and western regions) and different city clusters or groups.
The four municipalities included Beijing, Tianjin, Shanghai, and Chongqing, and these four cities have the highest administrative levels in China. Among the fifteen vice-provincial cities, ten of them (Shenyang, Changchun, Ha’erbin, Nanjing, Hangzhou, Jinan, Wuhan, Chengdu, Xi’an, and Guangzhou) are capital cities of their corresponding provinces, and the other five (Shenzhen, Dalian, Qingdao, Ningbo, and Xiamen) are specially designated in the state plan as key cities. These 19 cities might be able to benefit from resources coming from the central government to help promote urban sustainable development. Figure 5, Figure 6 and Figure 7 report the average sub-efficiency and eco-efficiency levels of the different administrative city groups during the 2005–2016 period.
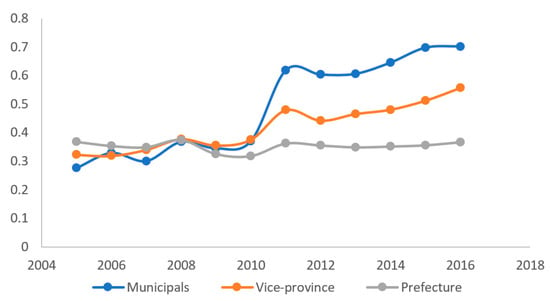
Figure 5.
Step 1 sub-efficiency of cities on different administrative levels.
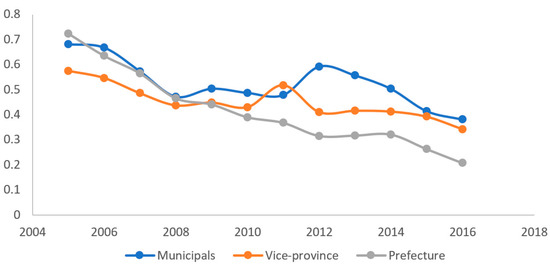
Figure 6.
Step 2 sub-efficiency of cities on different administrative levels.
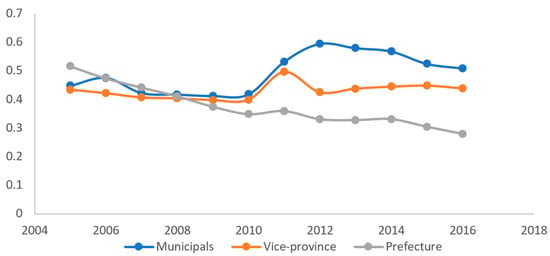
Figure 7.
Eco-efficiency of the cities on different administrative levels.
In Figure 5, the economic growth sub-efficiency levels of the cities in different administrative levels remain almost the same in the first half of the period, while showing significant differences compared to those of prefecture cities in the second half of the period, which had an even higher economic growth sub-efficiency level at the beginning. However, in the second half of the period, cities with higher administrative levels performed better than cities with lower levels, confirming the economic growth efficiency in Chinese cities of various administrative levels. Prefecture-level cities did not make any improvement on efficiency during the observed period, while the efficiency values of the municipalities and vice-provincial cities in 2016 were almost double the efficiency values in 2005.
As for the sub-efficiency values of the second stage, Figure 6 shows that the cities at different administrative levels all experienced dramatic declines during the whole period, while cities with higher administrative levels still performed better than the prefecture cities at the end of the observation period. Municipalities and vice-provincial cities even realized some rebound during the years of 2011 to 2012. Prefecture cities were in the first place among the three administrative levels initially but ended up in third place in 2016, the end of our observation period. These two sub-efficiency coefficients led to the final and combined eco-efficiency result, which is presented in Figure 7, and it can be described as the combination of the results of both steps. Thus, cities with higher administrative levels showed significant advantages, which were mainly revealed in the second decade of the 21st century. This administrative advantage did make a great difference regarding the urban sustainability levels of the Chinese cities.
As for regional groups, most studies have conventionally divided China into the eastern, interior, and western regions. However, these divisions can no longer meet our needs due to changes in the real conditions. Recently, the National Bureau of Statistics started to utilize a four-group classification criterion. With this, the provinces and municipalities in China can be grouped by location into the following four regions: eastern, interior, western, and northeastern, as shown in Table 3.

Table 3.
Regional classification of provinces in China.
Figure 8, Figure 9 and Figure 10 show the population weighted average efficiency values of the cities in different Chinese regions during our observation period. There are significant differences among regions in terms of the sub- and eco-efficiency perspectives, and the regions took different paths during the 16 years. Interior and western cities showed some fluctuation during the 12 years but experienced little change without any advance overall. On the other hand, the northeastern and eastern cities had a relatively higher starting point in step 1 and widened their advantage over the interior and western cities during the observation period. For step 2, the sub-efficiency values of all four regions were declining, while these two regions started at a relatively low standard among the four regions but also ended up with the top two places in 2016, indicating that eastern and northeastern cities were also performing more efficiently while utilizing their economic outputs to carry out urban construction. According to the results, eastern and northeastern cities showed higher combined eco-efficiency levels at the aggregate level at the end year, and their advantage seemed to expand in the later years, which might be mostly due to their performances in the economic efficiency section. Starting from the last rank, the eastern area became one of the regions with the highest efficiency by the end of 2016. It is well known that unbalanced regional development has become an issue that is receiving increasing attention in China. The government made great efforts and attempts to promote development in the central and western parts of the country by introducing preferential policies and devoting significant resources. However, our calculations indicate that the efficiency levels of these regions continue to lag behind, and these gaps seem still to be widening in recent years and could do so even in the future.
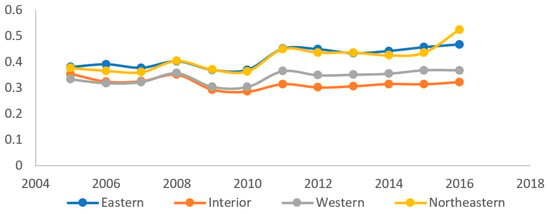
Figure 8.
Step 1 sub-efficiency of cities and regions.
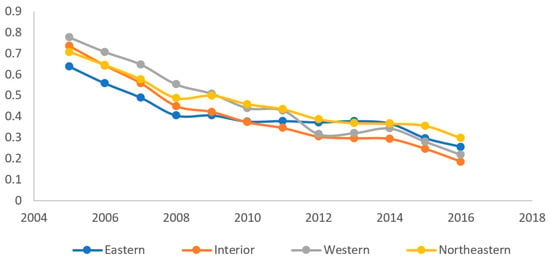
Figure 9.
Step 2 sub-efficiency of cities and regions.
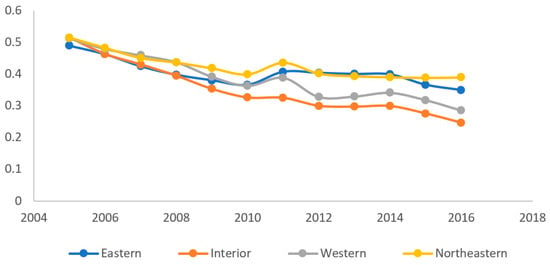
Figure 10.
Eco-efficiency of cities in different administrative levels.
There is another trend that should be stressed regarding Chinese urban development, which is that the central government has been making a great effort to promote the formation and development of city agglomeration. The central government has approved development plans for more than 10 national-level city groups since 2018, and these covered more than 50% of the cities in our sample and more than 80% of the national population. Therefore, it is important to analyze the eco-efficiency results obtained from the perspective of city groups and clusters. Since there have been more than 10 city groups under planning, we chose the three largest and most important city groups in our sample (Beijing–Tianjin–Hebei, Yangtze River Delta, and the Guangdong–Hong Kong–Macao Greater Bay Area) to compare their eco-efficiency and sub-efficiency results.
Figure 11, Figure 12 and Figure 13 present the population weighted average results of the eco-efficiency and sub-efficiency calculations of the cities in the three largest clusters. It can be observed that the Guangdong–Hong Kong–Macao Greater Bay Area had the highest level of development and efficiency on urban sustainability among these three city groups and among all of the 13 Chinese city groups in terms of both economic growth and urban sustainable construction. Regarding the economic growth process, although there was some fluctuation around 2011, all three city groups still improved the efficiency of their economic development at the end of the observation period compared to the beginning of 2005. The second step and the combined eco-efficiency figures presented a similar condition, with the Big Bay Area being the most efficient group and the other two at almost the same level. We should also point out that these city groups were the top three according to our results and comparisons.
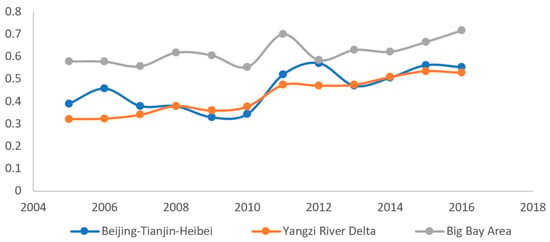
Figure 11.
Step 1 sub-efficiency of cities in 3 biggest city groups.
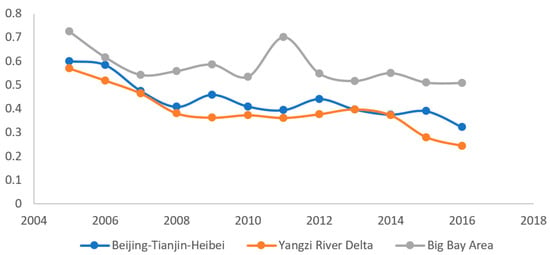
Figure 12.
Step 2 sub-efficiency of cities in 3 biggest city groups.
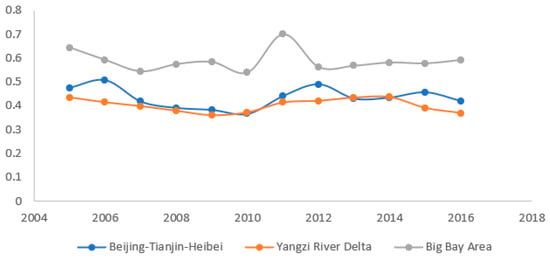
Figure 13.
Eco-efficiency of cities in 3 biggest city groups.
Since the selection of variables in our approach mainly referred to USI, it is natural to compare the results of our eco-efficiency and USI scores. We should point out that the two evaluation systems were built based on different frameworks. The USI approach calculates a weighted average of the output variables after standardized processing, which emphasizes the results of urban development without considering how much cost or input it takes to obtain the current level of achievement. The eco-efficiency measure in our study pays more attention to the efficiency of transferring inputs to outputs. This approach is important for evaluating urban sustainable development and observing the performance of Chinese cities with respect to both evaluation systems. The results are presented in Table 4. For simplicity, we only report the result of the municipalities, vice-provincial cities, and provincial capital cities.

Table 4.
Comparison of eco-efficiency and USI scores (2005–2016 average).
In Table 4, metropolitan cities such as Beijing, Shanghai, Guangzhou, and Shenzhen, which are widely accepted as first-tier Chinese cities, performed well in terms of both the final score and from the process efficiency perspective, confirming their leading position throughout China. This is particularly true of Shenzhen, which ranked in first place in both lists, making it the city with the highest sustainability efficiency level. Big cities in coastal provinces (Nanjing, Hangzhou, Tianjin) and some tourist cities (Xiamen and Haikou) also performed well on the USI, with a relatively high efficiency in making full use of the resources to maximize their “revenue” from urban sustainable development (eco-efficiency). However, the eco-efficiency and USI results are not always in agreement. There were also some cities (Xi’an, Yinchuan, Guiyang), mainly in western China, that obtained a relatively good USI score with low eco-efficiency, indicating that their urban development is, to some extent, inefficient. Some interior and western cities (Chongqing, Shijiazhuang, and Nanning) showed an even poorer performance on both the USI score and eco-efficiency.
5.2. Analysis of Variance
The analysis above shows the difference in eco-efficiency and sub-efficiency among Chinese cities in different groups and between the final USI scores and process efficiency in our approach. These simple comparisons, however, might be insufficient. A case in point is that the group analysis cannot reflect the individual results of all 284 cities in our sample, implying that further analysis is necessary to make our analysis more convincing and comprehensive. Therefore, we used ANOVA to compare the results of both approaches.
We performed an ANOVA to verify the difference in sub-efficiency and eco-efficiency among regions and other city groups. The results show that there is a significant difference (p < 0.05, Table 5) among different regions independent of the sub-efficiencies and eco-efficiency section, verifying that our analysis above is convincing and robust. We grouped our cities into 10 city groups and performed another ANOVA. The results obtained show that the difference among groups is statistically significant and the cities in different groups show different characteristics in sub-efficiencies and eco-efficiency.

Table 5.
Results of ANOVA on sub-efficiency and eco-efficiency.
Our next task was to validate our analysis of the comparison between eco-efficiency and the available USI scores. For this purpose, we developed a randomized complete block design for validation, dividing our sample into different blocks to see whether there was any difference between USI scores and eco-efficiency figures in each block. We compared the means using a Duncan multiple range test at the 95% confidence level. The results in Table 6 indicate that among all four regions, only the scores and eco-efficiency levels of eastern cities had significant differences, while for the other regions no statistically significant differences could be observed. That means there might be a mismatch between the USI score and eco-efficiency in eastern cities, i.e., they may get a good USI score with a relatively low eco-efficiency or vice versa. However, such patterns did not repeat in the other three regions. The reason for these results might be that the east region is the most developed and has higher investment levels than other regions. Governments of eastern cities might not be able to make full use of these investments and city government in other regions did not have to manage with such investment pressure. Accordingly, the result of the randomized block design might not be significant. There is no significant difference between the USI score and eco-efficiency when we used administrative level as a block. Such a mismatch did not exist in this cluster, indicating that larger cities were able to handle their input and investment into urban development efficiently just as smaller cities.

Table 6.
Results of randomized complete block design among regions.
5.3. Sensitivity Analysis
Based on our explanation above, we conducted a sensitivity analysis to help us evaluate the importance and influence of variables included in our model. The results are presented in Appendix A. We should point out that the selection and position of each variable was based on the framework of urban sustainable development in the theoretical analysis. Therefore, the sensitivity analysis provides a peripheral reflection on the weight and importance of the variables in the model, but should not be a criterion of model construction.
More importantly, we only present average values over time while skipping confidence intervals, which limits the information that can be provided. Therefore, this information can be plotted considering the probability distribution function of variables, and the result has been presented in Figure 14. With most plots distributed around 0 value, the robustness and stability of our model has been confirmed and there would be little probability that fluctuation of a single variable would drastically change our calculations and the efficiency of the urban sustainability construction and development. We also present a robustness check in Appendix A where the sample has been divided into three parts, and the results remain stable, confirming the suitability of the model and the sensitivity of each variable to influence the calculations.
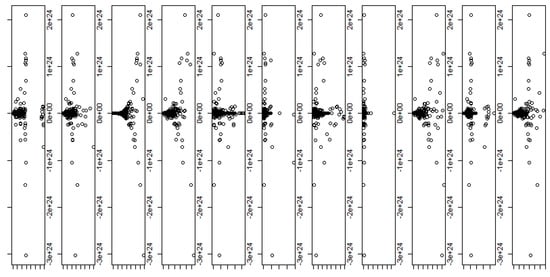
Figure 14.
Probability distribution functions (pdfs) of variables.
6. Conclusions and Policy Implications
6.1. Conclusions
To cope with several weaknesses in the conventional DEA model, an SBM network DEA model was introduced to assess the performance of urban sustainable development in 284 Chinese cities, measuring the eco-efficiency of transferring factor inputs into economic growth, social well-being, and preventing waste emissions. An ad hoc framework reflecting urban development was divided into a production section and distribution section to reveal phased features of each step. For the selection of variables, a series of social well-being indicators was included to reveal the benefit of citizens from developing processes.
We presented our results by comparing the eco-efficiency levels of cities in different groups. We also reported the comparison analysis between results in this approach and USI to reveal the difference in the sustainability final score and eco-efficiency. An analysis of variance and a sensitivity analysis were conducted to reflect the heterogeneity of eco-efficiency and importance of each variable included in the model, providing other perspectives to understand the results of eco-efficiency calculated in our model. Through the research, we discovered some important characteristics of eco-efficiency.
(1) The eco-efficiency of Chinese cities experienced a significant decrease during our observation period from 2005 to 2016 while the efficiency of economic development, to some extent, remained stable. The main reason for this eco-efficiency decrease should be attributed to the distribution and consumption processes. This means that economic development of most Chinese cities was not well transferred into improvements in social welfare coverage and environment protection, resulting in a decreasing trend on eco-efficiency in general.
(2) When we focus on structural characteristics of eco-efficiency, we can see dramatic differences among cities of different administrative levels, geographic regions and city groups. Cities in higher administrative levels and east regions (eastern and northeastern) tended to strengthen their advantages during this period. Among the three most important city groups, the performance of Big Bay Area is significantly better than that of the other two.
(3) We compared the result of eco-efficiency, which pays more attention to the efficiency, and USI index, which emphasizes the results of urban development. First-tier cities performed well in terms of both aspects, while we can also see structural differences between the two index results in some interior and western cities, indicating an inefficient urban sustainable development.
6.2. Policy Implications
Based on the results obtained, some policy implications are summarized as follows.
Firstly, Chinese cities should be vigilant about the decreasing efficiency of transforming economic development into tangible improvement in welfare coverage, urban infrastructure development, and reduction of pollution emissions. This is of particular importance considering the enormous pressure coming from the mass migration of more than 200 million individuals from rural to urban areas. The China’s urbanization process will be further extended and deepened. Local governments should pay more attention to the efficiency of urban infrastructure construction to ensure that economic achievement could benefit every citizen including rural populations.
Secondly, it is crucial for the central government to recognize the imbalance among cities in different administrative levels, geographic regions, and city groups. Larger cities have better demonstrated their stronger ability and urban construction efficiency than small ones. In order to realize a long-term sustainable development, the central government should continuously commit to maintain the balance among cities and reduce their efficiency gaps by further sharing prosperity and promoting communication to enable the spillover of knowledge and management ability among cities, especially within the same city group. In addition, it is also important to point out that there is a significant difference between urban development and efficiency, especially in cities in the interior and western regions, suggesting stakeholders must improve input–output efficiency while pursuing urban development.
There are several directions for future research. It is imperative to open the “black box” of urban sustainable development to reveal this complex process, which can be divided in different ways to reflect its diversification and intricacies. Second, some other data variables related to eco-efficiency and urban sustainability are not reported in the yearbook published by the Chinese government. They can also be introduced into this model to help reveal the efficiency of this process. Regardless of some data limitations, it is worthwhile to attempt presenting a two-step process-based framework using a network DEA model with an SBM to analyze the compositional data on urban development and to classify cities based on their uses of resources for sustainable development. The outcomes of this study can help city managers, investors, and other stakeholders evaluate investments and address shortcomings in future development planning.
Author Contributions
B.S.: conceptualization, methodology, writing—original draft, formal analysis, visualization. H.W.: conceptualization, methodology, software, writing—review and editing, visualization. J.O.: investigation, writing—review and editing. J.H.: investigation. C.Z.: investigation, writing—review and editing. Z.W.: investigation. All authors have read and agreed to the published version of the manuscript.
Funding
This research was funded by Jiangsu Provincial Department of Education grant number [2021SJA0363]; Ministry of Education in China, grant number [21YJC790166].
Institutional Review Board Statement
Not applicable.
Informed Consent Statement
Not applicable.
Data Availability Statement
Data available in a publicly accessible repository that does not issue DOIs. Publicly available datasets were analyzed in this study. This data can be found here: http://www.stats.gov.cn/tjsj/.
Conflicts of Interest
The authors declare no conflict of interest.
Appendix A

Table A1.
Result of sensitivity analysis.
Table A1.
Result of sensitivity analysis.
| Variable | Position | Sensitivity-Main | Sensitivity-Total |
|---|---|---|---|
| Population | Input-1 | 0.0077 | 2.1729 |
| Investment | Input-1 | 0.0007 | −3.1388 |
| Natural resources | Input-1 | 0.6497 | 0.9997 |
| GDP | Intermediate | 0.0007 | −3.1388 |
| Industry SO2 production | Intermediate | 0.0007 | −3.1388 |
| Industry dust production | Intermediate | 0.0007 | −3.1388 |
| SO2 emissions | Output-2 | 0.0007 | −3.1388 |
| Dust emissions | Output-2 | 0.0007 | −3.1388 |
| Insurance covered | Output-2 | 0.0007 | −3.1388 |
| Middle school students | Output-2 | 0.0007 | −3.1388 |
| Social development | Output-2 | 0.0007 | −3.1388 |
| Sum | 0.6639 | −25.0768 |
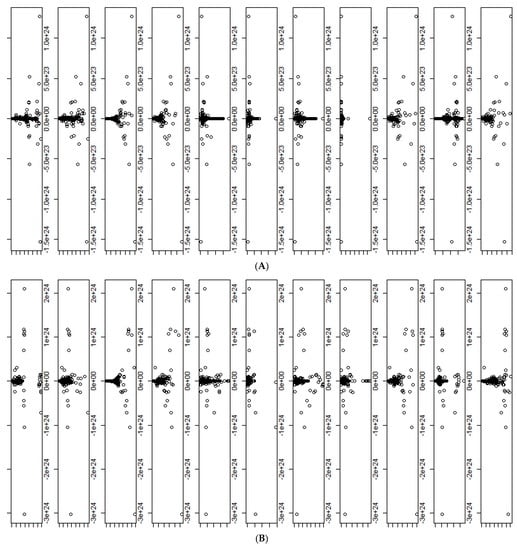
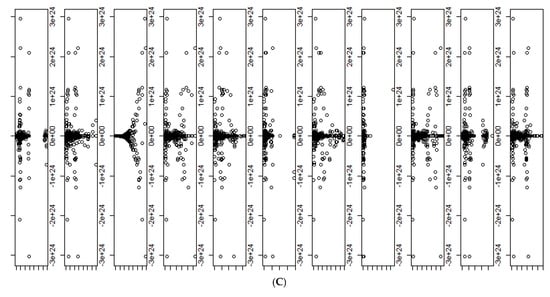
Figure A1.
Sensitivity analysis of Sample A (A), sensitivity analysis of Sample B, (B) and sensitivity analysis of Sample C (C).
References
- United Nations Department of Economic. The Millennium Development Goals Report; United Nations Publications: New York, NY, USA, 2014. [Google Scholar]
- Lu, W.; Leung, A.Y. A preliminary study on potential of developing shower/laundry wastewater reclamation and reuse system. Chemosphere 2003, 52, 1451–1459. [Google Scholar] [CrossRef]
- Ongley, E.D.; Xiaolan, Z.; Tao, Y. Current status of agricultural and rural non-point source Pollution assessment in China. Environ. Pollut. 2010, 158, 1159–1168. [Google Scholar] [CrossRef] [PubMed]
- West, L.A.; Wong, C.P.W. Fiscal decentralization and growing regional disparities in rural China: Some evidence in the provi-sion of social services. Oxf. Rev. Econ. Policy 1995, 11, 70–84. [Google Scholar] [CrossRef]
- Sun, X.; Liu, X.; Li, F.; Tao, Y.; Song, Y. Comprehensive evaluation of different scale cities’ sustainable development for economy, society, and ecological infrastructure in China. J. Clean. Production. 2017, 163, S329–S337. [Google Scholar] [CrossRef]
- Wilson, D.; Rodic, L.; Cowing, M.J.; Velis, C.; Whiteman, A.D.; Scheinberg, A.; Vilches, R.; Masterson, D.; Stretz, J.; Oelz, B. ‘Wasteaware’ benchmark indicators for integrated sustainable waste management in cities. Waste Manag. 2015, 35, 329–342. [Google Scholar] [CrossRef]
- Urban China Initiative. The China Urban Sustainability Index 2016; Urban China Initiative: Beijing, China, 2017. [Google Scholar]
- Phillis, Y.A.; Kouikoglou, V.S.; Verdugo, C. Urban sustainability assessment and ranking of cities. Comput. Environ. Urban Syst. 2017, 64, 254–265. [Google Scholar] [CrossRef]
- Schaltegger, S.; Sturm, A. Ökologische Rationalität: Ansatzpunkte Zur Ausgestaltung Von Ökologieorientierten Managementinstrumenten. Die Unternehm. 1990, 44, 273–290. Available online: http://www.jstor.org/stable/24180467 (accessed on 19 February 2019).
- Long, X.; Sun, M.; Cheng, F.; Zhang, J. Convergence analysis of eco-efficiency of China’s cement manufacturers through unit root test of panel data. Energy 2017, 134, 709–717. [Google Scholar] [CrossRef]
- Xiao, H.; Shan, Y.; Zhang, N.; Zhou, Y.; Wang, D.; Duan, Z. Comparisons of CO2 emission performance between secondary and service industries in Yangtze River Delta cities. J. Environ. Manag. 2019, 252, 109667. [Google Scholar] [CrossRef]
- Li, H.; Long, R.; Chen, H. Economic transition policies in Chinese resource-based cities: An overview of government efforts. Energy Policy 2013, 55, 251–260. [Google Scholar] [CrossRef]
- Mickwitz, P.; Melanen, M.; Rosenström, U.; Seppälä, J. Regional eco-efficiency indicators—A participatory approach. J. Clean. Prod. 2006, 14, 1603–1611. [Google Scholar] [CrossRef]
- Charnes, A.; Cooper, W.W.; Rhodes, E. Measuring the efficiency of decision making units. Eur. J. Oper. Res. 1978, 2, 429–444. [Google Scholar] [CrossRef]
- Tone, K. A slacks-based measure of efficiency in data envelopment analysis. Eur. J. Oper. Res. 2001, 130, 498–509. [Google Scholar] [CrossRef]
- Tone, K.; Tsutsui, M. Dynamic DEA: A slacks-based measure approach. Omega 2010, 38, 145–156. [Google Scholar] [CrossRef]
- Chang, Y.-T.; Zhang, N.; Danao, D.; Zhang, N. Environmental efficiency analysis of transportation system in China: A non-radial DEA approach. Energy Policy 2013, 58, 277–283. [Google Scholar] [CrossRef]
- Kao, C. Measuring the performance of industrial processes with data envelopment analysis. In Proceedings of the Sustainable Research and Innovation Conference, Nairobi, Kenya, 9 May 2014. [Google Scholar]
- Piña, W.H.A.; Martínez, C.I.P. Development and Urban Sustainability: An Analysis of Efficiency Using Data Envelopment Analysis. Sustainability 2016, 8, 148. Available online: http://www.mdpi.com/2071-1050/8/2/148 (accessed on 19 February 2019). [CrossRef]
- Yin, K.; Wang, R.; An, Q.; Yao, L.; Liang, J. Using eco-efficiency as an indicator for sustainable urban development: A case study of Chinese provincial capital cities. Ecol. Indic. 2014, 36, 665–671. [Google Scholar] [CrossRef]
- Sueyoshi, T.; Yuan, Y. China’s regional sustainability and diversified resource allocation: DEA environmental assessment on economic development and air pollution. Energy Econ. 2015, 49, 239–256. [Google Scholar] [CrossRef]
- Sueyoshi, T.; Yuan, Y. Social sustainability measured by intermediate approach for DEA environmental assessment: Chinese regional planning for economic development and pollution prevention. Energy Econ. 2017, 66, 154–166. [Google Scholar] [CrossRef]
- Huang, J.; Xia, J.; Yu, Y.; Zhang, N. Composite eco-efficiency indicators for China based on data envelopment analysis. Ecol. Indic. 2018, 85, 674–697. [Google Scholar] [CrossRef]
- Yu, Y.; Zhu, W.; Zhang, Q. DEA cross-efficiency evaluation and ranking method based on interval data. Ann. Oper. Res. 2019, 278, 159–175. [Google Scholar] [CrossRef]
- Ding, T.; Zhou, Z.; Dai, Q.; Liang, L. Analysis of China’s Regional Economic Environmental Performance: A Non-radial Multi-objective DEA Approach. Comput. Econ. 2020, 55, 1209–1231. [Google Scholar] [CrossRef]
- Ouertani, M.N.; Naifar, N.; Ben Haddad, H. Assessing government spending efficiency and explaining inefficiency scores: DEA-bootstrap analysis in the case of Saudi Arabia. Cogent Econ. Financ. 2018, 6, 1493666. [Google Scholar] [CrossRef]
- Xiao, H.; Wang, D.; Qi, Y.; Shao, S.; Zhou, Y.; Shan, Y. The governance-production nexus of eco-efficiency in Chinese resource-based cities: A two-stage network DEA approach. Energy Econ. 2021, 101, 105408. [Google Scholar] [CrossRef]
- Long, X.; Chen, B.; Park, B. Effect of 2008′s Beijing Olympic Games on environmental efficiency of 268 China’s cities. J. Clean. Prod. 2018, 172, 1423–1432. [Google Scholar] [CrossRef]
- Charnes, A.; Cooper, W.W.; Thrall, R.M. Classifying and characterizing efficiencies and inefficiencies in data development analysis. Oper. Res. Lett. 1986, 5, 105–110. [Google Scholar] [CrossRef]
- Tsolas, I.E. Modeling profitability and stock market performance of listed construction firms on the Athens Exchange: Two-stage DEA approach. J. Constr. Eng. Manag. 2013, 139, 111–119. [Google Scholar] [CrossRef]
- Lozano, S. Technical and environmental efficiency of a two-stage production and abatement system. Ann. Oper. Res. 2017, 255, 199–219. [Google Scholar] [CrossRef]
- Wu, J.; Lv, L.; Sun, J.; Ji, X. A comprehensive analysis of China’s regional energy saving and emission reduction efficiency: From production and treatment perspectives. Energy Policy 2015, 84, 166–176. [Google Scholar] [CrossRef]
- Li, W.H.; Liang, L.; Cook, W.D. Measuring efficiency with products, by-products and parent-offspring relations: A conditional two-stage DEA model. Omega 2017, 68, 95–104. [Google Scholar] [CrossRef]
- Zhang, J.; Liu, Y.; Chang, Y.; Zhang, L. Industrial eco-efficiency in China: A provincial quantification using three-stage data envelopment analysis. J. Clean. Prod. 2017, 143, 238–249. [Google Scholar] [CrossRef]
- Li, H.; Zhou, L.-A. Political turnover and economic performance: The incentive role of personnel control in China. J. Public Econ. 2005, 89, 1743–1762. [Google Scholar] [CrossRef]
- The Chinese Government. Notice on Improving the Performance Appraisal of Local Party and Government Leadership and Leading Cadres. 2013. Available online: http://www.gov.cn/jrzg/2013-12/09/content_2545183.htm (accessed on 19 February 2019).
- Qian, Y.; Roland, G. Federalism and the soft budget constraint. Am. Econ. Rev. 1998, 88, 1143–1162. [Google Scholar] [CrossRef]
- Lin, J.Y.; Liu, Z. Fiscal Decentralization and Economic Growth in China. Econ. Dev. Cult. Chang. 2000, 49, 1–21. [Google Scholar] [CrossRef]
- Chen, S.; Zhang, J. Empirical research on fiscal expenditure efficiency of local governments in China: 1978–2005. Soc. Sci. China 2009, 30, 21–34. [Google Scholar]
- Kao, C. Efficiency decomposition and aggregation in network data envelopment analysis. Eur. J. Oper. Res. 2016, 255, 778–786. [Google Scholar] [CrossRef]
- Chiu, C.-R.; Liou, J.-L.; Wu, P.-I.; Fang, C.-L. Decomposition of the environmental inefficiency of the meta-frontier with undesirable output. Energy Econ. 2012, 34, 1392–1399. [Google Scholar] [CrossRef]
- Hu, J.-L.; Wang, S.-C. Total-factor energy efficiency of regions in China. Energy Policy 2006, 34, 3206–3217. [Google Scholar] [CrossRef]
- Ren, S.; Li, X.; Yuan, B.; Li, D.; Chen, X. The effects of three types of environmental regulation on eco-efficiency: A cross-region analysis in China. J. Clean. Prod. 2018, 173, 245–255. [Google Scholar] [CrossRef]
- National Bureau of Statistics of China. (2005–2016). China City Statistical Yearbook. China Statistics Press. Available online: https://www.chinayearbooks.com/tags/china-city-statistical-yearbook (accessed on 16 June 2021).
- Becker, S.O.; Caliendo, M. Sensitivity Analysis for Average Treatment Effects. Stata J. Promot. Commun. Stat. Stata 2007, 7, 71–83. [Google Scholar] [CrossRef]
- Gramacy, R.B.; Taddy, M.; Wild, S.M. Variable selection and sensitivity analysis using dynamic trees, with an application to computer code performance tuning. Ann. Appl. Stat. 2013, 7, 51–80. Available online: http://www.jstor.org/stable/23566502 (accessed on 19 February 2019). [CrossRef]
- Spagnol, A.; Le Riche, R.; Da Veiga, S. Global Sensitivity Analysis for Optimization with Variable Selection. SIAM/ASA J. Uncertain. Quantif. 2019, 7, 417–443. [Google Scholar] [CrossRef]
- Pianosi, F.; Sarrazin, F.; Wagener, T. A Matlab toolbox for Global Sensitivity Analysis. Environ. Model. Softw. 2015, 70, 80–85. [Google Scholar] [CrossRef]
- Pianosi, F.; Sarrazin, F.; Wagener, T. How successfully is open-source research software adopted? Results and implications of surveying the users of a sensitivity analysis toolbox. Environ. Model. Softw. 2020, 124, 104579. [Google Scholar] [CrossRef]
- Servadio, J.L.; Convertino, M. Optimal information networks: Application for data-driven integrated health in populations. Sci. Adv. 2018, 4, e1701088. [Google Scholar] [CrossRef] [Green Version]
Publisher’s Note: MDPI stays neutral with regard to jurisdictional claims in published maps and institutional affiliations. |
© 2022 by the authors. Licensee MDPI, Basel, Switzerland. This article is an open access article distributed under the terms and conditions of the Creative Commons Attribution (CC BY) license (https://creativecommons.org/licenses/by/4.0/).