Article

Location Selection of Charging Stations for Electric Taxis: A Bangkok Case

1
Technopreneurship and Innovation Management Program, Chulalongkorn University, Bangkok 10330, Thailand
2
Computer Engineering, Chulalongkorn University, Bangkok 10330, Thailand
*
Author to whom correspondence should be addressed.
Sustainability 2022, 14(17), 11033; https://doi.org/10.3390/su141711033
Submission received: 17 June 2022 / Revised: 16 August 2022 / Accepted: 1 September 2022 / Published: 4 September 2022
(This article belongs to the Section Sustainable Transportation)

Abstract

:
The transition from ICE to BEV taxis is one of the most important methods for reducing fossil fuel consumption and air pollution in cities such as Bangkok. To support this transition, an adequate number of charging stations to cover each area of charging demand must be established. This paper presents a data-driven process for determining suitable charging locations for BEV taxis based on their characteristic driving patterns. The location selection process employs GPS trajectory data collected from taxis and the locations of candidate sites. Suitable locations are determined based on estimated travel times and charging demands. A queueing model is used to simulate charging activities and identify an appropriate number of chargers at each station. The location selection results are validated using data from existing charging services. The validation results show that the proposed process can recommend better locations for charging stations than current practices. By using the traveling time data that take the current traffic condition into account, e.g., via Google Maps API, we can minimize the overall travel time to charging stations of the taxi fleet better than using the distance data. This process can also be applied to other cities.

1. Introduction

A taxi is a mode of public transport, commonly used in urban areas. As reported by the Department of Land Transport of Thailand in May 2022, there were over 80,000 registered taxis in Bangkok [1]. Most of the registered taxis in Bangkok (about 75%) are owned by the garages and cooperatives that rent out the taxis [2]. They usually split service hours into two shifts a day, of 12 h each [3]. Thus, a single taxi can be in service around the clock. On average, a Bangkok taxi driver travels around 294 km in a shift [2], with each taxi almost 600 km per day. Since nearly all taxis in Thailand use internal combustion engines (ICE), they contribute to massive carbon footprint emissions. Due to their much higher mileage, a taxi consumes as much energy and emits as much pollution as ten private cars [1]. In addition, the high level of particulate pollution, namely, PM 2.5, is currently a serious health issue in Bangkok. Furthermore, the world is dealing with a COVID-19 pandemic, and a study found that higher PM 2.5 pollution could worsen the severity of COVID-19 [4]. For these reasons, ICE taxis should be upgraded to battery electric vehicles (BEV) to reduce air pollution and PM 2.5, which is one of the sustainability trends occurring in metropolitan cities in China, the USA, and Europe.
However, one of the biggest challenges in the transition from ICE to BEV taxis is how to plan the installation of charging stations to fit the travel patterns of BEV taxis. Previous studies were conducted on the dispersion of gasoline, LPG, and NGV stations to locate optimal sites on the road networks [5]. However, these research models are not applicable for BEV charging locations because charging BEVs takes a much longer time than refueling ICE vehicles, causing queue delays. In general, these models of optimal location selections are largely based on origin-to-destination (OD) input data, yet actual travel data are difficult to obtain for taxis.
The analysis of optimal charging station locations is divided into two approaches: intercity models and intracity models. Our study focuses on the latter. Furthermore, actual travel data are combined with geographic information system (GIS) data to assist in determining appropriate locations, while establishing a taxi charging station will prioritize taxis’ trajectory. The GPS data for Bangkok taxi trajectories are intriguing and have never been analyzed for this purpose. As a result, the above data will be used as input in this research to determine the most suitable locations to install charging stations. Moreover, prior research tended to examine distance as the main factor determining charging station locations, while Bangkok often encounters traffic congestion. Therefore, this study also includes travel time as another factor to better locate optimal charging locations.
As far as we are concerned, the selection of charging stations in Bangkok, whether made by the public or private sectors, has not been based on extensive data-driven analysis, making it irrelevant to urban taxis’ travel patterns. This may cause an obstacle, especially when urban taxis are upgraded to BEVs in the future. Therefore, it is vital to have sufficient charging stations in suitable locations to comply with urban taxis’ travel patterns. Hence, this research intends to identify potential charging locations for BEV taxis in Bangkok through an analysis of taxis’ travel patterns and traffic conditions in Bangkok, including adequate facilities for BEV taxis. The current findings will serve as a model for both public and private sectors to select locations for charging stations and calculate the suitable number of chargers for each station.
This paper is structured as follows. In the first section, we introduce the background of the public transportation sector’s contribution to air pollution and the transition from ICE taxis to BEV taxis in Thailand. Second, we review works of literature on charging station locations for electric vehicles and electric vehicle taxis. The literature review led to the development of an innovative process for analyzing the selection of charging station locations for electric vehicle taxis in Bangkok. Next, we describe the data and methodologies used in our studies to select charging station locations and the number of chargers needed for BEV taxis in Bangkok. Subsequently, the proposed locations are validated using data from an energy company charging service to ensure the proposed process’s reliability and accuracy. Finally, we present our findings and policy recommendations for converting traditional fuel stations to EV charging stations along taxi routes, as well as the implications for researchers.

2. Literature Review

2.1. An Analysis of Charging Stations Location

In general, optimal charging station location models were drawn from those used to indicate gas station locations, with some adaptations to keep the models in line with the context of EVs and their user behaviors. In literature reviews of the research on electric charging locations, there have been two groups: intercity and intracity.
Locating charging stations in the intercity context is drawn from a flow-based OD approach based on battery range, which is a major limitation of EVs and, thus, an indicator of charging station locations [6]. The method is to split long routes into sections and install charging stations in each section or at connecting points between adjacent sections. The optimization model was used to choose charging sites, which provided sufficient charging service coverage for all EVs that travel with the minimum number of stations. Wu and Sioshansi, attempting to increase the quick-charging station locations in response to uncertain charging demands, developed a stochastic flow-capturing location model (SFCLM) and conducted a case study in central Ohio [7]. Li et al. proposed a multipath refueling location model (MPRLM), assuming that EV drivers need to stop to refuel on their trips [8]. Li et al. demonstrated a multi-period multipath refueling location model (drawn from the previously mentioned MPRLM) in South Carolina State to enlarge charging stations’ networks to support growing intercity trips [9]. This research aimed to reduce the total costs of installing charging stations and relocating existing stations. Additionally, Xi et al. developed a simulation-optimization charging infrastructure location model in Ohio to indicate the locations of charging stations in support of personal EV cars [10]. Ghamami et al. advocated for an EV charging infrastructure to support long intercity trips using a general corridor model, with the purposes of cost management, e.g., infrastructure investments, battery, and EV-user costs. This model seemed appropriate for an EV infrastructure design on the main public roads [11]. Saelee and Horanont proposed a new approach to selecting optimal charging sites by simulating the driving range from home to office for mobile users to assess the best charging sites for EV users in Phuket Province [12]. Csonka and Csiszár proposed an inter-city charging station deployment method: (1) Determination of strategically important sites; (2) determination of candidate sites; (3) evaluation of candidate sites; (4) selection of installation sites; (5) obtaining a set of installation sites [13].
In intracity research, one of the most employed methods is locating charging stations near city centers, residential areas, shopping malls, and offices. Charging station designs are primarily based on the p-center, p-median location model, and optimization [9], aiming to achieve the most expansive coverage service in one area, with the minimum number of stations located at the center. For example, Zhu et al. proposed a model to boost efficiency in terms of charging sites and chargers in each site, with the lowest installation costs and the most convenient charging for travelers in the intracity context [14]. Sun et al. offered a model to locate charging stations in line with travel behaviors and traffic networks in urban areas [15]. Mortimer et al. proposed a model for planning public charging infrastructure to increase the efficiency of private investment. The utilization of existing charging infrastructure with places of common interest, such as restaurants, shops, bars, and sports facilities, was analyzed by a regression model. The model could recommend appropriate locations to add public charging stations in Germany [16]. Shabbar et al. estimated the demand for a charging station and investigated the desired number of electric sockets in each charging station using a Markov-chain network model. They also proposed using the Grey Wolf Optimization (GWO) algorithm to select the best charging station locations with the objective of maximizing the net profit under both budget and routing constraints [17]. He et al. proposed a contextualized EV charger optimization model that incorporates supply-and-demand constraints to plan public EV charging infrastructure in a high-density city. A spatial analysis of potential charging sites was conducted for the supply side, while EV demand projection was estimated using a Probit model. A location-allocation model was analyzed to minimize both charging demand shortfall and travel time to charging facilities. The study recommended that installing additional chargers at existing charging stations is more economical than building new stations [18].
Another method that is often used in the intercity literature is to analyze the actual travel data to locate charging stations. For example, Andrenacci et al. investigated the actual travel patterns of ICE vehicles in Rome’s urban areas to develop strategies for the optimal allocation of EV infrastructure in the city under the assumption of a complete transition from ICE to EV vehicles. The city of Rome was divided into sub-areas using cluster analysis, and then centroids were used to locate charging stations in each sub-area [19]. Moreover, the literature review also found studies on charging station locations with geographic information system (GIS) data. For example, Erbas et al. applied GIS data to select charging sites in Ankara, the capital of Turkey. First, the evaluation criteria were determined. Then, the criteria were weighted using the fuzzy Analytic Hierarchy Process method (fuzzy AHP). Spatial analyses of the criteria were performed using GIS, and an electric taxi charging station (ETCS) suitability map was obtained. A performance analysis of potential ETCSs was carried out using the Technique for Order Preference by Similarity to an Ideal Solution (TOP-SIS) [20]. In Thailand, ample research has been conducted by applying GIS to locate charging stations. For example, the Energy Policy and Planning Office reported on this topic. It drew a map of candidate charging sites on 152 main streets in Bangkok, Nonthaburi, and Samutprakarn while creating GIS data based on satellite photos taken in 2014 and a database of commerce registrations from 2014 to 2015. The data led to 522 gas stations and 722 prime locations, including 147 sub-charging stations identified as optimal charging sites [21]. Zhang et al. proposed an approach that integrated a geographical information system (GIS) and Bayesian network (BN) to deal with the location selection problem for EVs. The hybrid GIS-based BN approach is more accurate and stable under noise interruption compared to the traditional decision-making method (e.g., TOPSIS) [22].
The increment in EVs will increase power consumption and further influence the optimization of power-grid planning and scheduling. An influential factor in EV charging station allocation is power-grid capacity [23]. Liu et al. found the mechanism of factors influential to EV charging station allocation. From the energy storage perspective in EV charging stations, energy structure, electricity consumption during peak and valley periods, incentive policy, scheduling strategy, and load distribution affect EV charging station planning [24]. In the case of power-grid capacity constraints, distributed solutions will solve this problem by connecting and communicating with EV users. Studli et al. describe several distributed algorithms to achieve relative average fairness while maximizing utilization [25]. This section is dedicated to the management of large-scale EV fleet charging. If the charging of electric vehicles is not optimally coordinated, power quality and grid reliability may not be adequately addressed. Therefore, several scientific studies have concentrated on distributed and decentralized algorithms for large-scale applications. The Nash equilibrium method is used to distribute EVs to manage peak load [26].

2.2. An Analysis of Charging Station Locations Selection for EV Taxis

The popular electric vehicles used as taxis [27] are as follows. Nissan Leaf is an electric utility vehicle equipped with a Lithium-ion (Li-ion) battery that can store 40 kWh of electricity and can cover 287 km on a single charge. The car takes approximately either 12 h per charge from 0 to 100%, or one hour per charge if using a DC charger [28]. BYD e6 electric vehicles are equipped with either an Iron-Phosphate or Fe battery that can store 80 kWh of electricity and can run for approximately 400 km on a single charge. This type of car can take either 1.5 h per charge from 0 to 100% or half an hour per charge if using a DC charger. Renault–Samsung SM3 ZE is powered by a 24 kWh lithium-ion battery with a maximum of 184 km with a single charge [29]. Typically, EV taxis in Thailand are BYD e6 electric vehicles.
Nevertheless, these models cannot be applied to an analysis of optimal charging locations for EV taxis. That is because taxis differ from personal EVs with respect to their OD points [30]. While personal EVs can be adequately charged daily at home or work, Bangkok taxis usually run for 24 h with a daily distance of nearly 600 km, which is over the battery range. Moreover, due to the two-shift practice in rented taxis, a BEV taxi must be fully recharged before being handed over to the next driver. As a result, BEV taxis require public charging stations and can only charge after passengers have left. As charging takes a long time, BEV taxis can only charge when there are no passengers. However, existing models are often based on the OD concept, not occupancy status. For this reason, several studies have explored the installation of charging stations with BEV taxis as the target. Jung et al. demonstrated a stochastic dynamic itinerary–interception refueling location problem with queue delay (SDIRQ), drawn from a bi-level optimization model of taxi trajectory data that were dynamic on the road networks of Seoul, Korea, to seek appropriate locations for installing charging stations [29]. Further, Han et al. developed a model to indicate appropriate charging locations for EV taxis using a trajectory–interception method based on GPS data from 1000 taxis in Daejeon, Korea, as well as the efficacy of the EV battery. There were two analytical stages. In the first stage, the number of chargers was calculated without any limitations in a station. Then, areas with different charging demands at different times were mapped to find the nearest charging sites, which resulted in a suitable number of chargers being recommended for installation in a station. This led to the second stage: optimization of the best charging locations, as well as the maximum number of chargers in a station, under the conditions of limited station space and the lowest total cost [30]. Tu et al. examined GPS data installed in taxis in Shenzhen city, China, with the objective of locating charging locations. Through a spatial–temporal demand coverage location model (STDCLM), this research aimed to reach the maximum EV service level and charging service level by using genetic algorithms to solve STDCLM. Their results included the locations of twelve charging stations, to serve 2000 EV taxis [31]. Hu et al. conducted a feasibility study, upgrading yellow taxis to a type of electric taxi called BEV, as well as finding optimal charging station locations in support of the upgrade. Their analysis was founded on yellow taxis’ travel patterns, as recorded by GPS. The previous findings indicated that the decision to charge depended on both the remaining electric battery storage and the distance from the nearest charging station, while also considering the existing charging stations that were ready to serve taxis within a range of 0.5 miles. Therefore, if taxis were unable to access an existing charging station within a range of 5.0 miles, there was a need to establish additional stations in this potential space. Their results recommended the establishment of 372 additional stations on the routes most often used by taxis. With an additional network ranging from 280 to 652 charging stations in the recommended locations, the probability of upgrading to EV taxis would increase to 42.5% [32].
Wang et al. proposed three functional modules for fast-charging facility planning for an urban taxi system in Singapore. In the first step, the selection of candidate charging sites was analyzed using the cluster analysis approach in the first module. Subsequently, charging demand estimation, charging demand allocation, and charging facility deployment were analyzed using the optimization model in the second module. Finally, the refinement of charging locations was investigated in the third module [33]. Cilio and Babacan proposed a novel data-driven framework to deploy optimal fast charging infrastructures for electric taxis in large urban areas. A case study was conducted in Istanbul using real-time global positioning data from operated fossil-fuel taxis in the city. The results indicated that around 1363–1834 charging stations could serve a fully electric taxi fleet of 17,395 vehicles in the city [34]. Moreover, the literature review reports studies on charging station locations for electric taxis with geographic information system (GIS) data. Kaya et al. used the GIS-based, fuzzy, multi-criteria decision-making (MCDM) method to solve the site-selection problem for electric taxi charging stations (ETCSs) [35] in accordance with the study of Erbas et al. [20].
To conclude, most studies emphasize taxi travel data when selecting charging station locations. There are also other analysis factors, such as energy supply, car-user behavior, battery range, travel distance, occupancy status, distance from charging stations, charging time, and the number of chargers needed to serve the maximum number of EV taxis at the minimum total cost. In Bangkok, there is a high number of taxis, which are likely to upgrade to EVs in the future. In this regard, GPS data for Bangkok taxis present useful information, which has not been analyzed for this purpose to date. Most of the research considers distance when selecting locations for charging station installation. Nonetheless, Bangkok has typical traffic congestion levels. Although the distance is shorter in some areas, more time may be needed to travel. Hence, this research proposes considering the “travel time” to the station to determine the charging station location using the actual travel time, obtained from the Google Map Distance Matrix API. The present study intends to fill this research gap by analyzing the GPS data in combination with the travel data of taxis in congested Bangkok traffic to find charging station locations in terms of both the minimum travel time to stations and the shortest waiting time for charging service.

3. Materials and Methods

3.1. Research Methodology

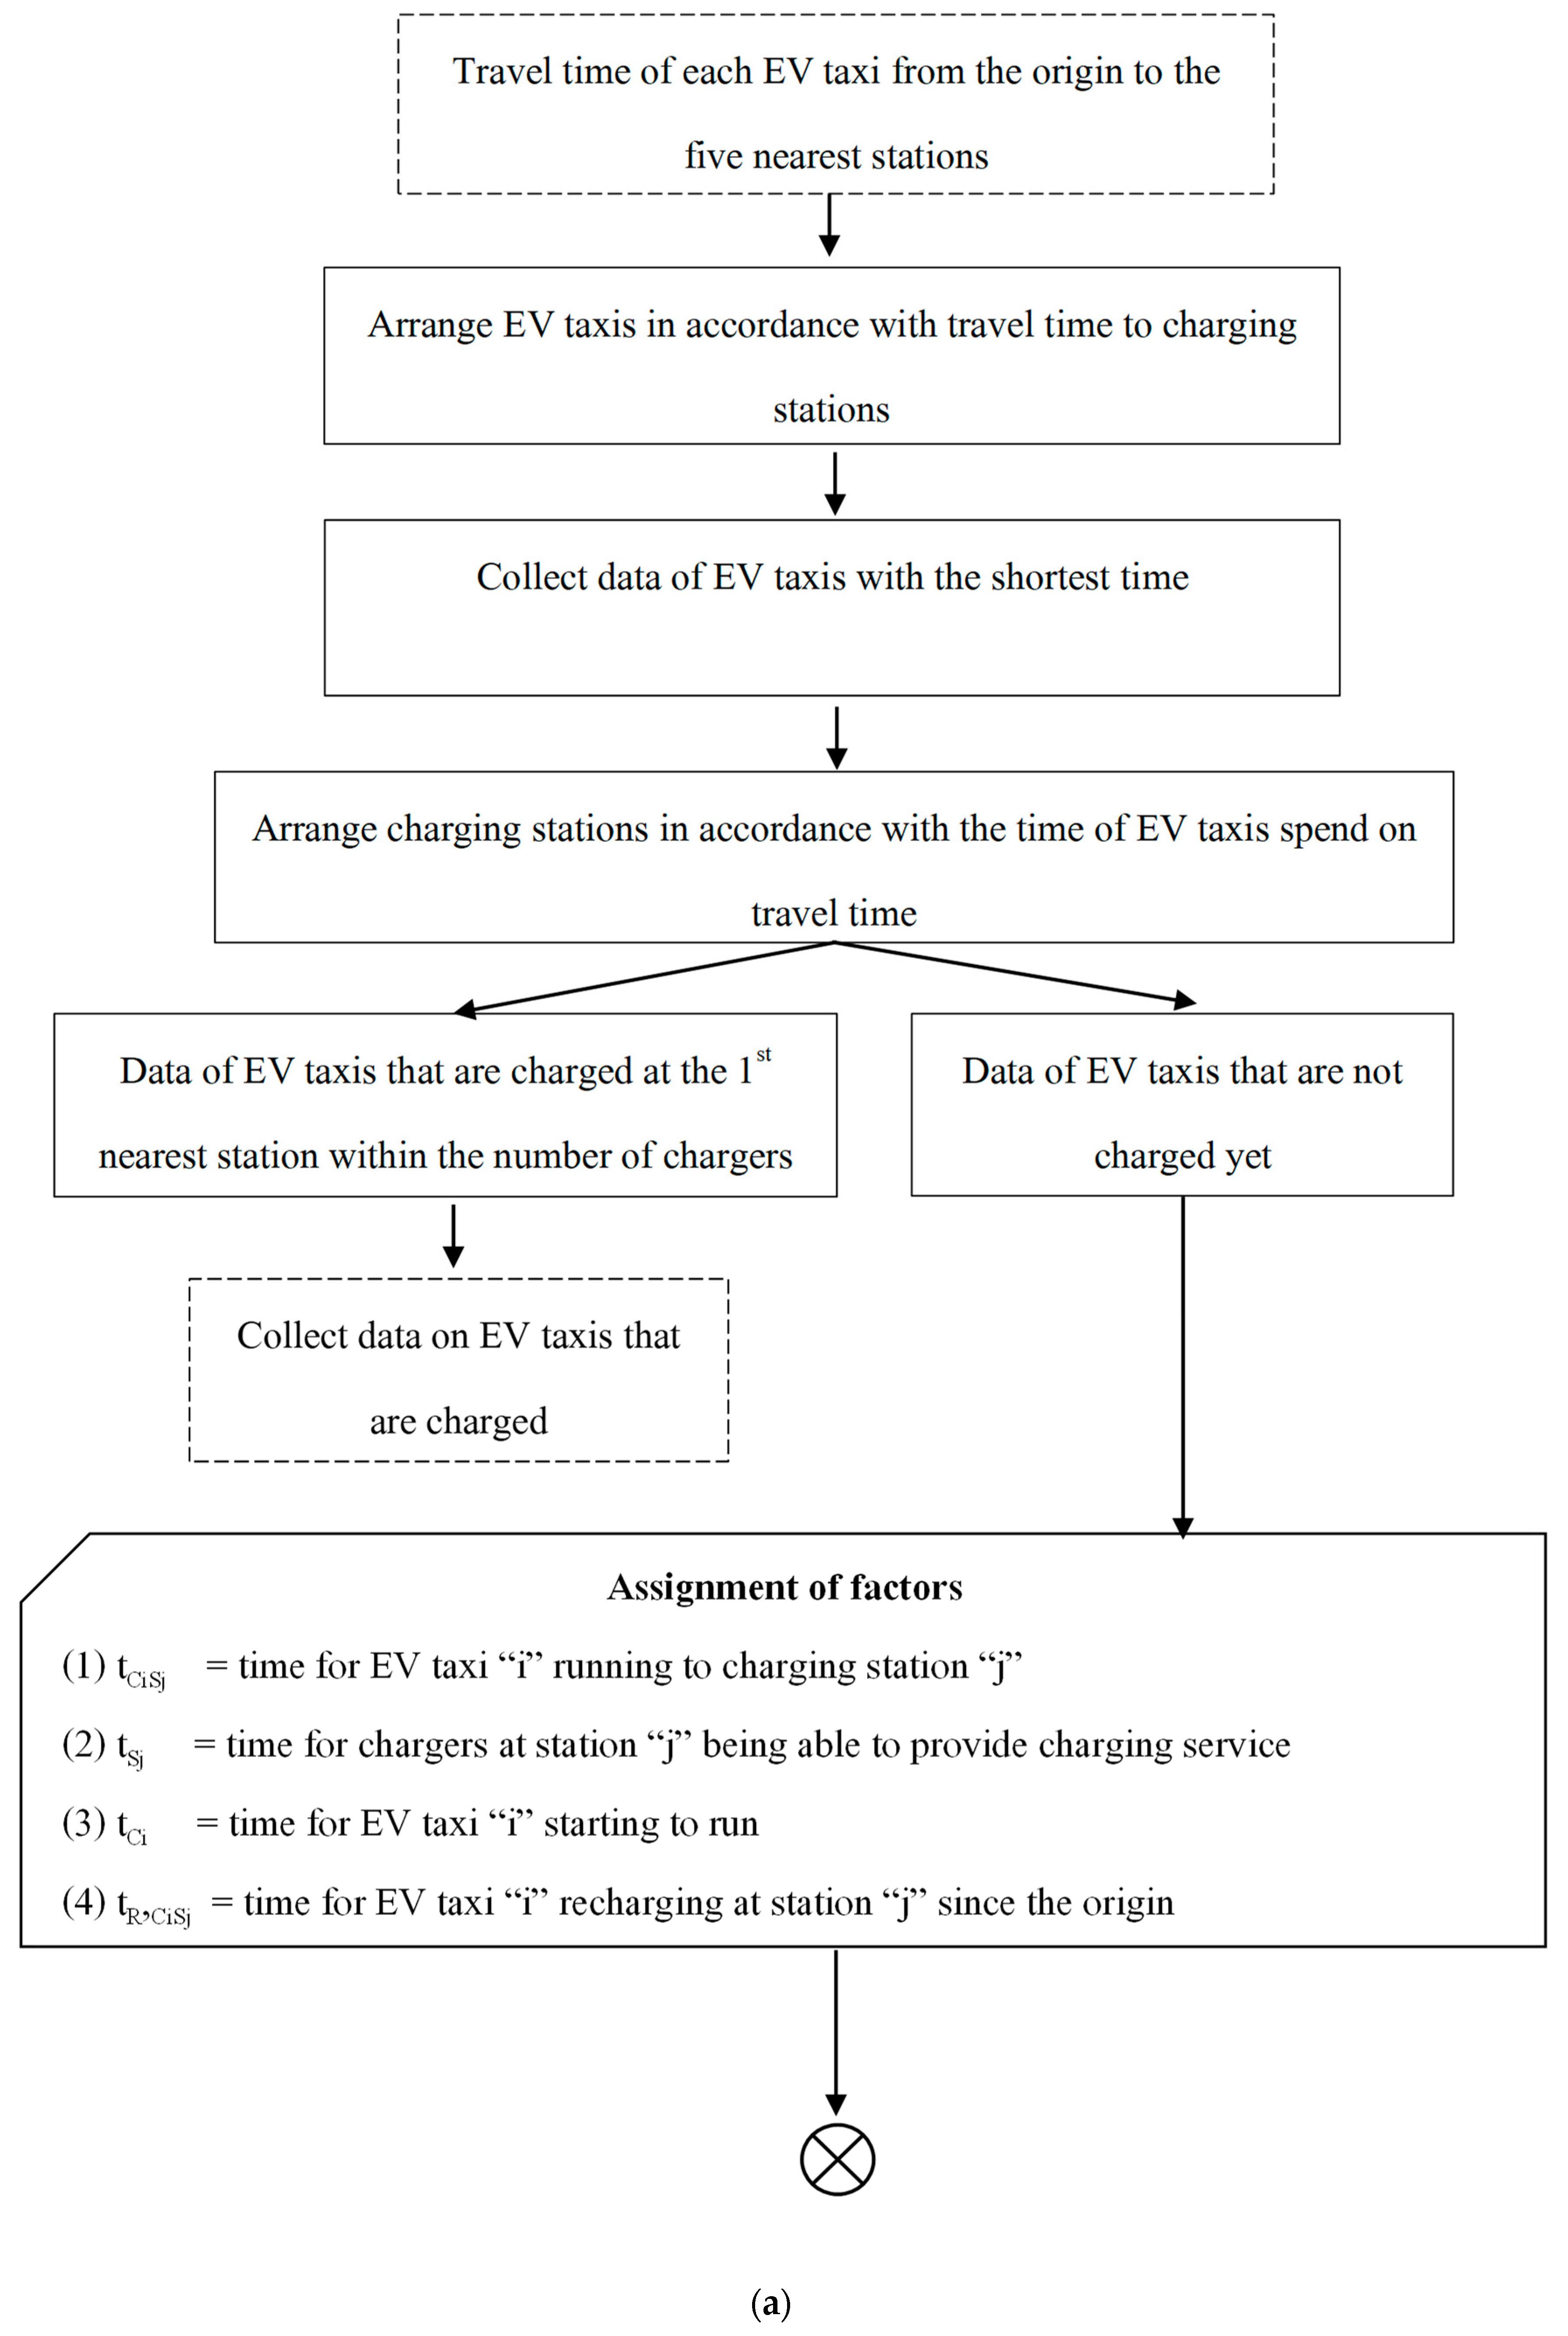
The charging station deployment method of Csonka and Csiszár [13] served as the foundation for this study, as it describes the process of determining the location of charging stations. The researchers selected charging station locations for BEV taxis based on actual travel data analysis. The basic idea behind this approach is to establish the charging station in the optimal location to serve BEV taxis. For this reason, the optimal location should be determined using actual travel data from the taxi’s GPS [18,29,30,33]. This will allow us to see hotspots that are crowded with taxis and gas stations, which should be installed with electric chargers. As certain districts in Bangkok experience traffic congestion, trips can take longer even if the distance is shorter. The proposed process determines the location of the charging station using the time BEV taxis take to travel to the candidate site, using actual travel data from the Distance Matrix API of Google Maps to identify locations for charging stations that can sufficiently accommodate taxis so that the recharging process takes the least amount of time, as well as identifying criteria to assess the candidate site’s suitability. Figure 1 depicts the analysis of charging station locations.
Our analysis method is based on one particular practice, which may differ from other cities; most taxis in Bangkok are rented on a two-shift basis and need to be refueled or recharged before returning to the garage at around 4.00 and 16.00. Therefore, taxi drivers must find a gas station or an EV charger on the route back to the garage before the shift-changing time. In addition, they will manage their itinerary so that the last customer drop-off location is not too far from the garage. Taxis in Bangkok often refuse to take passengers for that reason.
Generally, a BEV taxi’s decision-making approach regarding charging station choice is either centralized (a central operator assigns where BEV taxis should be charged) or decentralized (BEV taxis make their own decision regarding charging stations) [26]. The outcome of a decentralized approach may or may not be optimal, depending on the information and methods used to determine local charging patterns [26]. At present, electric taxis frequently use an application to search for charging stations that recommends the nearest station or one with available chargers. The centralized approach is used in this study to determine the BEV taxis that will arrive at the charging station with the shortest travel time. If the station is full of charged taxis, the approach will distribute excess BEV taxis to the next nearest station in the sequence with available chargers, similar to a water-filling method [36].
The analysis process makes the following assumptions and settings:
1.
Designate the current ICE taxis to represent the potential BEV taxis.
2.
Designate that taxis operate two shifts a day (24 h).
3.
Designate that a taxi driver travels around 294 km in a shift, with a total of almost 600 km per taxi per day.
4.
Designate BEV taxis as BYD e6, with a battery range of 400 km.
5.
Designate a change in shifts at 16.00. Hence, BEV taxis must be recharged before the new shift starts, from 15.00 to 16.00.
6.
Designate taxis to charge only when they are unoccupied or after they send off passengers.
7.
Designate charging stations to install quick chargers, which take 30 min to recharge to 80 %.
8.
Due to limitations in collecting and analyzing a large amount of data, we used a random sampling of data on 21 November 2018 to represent daily data to find optimal charging station locations for EV taxis.
According to the data on taxi travel time and locations, the analysis workflow for finding charging station locations for BEV taxis in Bangkok is illustrated in Figure 1. First, we analyzed the data from taxi travel patterns to determine potential locations and candidate charging stations. Following this, we assess whether the number of chargers in each station adequately served the area’s BEV taxis. If they were insufficient or the station was overcrowded, the low-powered taxis would immediately know where to recharge their batteries. In this case, the locations in which chargers are installed should be expanded until they are sufficient to serve all EV taxis.

3.2. Data

This research used the secondary data from the sampled taxi data from the Intelligent Traffic Information Center (iTIC) (Source: https://www.iticfoundation.org (accessed on 8 April 2019)). Around 7000 GPS-equipped taxis were chosen as a research sample of the potential BEV taxis, and 765 gas stations were chosen to represent the number of potential charging sites for BEV taxis in Bangkok. These datasets can function as a model for other provinces.
The interview with taxi drivers and garages shows that taxis are used for two 12-h shifts. The shift times include 03.00, 04.00, 05.00, and 06.00 for the morning shift, and 15.00, 16.00, 17.00, and 18.00 for the evening shift. However, 04.00 and 16.00 are the most prevalent shift times. In the present study, we chose a sample of taxis in the time shift from 15.00 to 16.00 to represent all taxis that run in every time shift. This is because taxi drivers must refuel before returning the vehicles to the garages. For data analysis, travel taxi data from 15.00 to 16.00 on 21 November 2018, were purposively sampled to avoid the effects of unusual traffic, such as heavy traffic on Mondays and Fridays and less traffic on weekends or holidays. In addition, data from 2018 were used; these represented real traffic in Bangkok in the year preceding the COVID outbreak. Although the COVID outbreak has ended, Bangkok traffic has yet to return to normal. Although the data are somewhat outdated, they are adequate to allow for a case study to apply the proposed method. For data validation, taxi data from another three days, 24, 26, and 28 November 2018, were chosen. At a later date, we could perform the same analysis with more data to improve the accuracy of the results. The number of taxis on the sampled dates and their durations are displayed in Table 1.
From the GPS data collected between 15.00 and 16.00, we found about 3900 taxis, as shown in Table 1. The GPS data records, and the meaning of each field are given in Table 2.
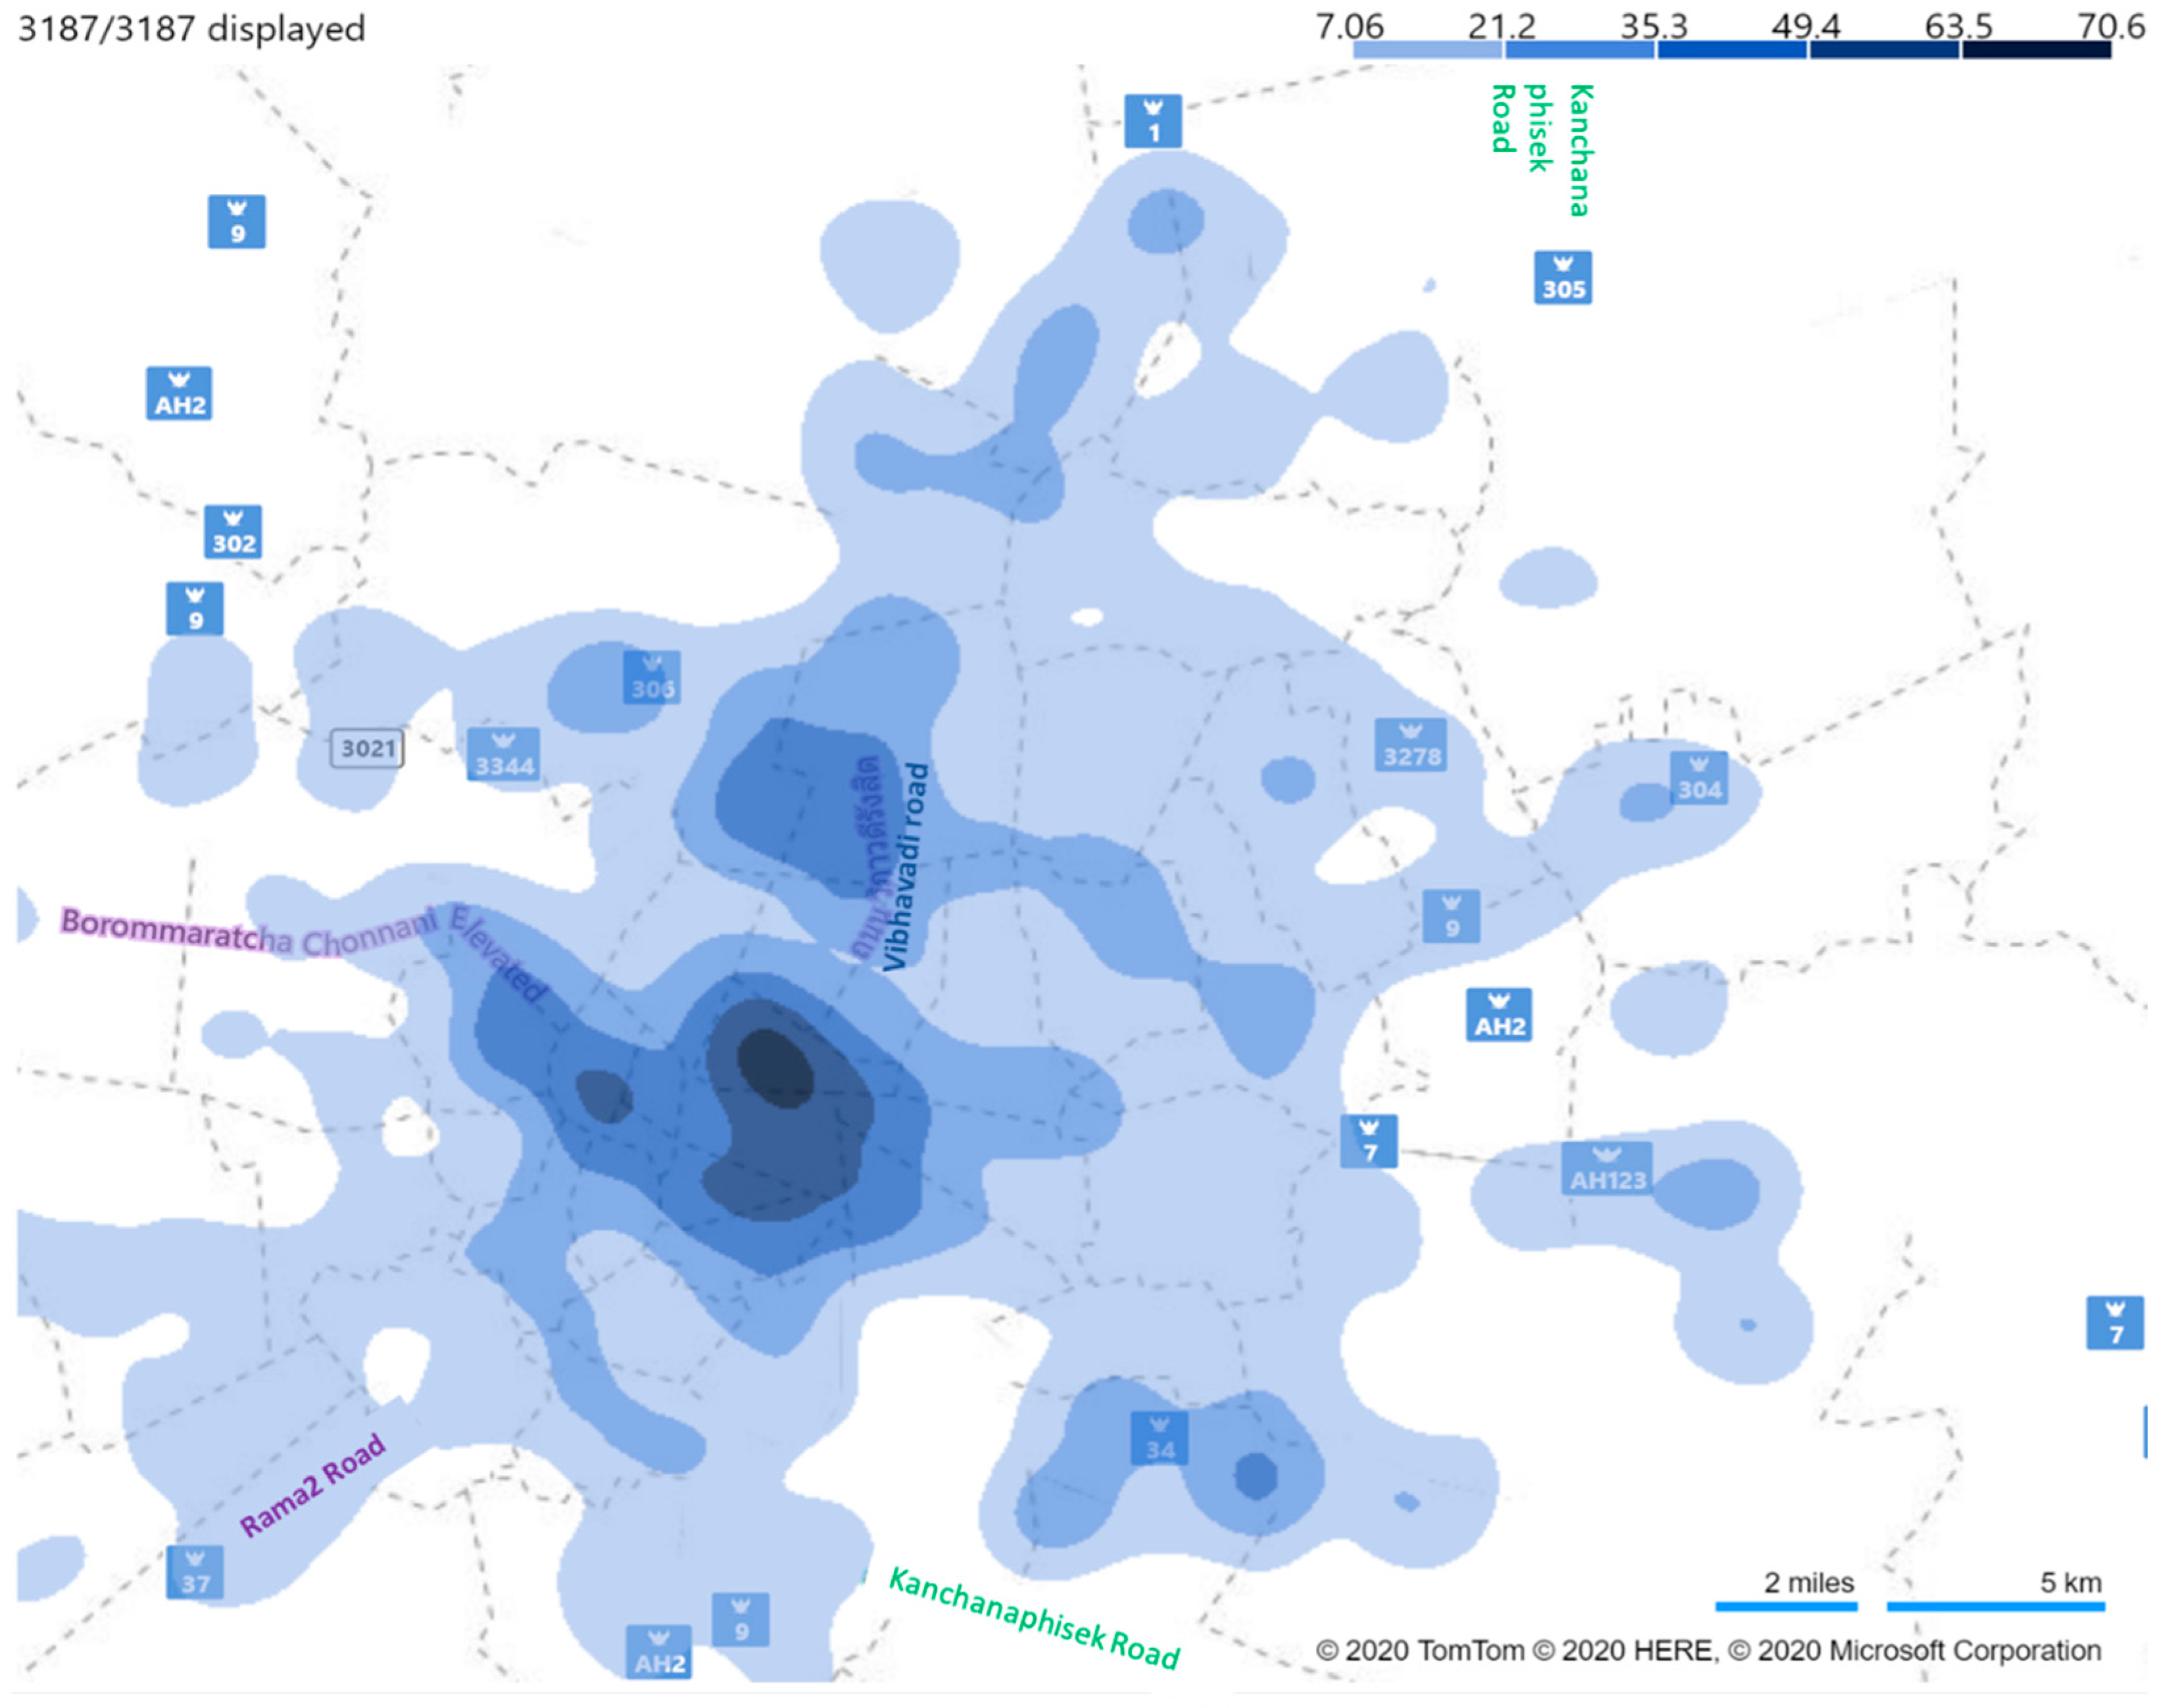
Based on the GPS data of the taxi travel between 15.00 to 16.00, we can identify the locations of BEV taxis with an unoccupied status, which were ready to charge at the nearest charging stations. Then, we drew a heatmap of taxi locations, as illustrated in Figure 2. According to the heatmap, taxis appeared to gather most in the central Bangkok area (highlighted in the dark blue color).
The interviewed experts suggested that the most advantageous locations for charging stations for EV taxis are gas stations. Hence, we looked at the locations of gas stations to assess their suitability for charging EV taxis. As a result, we collected location data for 765 gas stations in Bangkok, as shown in Figure 3.

3.3. Process of Charging Station Location Selection for BEV Taxis

Based on the taxi’s coordinates and the candidate site’s coordinates, we selected charging station locations for BEV Taxis using the following steps:
1.
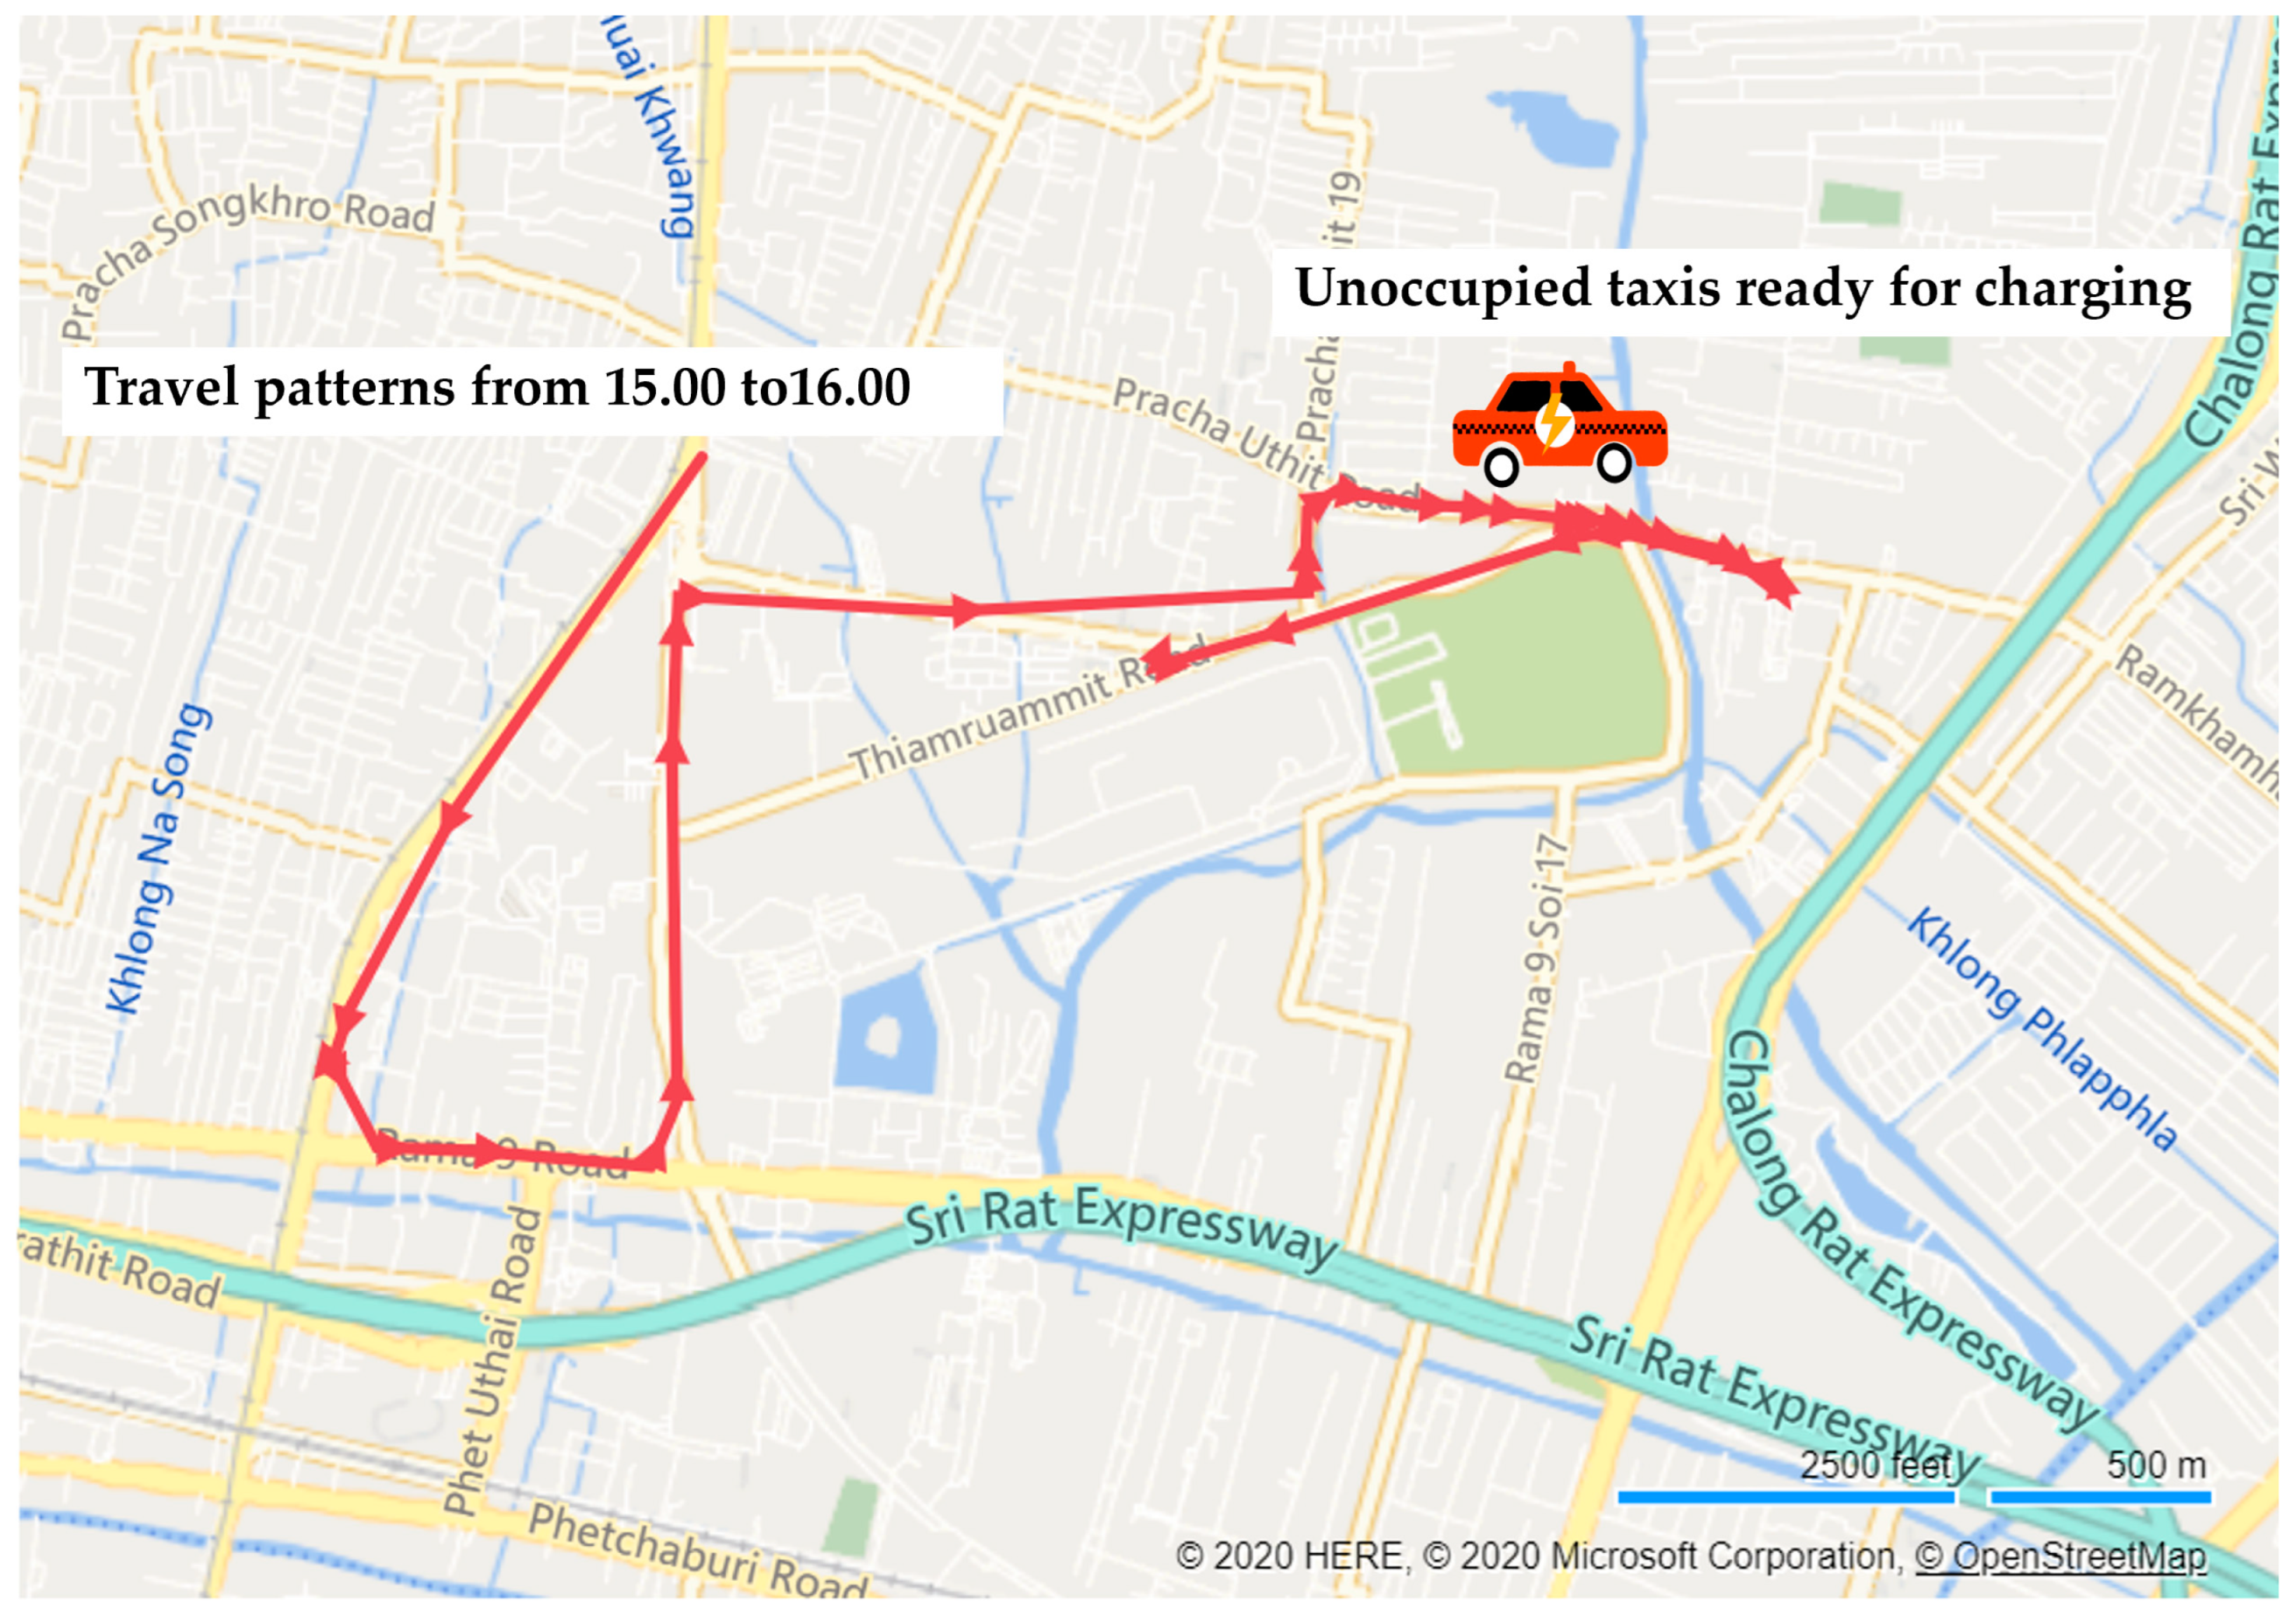
The locations of unoccupied taxis from 15.00 to 16.00 were calculated by placing each timestamp in order, and “1” was assigned to unoccupied taxis after they sent off passengers, showing the taxi locations and the time at which, they were ready for charging. A sample of taxi patterns from 15.00 to 16.00, and the locations of unoccupied taxis ready for charging, are shown in Figure 4.
2.
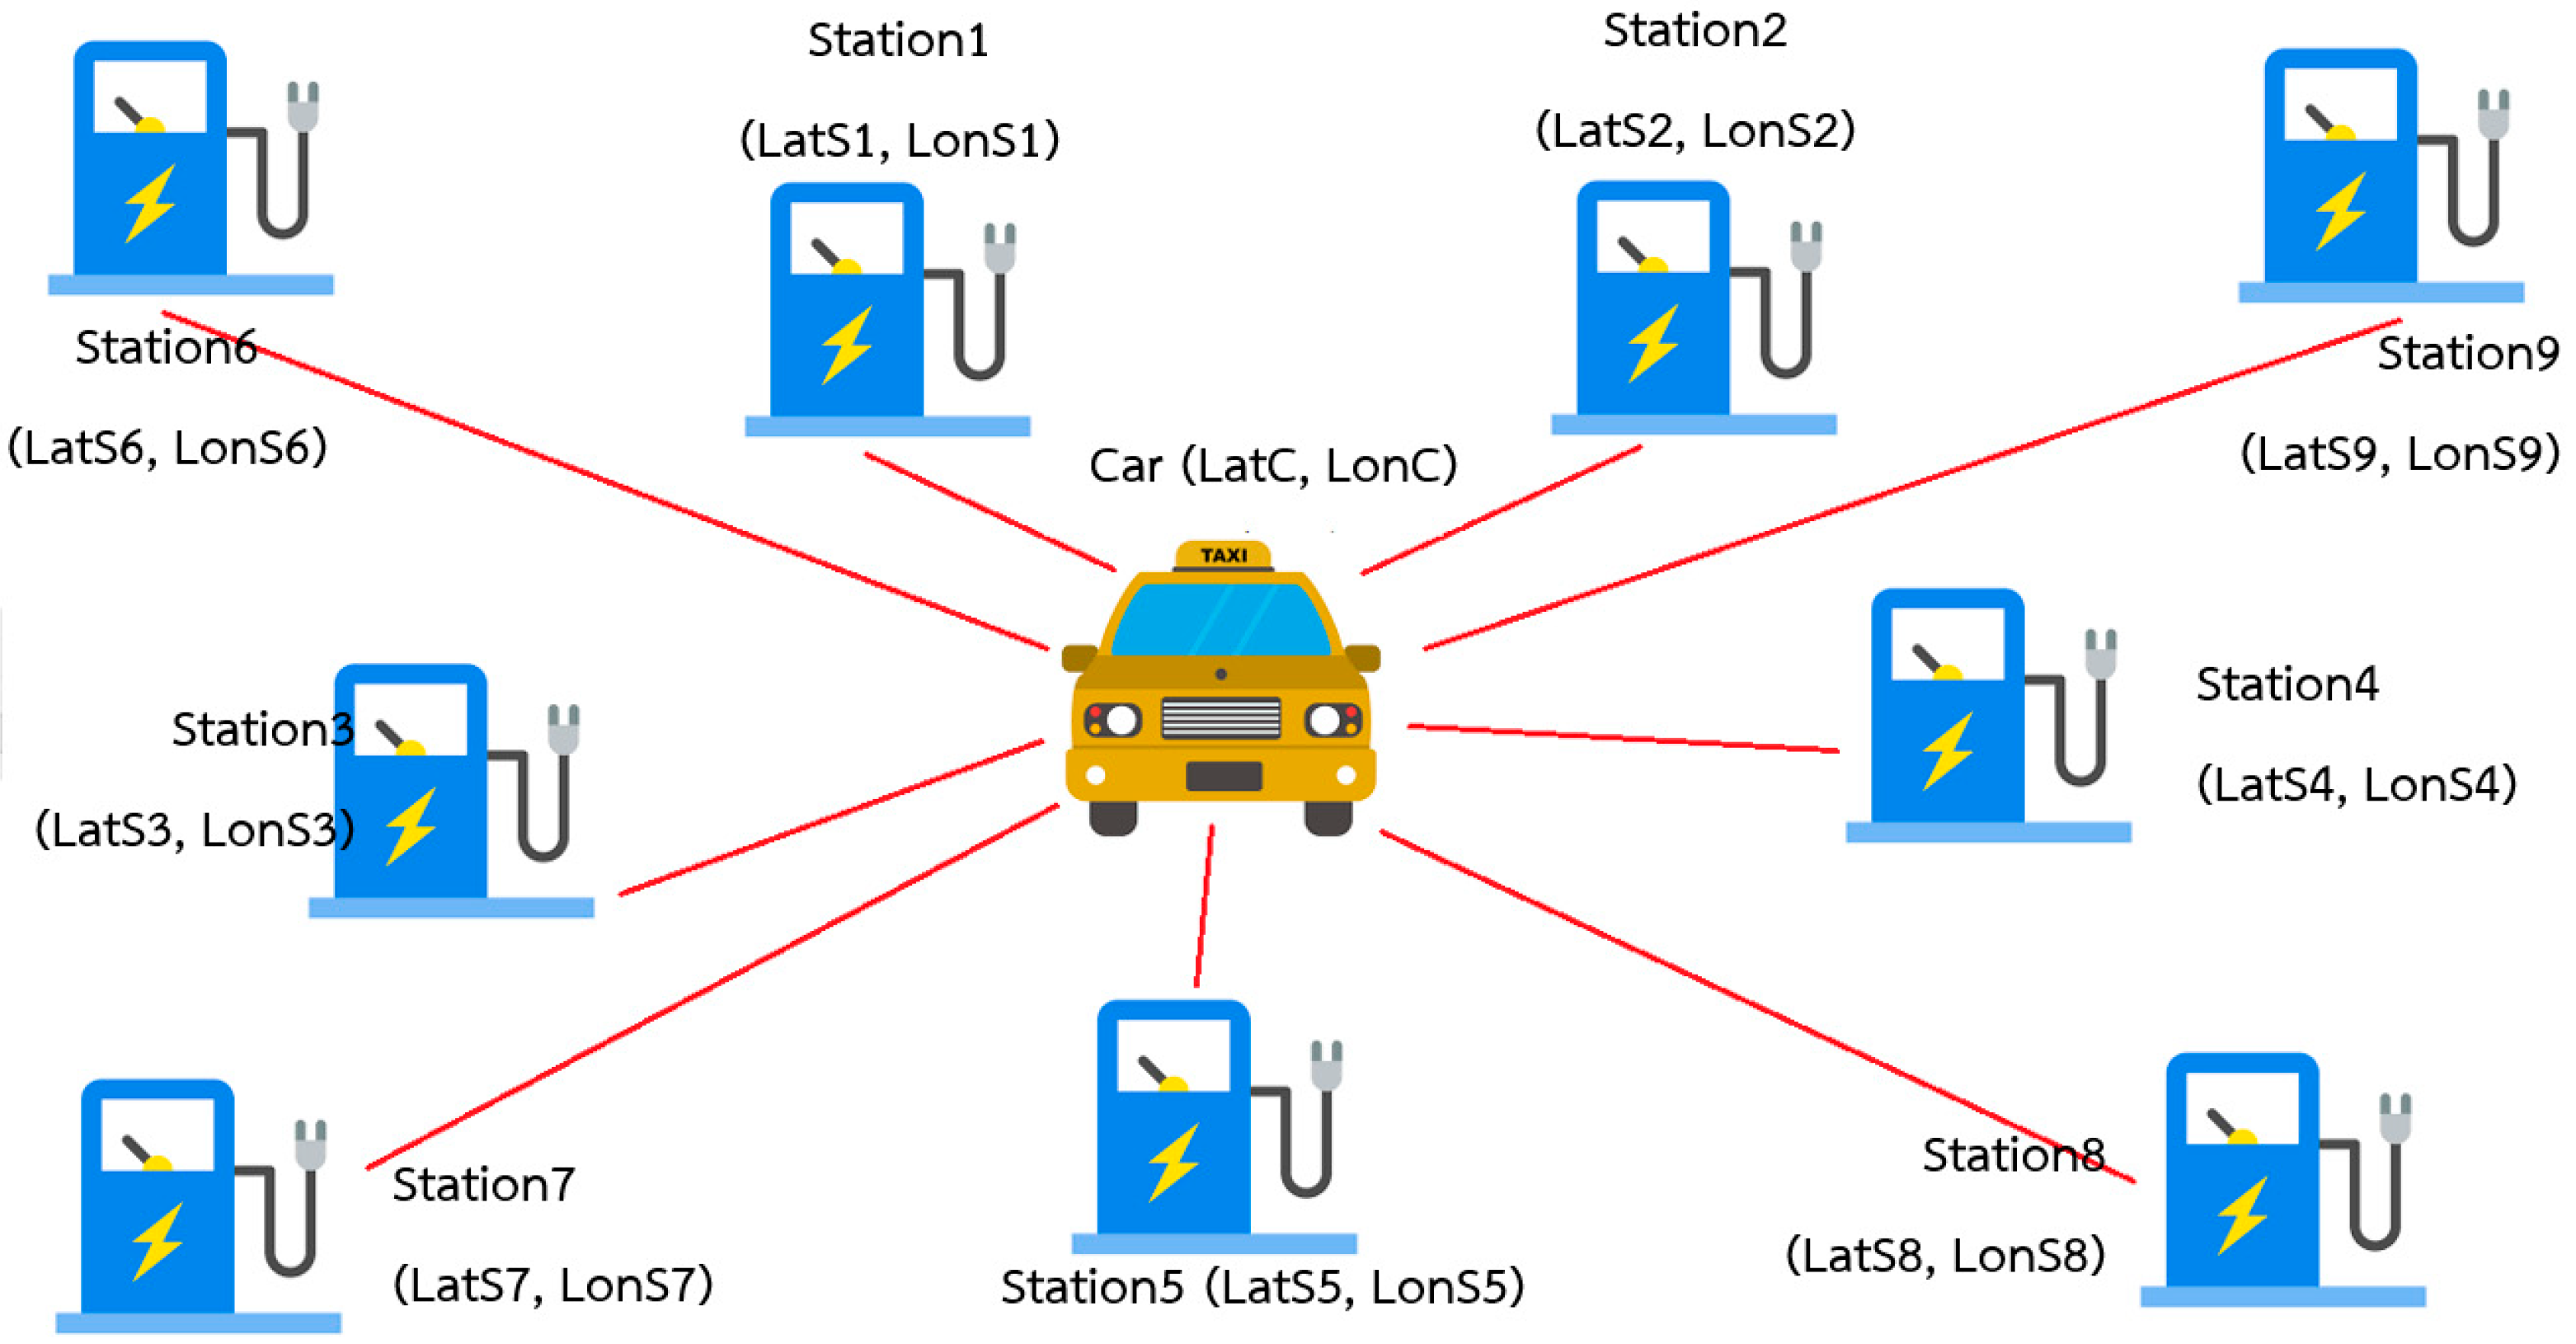
The charging stations nearest to BEV taxi locations were placed in order by calculating the distance between taxis and charging stations for displacement, which can be obtained from Equation (1). The distance between taxis and charging stations are shown in Figure 5.
D i j = ( L a t C i L a t S j ) 2 + ( L o n C i L o n S j ) 2 ,
where
  • Dij = Distance between EV taxi “i” and charging station “j
  • LatCi = Latitude of BEV taxi “i
  • LonCi = Longitude of BEV taxi “i
  • LatSj = Latitude of charging station “j
  • LonSj = Longitude of charging station “j
3.
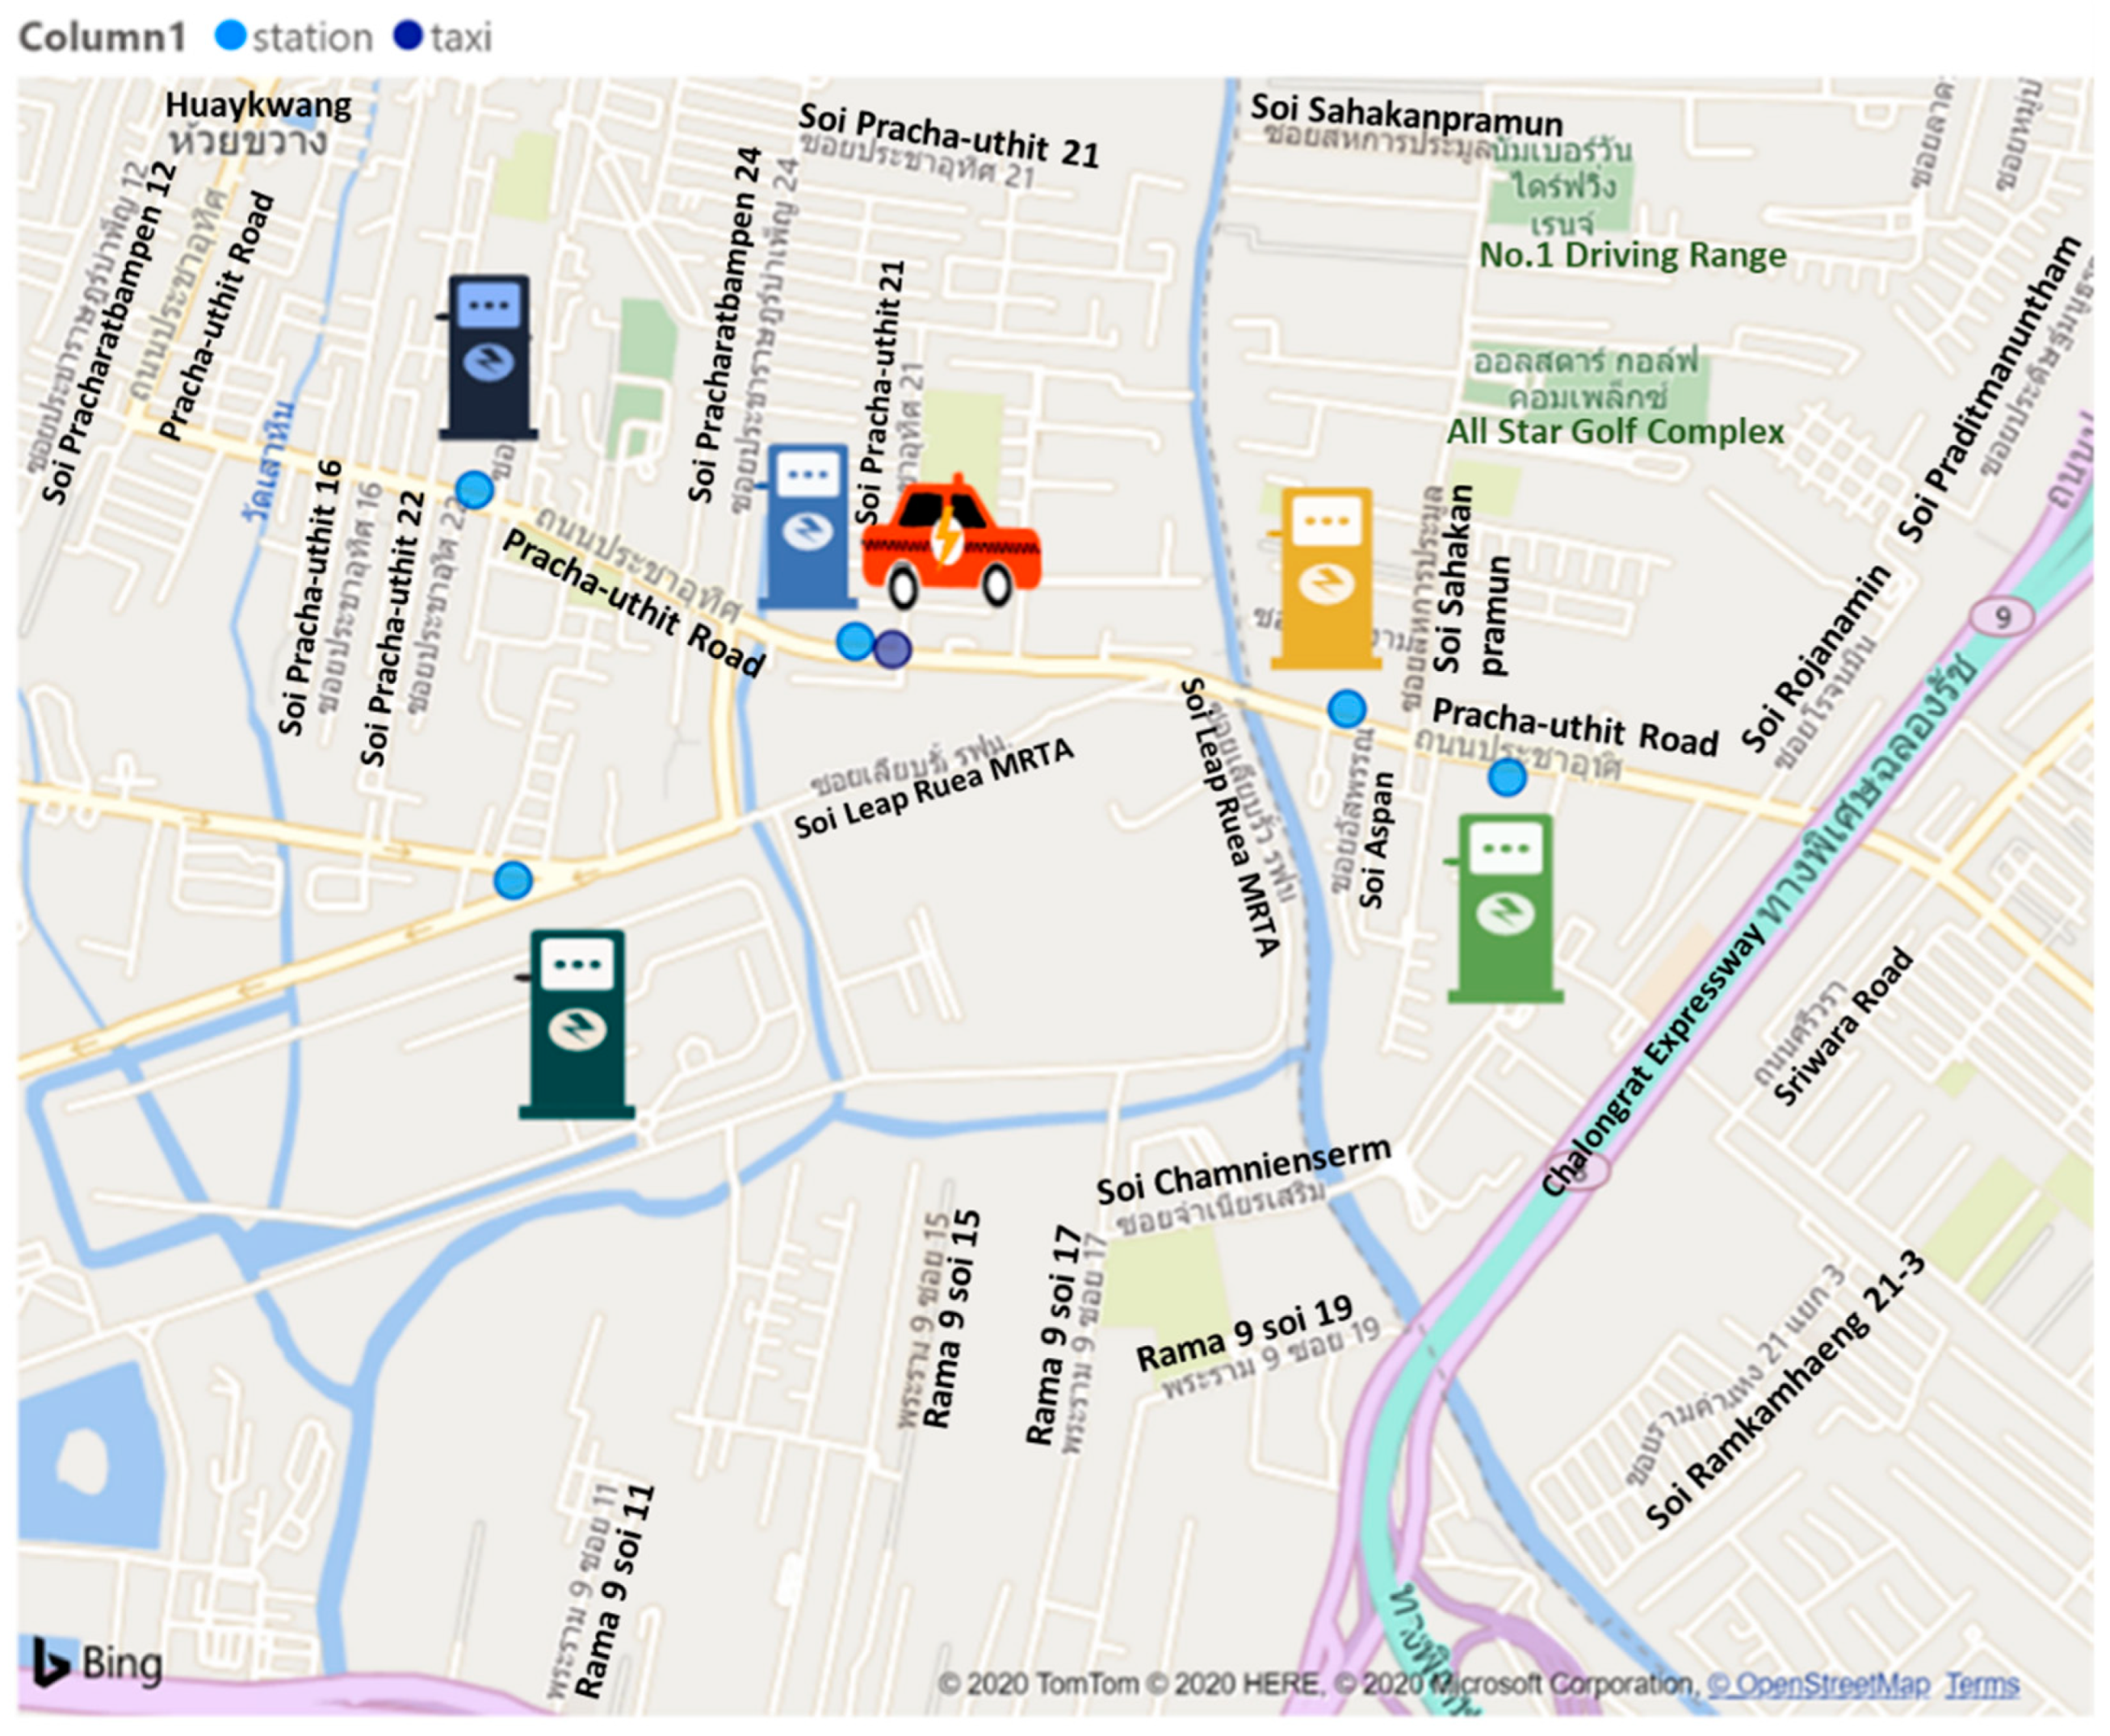
Locations of nearest candidate site to BEV taxis are shown in Figure 6. We obtained the location of available BEV taxis that were ready to go to a charging station and the five candidate sites nearest to BEV taxis. We used Google Maps to estimate the distance between the BEV taxis and the candidate sites and the travel time to reach the charging station under realistic traffic conditions [37]. The Google Map Distance Matrix API was employed, with the location of the BEV taxis and the candidate sites. This API calculated the commute duration and the distance from the BEV taxis to each candidate site. We assumed that all charging stations had available chargers. A sample result was generated by The Google Map Distance Matrix API, as shown in Figure 7. We ranked the candidate sites based on the shortest time needed to reach the candidate site and listed the five nearest candidate sites.
4.
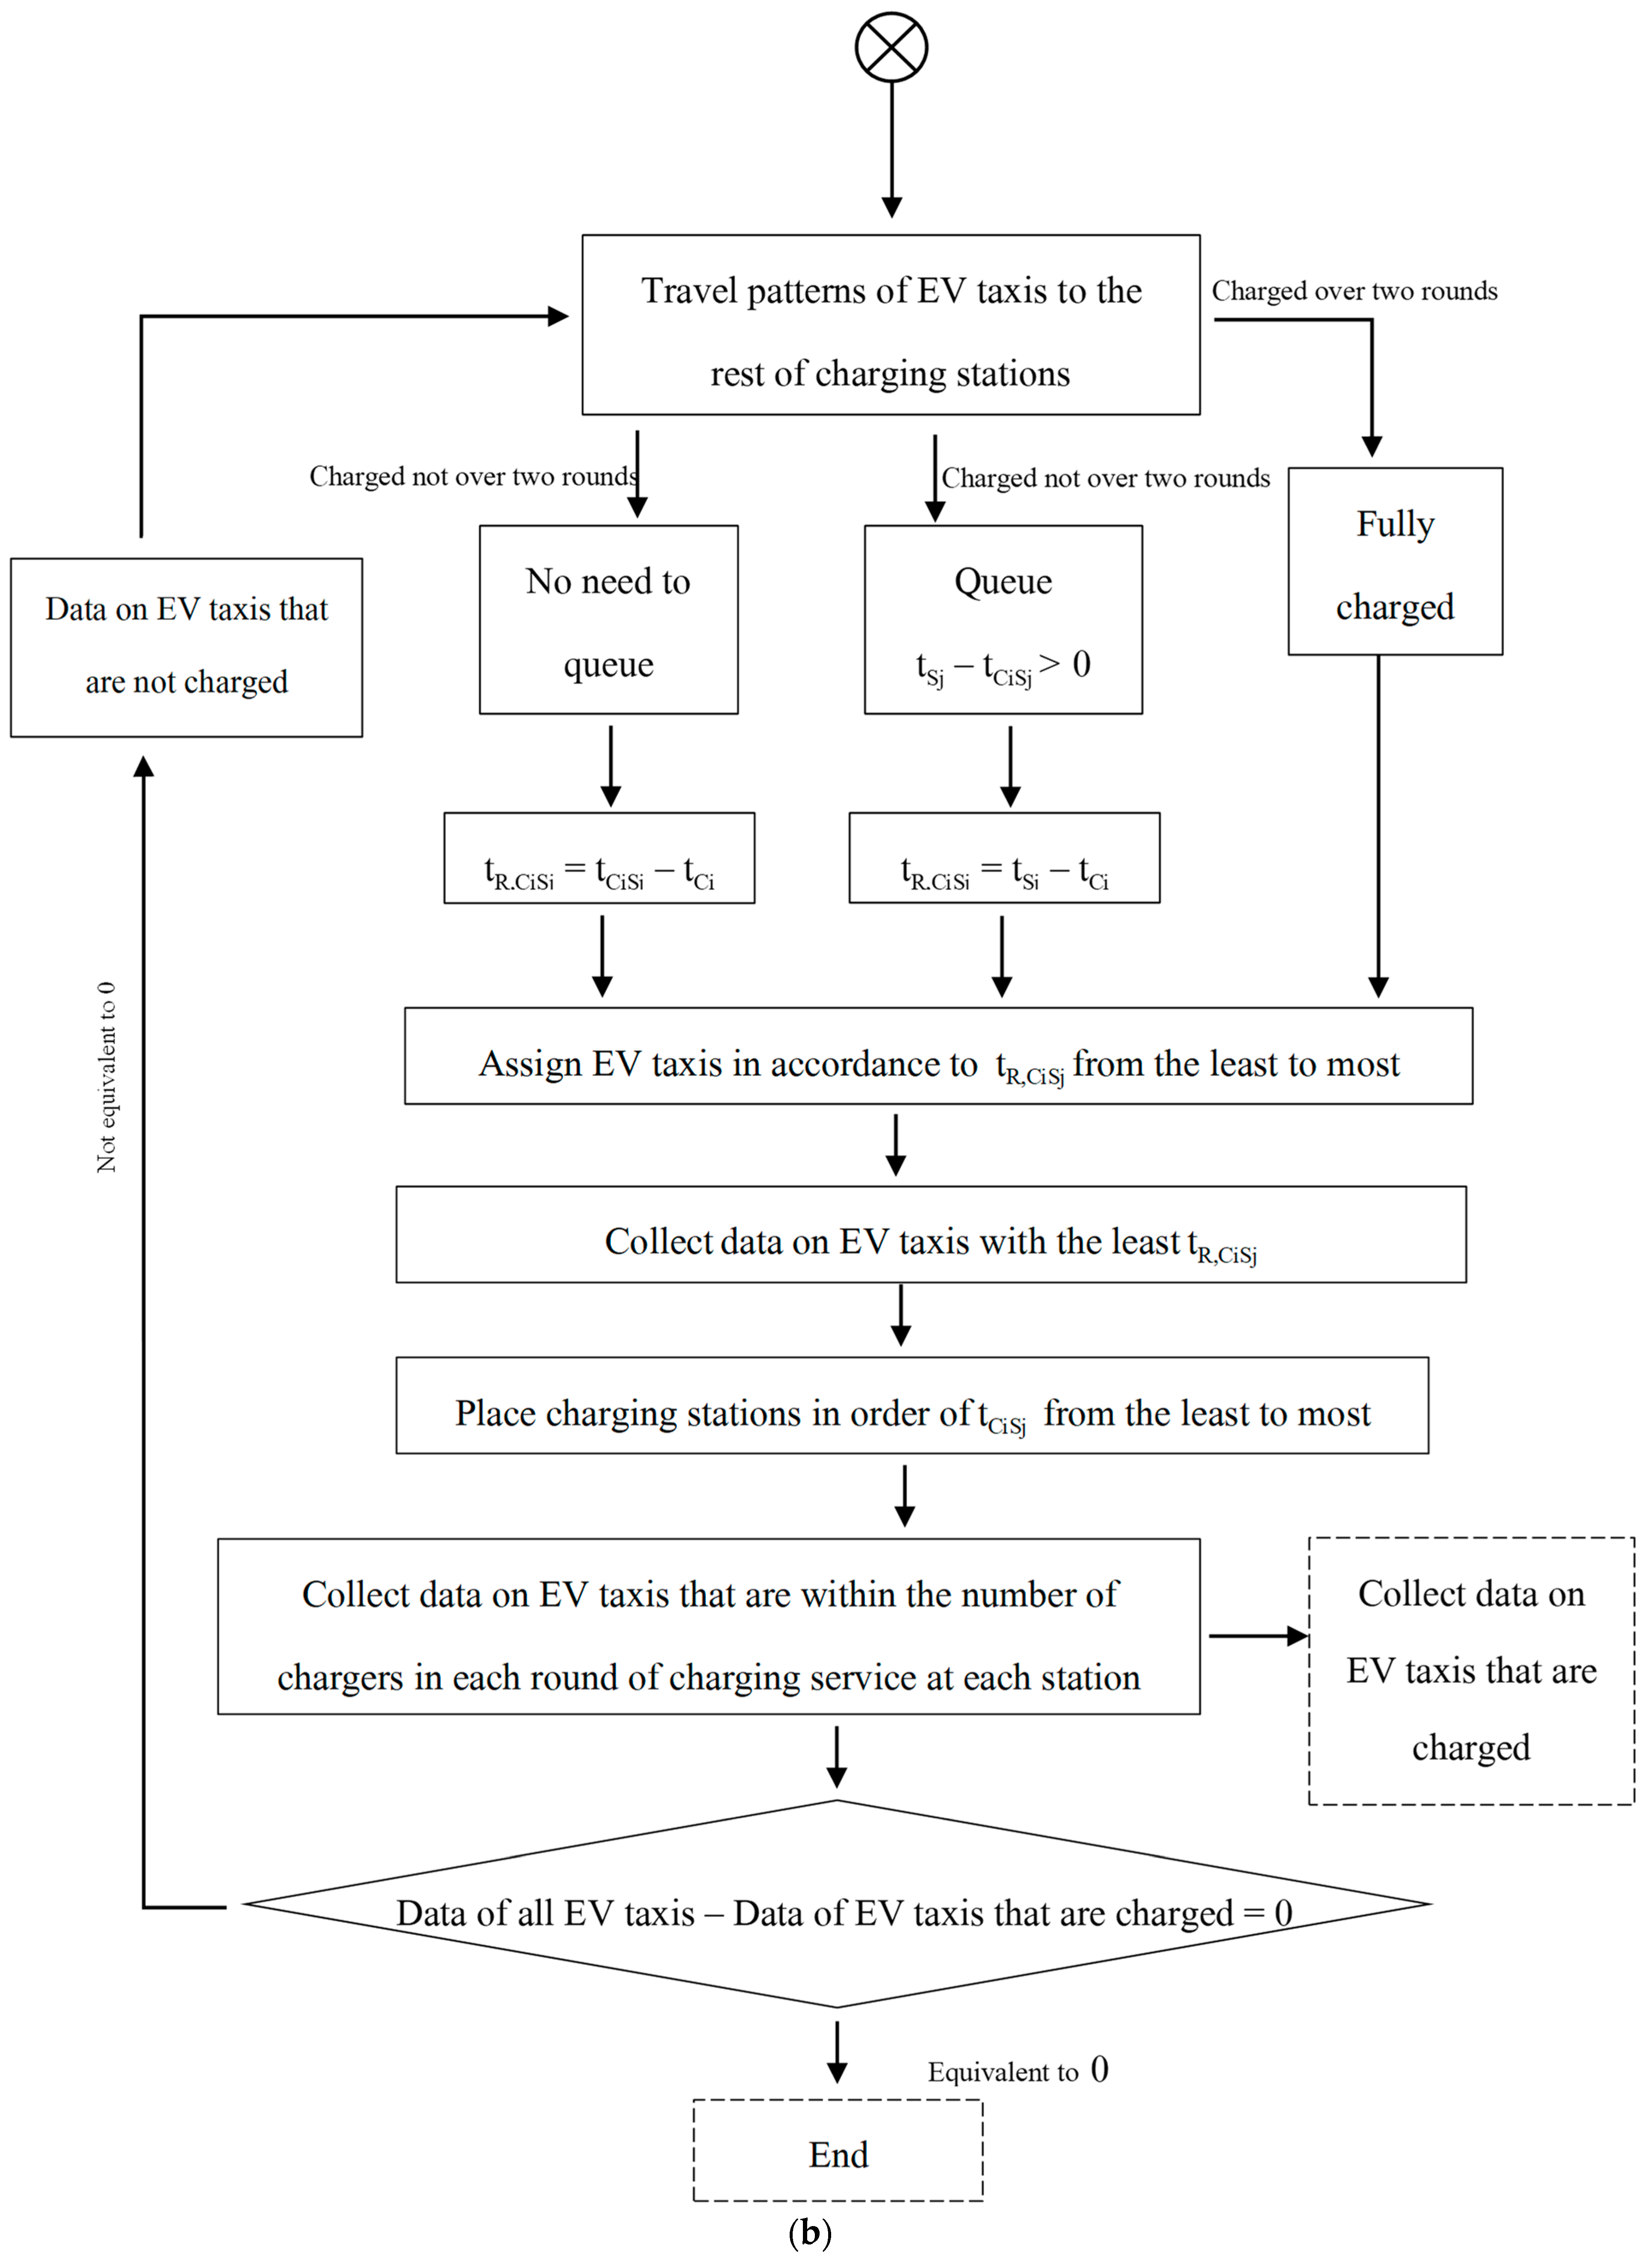
A charging service arrangement for BEV taxis can be made in order, as shown in Figure 8. All BEV taxis are required to select their candidate site according to the minimum travel time. BEV taxis will be charged according to the number of available chargers in the station. During the initial service period, service entry should prioritize the taxi that arrived at the station first. If the number of taxis exceeds the number of chargers, the uncharged taxis will select the next candidate site, from the second to fifth site. As a result, a list of potential locations will be acquired, along with information on how many BEV taxis use the charging service in each station and when the next charging station will be available. However, this arrangement might cause problems if too many BEV taxis wait for service, leading to an insufficient number of chargers. BEV taxis that have not been served in the first round have to wait for the next service when chargers are available. To solve the problem, we added more stages to the analysis workflow by inputting data from BEV taxis that are not yet available in the service line. The following factors were added:
tCiSj = time for BEV taxi “i” running to charging station “j
tSj = time for chargers at station “j” that are able to provide a charging service
tCi = time for BEV taxi “i” starting to run
tR,CiSj = time for BEV taxi “i” recharging at station “j” since the origin
Firstly, it is important to note whether the number of BEV taxis that are already charged or waiting for service in a station are over two rounds of service or twice the number of chargers. If the total is over two rounds, this means that the charging station cannot deliver any further services (tR,CiSj = ∞).
Secondly, when a charging station has a waiting line that is not over two rounds, this means that the station has sufficient chargers and allows for BEV taxis that arrive first to promptly receive service (tR,CiSj = tCiSjtCi). Next, when no charger is available when BEV taxis come, but a station could still serve the taxi in the next round, BEV taxis must queue for charging services on a first-come-first-serve-basis (tR,CiSj = tSjtCi).
Finally, we arranged the tR,CiSj values from the lowest to the highest. Nevertheless, a charging service with only one or two stages might leave some BEV taxis unable to obtain charging services. To solve this problem, we move BEV taxis that have not recharged back into the flow of charging services, as illustrated in Figure 8b. The process would be completed once all BEV taxis had been assigned a station and queued for charging. The station at which chargers should be installed is revealed as a consequence.
Once BEV taxis have been queued to candidate sites, a list of candidate sites will be obtained, along with the number of BEV taxis charged at each site. Next, the candidate sites will be sorted to determine which site is most in need of BEV taxis. To determine the appropriate number of electric chargers at each candidate site, we experimented by increasing the number of electric chargers in each station from five to twelve.

4. Results

4.1. Optimal Number of Chargers in Each Station

We investigated the optimal number of chargers by designating from five to twelve chargers for each station. Table 3 shows the results of the taxi charging order based on the number of chargers in each station.
From the results obtained by queuing BEV taxis at the nearest five candidate sites, the five electric chargers at each candidate site were shown to be unable to support 3187 BEV taxis for charging at this time. Increasing the number of electric chargers per candidate site to seven electric chargers can support 3187 BEV taxis. We calculated the charging duration of the whole system as follows:
If there is no need to queue tR,CiSj = tCiSjtCi.
If there is a need to queue tR,CiSj = tSjtCi
The   total   duration   of   the   whole   system = k = 1 n t R , C i S j ( k = number   of   BEV   taxis ) .
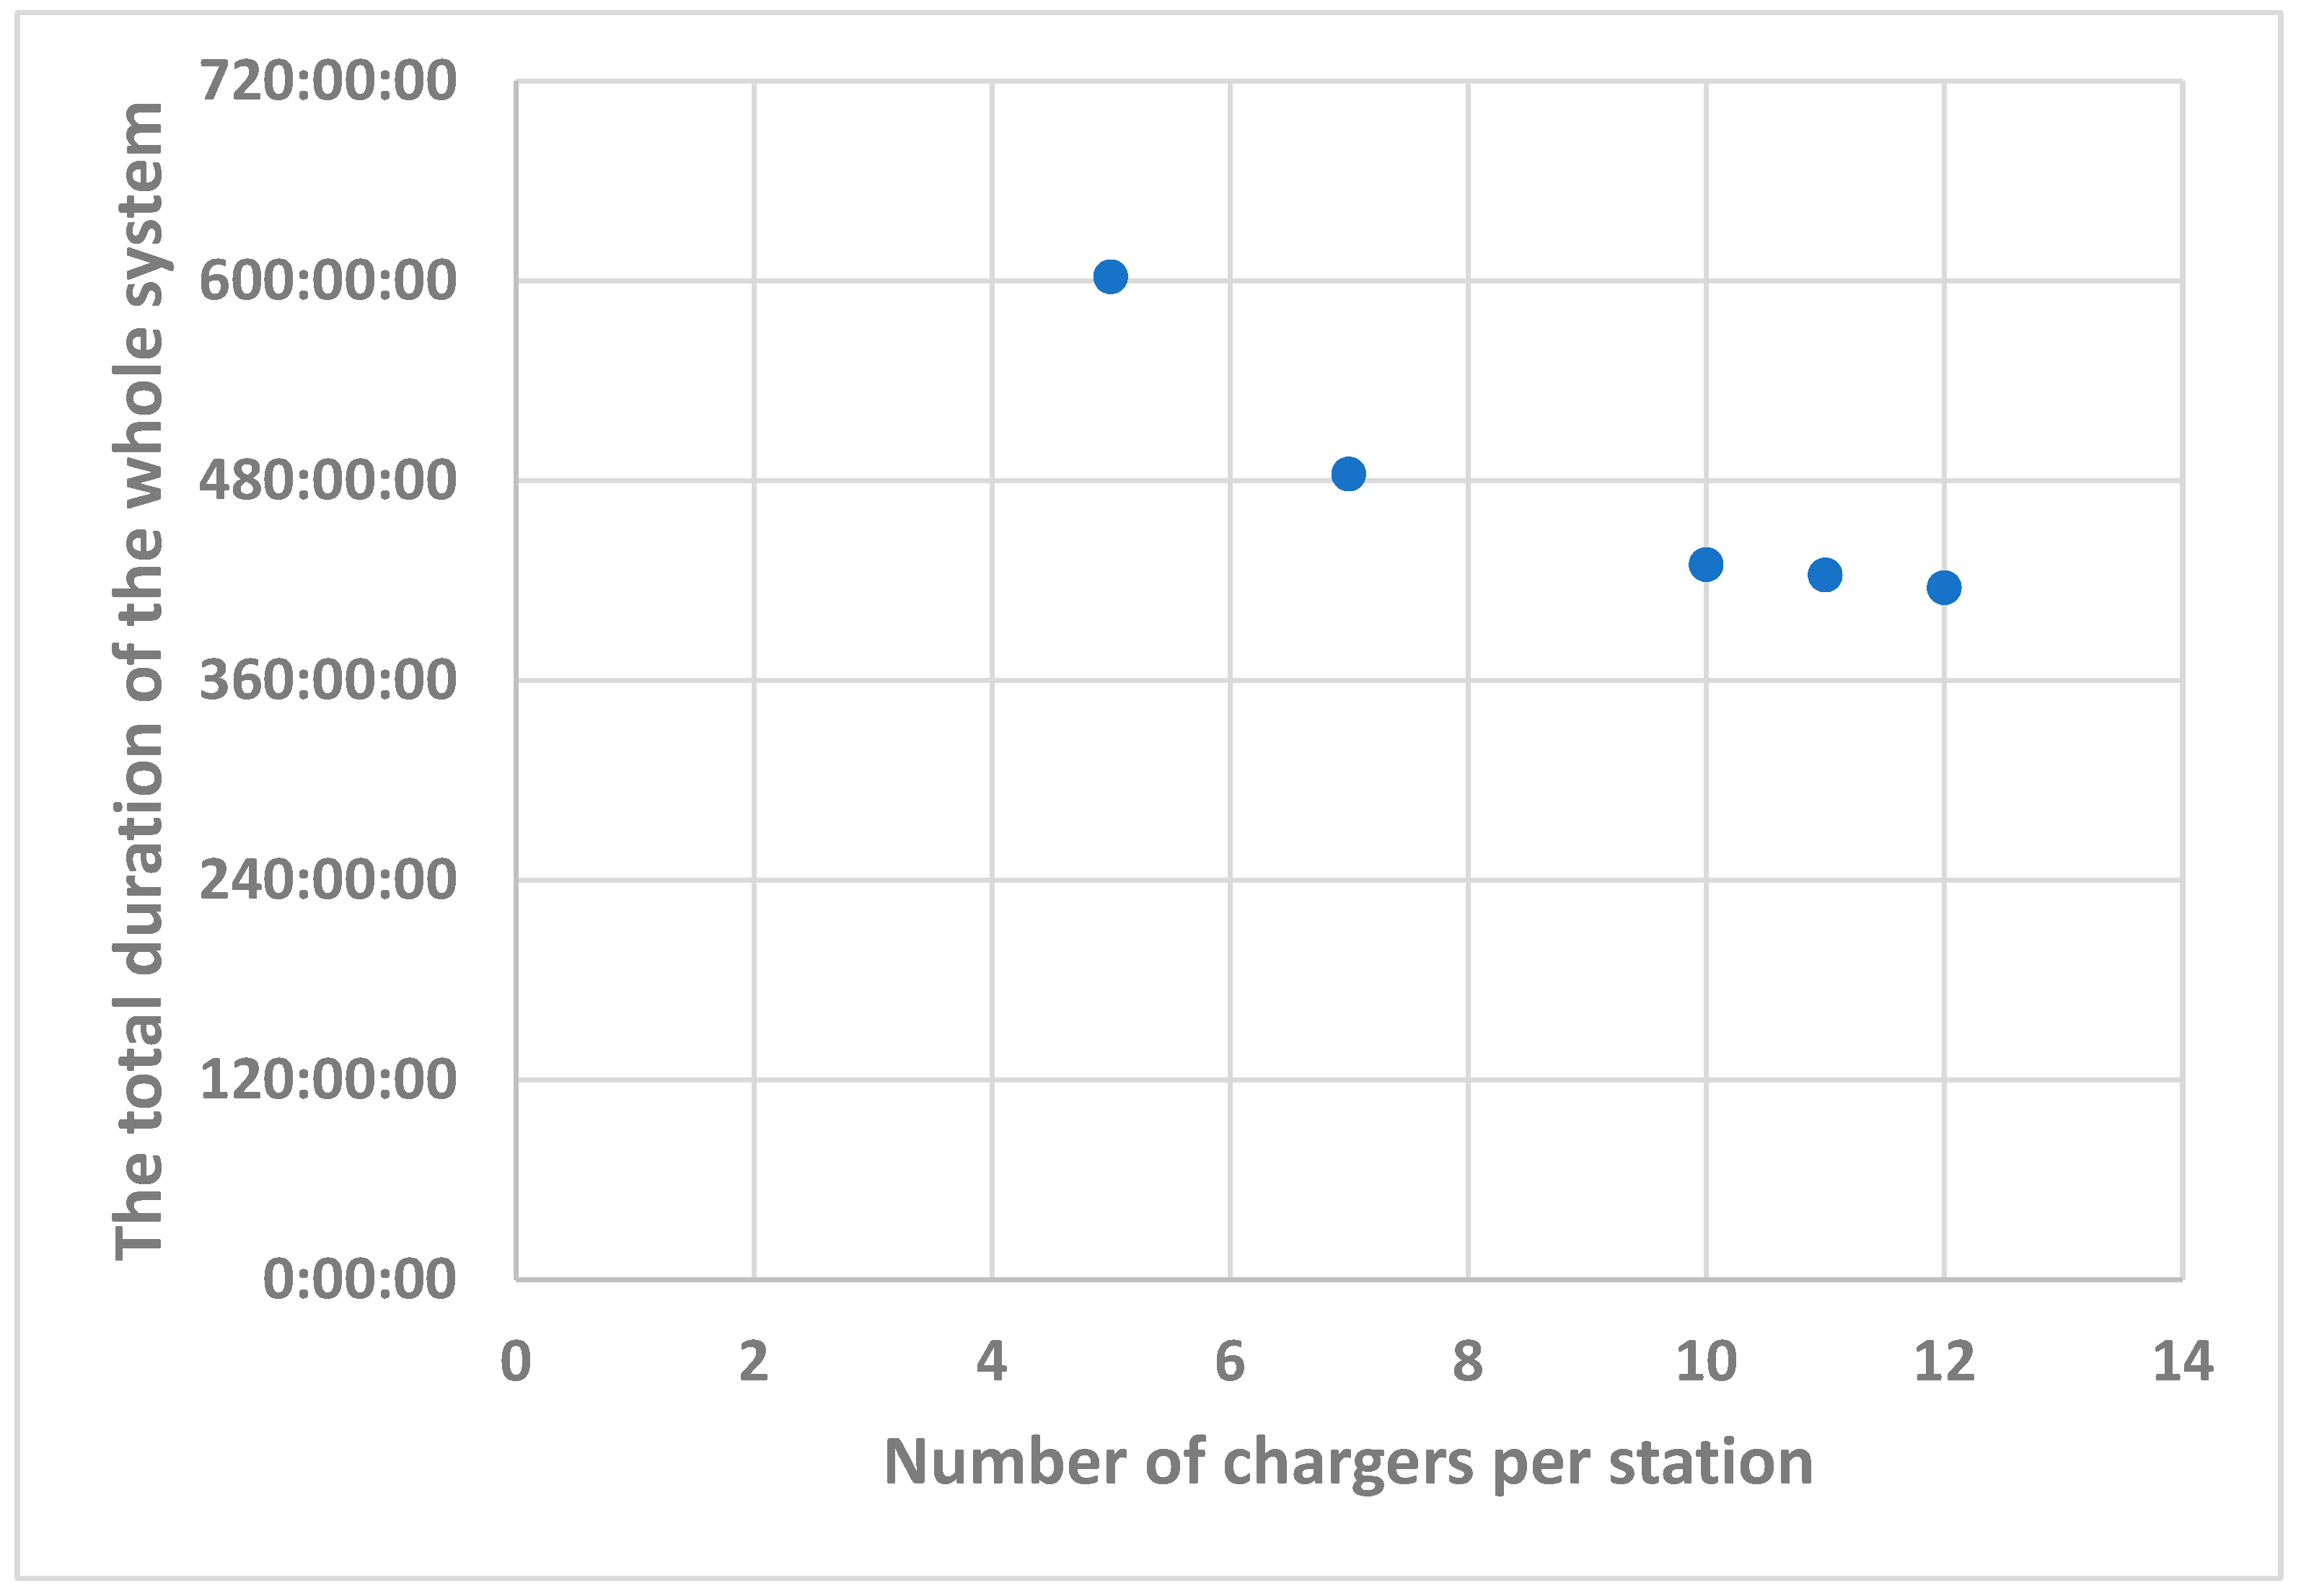
The graph obtained when the total duration of the entire system is calculated according to the number of chargers in each station is shown in Figure 9.
The present findings reveal that adding more chargers leads to a decrease in the total duration of the system. As shown in Figure 9, adding up to ten chargers can reduce the total charging time. In other words, adding more than ten chargers per station is inefficient for reducing the whole system’s charging duration, and thus is an unworthwhile investment. Therefore, this research recommends that ten chargers are installed in each station.

4.2. Results of Analysis of Charging Station Location Selection

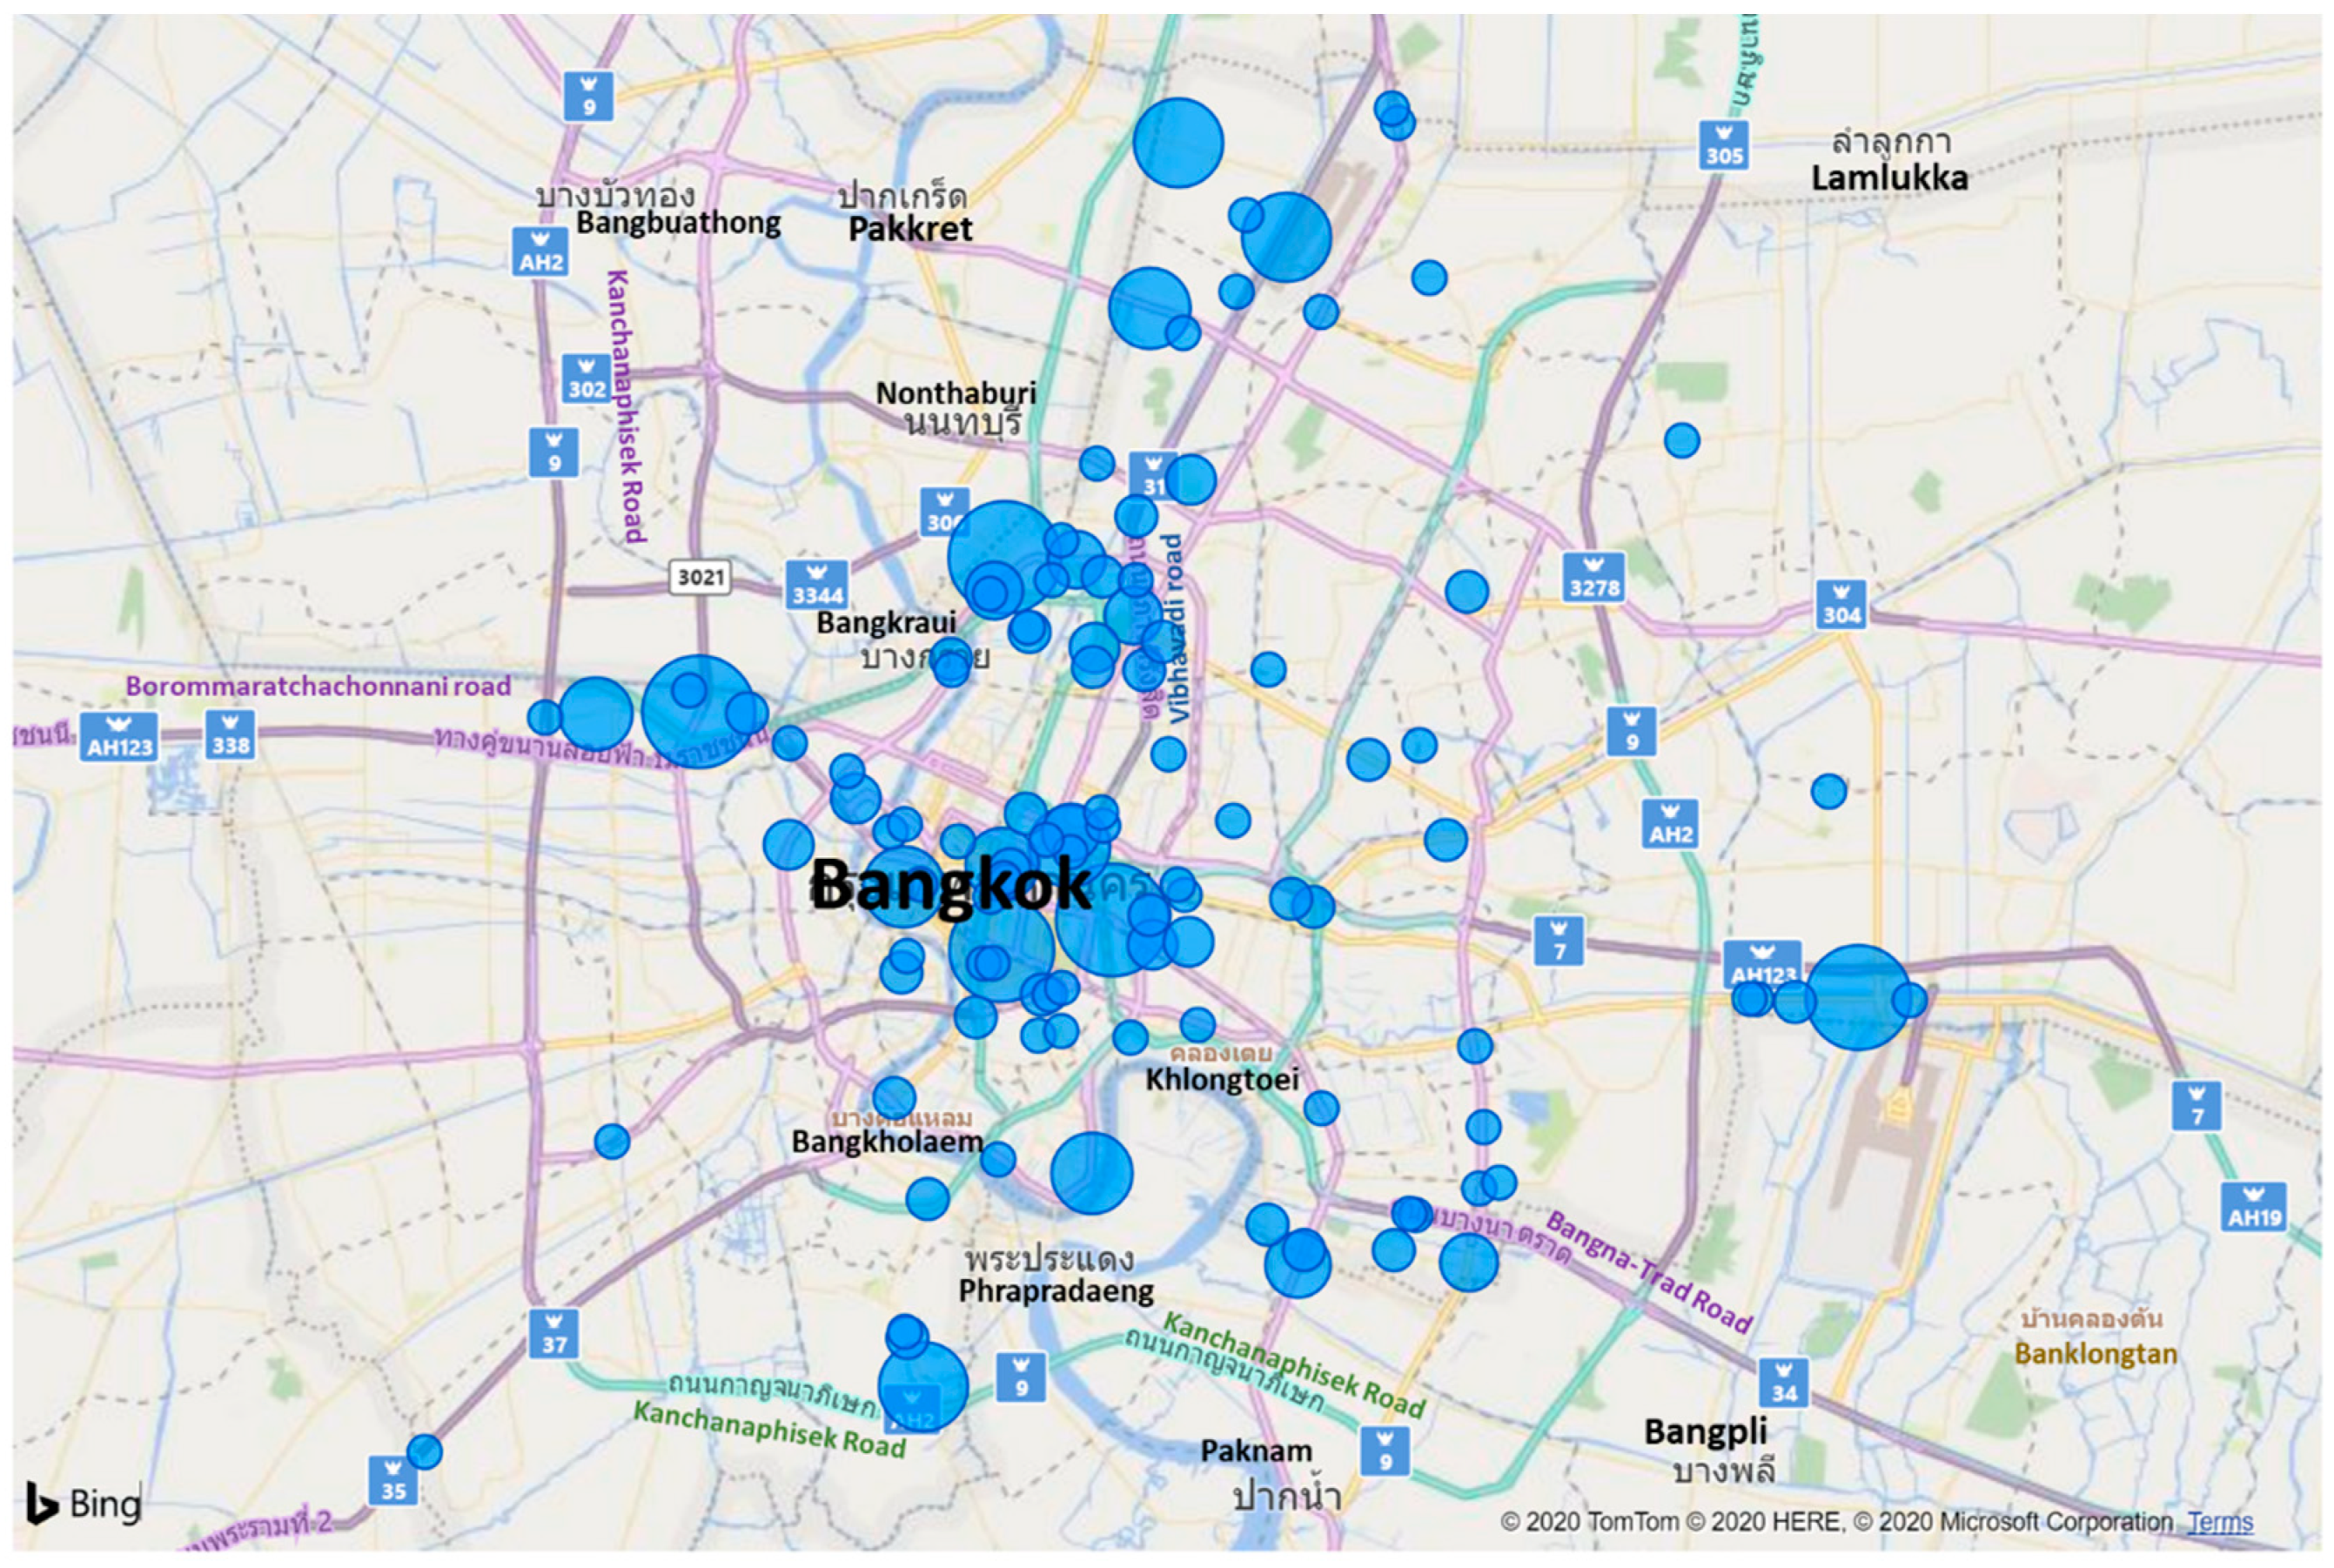
The current results discover optimal charging locations to serve BEV taxis in Bangkok, as illustrated in Figure 10. The bubble size illustrated in Figure 10 indicates how many taxis need to charge at the station. Numerous taxis need to be recharged before ending their shift in some areas, but this is not always the case in other areas. With these data, charger installation can be ordered according to demand levels, from highest to lowest, to better serve the charging needs based on taxi travel patterns, leading to profitable investments in charger installation.
The evaluation of hotspot stations is based on criteria obtained from interviews with experts on sufficient power supply, adequate parking lots, facilities for taxi drivers while waiting for charging service, and main street locations with good accessibility. It is notable that most gas stations passed the selection criteria. Table 4 shows the results of the evaluation.
This is because most gas stations in Thailand are located on the main streets with ample parking spaces, which could accommodate ten chargers each, are easily accessible, and can increase their brand awareness and brand position. They are also equipped with facilities known as non-oil businesses, e.g., coffee shops and minimarts. Regarding power supply, a fast-charging station necessitates the acquisition of an additional transformer from the Metropolitan Electricity Authority (MEA). As branded fuel stations are located on primary and secondary roads, they can process requisitions and install transformers more conveniently than other retail fuel stations. However, the MEA assessed the amount of electricity needed to support the increased use of electric vehicles, and the commission is closely monitoring the country’s electric vehicle situation. Furthermore, MEA has improved transmission lines to support the distribution of electricity, and substations are located throughout Bangkok for efficient transmission line management.

4.3. Validation

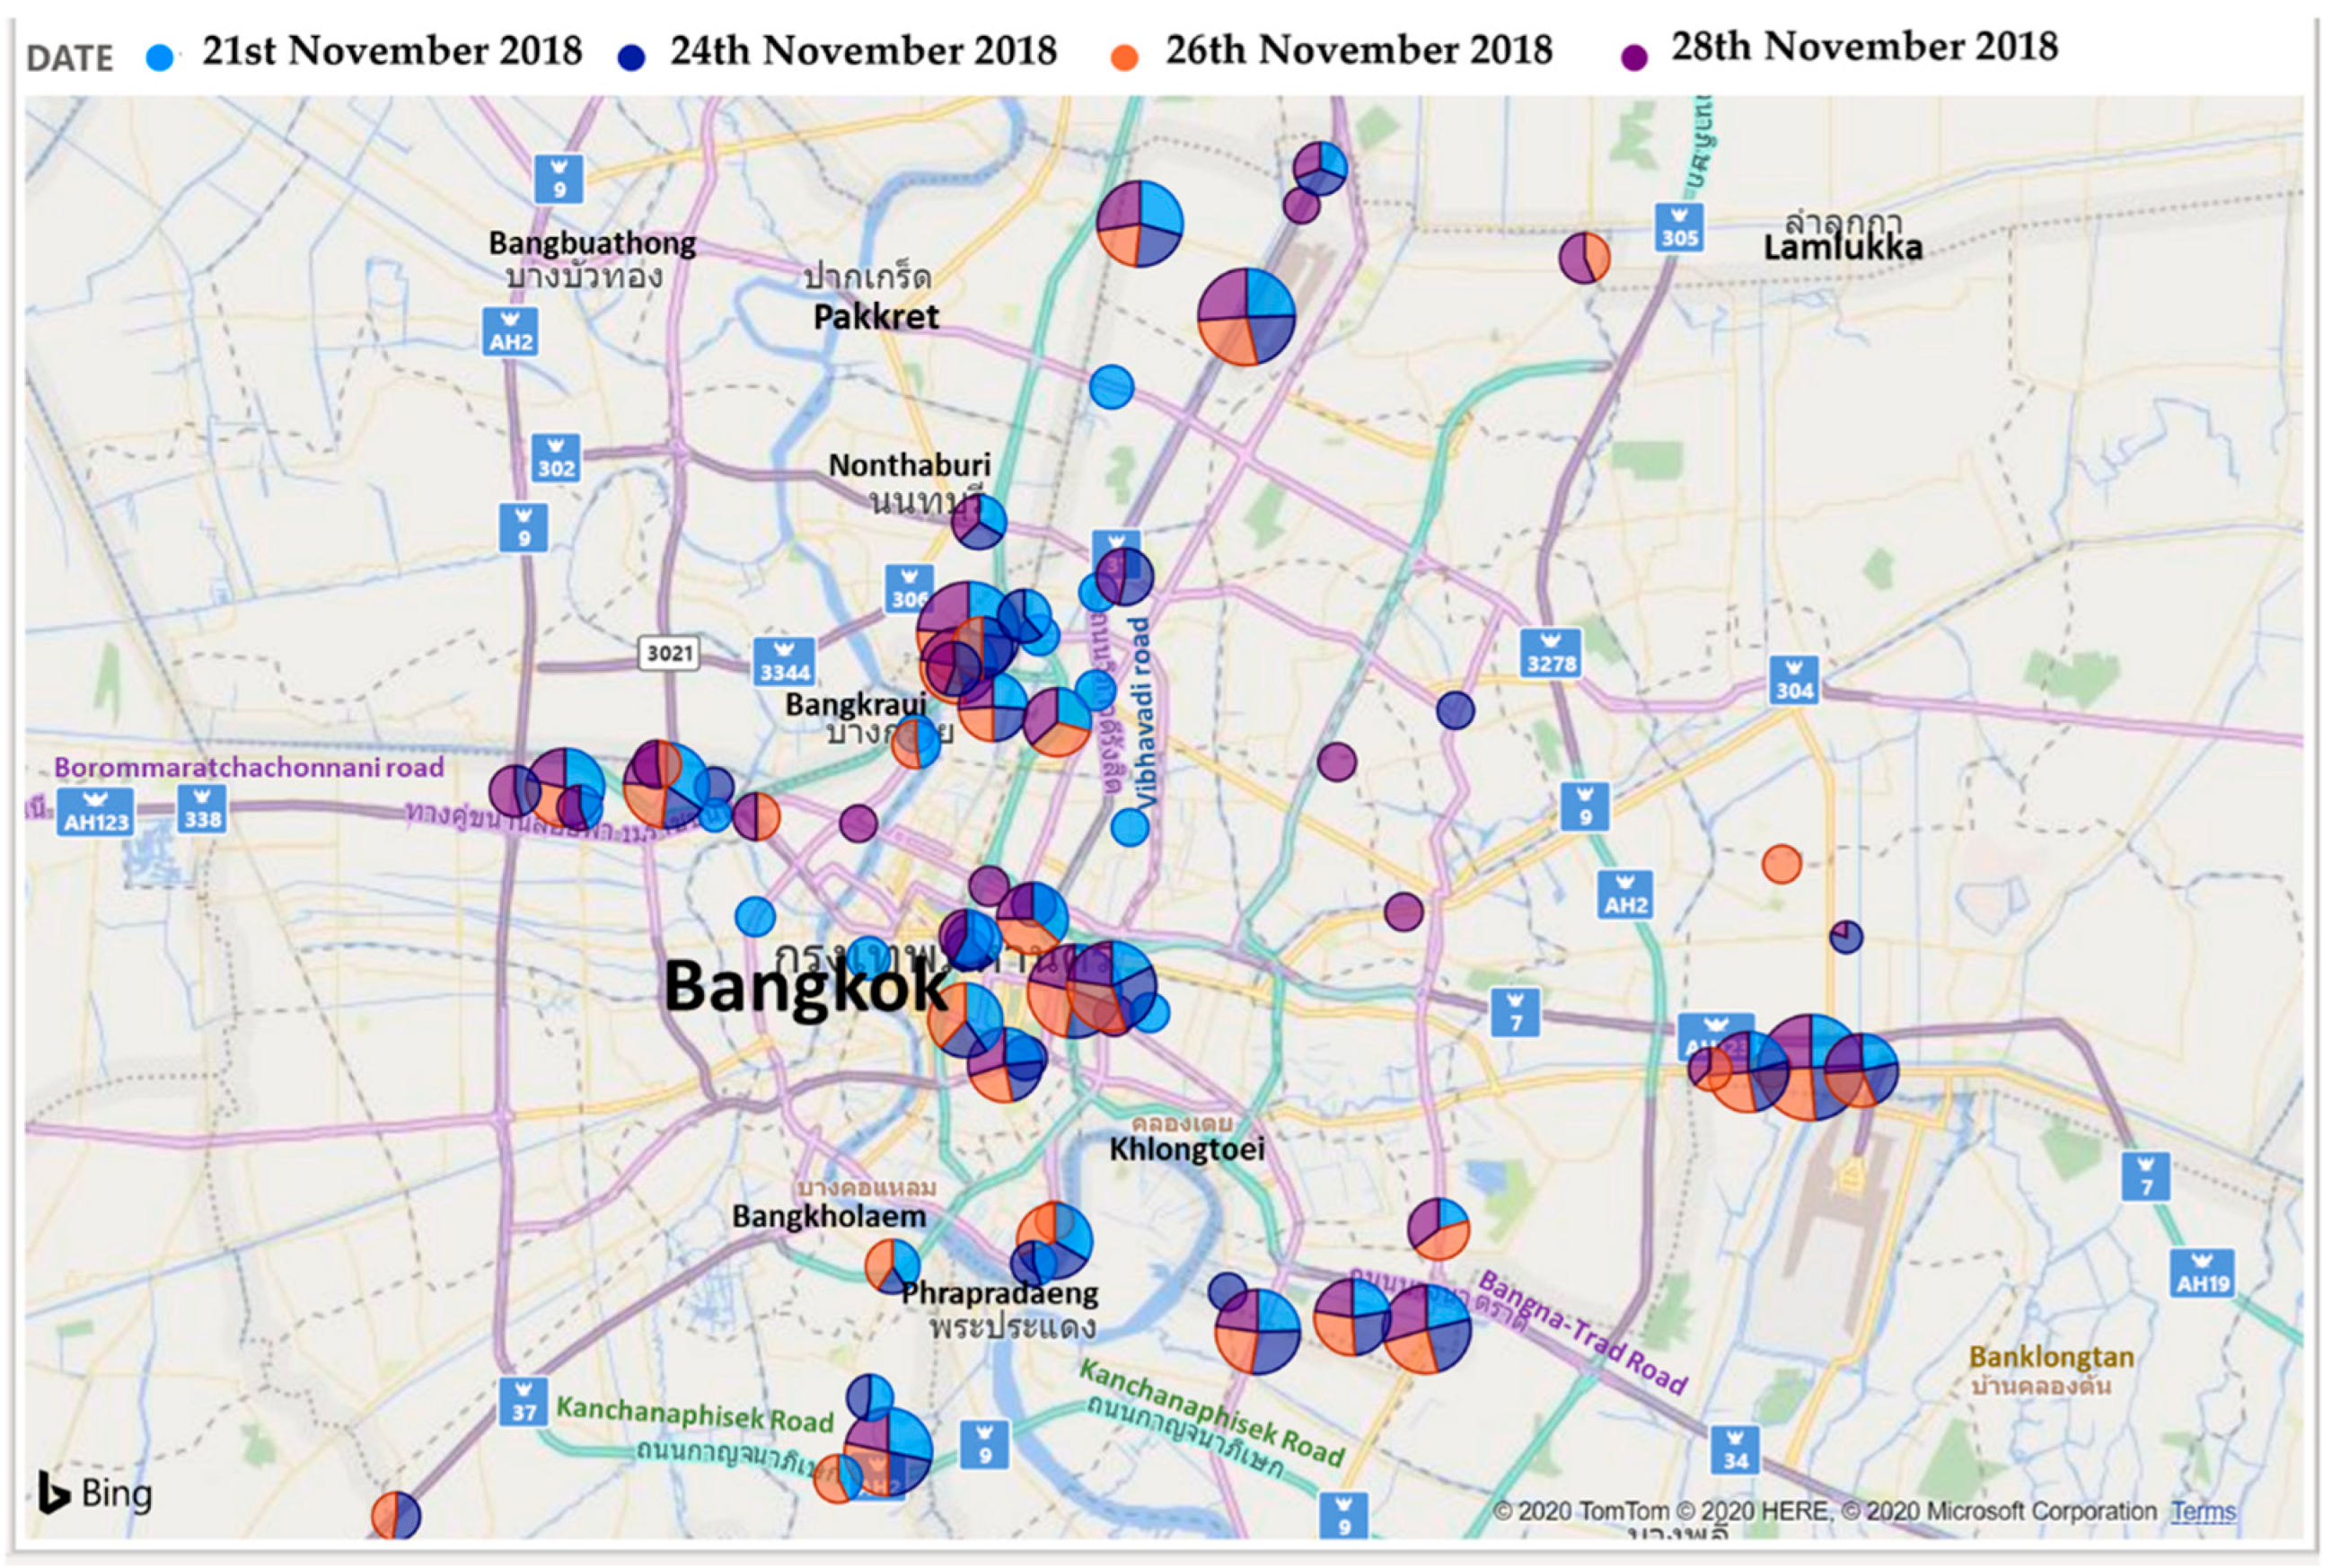
We validated data from optimal charging sites by comparing the data from 21 November 2018 with those gained from another three days, 24, 26, and 28 November 2018, for further analysis using the same method. The analysis results reveal that the hotspot locations remain unchanged, even when using data from different dates, as displayed in Figure 11. In other words, these locations are located on taxi routes and provide optimal locations for installing charging stations to serve BEV taxis.
In addition, the researchers compared the actual usage volume of ten charging stations installed by PTT Oil and Retail Business Public Company Limited (PTTOR) in Bangkok as of 2020 (Table 5) with the locations obtained from these research results. The comparison indicates that most PTTOR charging stations were rarely used. This is confirmed by the present results, which show that these ten stations are seldom used, and thus unsuitable for charging services. For this reason, this research proposes installing additional charging sites at the locations suggested in Figure 11.

5. Discussion

Research on selecting charging station locations, drawn from GPS travel data from either personal EV cars or taxis, may vary depending on the areas of interest. In this regard, the present study focuses on charging sites for BEV taxis in city areas. While personal EV cars in intercity areas can be charged daily at home, after work, or at work, BEV taxis are more likely to run over their battery range. Consequently, BEV taxis need public chargers more than personal EVs in intercity areas; this is consistent with many studies on taxi travel patterns drawn from GPS, e.g., Han et al. [30], Jung et al. [29], Tu et al. [31], and Hu et al. [32]. However, this study has explored taxi travel patterns in Bangkok, which have not previously been analyzed, and used a different analysis flow, taking gas station locations as candidate sites for installing chargers. This is the same method as was used in the study conducted by Jung et al. [29] but differs from the studies by Han et al. [30] and Hu et al. [32], which focused on empty areas or parking spaces in city areas as candidate sites. According to Keawthong and Muangsin [38], gas stations are suitable in terms of power supply, charger installation, good accessibility to main roads, adequate parking lots, and facilities for drivers while waiting to charge.
The analysis method presented in the current study, as confirmed by the findings in Csonka and Csiszár’s research [13], advocates for the following criteria to be used when locating charging sites: (1) determination of strategically suitable sites by indicating areas of Bangkok with the highest number of taxis, as Bangkok taxis are most likely to be upgraded to EVs in the future according to the Thai government’s zero-emissions policy; (2) determining candidate charging sites using gas stations; (3) evaluation of the candidate gas stations according to their infrastructure and ability to install chargers; (4) selection of candidate sites. The difference in candidate site selection in Csonka and Csiszár’s study was in the evaluation value of traffic volume on near roads, the service level of candidate sites, and the negative effect of fast charging stations [13]. The methodology this study used to select candidate sites was based on the greatest number of taxis that need to recharge, obtaining a set of installation sites that could serve Bangkok taxis. In the selection process for installation sites, this research analyzed GPS data on actual trips to find the closest charging stations, similar to the work of Han et al. [30]. Moreover, taxi travel time to the closest chargers was calculated according to traffic congestion in Bangkok.
This research employed a calculation method to find suitable locations for charging stations according to the time taxis need to travel to the stations. This method differs from the study conducted by Andrenacci et al. [19], which relied on the grouping of data from the GPS of EV cars into 100 clusters, and then calculated the centroid of each cluster by assigning each centroid as a site for charging stations in one cluster. However, having only one charging station in each cluster could fail to meet the demands of BEV taxis, which often encounter traffic jams in some areas. It is thus critical to have more than one charging station that is further away from the centroid to more efficiently serve the needs of BEV taxis running in those areas. When dealing with a large-scale EV fleet, EVs and charging stations will be distributed from the centroid in a similar manner to the water-filling method [36].
Saelee and Horanont’s research presented a simulation of the route between home and office to determine the optimal location for charging stations along this route [12]. This study’s data was derived from taxis’ actual travel data, and Google Maps was used to estimate the distance between the BEV taxi and the candidate sites, as well as the time required to reach the candidate site under realistic traffic conditions. This was consistent with Lokesh and Hui Min’s research [37], which was more accurate than simulation.
To obtain the optimal number of chargers, most previous works focused on optimizing the minimum number of chargers that could support all EV cars with a limited budget. For example, Han et al. studied the maximum number of chargers that could be installed at each station with limited space [30]. However, this research emphasizes the optimal number of chargers based on the number of BEV taxis running in the studied areas, including travel time and queue delays when charging. Meanwhile, this research is in accordance with the study conducted by Jung et al. [29], with total queue delay and travel time as determinants. It is also in line with the study by Tu et al. [31], focusing on the service level because a shorter queue could lead to a better level of service.
Several recent scientific studies on the optimal location of EV charging stations consider the constraints induced by the power grid distribution lines [23]. In Thailand, the government states that people come first (First Priority), and charging stations come second (Second Priority). In the event that insufficient transmission lines cause power outages in any area, electricity will be cut off at the EV station first to avoid affecting the majority of people. The researchers investigated the locations of the Metropolitan Electricity Authority’s substations, as shown in Figure 12. The Metropolitan Electricity Authority (MEA) substations are scattered throughout the Bangkok area and cover the ideal locations for electric charging stations. However, the Electricity Authority has been monitoring the situation of electric vehicles and regularly assessing the demand for electricity. Consequently, transmission lines have been improved to support the distribution of electricity and increase the number of electric charging stations in the future. In addition, MEA substations are scattered throughout Bangkok to efficiently manage power transmission lines. In this regard, this study’s analysis of optimal locations for installing electric charging stations can be expanded. To plan the infrastructure in the Metropolitan Electricity Authority’s electricity distribution, the future electricity demand must be calculated, as in the studies of Saelee and Horanont [12] and Andrenacci et al. [19].

6. Conclusions

6.1. Research Conclusions

The transition from ICE to BEV taxis is one of the critical ways of reducing fossil fuel consumption and air pollution in cities such as Bangkok. However, a significant challenge in this transition includes establishing an adequate number of charging stations to cover every area of charging demand. Therefore, this research proposed an analysis workflow based on the GPS data of actual taxi trips in Bangkok to select the best locations for BEV taxi charging stations and suggest a sufficient number of chargers.
In the selection process, candidate sites are determined based on their nearness to frequent taxi routes and calculated using the actual travel time to reflect the real situation of congested traffic. This can lead to the efficient management of site selection with a minimum travel time for BEV taxis. To analyze the optimal number of chargers for a single station, the travel time and queue delays in the charging service should be considered to reduce the waiting time for the whole system.
Before taxi drivers change their shifts in Bangkok, it is noticeable that, in each area, there are different numbers of taxis. As a result, charging station installations should be arranged from high to low demand in order to better respond to taxis’ travel patterns and ensure efficient investment in charging station installation, especially for hotspot charging sites. The stations that need chargers should be evaluated using the following criteria: adequate power supply, spacious parking lots, location on the main roads with good accessibility in terms of power transmitting lines, easy access for cars, a sufficient capacity of ten chargers, and facilities for drivers waiting for charging services. According to an analysis of actual GPS travel data from over 3000 taxis in Bangkok, BEV taxis must be fully charged before being handed over to the next shift. Additionally, the data have indicated high-density BEV taxi spots each day, and the travel data are used to queue BEV taxis at each charging station. Using the travel time from Google Map Distance Matrix API to reflect Bangkok traffic, we discovered that candidate sites are hotspots at which taxis would be charged all the time. According to the data validation of actual travel data on locating optimal chargers for BEV taxis, it is clear that hotspot charging spots remain unchanged, with similar locations, even with different days of taxi travel data, implying that taxis tend to travel in the same pattern. Hotspot charging stations, in other words, are frequently passed by a high number of taxis on a daily basis, making them ideal locations for charging stations. These locations should be prioritized when establishing a charging station.
Moreover, the simulation results regarding the optimal number of electric chargers per station indicated that five electric chargers per station cannot support 3187 electric taxis that must be recharged at one time. The results have also revealed that seven electric chargers could support the electric charging needs of 3187 electric taxis. This research shows that installing ten chargers instead of five will efficiently reduce charging time for the whole system. However, adding up to twelve chargers will result in a slight time reduction, with a much higher cost than that of installing ten chargers. In other words, establishing ten chargers in a single station is sufficient to service 3187 BEV taxis charging between their shifts. If the number of electric taxis increases, the appropriate number of electric chargers will need to be re-analyzed to determine whether the number of electric chargers should be increased in existing charging stations or distributed to new charging stations. This would determine which one would reduce the overall system time by considering the travel time generated by the Google Map Distance Matrix API. However, Thailand has approximately 100 electric taxis at present, with the potential to increase to 4000 electric taxis in the next five years [38]. COVID-19 is a significant factor contributing to the slowdown in electric taxi expansion, as the number of tourists and taxi travel is decreasing. This analysis can provide long-term support for electric taxis in Thailand.
In addition, when we analyzed the actual usage data of ten charging stations established by a major energy company in Bangkok according to the current analysis flow, these ten stations were predicted to be rarely used and not suitable for charger sites. These results support the information presented by the energy company. The current analysis process is efficient for identifying optimal charging station locations, including finding the suitable number of chargers for a station to serve the charging demand. It also contributes to increasing the cost-effectiveness of installing electric chargers. This research also contributes to a new method for determining the optimal locations for charging stations for electric taxis in Bangkok. Instead of the distance or demand density used in previous studies, the actual travel time from the Google Map Distance Matrix API was used to determine the optimal location. This approach increases efficiency and decreases wait times throughout the system. The data in this study provide a new dataset, which has never been analyzed before and includes actual taxi travel data in Bangkok, as well as the location of service stations in Bangkok. The analysis workflow proposed here can be used as a model for other optimal location analyses. It can be used as a guideline for analysis to determine where to install charging stations and can improve the means of selecting where to install charging stations compared to existing methods. This will result in more efficient public and private sector investment in the construction of electric charging stations.

6.2. Policy Recommendation

At present, taxis in Thailand are subsidized for energy costs. Switching to BEV taxis leads to lower energy costs, which encourages further shifts to electric taxis [39]. Furthermore, the government should develop a clear plan to increase the number of BEV taxis, encourage the switch to BEV taxis by lowering the vehicle tax, encourage the domestic production of BEV taxis, subsidize some costs of purchasing BEV taxis, subsidize the electricity fee for BEV taxis, and lower the service rate to incentivize the use of BEV taxis. Newly registered taxis should be BEV taxis, as in other countries. This would require increasing the number of charging stations along taxi routes and ensuring that enough chargers are supplied for future BEV taxis. This will boost confidence in the transition from ICE to BEV taxis. However, electric chargers must be installed in conjunction with the application to reserve electric chargers. In the future, the applications of all brands should interface with one another in a centralized queuing manner to achieve maximum efficiency by reducing travel time to charging stations and reducing waiting times in queues throughout the system.

6.3. Research Limitation and Future Research

However, this research has limitations in that it is unable to analyze all taxi-travel data for all durations due to the lengthy data-processing time required and the need for a high-performance computer, including the high cost of purchasing Google Map Distance Matrix API data. Therefore, for better results regarding charging sites, actual travel data or big data for all taxis in all periods are recommended for analysis. Future research could be expanded by using actual travel data from other types of vehicles, such as personal cars, rental cars, or buses, to determine the optimal location for electric charging stations. The proposed analysis process can be applied to other areas or countries that encourage the use of electric vehicles, such as Laos, Cambodia, or Vietnam. Furthermore, the findings of this study can be extended to calculate the electricity demand for electric vehicles in the future to help plan the Metropolitan Electricity Authority’s electricity distribution infrastructures.

Author Contributions

Conceptualization, V.M.; methodology, V.M. and P.K.; formal analysis, P.K., V.M. and C.G.; visualization, P.K.; writing—original draft preparation, P.K.; writing—review and editing, V.M. and C.G. All authors have read and agreed to the published version of the manuscript.

Funding

This research received no external funding.

Acknowledgments

We would like to thank the respondents for their cooperation with the interviews and taxi data from the Intelligent Traffic Information Center (iTIC).

Conflicts of Interest

The authors declare no conflict of interest.

References

  1. Department of Land Transport. Number of Vehicle Registered in Thailand 2022. 2022. Available online: https://web.dlt.go.th/statistics/ (accessed on 19 November 2018).
  2. Thailand Development Research Institute, Market Structure and Taxi Service in Bangkok. Project for Safety and Quality of Taxi Service Seminar. 2018. Available online: https://tdri.or.th/wp-content/uploads/2018/06/Taxi-ppt_all-parts_14June2018.pdf (accessed on 19 November 2018).
  3. Peungnumsai, A.; Witayangkurn, A.; Nagai, M.; Arai, A.; Ranjit, S.; Ghimire, B.R. Bangkok taxi service behavior analysis using taxi probe data and questionnaire survey. In Proceedings of the MISNC ‘17: 4th Multidisciplinary International Social Networks Conference, Bangkok Thailand, 17–19 July 2017. [Google Scholar] [CrossRef]
  4. Razzaq, A.; Cui, Y.; Irfan, M.; Maneengam, A. Asymmetric effects of fine particulate matter and stringency policy on COVID-19 intensity. Int. J. Environ. Health Res. 2022, 32, 1–10. [Google Scholar] [CrossRef] [PubMed]
  5. Lin, C.; Lin, C. The p-center flow-refueling facility location problem. Transp. Res. Part B 2018, 118, 124–142. [Google Scholar] [CrossRef]
  6. Shen, Z.M.; Feng, B.; Mao, C.; Ran, L. Optimization models for electric vehicle service operations: A literature review. Transp. Res. Part B 2020, 128, 462–477. [Google Scholar] [CrossRef]
  7. Wu, F.; Sioshansi, R. A stochastic flow-capturing model to optimize the location of fast-charging stations with uncertain electric vehicle flows. Transp. Res. Part D Transp. Environ. 2017, 53, 354–376. [Google Scholar] [CrossRef]
  8. Li, S.; Huang, Y. Heuristic approaches for the flow-based set covering problem with deviation paths. Transp. Res. Part E Logist. Transp. Rev. 2014, 72, 144–158. [Google Scholar] [CrossRef]
  9. Li, S.; Huang, Y. Development of electric vehicle charging corridor for South Carolina. Int. J. Transp. Sci. Technol. 2015, 4, 395–411. [Google Scholar] [CrossRef]
  10. Xi, X.; Sioshansi, R.; Marano, V. Simulation-optimization model for location of a public electric vehicle charging infrastructure. Transp. Res. Part D Transp. Environ. 2013, 22, 60–69. [Google Scholar] [CrossRef]
  11. Ghamami, M.; Zockaie, A.; Nie, Y.M. A general corridor model for designing plug-in electric vehicle charging infrastructure to support intercity travel. Transp. Res. Part C Emerg. Technol. 2016, 68, 389–402. [Google Scholar] [CrossRef]
  12. Saelee, S.; Horanont, T. Optimal placement of EV charging station considering the road traffic volume and EV running distance. J. Traffic Logist. Eng. 2016, 4, 19–23. [Google Scholar] [CrossRef]
  13. Csonka, B.; Csiszár, C. Determination of charging infrastructure location for electric vehicles. Transp. Res. Procedia 2017, 27, 768–775. [Google Scholar] [CrossRef]
  14. Zhu, Z.H.; Gao, Z.Y.; Zheng, J.F.; Du, H.M. Charging station location problem of plug-in electric vehicles. J. Transp. Geogr. 2016, 52, 11–22. [Google Scholar] [CrossRef]
  15. Sun, Z.; Gao, W.; Li, B.; Wang, L. Locating charging stations for electric vehicles. Transp. Policy 2020, 98, 48–54. [Google Scholar] [CrossRef]
  16. Mortimer, B.J.; Hecht, C.; Goldbeck, R.; Sauer, D.U.; de Doncker, R.W. Electric vehicle public charging infrastructure planning using real-world charging data. World Electr. Veh. J. 2022, 13, 94. [Google Scholar] [CrossRef]
  17. Shabbar, R.; Kasasbeh, A.; Ahmed, M.M. Charging station allocation for electric vehicle network using stochastic modeling and grey wolf optimization. Sustainability 2021, 13, 3314. [Google Scholar] [CrossRef]
  18. He, S.Y.; Kuo, Y.; Kit, K. The spatial planning of public electric vehicle charging infrastructure in a high-density city using a contextualised location-allocation model. Transp. Res. Part A 2022, 160, 21–44. [Google Scholar] [CrossRef]
  19. Andrenacci, N.; Ragona, R.; Valenti, G. A demand-side approach to the optimal deployment of electric vehicle charging stations in metropolitan areas. Appl. Energy 2016, 182, 39–46. [Google Scholar] [CrossRef]
  20. Erbaş, M.; Kabak, M.; Özceylan, E.; Çetinkaya, C. Optimal siting of electric vehicle charging stations: A GIS-based fuzzy Multi-Criteria Decision Analysis. Energy 2018, 163, 1017–1031. [Google Scholar] [CrossRef]
  21. Energy Policy and Planning Office. Project to Study the Preparation for Future Use of Electric Vehicles in Thailand. 2015. Available online: http://www.eppo.go.th/index.php/th/eppo-intranet/item/7587-stu-re001 (accessed on 5 June 2018).
  22. Zhang, Y.; Koon, B.; Zhang, L. Integrated Bayesian networks with GIS for electric vehicles charging site selection. J. Clean. Prod. 2022, 344, 131049. [Google Scholar] [CrossRef]
  23. Carli, R.; Dotoli, M. A distributed control algorithm for optimal charging of electric vehicle fleets with congestion management. IFAC-PapersOnLine 2018, 51, 373–378. [Google Scholar] [CrossRef]
  24. Liu, J.; Zhang, T.; Zhu, J.; Ma, T. Allocation optimization of electric vehicle charging station (EVCS) considering with charging satisfaction and distributed renewables integration. Energy 2018, 164, 560–574. [Google Scholar] [CrossRef]
  25. Stüdli, S.; Crisostomi, E.; Middleton, R.; Shorten, R.; Stu, S. A flexible distributed framework for realising electric and plug-in hybrid vehicle charging policies. Int. J. Control 2012, 85, 7179. [Google Scholar] [CrossRef]
  26. Ma, Z.; Callaway, D.S.; Hiskens, I.A. Decentralized charging control of large populations of plug-in electric vehicles. IEEE Trans. Control Syst. Technol. 2013, 21, 67–78. [Google Scholar] [CrossRef]
  27. Baek, S.; Kim, H.; Chang, H.J. A feasibility test on adopting electric vehicles to serve as taxis in daejeon metropolitan City of South Korea. Sustainability 2016, 8, 964. [Google Scholar] [CrossRef]
  28. Stabile, A.; Longo, M.; Yaïci, W.; Foiadelli, F. An algorithm for optimization of recharging stops: A case study of electric vehicle charging stations on Canadian’s Ontario Highway 401. Energies 2020, 13, 2055. [Google Scholar] [CrossRef]
  29. Jung, J.; Chow, J.Y.J.; Jayakrishnan, R.; Park, J.Y. Stochastic dynamic itinerary interception refueling location problem with queue delay for electric taxi charging stations. Transp. Res. Part C Emerg. Technol. 2014, 40, 123–142. [Google Scholar] [CrossRef]
  30. Han, D.; Ahn, Y.; Park, S.; Yeo, H. Trajectory-interception based method for electric vehicle taxi charging station problem with real taxi data. Int. J. Sustain. Transp. 2016, 10, 671–682. [Google Scholar] [CrossRef]
  31. Tu, W.; Li, Q.; Fang, Z.; Shaw, S.L.; Zhou, B.; Chang, X. Optimizing the locations of electric taxi charging stations: A spatial–temporal demand coverage approach. Transp. Res. Part C Emerg. Technol. 2016, 65, 172–189. [Google Scholar] [CrossRef]
  32. Hu, L.; Dong, J.; Lin, Z.; Yang, J. Analyzing battery electric vehicle feasibility from taxi travel patterns: The case study of New York City, USA. Transp. Res. Part C Emerg. Technol. 2018, 87, 91–104. [Google Scholar] [CrossRef]
  33. Wang, H.; Zhao, D.; Cai, Y.; Meng, Q.; Ong, G.P. Taxi trajectory data based fast-charging facility planning for urban electric taxi systems. Appl. Energy 2021, 286, 116515. [Google Scholar] [CrossRef]
  34. Cilio, L.; Babacan, O. Allocation optimisation of rapid charging stations in large urban areas to support fully electric taxi fleets. Appl. Energy 2021, 295, 117072. [Google Scholar] [CrossRef]
  35. Kaya, Ö.; Alemdar, K.D.; Atalay, A.; Çodur, M.Y.; Tortum, A. Electric car sharing stations site selection from the perspective of sustainability: A GIS-based multi-criteria decision making approach. Sustain. Energy Technol. Assess. 2022, 52, 102026. [Google Scholar] [CrossRef]
  36. Carli, R.; Dotoli, M.; Member, S. A distributed control algorithm for waterfilling of networked control systems via consensus. IEEE Control Syst. Lett. 2017, 1, 334–339. [Google Scholar] [CrossRef]
  37. Lokesh, B.T.; Min, J.T.H. A framework for electric vehicle (EV) charging in Singapore. Energy Procedia 2017, 143, 15–20. [Google Scholar] [CrossRef]
  38. Keawthong, P.; Muangsin, V. Thailand’ s EV taxi situation and charging station locations. In Proceedings of the 10th International Conference on Informatics, Environment, Energy and Applications 2021 (IEEA 2021), Xi’an, China, 2–14 March 2021; pp. 17–22. [Google Scholar] [CrossRef]
  39. Irfan, M.; Ahmad, M. Relating consumers’ information and willingness to buy electric vehicles: Does personality matter? Transp. Res. Part D 2021, 100, 103049. [Google Scholar] [CrossRef]
Figure 1. Process of analysis of charging station locations.
Sustainability 14 11033 g001
Figure 2. Heatmap of locations of 3178 taxis with unoccupied status from 15.00 to 16.00.
Sustainability 14 11033 g002
Figure 3. Locations of gas stations in Bangkok.
Sustainability 14 11033 g003
Figure 4. A sample of travel patterns from 15.00 to 16.00 with the location of unoccupied taxis ready for charging.
Sustainability 14 11033 g004
Figure 5. The distance between taxis and charging stations.
Sustainability 14 11033 g005
Figure 6. Locations of nearest candidate site to BEV taxis.
Sustainability 14 11033 g006
Figure 7. A sample of calculated distance and duration for taxis, from their origins to candidate sites, calculated by The Google Map Distance Matrix API.
Sustainability 14 11033 g007
Figure 8. (a,b): arranging the queue of BEV taxis for charging services.
Sustainability 14 11033 g008aSustainability 14 11033 g008b
Figure 9. Relationship between the number of chargers per station and the total charging time of the system.
Sustainability 14 11033 g009
Figure 10. Charging locations to serve BEV taxis based on data from 21 November 2018. Bubble size indicates how many taxis need to charge at the station.
Sustainability 14 11033 g010
Figure 11. Optimal charging station locations based on data from 21 November, 24 November, 26 November, and 28 November 2018.
Sustainability 14 11033 g011
Figure 12. The optimal location for the charging station (blue dot) and the substations of the Metropolitan Electricity Authority (red dot) in Bangkok.
Sustainability 14 11033 g012
Table 1. Dates and durations for the number of taxis between 15.00 and 16.00.
Date/Month/YearNumber of Taxis from 15.00 to 16.00Number of Unoccupied Taxis from 15.00 to 16.00Number of Unoccupied Taxis from 16.00
21 November 201839133187726
24 November 201838853181704
26 November 2018 38763137739
28 November 201839103112789
Table 2. Data on taxi travel time and locations for 3900 taxis.
T_IDT_LatT_LonT_TimestampT_For_Hire_Light
9oDXJxuzEHcf/VkWteB0ttvd3jw13.92988100.7217228 November 2018 0:001
sRdBUU6lEqZtUkq9hEwgUini+DI13.90742100.6921328 November 2018 0:001
B+/OA0UL5IHr+NLRE1qIe/c9wuo13.69318100.6067028 November 2018 0:000
tnwJ20HUl/FfnGJ65ZnT8/B9DVk13.76778100.6382428 November 2018 0:001
5DrRbV35cf3iL9N6JStakgv2BHQ13.80305100.4405128 November 2018 0:000
x1/nyx5tu7obmM+uMdrGamImeGE13.77500100.4267528 November 2018 0:000
B91PDkhhcajrbi94IkKSmEkL21013.69577100.3893128 November 2018 23:591
Remark: T_ID = Taxi ID. T_Lat = 5-digit Latitude. T_Lon = 5-digit Longitude. T_Timestamp = time identification. T_For_hire_light = Hire light status where 1 = Hire light status “unoccupied” = without passengers. 0 = Hire light status “occupied” = with passengers.
Table 3. The results of the taxi charging order based on the number of chargers in each station.
No. of ChargersRoundNo. of BEV Taxis (Start)No. of Charged BEV Taxis
(At Nearest Candidate Sites)
Total Number of Charged BEV Taxis (Each Round)
S1S2S3S4S5
5 Chargers1st3187195932313178462537
2nd650552319129118
7 Chargers1st31872305452246129453177
2nd1010000010
10 Chargers1st31872624352167144403127
2nd6060000060
11 Chargers1st318726963329950103187
2nd0000000
12 Chargers1st31872757282905263187
2nd0000000
S1–S5 = 5 candidate sites nearest to BEV taxis.
Table 4. Evaluation criteria for hotspot stations.
S_IDS_BrandS_LatS_LonPower SupplyParking LotFacilitiesMain Road
184ESSO13.722847100.74142
435PTT13.830949100.52565
387PTT13.909576100.59688
366PTT13.741872100.55281
594SHELL13.743079100.56226
438PTT13.657681100.64299
319PT13.627190100.50507
402PTT13.793020100.44826
392PTT13.932742100.56958
595SHELL13.657064100.59976
177ESSO13.721733100.72540
399PTT13.792485100.42226
606SHELL13.660700100.62400
702SUSCO13.822806100.52301
558SHELL13.723500100.53500
313PT13.722133100.75441
Table 5. Actual usage of PTTOR charging stations compared with the results.
Station NameHighest Number of EV Charging Activities per MonthAverage Number of EV Charging Activities per MonthResults of
Location Analysis
Consistency of
Analysis Results with Actual Usage Data
PTT Nuanchan6225Low usageAssociated
PTT Ladprao–Wang Hin2214Low usageAssociated
PTT Ekamai–Ramintra339Low usageAssociated
PTT Mayalarp198Low usageAssociated
PTT Prachachuen 23212Medium usageNot associated
PTT Rama 2 outbound197Low usageAssociated
PTT Pracha Uthit–Ladprao1512Low usageAssociated
PTT Ratchaphruek156Low usageAssociated
PTT Borom Rachachonani206Low usageAssociated
PTT Ratburana outbound127Low usageAssociated
Publisher’s Note: MDPI stays neutral with regard to jurisdictional claims in published maps and institutional affiliations.