Article

Arsenic Adsorption and Desorption in Various Aqueous Media in the Nearshore Zone and Influencing Factors

1
Hebei Key Laboratory of Geological Resources and Environment Monitoring and Protection, Shijiazhuang 050021, China
2
Key Laboratory of Groundwater Contamination and Remediation of Hebei Province and China Geological Survey, The Institute of Hydrogeology and Environmental Geology, Chinese Academy of Geological Sciences, Shijiazhuang 050061, China
3
Hebei Center for Ecological and Environmental Geology Research, Hebei GEO University, Shijiazhuang 050031, China
4
Hebei Province Collaborative Innovation Center for Sustainable Utilization of Water Resources and Optimization of Industrial Structure, Hebei GEO University, Shijiazhuang 050031, China
5
Hebei Province Key Laboratory of Sustained Utilization and Development of Water Resources, Hebei GEO University, Shijiazhuang 050031, China
6
School of Water Resources and Environment, Hebei GEO University, Shijiazhuang 050031, China
7
Institute of Water Resources and Environment, Jilin University, Changchun 130021, China
*
Authors to whom correspondence should be addressed.
Sustainability 2022, 14(17), 10935; https://doi.org/10.3390/su141710935
Submission received: 28 July 2022 / Revised: 29 August 2022 / Accepted: 31 August 2022 / Published: 1 September 2022
(This article belongs to the Special Issue Sustainable Assessment and Management of Groundwater Resources)

Abstract

:
A profound understanding of the adsorption and desorption characteristics of arsenic on various media in aqueous solutions is helpful for evaluating the behavior of arsenic in groundwater. In this study, the characteristics of arsenic adsorption and desorption on aqueous media including silty clay, fine sand, medium sand, and coarse sand with gravel from Shenyang Huangjia water source, China were investigated by batch experiments. The results showed that the aqueous media in the study area had a strong fixation ability for arsenic, and both physical and chemical adsorption of arsenic occurred. Among them, silty clay had the strongest adsorption capacity and the largest buffer capacity for arsenic. As the specific surface area (SSA) of the medium decreased, the adsorption capacity decreased, and the desorption capacity increased. There was an obvious positive correlation between the desorption capacity and adsorption capacity of arsenic, and the force of the adsorption process was larger than that of the desorption process. The pH, temperature, carbonate, and ionic strength all affected the arsenic adsorption and desorption, and adsorption of arsenic occurred mainly by obligate adsorption in the study area.

1. Introduction

River water and groundwater are important in the hydrological cycle and there is a continuous exchange of water, materials, and energy between these compartments [1,2,3,4,5]. A series of physical and chemical reactions occur during recharge of groundwater by river water infiltration. These reactions can result in the release of harmful substances, such as arsenic, into groundwater and cause water pollution [6,7,8,9]. The World Health Organization (WHO), China, Japan, and the United States have set the standard limit of arsenic concentration in drinking water for residents at 10 μg/L, and the WHO stipulates that when the arsenic concentration in groundwater exceeds 10 μg/L, it can be considered as high arsenic groundwater [10,11]. Long-term intake of arsenic-containing groundwater can lead to chronic poisoning and various diseases [12,13,14,15]. Groundwater, as one of the drinking water sources, once polluted by arsenic, will do great harm to human health.
High arsenic groundwater is widely distributed around the world and has appeared in more than 70 countries and regions, such as China, India, Bangladesh, the United States and Chile [16,17,18]. About 200 million people globally are potentially affected by high arsenic groundwater, the vast majority in Asia [19]. Consequently, arsenic in groundwater has attracted increasing attention [20,21,22,23]. Arsenic often coexists with iron-containing minerals (e.g., hematite, pyrite) in aquifers, and is mainly adsorbed on the surface of iron oxides in the form of arsenate and arsenite or coexists with pyrite in the form of arsenic sulfide. The reductive dissolution of arsenic-containing iron oxides (e.g., goethite, hematite, lepidocrocite, etc.), the oxidative dissolution of arsenic-containing sulfides (e.g., arsenopyrite), the desorption of arsenate and arsenite from the surface of iron minerals, and geothermal process may all lead to the release of arsenic from the solid phase of the aquifer into groundwater [24,25,26,27,28]. Arsenic migration in the environment is mainly controlled by adsorption on clay minerals (e.g., montmorillonite, kaolinite) and metal oxides (e.g., ferrihydrite, gibbsite) [29,30,31,32,33]. Iron and manganese oxides/hydroxides are the main substances that adsorb arsenic, and their adsorption capacities are greatly affected by pH [34,35,36,37]. In addition, anions such as PO43− and HCO3 can compete with arsenic for effective adsorption sites on the surfaces of minerals to reduce their arsenic adsorption capacities [38,39,40]. Organic components in groundwater have many active functional groups and large surface areas, which can provide adsorption sites and increase the arsenic adsorption capacity through surface complexation and precipitation [41,42,43].
Most previous studies have involved field monitoring and analysis of the behavior of arsenic. There have been few experimental studies on the arsenic adsorption and desorption characteristics in various aqueous media in the nearshore zone and the influences of different factors on adsorption/desorption. A profound understanding of these characteristics could be helpful to evaluate the behavior of arsenic in the nearshore zone.
The Shenyang Huangjia water source is a typical riverside groundwater source in North China. The environmental characteristics and hydrodynamic conditions of the nearshore zone in this area have changed greatly over recent years [44,45]. The aqueous medium is rich in high iron and manganese primary minerals (e.g., hematite, siderite, pyrolusite, etc.), and the concentration of iron, manganese and arsenic in groundwater generally exceeds the standard [10], and this is risky to the lives and health of residents that use this water source. However, the arsenic adsorption and desorption characteristics on various media in aqueous environments in this region are not completely clear [46].
In this paper, the arsenic adsorption and desorption characteristics on various media in the nearshore zone were studied. Batch experiments with arsenic were used to study the effects of the pH, temperature, carbonate, and ionic strength on the behavior of arsenic. The results provide reference data that could be used to ensure the water is safe for consumption by local residents.

2. Materials and Methods

2.1. Study Area

The study area is located in Shenyang Huangjia water source, 40 km north of Shenyang City, in the alluvial plain of the middle and lower reaches of the Liao River (Figure 1). The terrain in this area is relatively flat and mainly consists of low river floodplains. The area belongs to a warm, temperate, semi-humid monsoon climate, with an annual average temperature of about 13 °C and an average annual precipitation of about 700 mm. The study area mainly contains quaternary loose pore water, and the aquifer is mainly composed of fine sand, medium sand, coarse sand with gravel, and the arsenic content ranges from 2.48 to 3.32 mg/kg [47]. The vertical hydraulic connection is close. The riverbed sediment is mainly silty clay, and the arsenic content is about 4.32 mg/kg. The pH and oxidation-reduction potential (Eh) of the river are about 8.17 and 35 mV, respectively, and the arsenic concentration is about 2.21 μg/L. The pH of the groundwater ranges from 7.26 to 7.72, and the Eh ranges from −12 mV to −135 mV, showing a weakly alkaline reducing environment. The arsenic concentration of groundwater ranges from 1.16 μg/L to 90.83 μg/L, mainly trivalent As (III), and most of them greatly exceed 10 μg/L, the exceeding rate is 87.5% [44,47]. There are twelve pumping wells along the river in this area, and the mining volume is about 30,000 m3/d. Groundwater is recharged by river water infiltration year-round.

2.2. Experimental Materials

Riverbed sediment and soil samples were collected to characterize the lithology of the nearshore zone. At the riverbed HC, 3 m away from the south bank of the Liao River, riverbed sediment samples within 1.5 m of the riverbed surface were collected using a Beeker portable sediment sampler (4 cm inner diameter) (Figure 1). At the riverbank HB, 5 m away from the south bank, soil samples from within 10 m below the surface were collected using an impact corer. The collected samples were cut at intervals of 50 cm, stored in glass bottles and sealed with tin foil. The SSA and total organic carbon (TOC) of the samples were measured using a SSA analyzer (JB−2020, Jingxin Powder Testing Equipment Co., Ltd., Chengdu, China) and a TOC analyzer (TOC-L CPH CN200, Shimadzu Corporation, Kyoto, Japan), respectively. Particle analysis was performed using a sieve method [48]. Other samples were air-dried and then sterilized in an autoclave (121 °C, 0.15 MPa) for 30 min. According to the particle size analysis results, samples with different lithologies (numbered S1–S4) were selected for batch experiments (Table 1). These experimental samples were put into conical flasks, and Na2HPO4 solution was added, shaken for 12 h and dried below 50 °C for 24 h. Then, the samples were repeatedly soaked and washed with ultrapure water until the conductivity of the solution remained stable (about 30 μs/cm), dried below 50 °C for 48 h, and stored for later use. The arsenic contents in the samples after arsenic removal were not detected. An arsenic reference solution with a concentration of 100 mg/L was prepared by dissolving sodium arsenite in 1 L of ultrapure water. The reference solution was gradually diluted with ultrapure water to the concentration required for each experiment.

2.3. Experimental Methods

For all of the experiments (Section 2.3.1, Section 2.3.2, Section 2.3.3, Section 2.3.4 and Section 2.3.5), one parallel sample was prepared for each group to reduce experimental error, and a blank control experiment was set up.

2.3.1. Adsorption Kinetics Experiments

Before the kinetics experiments, a preliminary experiment was conducted to compare the adsorption behavior between the aqueous medium and a certain concentration of arsenic solution. Through comprehensive analysis of several experiments, it was found that under the same environmental conditions, when the aqueous medium was 5.0 g, the arsenic solution volume was 150 mL, and the concentration was 1.0 mg/L, the adsorption and testing effects were the best. Samples S1–S4 were accurately weighed (5.0 g each) and placed in separate 250-mL conical flasks that were sterilized under high pressure and humidity. Arsenic solution (150 mL, 1.0 mg/L) was added to each flask. According to the actual data of the groundwater environment monitored in the field, the pH was adjusted to 8.0 using NaOH and HCl. The flasks were then placed in an oscillation incubator (120 r/min) at 13 °C. Samples of the supernatant were withdrawn at 5, 10, and 30 min, and 1, 3, 6, 9, 12, 18, 24, 36, 48, 72, and 96 h.

2.3.2. Isothermal Adsorption Experiments

Samples S1–S4 were accurately weighed (1.0 g each) and placed in separate 50-mL conical flasks that were sterilized under high pressure and humidity. Arsenic solution (30 mL; 0.1, 0.6, 1.2, 6.5, 13, 30, or 60 mg/L) was added to each flask and the pH was adjusted to 8.0. The flasks were placed in an oscillation incubator (120 r/min) at 13 °C. A sample of the supernatant was taken after 72 h.

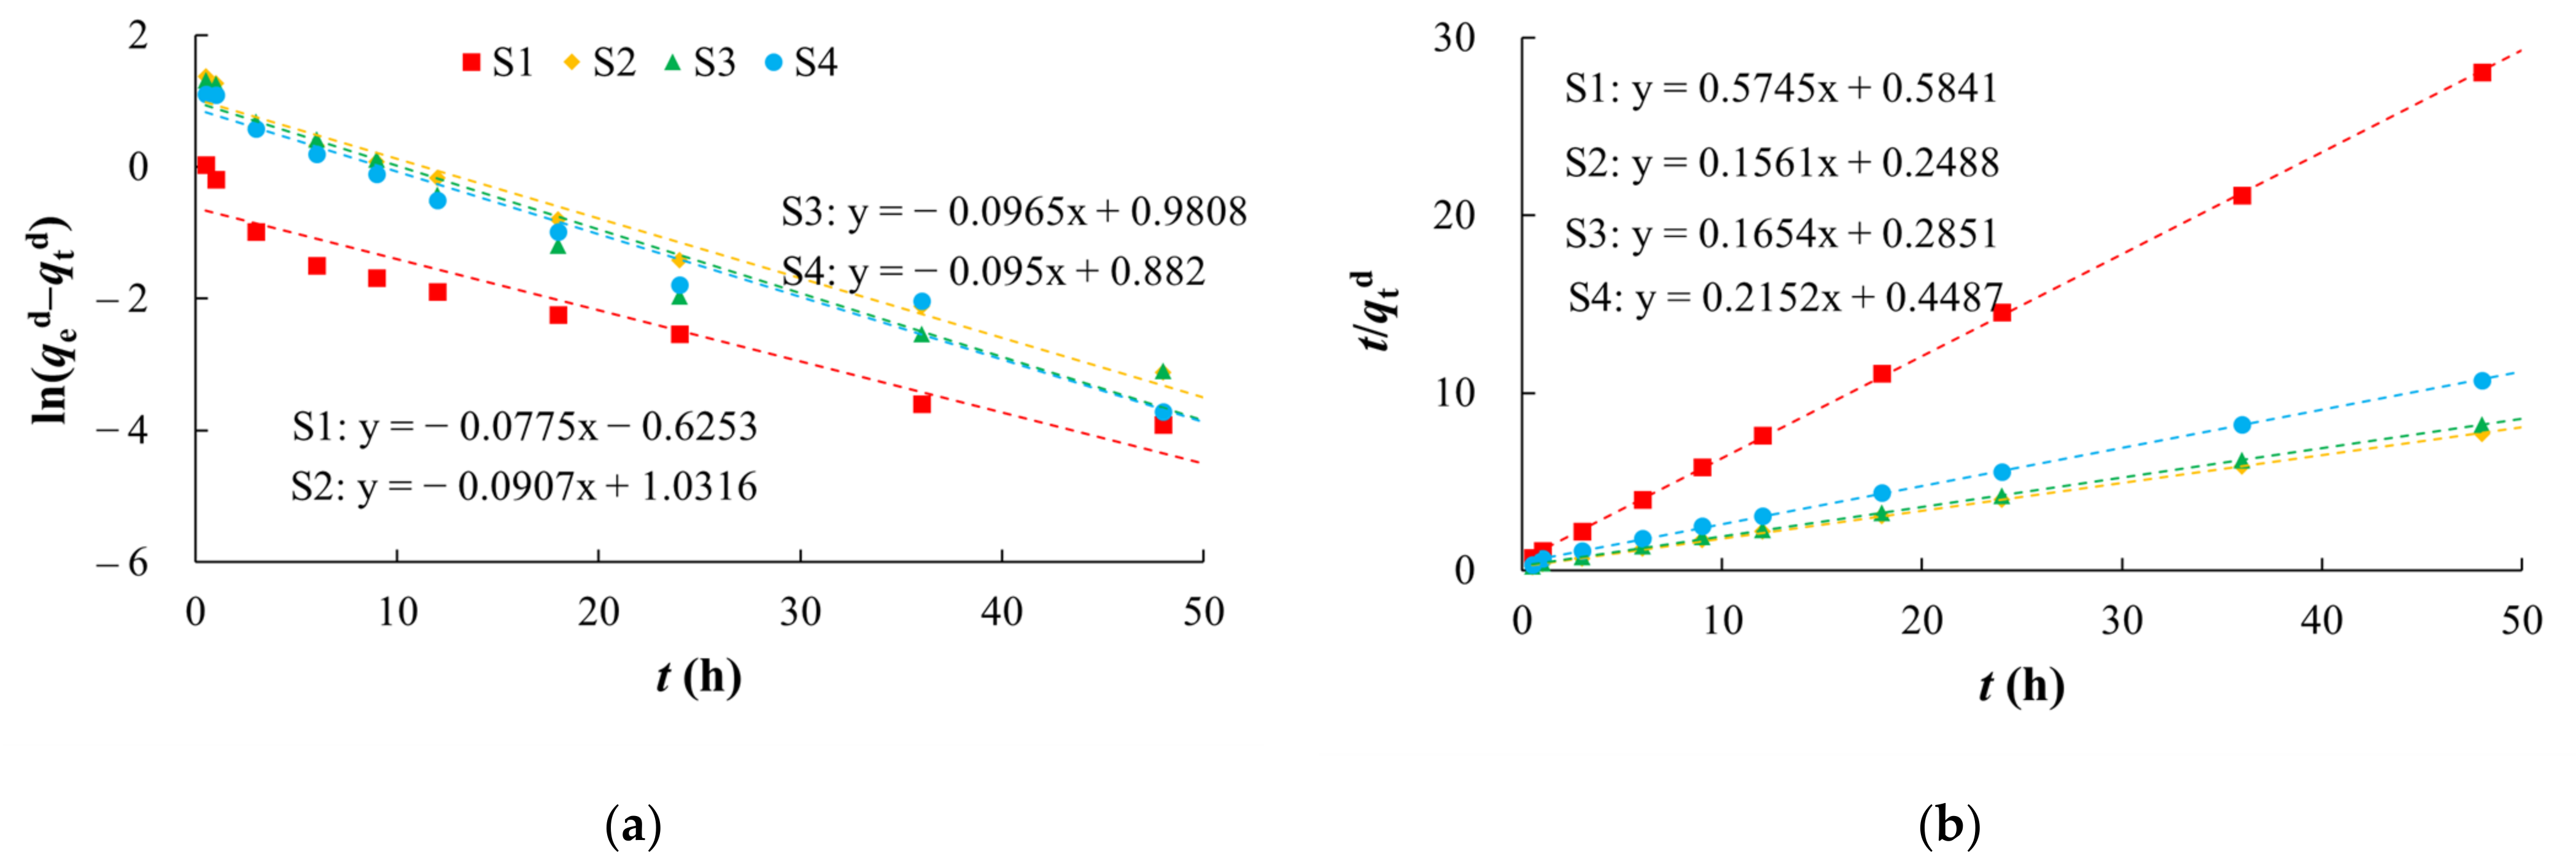
2.3.3. Desorption Kinetics Experiments

After the adsorption kinetics experiments, the supernatant was removed, and the soil samples were dried below 50 °C. They were then placed in separate 250-mL conical flasks that were sterilized under high pressure and humidity. Ultrapure water (150 mL) was added to each flask and the samples were processed as described in Section 2.3.1.

2.3.4. Desorption Thermodynamics Experiments

After the isothermal adsorption experiments, the supernatant was removed and the soil samples were dried below 50 °C. They were then placed in separate 50-mL conical flasks that were sterilized under high pressure and humidity. Ultrapure water (30 mL) was added to each flask and the samples were processed as described in Section 2.3.2.

2.3.5. Experiments to Investigate the Factors Influencing Arsenic Adsorption and Desorption

To evaluate the influence of various factors on arsenic adsorption and desorption, batch experiments were conducted under different pH, temperature, NaHCO3, and NaCl conditions.
Group One: 1.0-g samples of S1 were accurately weighed into a series of conical flasks that were sterilized under high pressure and humidity. Arsenic solution (30 mL, 1.0 mg/L) was added to each flask. The specific experimental conditions are shown in Table S1. Group Two: 1.0-g treated samples of S1, which have reached adsorption equilibrium in arsenic solution (30 mL, 1.0 mg/L), were accurately weighed into a series of conical flasks, and then ultrapure water (30 mL) was added. The specific experimental conditions are shown in Table S2.
All samples were then placed in an oscillation incubator (120 rp/min) for 72 h. The supernatant from each sample was collected after oscillation.

2.3.6. Water Sample Testing

Collected water samples were centrifuged at 4000 r/min for 10 min, and the supernatant was filtered through a 0.45-μm microporous membrane. The concentration of arsenic was measured by a mass spectrometer (7500C ICP-MS, Agilent Technologies, Santa Clara, CA, USA).

2.4. Models and Calculations

2.4.1. Adsorption Capacity and Adsorption Ratio

qta = (C0Ct)V/m,
ωta = (C0Ct)/C0,
where qta is the adsorption capacity at time t (mg/kg), C0 is the initial concentration of arsenic in solution (mg/L), Ct is the concentration of arsenic in solution at time t (mg/L), V is the volume of the solution (mL), m is the mass of the soil sample (g), ωta is the adsorption ratio at time t (%), and t is the duration time (h).

2.4.2. Kinetic Model

The Lagergren dynamics equation is commonly used to study adsorption and desorption:
Pseudo first-order kinetic model: ln(qeqt) = lnqek1t,
Pseudo second-order kinetic model: t/qt = 1/(k2qe2) + t/qe,
where k1 and k2 are the rate constant (h−1, and L·mg−1·h−1, respectively), qe is the adsorption (qea) or desorption (qed) capacity at equilibrium (mg/kg), and qt is the adsorption (qta) or desorption (qtd) capacity at time t (mg/kg).

2.4.3. Isothermal Adsorption Model

Henry model: qe = KhCe,
Freundlich model: qe = KfCe1/n,
Langmuir model: qe = CeKlqm/(1 + CeKl),
where Kh is the distribution coefficient (L/kg); Ce is the arsenic concentration in solution at equilibrium (mg/L); Kf is the adsorption coefficient (mg(1−1/n)L1/nkg−1), and the larger the value, the faster the adsorption rate; n is a constant related to adsorption capacity; Kl is the equilibrium adsorption constant (L/mg); and qm is the maximum adsorption capacity (mg/kg). The product of qm and Kl can reflect the maximum buffer capacity (MBC) of soil for arsenic.

2.4.4. Desorption Capacity and Desorption Ratio

qtd = CtV/m,
ωtd = qtd/qea,
where qtd is the arsenic desorption capacity at time t (mg/kg), ωtd is the desorption ratio at time t (%), and ωed is the desorption ratio at equilibrium (%).

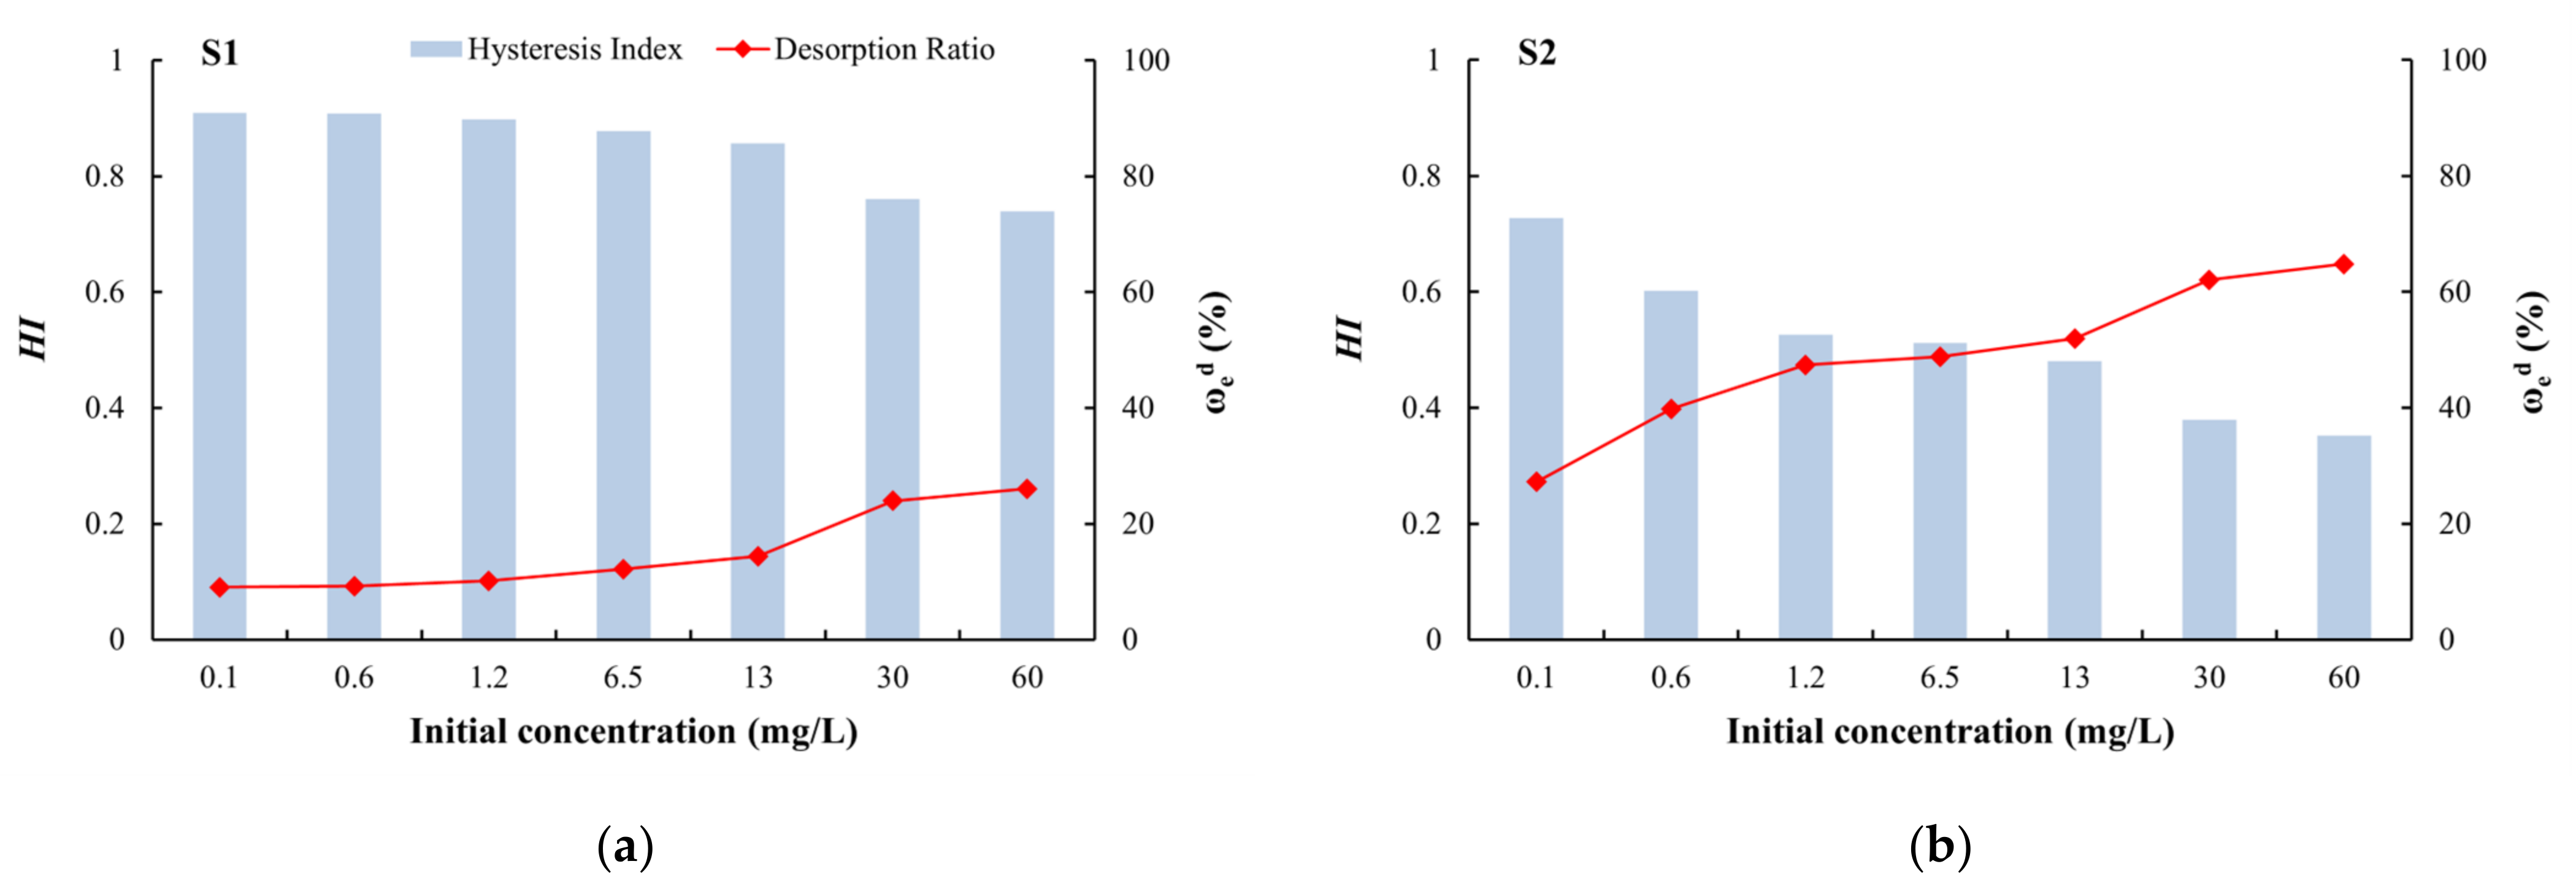
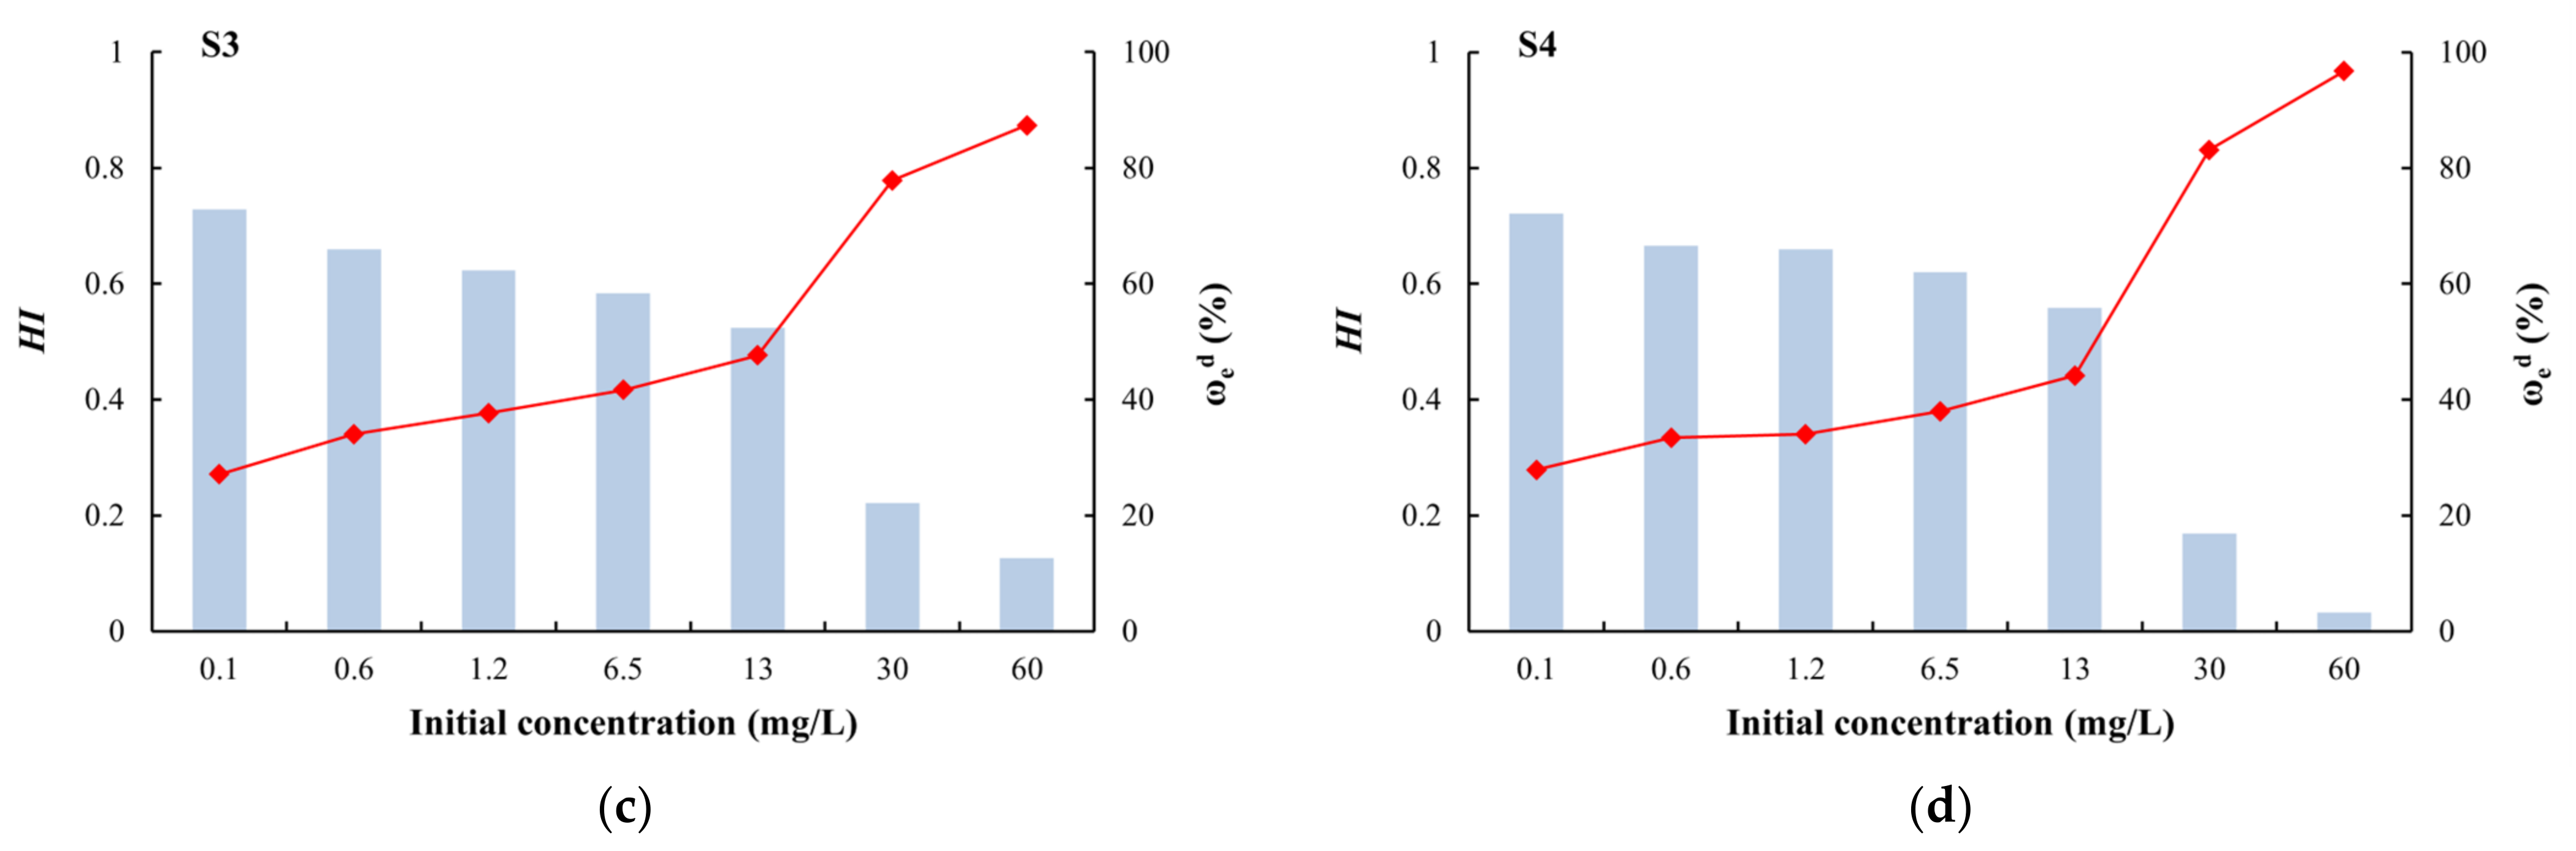
2.4.5. Hysteresis Index (HI)

The apparent adsorption–desorption hysteresis was quantified as follows [49,50]:
HI = (qeaqed)/qea.

3. Results and Discussion

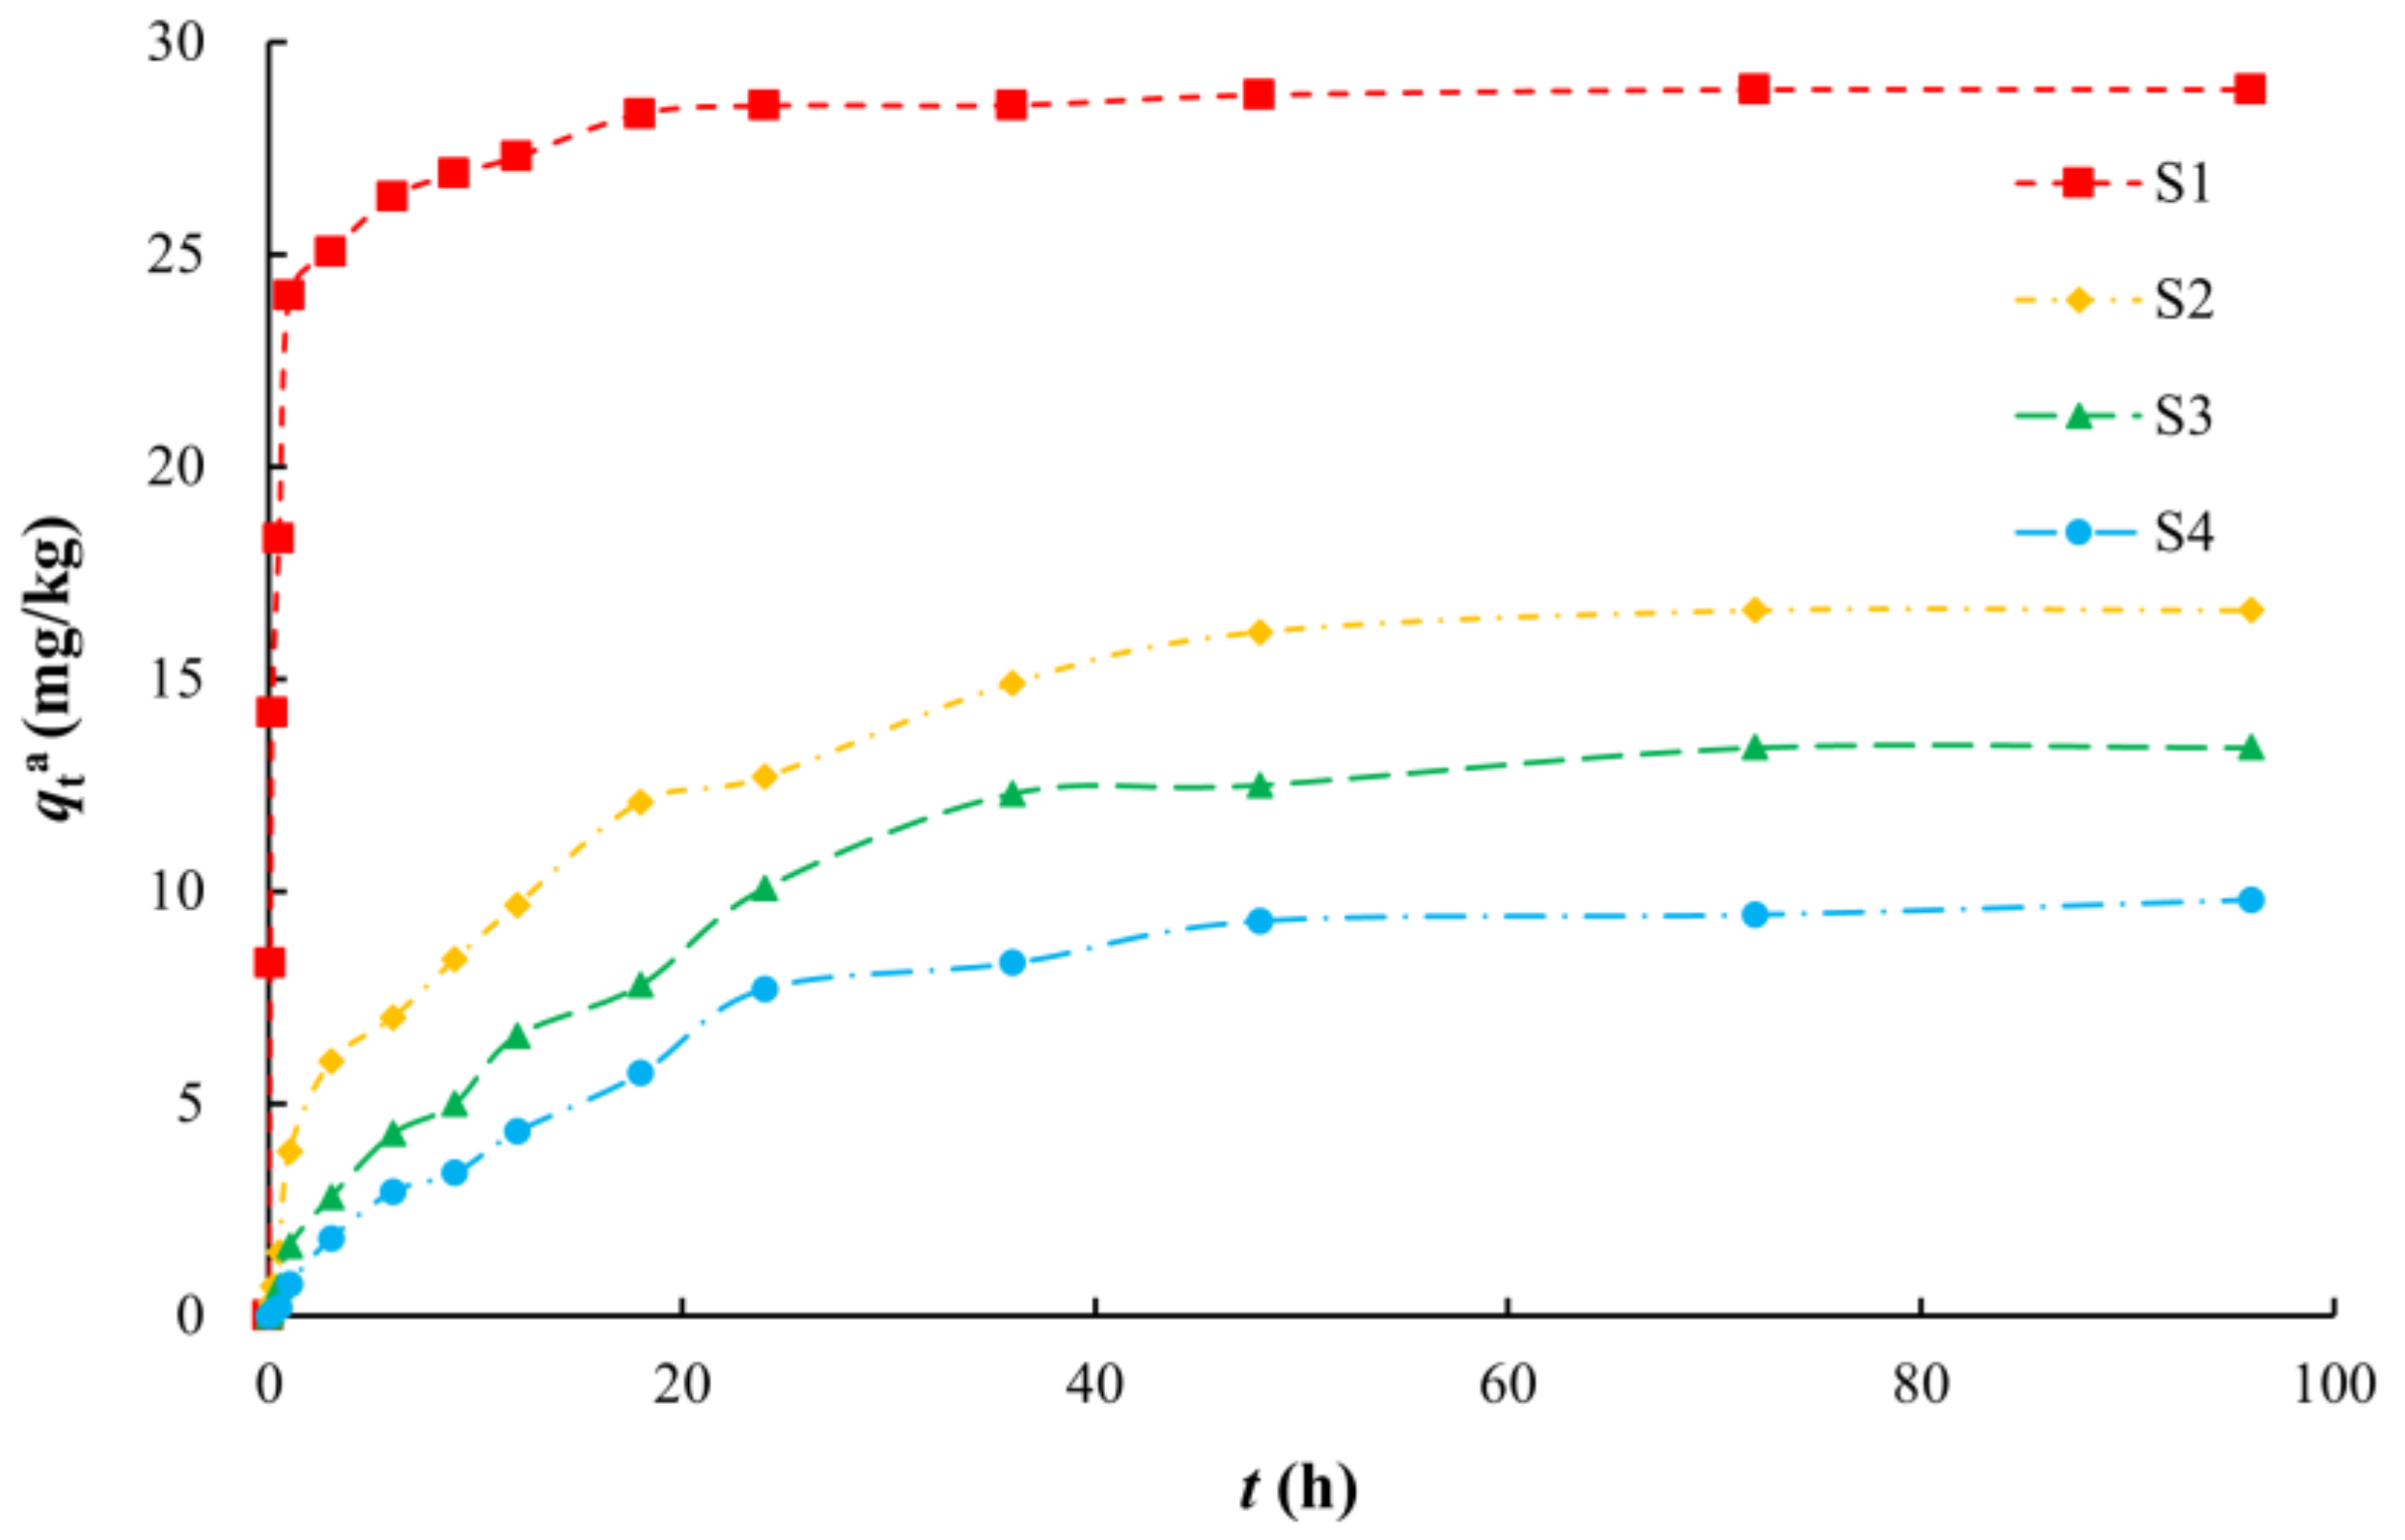
3.1. Adsorption Kinetics Characteristics

The adsorption process of arsenic on media in aqueous solution can be roughly divided into two stages (Figure 2). The first stage is a rapid adsorption stage. At this time, there are many adsorption points on the surface of the medium, and the adsorption capacity increases linearly with time. The adsorption capacity of arsenic on silty clay (S1) reached 24.01 mg/kg within 1 h, which was approximately 80% of the equilibrium adsorption capacity. The adsorption capacities of arsenic on the other media reached approximately 80% of the equilibrium adsorption capacity within 24 h. After this stage, the number of readily occupied adsorption sites on the surface of the medium decreased, and the adsorption rate then decreased and entered a slow adsorption stage. The different media reached adsorption equilibrium after 18 h (S1) or 48 h (S2–S4).
The equilibrium adsorption capacities of various aqueous media for arsenic decreased in the following order: silty clay, fine sand, medium sand, and coarse sand with gravel. Silty clay had the highest adsorption capacity for arsenic (28.87 mg/kg), and coarse sand with gravel had the lowest (9.80 mg/kg). At equilibrium, the adsorption ratios of arsenic on the different media were 94.34% (S1), 54.27% (S2), 43.73% (S3), and 32.03% (S4). Due to the adsorption capacity being positively correlated with the SSA, silty clay has the largest adsorption capacity for arsenic [51,52,53]. In addition, silty clay has the largest organic matter content among the media. Organic matter provides surface adsorption sites, and this could contribute to the strong adsorption capacity of this medium for arsenic [54,55,56,57,58].
The arsenic adsorption process on silty clay was more consistent with the pseudo second-order kinetic model (R2 of 0.9999) (Figure 3, Table 2), which indicated that the reaction was mainly controlled by outer layer adsorption [59]. Adsorption on the other media was more consistent with the pseudo first-order kinetics model (R2 of 0.9717 to 0.9803). The adsorption rate constants (k1 and k2) decreased in the order of silty clay, fine sand, medium sand, and coarse sand with gravel (Table 2). As the SSA of the medium decreased, both the adsorption capacity and adsorption rate decreased.

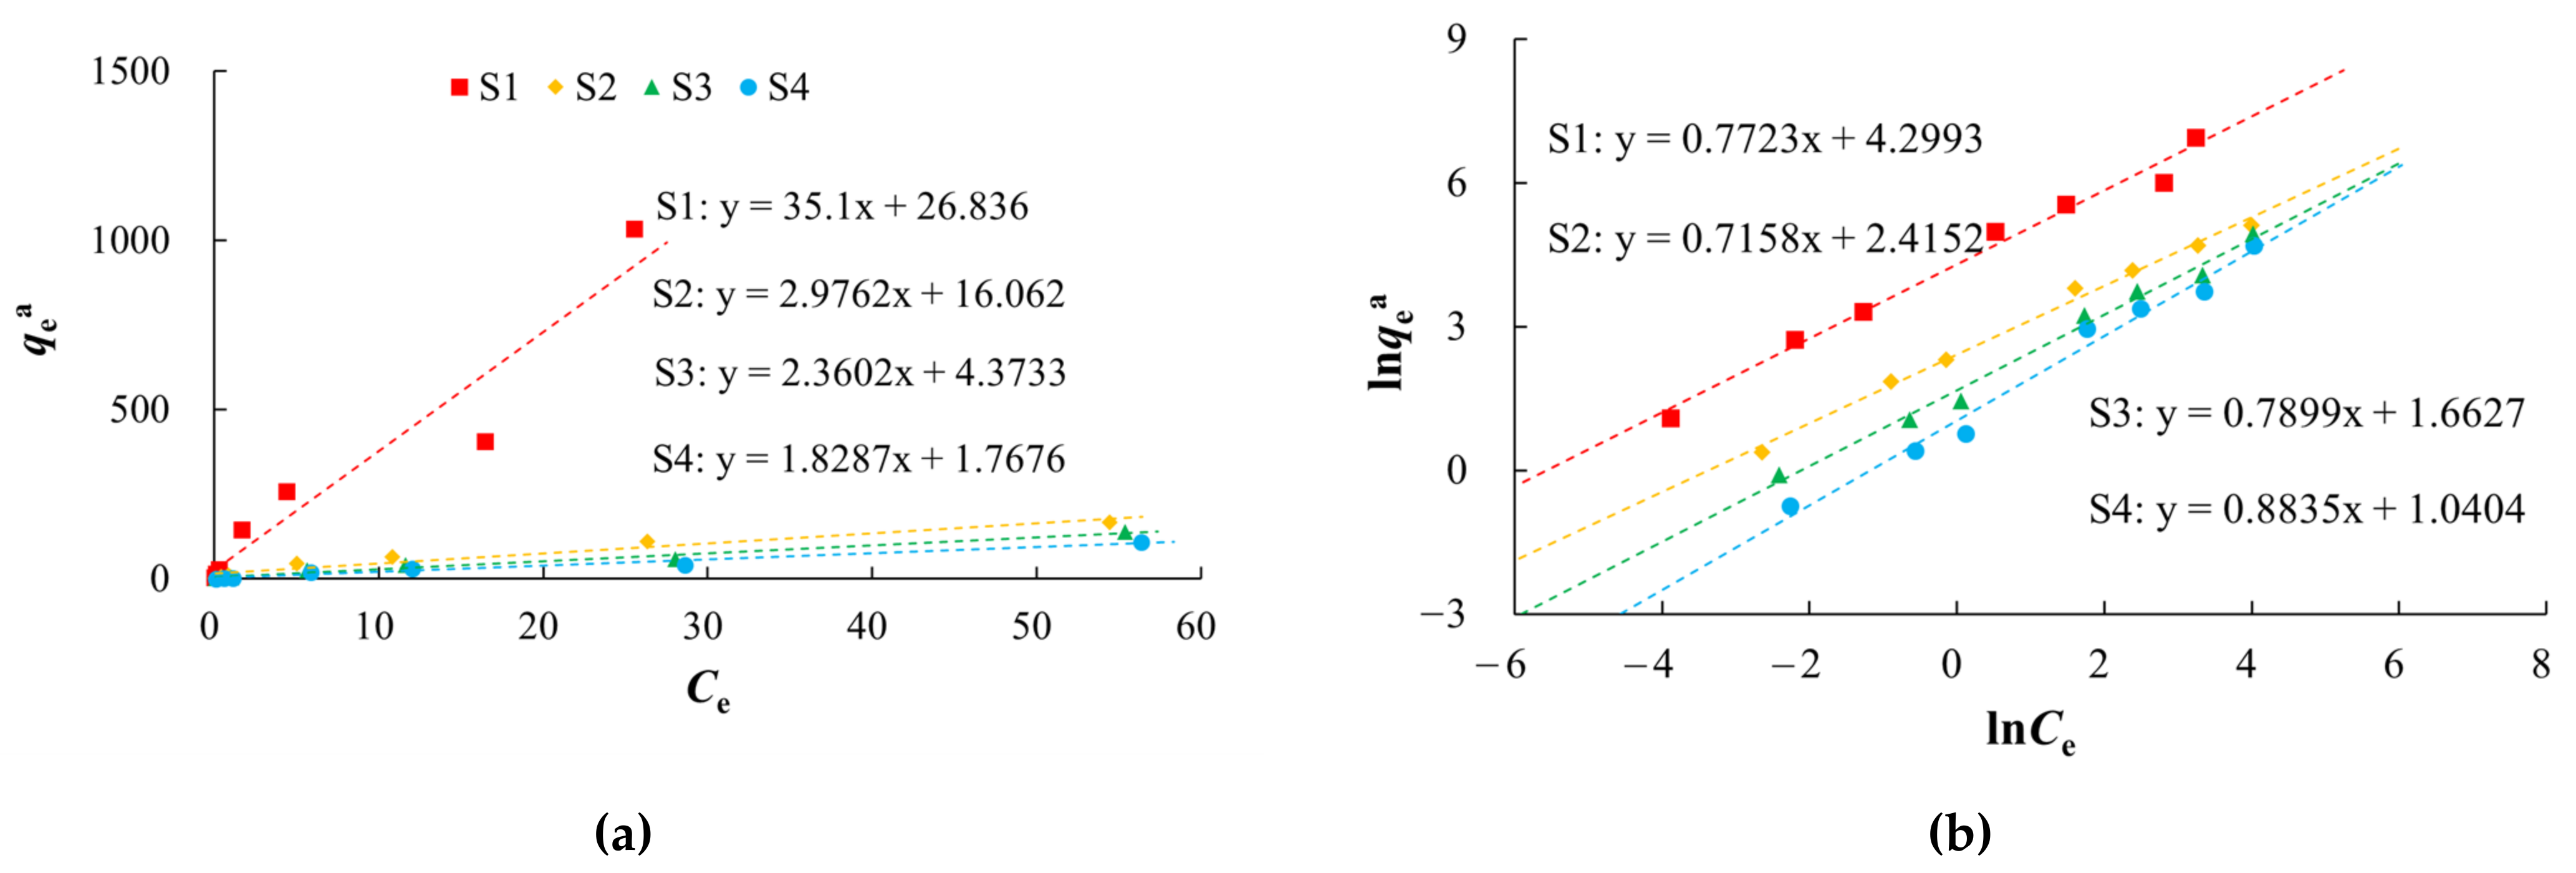
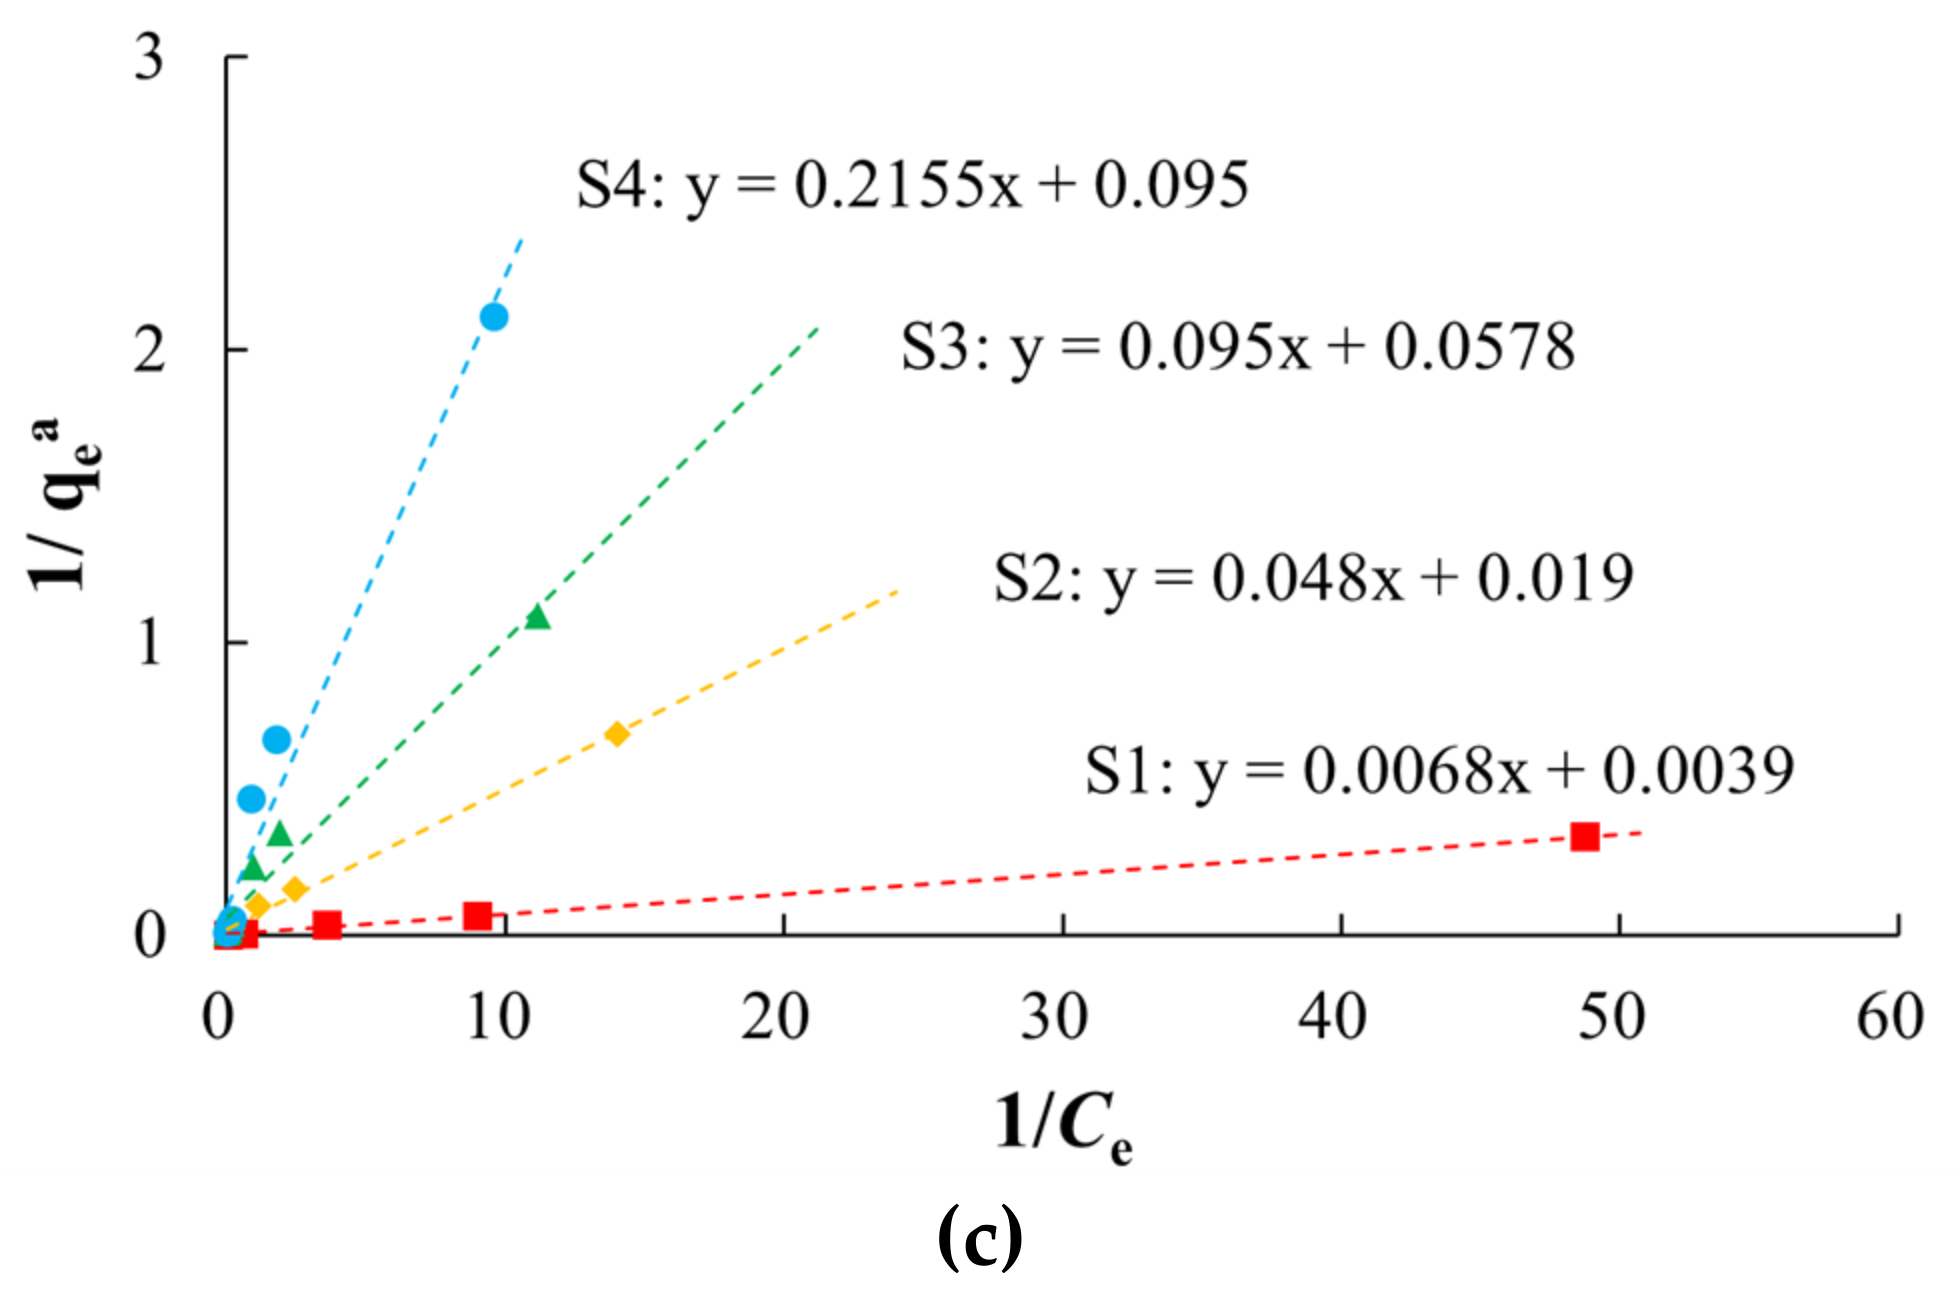
3.2. Isothermal Adsorption Characteristics

Isothermal adsorption curves were constructed using the adsorption capacity (qea) and concentration (Ce) of the medium required to reach adsorption equilibrium for arsenic. The adsorption capacity of the medium for arsenic increased gradually with increases in the arsenic equilibrium concentration (Figure 4). At the same equilibrium concentration, silty clay (S1) had the highest equilibrium adsorption capacity and coarse sand with gravel (S4) had the lowest. The equilibrium adsorption capacities decreased in the order of silty clay, fine sand, medium sand, and coarse sand with gravel. These values were positively correlated with the SSA of the medium. In the solid–liquid two-phase environment, arsenic tends to be distributed into the fine-grained silty clay.
There were non-linear relationships between equilibrium adsorption capacities of arsenic on the media and the equilibrium concentrations in the study area (Figure 5, Table 3). Langmuir and Freundlich models characterized the adsorption process with better fitting effect, which indicated that the arsenic adsorption occurred by both physical and chemical adsorption. The Langmuir model describes monolayer adsorption, in which the solute is no longer adsorbed after the surface adsorption reaches saturation, and there is a saturated adsorption capacity. The adsorption of arsenic on silty clay (S1) was more consistent with the Langmuir model (R2 of 0.9991) than the Freundlich model, which indicated that the adsorption of arsenic on silty clay occurred by monolayer adsorption. The qm of arsenic was 10.5152–256.4103 mg/kg, and this decreased with increases in the particle size, which was consistent with the adsorption kinetics results. Among these media, silty clay had the highest MBC (147.05 L/kg), indicating that it has the largest buffer capacity for arsenic.
The Freundlich model describes multi-molecular layer adsorption, that is, the solute can continue to be adsorbed after the surface adsorption is saturated, and there is no saturated adsorption capacity. In the study area, S1 had the highest Kf (73.6482), and S4 the lowest (2.8303). As the particles became coarser, the adsorption rate of arsenic gradually decreased. A value of n > 1 indicated that the arsenic adsorption was favorable, and the adsorption process was easy to carry out [60,61,62].

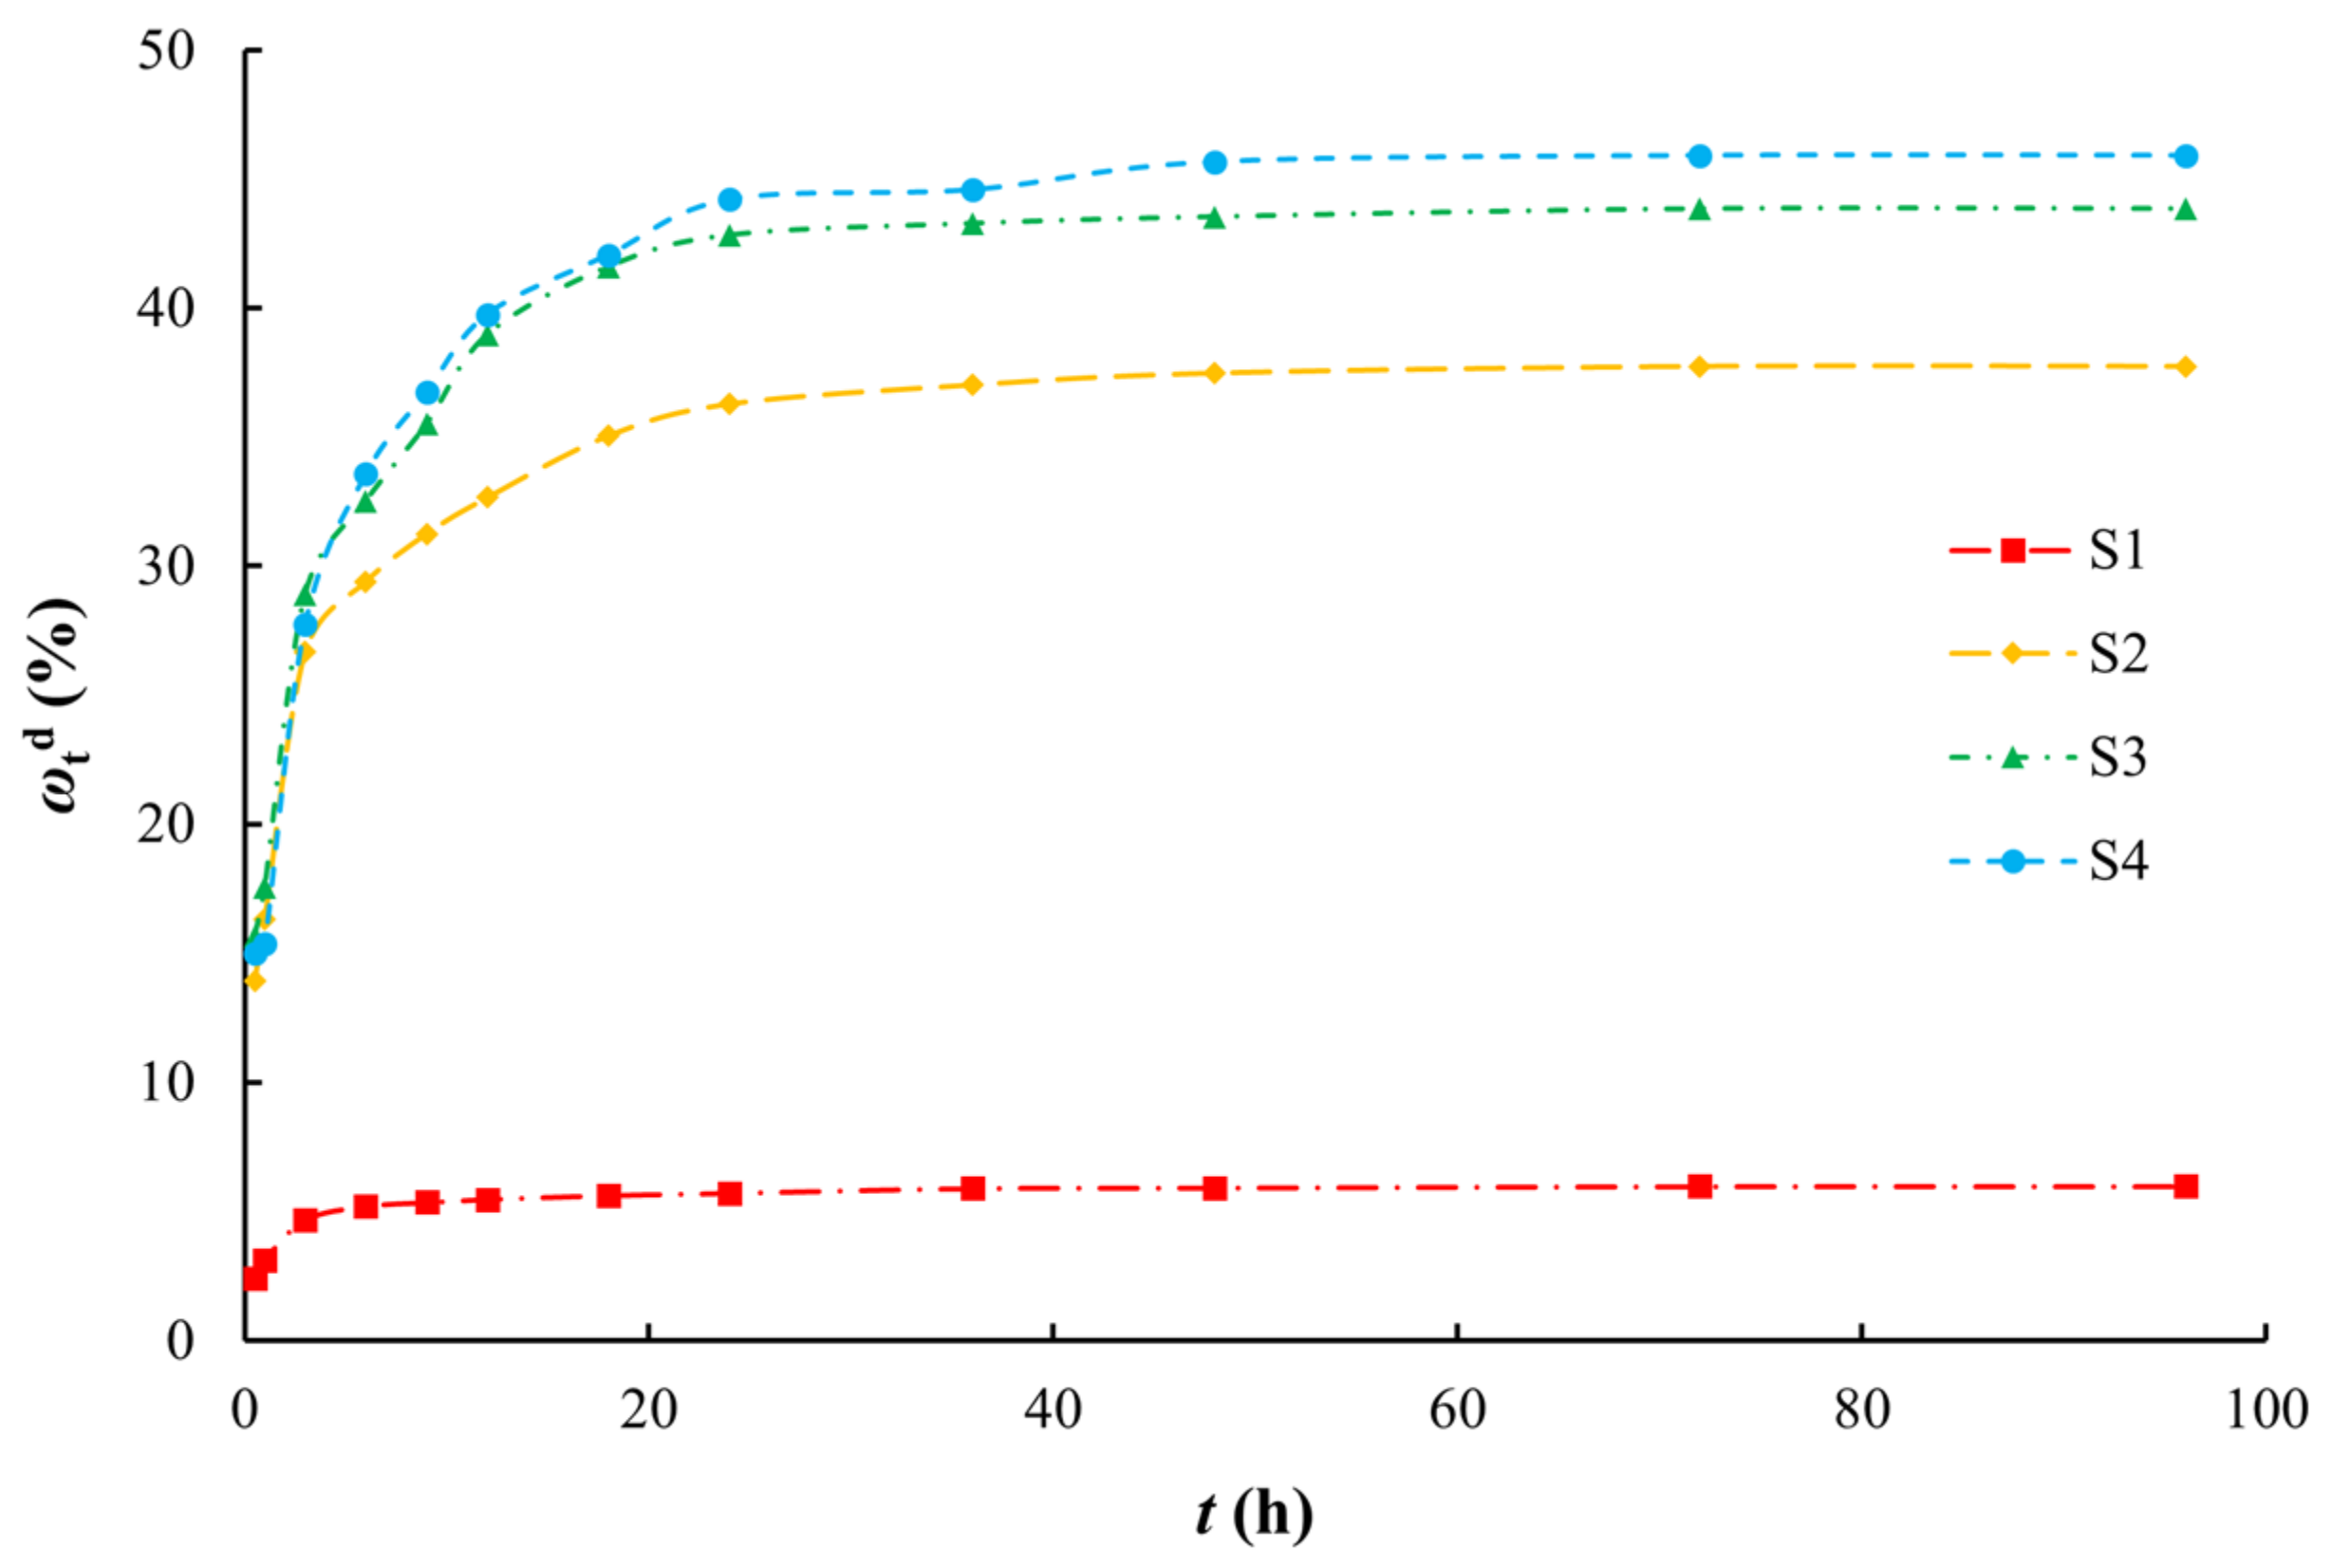
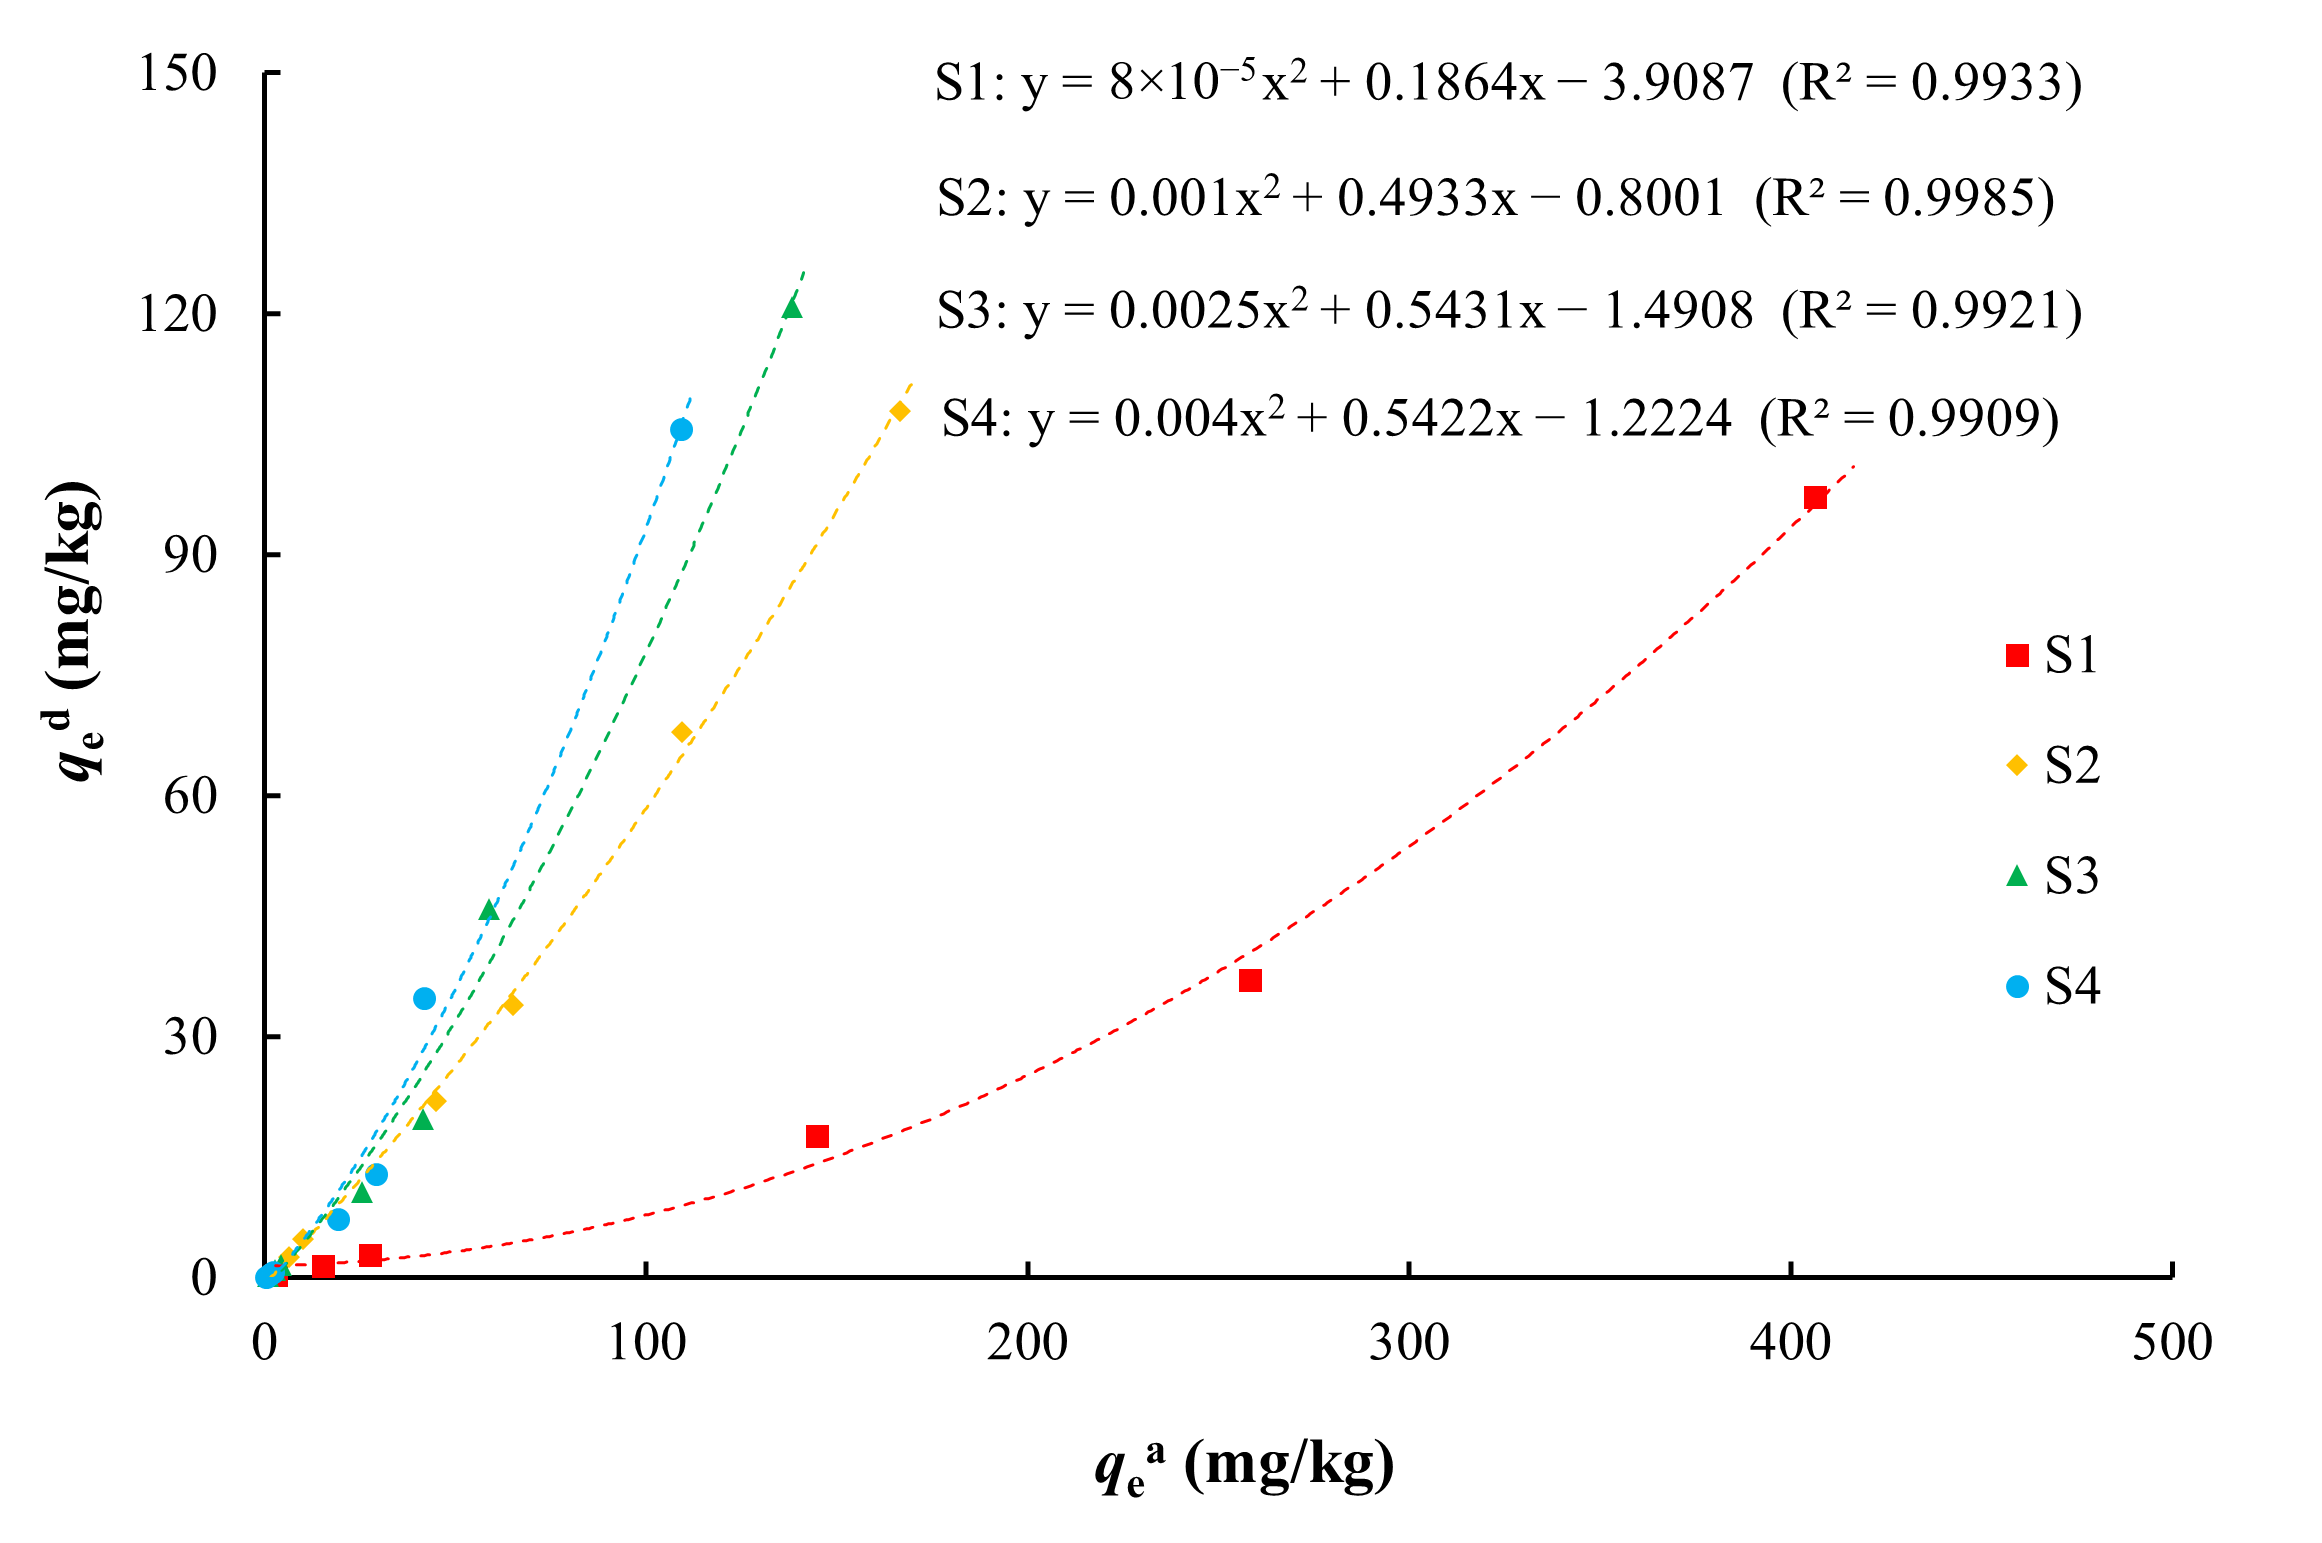
3.3. Desorption Characteristics and the Relationship with Adsorption

The desorption process of arsenic by aqueous media can be roughly divided into two stages (Figure 6). The first stage is the rapid desorption stage where desorption occurs readily after a large amount of arsenic is absorbed on the surface of the medium. At the beginning of desorption, the arsenic concentration in the medium is higher than that in the desorption solution (i.e., the concentration gradient is high), which increases the desorption rate, and the desorption capacity increases linearly with time. For silty clay (S1), the desorption capacity of arsenic reached approximately 80% of the equilibrium desorption capacity within 3 h. For the other media, the desorption capacity of arsenic reached approximately 80% of the equilibrium desorption capacity within 9 h. Over time, the arsenic adsorbed on the surface of the medium was basically removed, and further desorption was of arsenic in the pores of the medium. At this time, the desorption of arsenic gradually decreased and entered a slow desorption stage. The desorption equilibrium was reached after 9 h (S1) and 24 h (S2–S4). Compared with the adsorption process, the desorption process reached equilibrium quicker. The desorption ratios decreased in the order of coarse sand with gravel, medium sand, fine sand, and silty clay. This order is opposite to that for the SSA [63,64,65], that is, the larger the SSA, the smaller the desorption ratio.
The pseudo first-order kinetic model showed a poor fit (R2 of 0.9048–0.9738) (Figure 7, Table 4). The pseudo second-order kinetic model (R2 of 0.9992–0.9998) better represented the kinetic characteristics of arsenic desorption on the media. Although silty clay had a low desorption ratio, its desorption rate was the fastest among the media (Table 4).
After adsorption on the medium, some of the arsenic will be desorbed and re-enter the solution. The adsorption and desorption of arsenic is a reversible process, and there is an inevitable connection between them. The relationship between the adsorption and desorption of arsenic is shown in Figure 8. There was an obvious positive relationship between the adsorption and desorption capacities of various media for arsenic, with the amount of arsenic desorbed from the medium increasing as the amount of arsenic adsorbed increased. This was fitted with a quadratic power function (R2 > 0.99). For the same arsenic adsorption capacity, silty clay (S1) had the smallest arsenic desorption capacity and coarse sand with gravel (S4) had the largest desorption capacity. Among the four types of media, silty clay had the strongest adsorption capacity and the weakest desorption capacity for arsenic, and vice versa for coarse sand with gravel.
HI is a quantitative indicator of the degree of irreversible adsorption. When 0.7 < HI < 1, the desorption speed is similar to the adsorption speed, and there is no hysteresis; when HI < 0.7, the desorption speed is less than the adsorption speed, and there is positive hysteresis; and when HI > 1, there is negative hysteresis [62]. Among the four types of media, only silty clay had HI values greater than 0.7 (no hysteresis) at different initial concentrations (Figure 9). For the other media, HI values greater than 0.7 (no hysteresis) only occurred at a low initial concentrations (0.1 mg/L). At other concentrations, the HI value was less than 0.7 (positive hysteresis), indicating that the adsorption process was stronger than the desorption process [60]. Due to the complex physical and chemical adsorption of arsenic on the medium, some arsenic is irreversibly adsorbed and is not easily desorbed. Coarse sand with gravel had the minimum HI and maximum ωed (Figure 9), which indicated that this medium adsorbed the lowest amount of arsenic and this arsenic was easily exchanged. By contrast, silty clay showed strong adsorption of arsenic and it was not easy to desorb.

3.4. Factors Influencing Adsorption and Desorption

3.4.1. pH

The pH is an important factor that can affect arsenic adsorption and desorption. As the pH increased, the adsorption capacity and adsorption ratio of arsenic first increased and then decreased (Figure 10, Table S3). Desorption capacity and desorption ratio showed the opposite tendency. Generally, acidic or weakly alkaline conditions are favorable for the adsorption of arsenic, while alkaline conditions are not conducive to adsorption. This is because OH in the solution will compete with H2AsO3 for adsorption sites, which will reduce the amount of arsenic adsorbed. However, H2AsO3 is a weak acid with a very small dissociation constant, and it mainly exists in the molecular state in the medium and is not readily adsorbed. Under acidic or weakly alkaline conditions, there is less arsenic in the form of H2AsO3 and less OH, and there are enough adsorption sites on the surface of the medium so that H2AsO3 does not compete with OH for adsorption. As the pH increases, dissociation of H3AsO3 increases, and a large amount of H2AsO3 is generated, which is easily adsorbed on the surface of positively charged oxides. At this time, arsenic adsorption is dominant [66,67,68,69,70,71]. With further increases in the pH, H2AsO3 gradually increases, while OH greatly increases and competitive adsorption results in a decrease in the adsorption capacity and an increase in the desorption capacity.

3.4.2. Temperature

Within the temperature range of 5 °C–30 °C, the adsorption and desorption of arsenic gradually increased as the temperature increased (Figure 11, Table S3). The adsorption and desorption of arsenic is a thermodynamic process, and the temperature can affect the chemical reaction balance in the solution. Generally, increases in the temperature will accelerate the progress of a reaction, which will increase the adsorption and desorption of arsenic [72,73].

3.4.3. Carbonate

As the HCO3 concentrations increased, the adsorption capacity and adsorption ratio of arsenic decreased and the desorption capacity and desorption ratio increased (Figure 12, Table S3). HCO3 can compete with arsenic for effective adsorption sites on the surfaces of soil or minerals, resulting in a decrease in arsenic adsorption [74,75,76,77].

3.4.4. Ionic Strength

The effect of ionic strength on adsorption is important for evaluating whether the adsorption is obligate or non-obligate. If the amount of adsorption is either not affected by the ionic strength or increases with increases in the ionic strength, this indicates that arsenic combines with the functional groups on the mineral surface to form mononuclear or dinuclear complexes (i.e., the adsorption is mainly obligate adsorption). On the contrary, if the adsorption capacity decreases, this indicates that arsenic is electrostatically adsorbed on the diffusion layer as an opposite charge, depending on the van der Waals force, surface area, and roughness of the mineral surface. In this case, the adsorption is mainly non-obligate [78,79]. From Figure 13, we can see that as the ionic strength increased, the adsorption capacity also increased, indicating that the adsorption of arsenic on the medium was mainly obligate and an inner layer complex formed between the medium and arsenic.

4. Conclusions

The media in the study area showed a strong fixation ability for arsenic. Silty clay had the strongest adsorption capacity for arsenic because it had a high SSA and organic matter content, which provided surface adsorption sites. At the same time, it also had the highest MBC, indicating that silty clay had the largest buffer capacity for arsenic. Overall, the adsorption of arsenic on the media occurred by both physical and chemical adsorption. As the SSA of the medium decreased, both the adsorption capacity and adsorption rate decreased.
The arsenic desorption capacities for media with different lithologies increased with decreases in the SSA, and there was an obvious positive correlation between the arsenic desorption and adsorption capacities. Except for silty clay, the desorption process of arsenic from the media showed an obvious lag, which indicated that the force of the adsorption process was larger than that of desorption process.
The pH, temperature, carbonate, and ionic strength all affected the arsenic adsorption and desorption. The pH affected it by changing the competitive adsorption between OH and arsenic. As the pH increased, the adsorption capacity and adsorption ratio of arsenic first increased and then decreased. The desorption capacity and adsorption ratio showed the opposite tendency. Temperature affected the balance of chemical reactions in solution, and increases in the temperature increased the adsorption and desorption of arsenic. Carbonate could inhibit the adsorption of arsenic by competitive adsorption. The ionic strength also affects the arsenic adsorption, and the arsenic adsorption in the study area occurs mainly by obligate adsorption.

Supplementary Materials

The following supporting information can be downloaded at: https://www.mdpi.com/article/10.3390/su141710935/s1, Table S1: Summary of batch adsorption experiment conditions; Table S2: Summary of batch desorption experiment conditions; Table S3: Adsorption and desorption ratio of arsenic at equilibrium under different influencing factors.

Author Contributions

Conceptualization, X.S.; methodology, S.L.; validation, K.Y. and X.W; formal analysis, X.W.; investigation, S.L.; resources, X.S.; data curation, X.S.; writing—original draft preparation, S.L. and K.Y.; writing—review and editing, S.L.; visualization, Y.Y.; supervision, X.W.; project administration, S.L. and X.S.; funding acquisition, S.L. and X.S. All authors have read and agreed to the published version of the manuscript.

Funding

This research was funded by the National Natural Science Foundation of China, grant number 41372238 and 42107100; the Hebei Province Water Conservancy Research and Promotion Plan Project, grant number 2021-37; the Open Fund Project of the Key Laboratory of Groundwater Contamination and Remediation of Hebei Province and China Geological Survey (Innovation Center), grant number SK202103KF02; the Open Fund for the Hebei Province Collaborative Innovation Center for Sustainable Utilization of Water Resources and Optimization of Industrial Structure, grant number XTZX202114; the Scientific Research Initiation Funds for PhD Scholars of Hebei GEO University, grant number BQ2019046; and the Open Topic Project of the Hebei Key Laboratory of Geological Resources and Environment Monitoring and Protection, grant number JCYKT202003.

Institutional Review Board Statement

Not applicable.

Informed Consent Statement

Not applicable.

Data Availability Statement

Not applicable.

Conflicts of Interest

The authors declare no conflict of interest.

References

  1. Lu, S.; Li, S.; Liu, Z.; Gao, X.; Zhang, L.; Sun, C. Hydrochemical evolution of pore water in riverbed sedimentation zone during riverbank infiltration. J. Water Supply Res. Technol. 2021, 70, 696–709. [Google Scholar] [CrossRef]
  2. Hu, B.; Teng, Y.; Zhai, Y.; Zuo, R.; Li, J.; Chen, H. Riverbank filtration in China: A review and perspective. J. Hydrol. 2016, 541, 914–927. [Google Scholar] [CrossRef]
  3. Tufenkji, N.; Ryan, J.N.; Elimelech, M. The promise of bank filtration. Environ. Sci. Technol. 2002, 36, 422A–428A. [Google Scholar] [CrossRef] [PubMed]
  4. Zhu, Y.; Zhai, Y.; Teng, Y.; Wang, G.; Du, Q.; Wang, J.; Yang, G. Water supply safety of riverbank filtration wells under the impact of surface water-groundwater interaction: Evidence from long-term field pumping tests. Sci. Total Environ. 2020, 711, 135141. [Google Scholar] [CrossRef]
  5. Zhang, Q.; Liu, H.; Zhu, P.; Xu, W.; Su, X. Evaluation of the influence of river bank infiltration on groundwater in an inland alluvial fan using spectral analysis and environmental tracers. Hydrogeol. J. 2021, 29, 1117–1128. [Google Scholar] [CrossRef]
  6. Polomčić, D.; Hajdin, B.; Stevanović, Z.; Bajić, D.; Hajdin, K. Groundwater management by riverbank filtration and an infiltration channel: The case of Obrenovac, Serbia. Hydrogeol. J. 2013, 21, 1519–1530. [Google Scholar] [CrossRef]
  7. Sophocleous, M. Interactions between groundwater and surface water: The state of the science. Hydrogeol. J. 2002, 10, 52–67. [Google Scholar] [CrossRef]
  8. Harvey, J.W.; Fuller, C.C. Effect of enhanced manganese oxidation in the hyporheic zone on basin-scale geochemical mass balance. Water Resour. Res. 1998, 34, 623–636. [Google Scholar] [CrossRef]
  9. Zhu, Y.; Zhai, Y.; Du, Q.; Teng, Y.; Wang, J.; Yang, G.; Jinsheng, W. The impact of well drawdowns on the mixing process of river water and groundwater and water quality in a riverside well field, Northeast China. Hydrol. Process. 2019, 33, 945–961. [Google Scholar] [CrossRef]
  10. Su, X.; Lu, S.; Yuan, W.; Woo, N.C.; Dai, Z.; Dong, W.; Du, S.; Zhang, X. Redox zonation for different groundwater flow paths during bank filtration: A case study at Liao River, Shenyang, northeastern China. Hydrogeol. J. 2018, 26, 1573–1589. [Google Scholar] [CrossRef]
  11. Smith, A.H.; Lopipero, P.A.; Bates, M.N.; Steinmaus, C.M. Arsenic epidemiology and drinking water standards. Science 2002, 296, 2145–2146. [Google Scholar] [CrossRef]
  12. He, X.; Li, P.; Wu, J.; Wei, M.; Ren, X.; Wang, D. Poor groundwater quality and high potential health risks in the Datong Basin, northern China: Research from published data. Environ. Geochem. Health 2021, 43, 791–812. [Google Scholar] [CrossRef]
  13. Kumarathilaka, P.; Seneweera, S.; Meharg, A.; Bundschuh, J. Arsenic speciation dynamics in paddy rice soil-water environment: Sources, physico-chemical, and biological factors—A review. Water Res. 2018, 140, 403–414. [Google Scholar] [CrossRef]
  14. Abdul, K.S.M.; Jayasinghe, S.S.; Chandana, E.P.S.; Jayasumana, C.; De Silva, P.M.C.S. Arsenic and human health effects: A review. Environ. Toxicol. Pharmacol. 2015, 40, 828–846. [Google Scholar] [CrossRef]
  15. He, X.; Li, P.; Ji, Y.; Wang, Y.; Su, Z.; Elumalai, V. Groundwater Arsenic and Fluoride and Associated Arsenicosis and Fluorosis in China: Occurrence, Distribution and Management. Expo. Health 2020, 12, 355–368. [Google Scholar] [CrossRef]
  16. Cullen, W.R.; Reimer, K.J. Arsenic speciation in the environment. Chem. Rev. 1989, 89, 713–764. [Google Scholar] [CrossRef]
  17. Edmunds, W.M.; Ahmed, K.M.; Whitehead, P.G. A review of arsenic and its impacts in groundwater of the Ganges–Brahmaputra—Meghna delta, Bangladesh. Environ. Sci. Process. Impacts 2015, 17, 1032–1046. [Google Scholar] [CrossRef]
  18. Ali, W.; Rasool, A.; Junaid, M.; Zhang, H. A comprehensive review on current status, mechanism, and possible sources of arsenic contamination in groundwater: A global perspective with prominence of Pakistan scenario. Environ. Geochem. Health 2019, 41, 737–760. [Google Scholar] [CrossRef]
  19. Podgorski, J.; Berg, M. Global threat of arsenic in groundwater. Science 2020, 368, 845–850. [Google Scholar] [CrossRef]
  20. Wallis, I.; Prommer, H.; Berg, M.; Siade, A.J.; Sun, J.; Kipfer, R. The river—Groundwater interface as a hotspot for arsenic release. Nat. Geosci. 2020, 13, 288–295. [Google Scholar] [CrossRef]
  21. Shakoor, M.B.; Niazi, N.K.; Bibi, I.; Rahman, M.M.; Naidu, R.; Dong, Z.; Shahid, M.; Arshad, M. Unraveling Health Risk and Speciation of Arsenic from Groundwater in Rural Areas of Punjab, Pakistan. Int. J. Environ. Res. Public Health 2015, 12, 12371–12390. [Google Scholar] [CrossRef] [PubMed]
  22. Jadhav, S.V.; Bringas, E.; Yadav, G.D.; Rathod, V.K.; Ortiz, I.; Marathe, K.V. Arsenic and fluoride contaminated groundwaters: A review of current technologies for contaminants removal. J. Environ. Manag. 2015, 162, 306–325. [Google Scholar] [CrossRef] [PubMed]
  23. Tolkou, A.K.; Kyzas, G.Z.; Katsoyiannis, I.A. Arsenic(III) and Arsenic(V) Removal from Water Sources by Molecularly Imprinted Polymers (MIPs): A Mini Review of Recent Developments. Sustainability 2022, 14, 5222. [Google Scholar] [CrossRef]
  24. Fendorf, S.; Michael, H.A.; van Geen, A. Spatial and temporal variations of groundwater arsenic in South and Southeast Asia. Science 2010, 328, 1123–1127. [Google Scholar] [CrossRef]
  25. Wang, Y.; Li, P.; Guo, Q.; Jiang, Z.; Liu, M. Environmental biogeochemistry of high arsenic geothermal fluids. Appl. Geochem. 2018, 97, 81–92. [Google Scholar] [CrossRef]
  26. Lu, S.; Yang, Y.; Yin, H.; Su, X.; Yu, K.; Sun, C. Microbial Community Structure of Arsenic-Bearing Groundwater Environment in the Riverbank Filtration Zone. Water 2022, 14, 1548. [Google Scholar] [CrossRef]
  27. Smedley, P.L.; Kinniburgh, D.G. A review of the source, behaviour and distribution of arsenic in natural waters. Appl. Geochem. 2002, 17, 517–568. [Google Scholar] [CrossRef]
  28. Guo, H.; Wen, D.; Liu, Z.; Jia, Y.; Guo, Q. A review of high arsenic groundwater in Mainland and Taiwan, China: Distribution, characteristics and geochemical processes. Appl. Geochem. 2014, 41, 196–217. [Google Scholar] [CrossRef]
  29. Guo, H.; Ren, Y.; Liu, Q.; Zhao, K.; Li, Y. Enhancement of arsenic adsorption during mineral transformation from siderite to goethite: Mechanism and application. Environ. Sci. Technol. 2013, 47, 1009–1016. [Google Scholar] [CrossRef]
  30. Goldberg, S. Competitive Adsorption of Arsenate and Arsenite on Oxides and Clay Minerals. Soil Sci. Soc. Am. J. 2002, 66, 413–421. [Google Scholar] [CrossRef] [Green Version]
  31. Amirbahman, A.; Kent, D.B.; Curtis, G.P.; Davis, J.A. Kinetics of sorption and abiotic oxidation of arsenic(III) by aquifer materials. Geochim. Cosmochim. Acta 2006, 70, 533–547. [Google Scholar] [CrossRef]
  32. Cornu, S.; Breeze, D.; Saada, A.; Baranger, P. The Influence of pH, Electrolyte Type, and Surface Coating on Arsenic(V) Adsorption onto Kaolinites. Soil Sci. Soc. Am. J. 2003, 67, 1127–1132. [Google Scholar] [CrossRef]
  33. Sharma, P.; Ofner, J.; Kappler, A. Formation of binary and ternary colloids and dissolved complexes of organic matter, Fe and As. Environ. Sci. Technol. 2010, 44, 4479–4485. [Google Scholar] [CrossRef]
  34. Dixit, S.; Hering, J.G. Comparison of arsenic(V) and arsenic(III) sorption onto iron oxide minerals: Implications for arsenic mobility. Environ. Sci. Technol. 2003, 37, 4182–4189. [Google Scholar] [CrossRef]
  35. Boyle, D.R.; Turner, R.; Hall, G. Anomalous arsenic concentrations in groundwaters of an island community, Bowen Island, British Columbia. Environ. Geochem. Health 1998, 20, 199–212. [Google Scholar] [CrossRef]
  36. Zhao, Z.; Wang, S.; Jia, Y. Effect of sulfide on As(III) and As(V) sequestration by ferrihydrite. Chemosphere 2017, 185, 321–328. [Google Scholar] [CrossRef]
  37. Xia, X.; Teng, Y.; Zhai, Y. Biogeochemistry of Iron Enrichment in Groundwater: An Indicator of Environmental Pollution and Its Management. Sustainability 2022, 14, 7059. [Google Scholar] [CrossRef]
  38. Radu, T.; Subacz, J.L.; Phillippi, J.M.; Barnett, M.O. Effects of dissolved carbonate on arsenic adsorption and mobility. Environ. Sci. Technol. 2005, 39, 7875–7882. [Google Scholar] [CrossRef]
  39. Charlet, L.; Chakraborty, S.; Appelo, C.; Roman-Ross, G.; Nath, B.; Ansari, A.; Lanson, M.; Chatterjee, D.; Mallik, S.B. Chemodynamics of an arsenic ‘‘hotspot’’ in a West Bengal aquifer: A field and reactive transport modeling study. Appl. Geochem. 2007, 22, 1273–1292. [Google Scholar] [CrossRef]
  40. Guo, H.; Li, Y.; Zhao, K.; Ren, Y.; Wei, C. Removal of arsenite from water by synthetic siderite: Behaviors and mechanisms. J. Hazard. Mater. 2011, 186, 1847–1854. [Google Scholar] [CrossRef]
  41. McArthur, J.; Banerjee, D.; Hudson-Edwards, K.; Mishra, R.; Purohit, R.; Ravenscroft, P.; Cronin, A.; Howarth, R.; Chatterjee, A.; Talukder, T.; et al. Natural organic matter in sedimentary basins and its relation to arsenic in anoxic ground water: The example of West Bengal and its worldwide implications. Appl. Geochem. 2004, 19, 1255–1293. [Google Scholar] [CrossRef]
  42. Qiao, W.; Guo, H.; He, C.; Shi, Q.; Xiu, W.; Zhao, B. Molecular Evidence of Arsenic Mobility Linked to Biodegradable Organic Matter. Environ. Sci. Technol. 2020, 54, 7280–7290. [Google Scholar] [CrossRef] [PubMed]
  43. Kalbitz, K.; Wennrich, R. Mobilization of heavy metals and arsenic in polluted wetland soils and its dependence on dissolved organic matter. Sci. Total Environ. 1998, 209, 27–39. [Google Scholar] [CrossRef]
  44. Lu, S.; Su, X.; Feng, X.; Sun, C. Sources and influencing factors of arsenic in nearshore zone during river water infiltration. Earth Sci. Front. 2022, 29, 455–467. [Google Scholar] [CrossRef]
  45. Yuan, W. Biogeochemical Process of Fe and Mn during River Bank Infiltration Affected by Groundwater Exploiting. Ph.D. Thesis, Jilin University, Changchun, China, 2017. [Google Scholar]
  46. Lu, S.; Feng, X.; Su, X. Geochemical characteristics of arsenic in groundwater during riverbank filtration: A case study of Liao River, Northeast China. Water Supply 2020, 20, 3288–3300. [Google Scholar] [CrossRef]
  47. Lu, S. Biogeochemical Process of Arsenic in Groundwater and Its Simulation Affected by Groundwater Exploitation in Riverside. Ph.D. Thesis, Jilin University, Changchun, China, 2018. [Google Scholar]
  48. Su, X.; Lu, S.; Gao, R.; Su, D.; Yuan, W.; Dai, Z.; Papavasilopoulos, E.N. Groundwater flow path determination during riverbank filtration affected by groundwater exploitation: A case study of Liao River, Northeast China. Hydrol. Sci. J. 2017, 62, 2331–2347. [Google Scholar] [CrossRef]
  49. Huang, W.; Weber, W.J. A Distributed Reactivity Model for Sorption by Soils and Sediments. 10. Relationships between Desorption, Hysteresis, and the Chemical Characteristics of Organic Domains. Environ. Sci. Technol. 1997, 31, 2562–2569. [Google Scholar] [CrossRef]
  50. Huang, W.; Weber, W.J. A Distributed Reactivity Model for Sorption by Soils and Sediments. 11. Slow Concentration-Dependent Sorption Rates. Environ. Sci. Technol. 1998, 32, 3549–3555. [Google Scholar] [CrossRef]
  51. Chandra, V.; Park, J.; Chun, Y.; Lee, J.W.; Hwang, I.-C.; Kim, K.S. Water-dispersible magnetite-reduced graphene oxide composites for arsenic removal. ACS Nano 2010, 4, 3979–3986. [Google Scholar] [CrossRef]
  52. Wang, C.; Luo, H.; Zhang, Z.; Wu, Y.; Zhang, J.; Chen, S. Removal of As(III) and As(V) from aqueous solutions using nanoscale zero valent iron-reduced graphite oxide modified composites. J. Hazard. Mater. 2014, 268, 124–131. [Google Scholar] [CrossRef]
  53. Lombi, E.; Sletten, R.S.; Wenzel, W.W. Sequentially Extracted Arsenic from Different Size Fractions of Contaminated Soils. Water Air Soil Poll. 2000, 124, 319–332. [Google Scholar] [CrossRef]
  54. Kunhikrishnan, A.; Bolan, N.S.; Müller, K.; Laurenson, S.; Naidu, R.; Kim, W.-I. The Influence of Wastewater Irrigation on the Transformation and Bioavailability of Heavy Metal(Loid)s in Soil. Adv. Agron. 2012, 115, 215–297. [Google Scholar] [CrossRef]
  55. Qishlaqi, A.; Moore, F. Statistical Analysis of Accumulation and Sources of Heavy Metals Occurrence in Agricultural Soils of Khoshk River Banks, Shiraz, Iran. J. Agric. Environ. Sci. 2007, 2, 565–573. [Google Scholar]
  56. Anawar, H.M.; Akai, J.; Komaki, K.; Terao, H.; Yoshioka, T.; Ishizuka, T.; Safiullah, S.; Kato, K. Geochemical occurrence of arsenic in groundwater of Bangladesh: Sources and mobilization processes. J. Geochem. Explor. 2003, 77, 109–131. [Google Scholar] [CrossRef]
  57. Fakour, H.; Lin, T.-F. Experimental determination and modeling of arsenic complexation with humic and fulvic acids. J. Hazard. Mater. 2014, 279, 569–578. [Google Scholar] [CrossRef]
  58. Lund, U.; Fobian, A. Pollution of two soils by arsenic, chromium and copper, Denmark. Geoderma 1991, 49, 83–103. [Google Scholar] [CrossRef]
  59. Pignatello, J.J.; Xing, B. Mechanisms of slow sorption of organic chemicals to natural particles. Environ. Sci. Technol. 1995, 30, 1–11. [Google Scholar] [CrossRef]
  60. Sukul, P.; Lamshöft, M.; Zühlke, S.; Spiteller, M. Sorption and desorption of sulfadiazine in soil and soil-manure systems. Chemosphere 2008, 73, 1344–1350. [Google Scholar] [CrossRef]
  61. Weber, W.J.; McGinley, P.M.; Katz, L.E. A distributed reactivity model for sorption by soils and sediments. 1. Conceptual basis and equilibrium assessments. Environ. Sci. Technol. 1992, 26, 1955–1962. [Google Scholar] [CrossRef]
  62. Barriuso, E.; Laird, D.A.; Koskinen, W.C.; Dowdy, R.H. Atrazine desorption from smectites. Soil Sci. Soc. Am. J. 1994, 58, 1632–1638. [Google Scholar] [CrossRef]
  63. Fuller, C.C.; Davis, J.A.; Waychunas, G.A. Surface chemistry of ferrihydrite: Part 2. Kinetics of arsenate adsorption and coprecipitation. Geochim. Cosmochim. Acta 1993, 57, 2271–2282. [Google Scholar] [CrossRef]
  64. Grossl, P.R.; Eick, M.; Sparks, D.L.; Goldberg, S.; Ainsworth, C.C. Arsenate and chromate retention mechanisms on goethite. 2. Kinetic evaluation using a pressure-jump relaxation technique. Environ. Sci. Technol. 1997, 31, 321–326. [Google Scholar] [CrossRef]
  65. Lin, Z.; Puls, R.W. Adsorption, desorption and oxidation of arsenic affected by clay minerals and aging process. Environ. Geol. 2000, 39, 753–759. [Google Scholar] [CrossRef]
  66. Gao, Y.; Mucci, A. Acid base reactions, phosphate and arsenate complexation, and their competitive adsorption at the surface of goethite in 0.7 M NaCl solution. Geochim. Cosmochim. Acta 2001, 65, 2361–2378. [Google Scholar] [CrossRef]
  67. Goldberg, S.; Johnston, C.T. Mechanisms of Arsenic Adsorption on Amorphous Oxides Evaluated Using Macroscopic Measurements, Vibrational Spectroscopy, and Surface Complexation Modeling. J. Colloid Interface Sci. 2001, 234, 204–216. [Google Scholar] [CrossRef]
  68. Jia, Y.; Xu, L.; Wang, X.; Demopoulos, G.P. Infrared spectroscopic and X-ray diffraction characterization of the nature of adsorbed arsenate on ferrihydrite. Geochim. Cosmochim. Acta 2007, 71, 1643–1654. [Google Scholar] [CrossRef]
  69. Ioannou, A.; Dimirkou, A. Phosphate Adsorption on Hematite, Kaolinite, and Kaolinite-Hematite (k-h) Systems As Described by a Constant Capacitance Model. J. Colloid Interface Sci. 1997, 192, 119–128. [Google Scholar] [CrossRef] [PubMed]
  70. Jain, A.; Raven, K.P.; Loeppert, R.H. Arsenite and arsenate adsorption on ferrihydrite: Surface charge reduction and net OH- release stoichiometry. Environ. Sci. Technol. 1999, 33, 1179–1184. [Google Scholar] [CrossRef]
  71. Quaghebeur, M.; Rate, A.; Rengel, Z.; Hinz, C. Desorption kinetics of arsenate from kaolinite as influenced by pH. J. Environ. Qual. 2005, 34, 479–486. [Google Scholar] [CrossRef]
  72. Rodda, D.P.; Johnson, B.B.; Wells, J.D. Modeling the Effect of Temperature on Adsorption of Lead(II) and Zinc(II) onto Goethite at Constant pH. J. Colloid Interface Sci. 1996, 184, 365–377. [Google Scholar] [CrossRef]
  73. Álvarez-Benedí, J.; Bolado, S.; Cancillo, I.; Calvo, C.; García-Sinovas, D. Adsorption–Desorption of Arsenate in Three Spanish Soils. Vadose Zone J. 2005, 4, 282–290. [Google Scholar] [CrossRef]
  74. Kim, M.-J.; Nriagu, J.; Haack, S. Carbonate Ions and Arsenic Dissolution by Groundwater. Environ. Sci. Technol. 2000, 34, 3094–3100. [Google Scholar] [CrossRef]
  75. Appelo, C.A.J.; Van Der Weiden, M.J.J.; Tournassat, C.; Charlet, L. Surface Complexation of Ferrous Iron and Carbonate on Ferrihydrite and the Mobilization of Arsenic. Environ. Sci. Technol. 2002, 36, 3096–3103. [Google Scholar] [CrossRef]
  76. Liu, F.; De Cristofaro, A.; Violante, A. Effect of pH, phosphate and oxalate on the adsorption/desorption of arsenate on/from goethite. Soil Sci. 2001, 166, 197–208. [Google Scholar] [CrossRef]
  77. Peryea, F.J. Phosphate Starter Fertilizer Temporarily Enhances Soil Arsenic Uptake by Apple Trees Grown under Field Conditions. HortScience 1998, 33, 826–829. [Google Scholar] [CrossRef]
  78. McBride, M.B. A critique of diffuse double layer models applied to colloid and surface chemistry. Clays Clay Miner. 1997, 45, 598–608. [Google Scholar] [CrossRef]
  79. Mohapatra, D.; Mishra, D.; Chaudhury, G.R.; Das, R.P. Arsenic adsorption mechanism on clay minerals and its dependence on temperature. Korean J. Chem. Eng. 2007, 24, 426–430. [Google Scholar] [CrossRef]
Figure 1. Location of the study area and sampling points.
Sustainability 14 10935 g001
Figure 2. Adsorption kinetics of arsenic in solution on various media.
Sustainability 14 10935 g002
Figure 3. Fitting diagrams of adsorption kinetics models. (a) Pseudo first-order kinetic model; (b) Pseudo second-order kinetic model.
Sustainability 14 10935 g003
Figure 4. Isothermal adsorption curves of arsenic in solution on various media.
Sustainability 14 10935 g004
Figure 5. Fitting diagrams of isothermal adsorption models. (a) Henry model; (b) Freundlich model; (c) Langmuir model.
Sustainability 14 10935 g005aSustainability 14 10935 g005b
Figure 6. Arsenic desorption ratios on various media.
Sustainability 14 10935 g006
Figure 7. Fitting diagrams of desorption kinetics models. (a) Pseudo first-order kinetic model; (b) Pseudo second-order kinetic model.
Sustainability 14 10935 g007
Figure 8. Relationship between qed and qea.
Sustainability 14 10935 g008
Figure 9. Desorption hysteresis indexes (HI) and ratios (ωed) of arsenic: (a) silty clay; (b) fine sand; (c) medium sand; (d) coarse sand with gravel.
Sustainability 14 10935 g009aSustainability 14 10935 g009b
Figure 10. Adsorption and desorption of arsenic under different pH conditions: (a) adsorption capacity at equilibrium; (b) desorption capacity at equilibrium.
Sustainability 14 10935 g010
Figure 11. Adsorption and desorption of arsenic at different temperatures: (a) adsorption capacity at equilibrium; (b) desorption capacity at equilibrium.
Sustainability 14 10935 g011
Figure 12. Adsorption and desorption of arsenic with different HCO3 concentrations: (a) adsorption capacity at equilibrium; (b) desorption capacity at equilibrium.
Sustainability 14 10935 g012
Figure 13. Adsorption of arsenic under different ionic strengths.
Sustainability 14 10935 g013
Table 1. Grain sizes, SSA, and TOC of the samples.
Sample IDLithologySampling
Depth (m)
The Weight Percentage of Different Particle Sizes (%)SSA (m2/g)TOC (g/kg)
<0.063 mm0.063–0.15 mm0.15–0.25 mm0.25–0.5 mm0.5–2 mm>2 mm
S1Silty clay11000000036.212.2
S2Fine sand32.2426.4236.1117.729.987.536.64.1
S3Medium sand50.566.4718.9959.119.185.695.12.5
S4Coarse sand with gravel70.162.4613.4422.3715.5346.043.70.6
Table 2. Fitting parameters of adsorption kinetics models.
Sample IDPseudo First-Order Kinetic ModelPseudo Second-Order Kinetic Model
k1 (h−1)qe (mg/kg)R2k2 (L·mg−1·h−1)qe (mg/kg)R2
S10.07493.870.92740.066928.990.9999
S20.064414.500.97950.006818.120.9776
S30.060013.400.97170.003716.670.9479
S40.059710.320.98030.003513.250.9579
Table 3. Fitting parameters of isothermal adsorption models.
Sample IDHenry ModelFreundlich ModelLangmuir Model
Kh (L/kg)R2Kf (mg(1−1/n)L1/nkg−1)nR2Kl (L/mg)qm (mg/kg)R2
S135.10.923973.64821.29480.98540.5735256.41030.9991
S22.97620.944911.19201.39700.99330.395852.63160.9959
S32.36020.97725.27351.26600.98920.608417.30100.9695
S41.82870.97202.83031.13190.98190.441310.51520.9713
Table 4. Fitting parameters of desorption kinetics models.
Sample IDPseudo First-Order Kinetic ModelPseudo Second-Order Kinetic Model
k1 (h−1)qe (mg/kg)R2k2 (L·mg−1·h−1)qe (mg/kg)R2
S10.07750.53510.90480.56511.74060.9998
S20.09072.80560.97380.09796.40610.9994
S30.09652.66660.94470.09606.04590.9992
S40.09502.41570.96770.10324.64680.9992
Publisher’s Note: MDPI stays neutral with regard to jurisdictional claims in published maps and institutional affiliations.

