Article

A DEMATEL Framework for Modeling Cause-and-Effect Relationships of Inbound Contamination in Single-Stream Recycling Programs

Department of Industrial Engineering, College of Engineering, King Abdulaziz University, Jeddah 80204, Saudi Arabia
Sustainability 2022, 14(17), 10884; https://doi.org/10.3390/su141710884
Submission received: 28 July 2022 / Revised: 23 August 2022 / Accepted: 29 August 2022 / Published: 31 August 2022

Abstract

:
Material Recovery Facilities (MRFs) are the foundation of United States recycling programs. MRFs collect recyclable materials from end users for export to be processed abroad or to sell to mills for further refinement and reuse. The most popular type of recycling collection in the United States is Single-Stream Recycling (SSR). Numerous studies have validated the program’s popularity and consumer acceptance. In contrast to other recycling plans, SSR’s favored status rests on its minimal consumer burden, which requires only a cursory identification of potentially recyclable materials for placement in a single container separate from other waste. Researchers have also found that collecting SSR materials requires less staff and cheaper collection vehicles. While SSR generates greater end-user acceptance than other recycling collection programs, SSR differs markedly in terms of higher inbound contamination rates and quality of recovered recycling materials. Single-stream collection increases cross-contamination through mixing recyclable and non-recyclable materials in a single container. High contamination rates lower the quality of incoming recyclables and increase overall MRF operating costs due to additional sorting time and related staffing costs. This paper aims to analyze the causes of high inbound contamination in SSR using Decision-Making Trial and Evaluation Laboratory (DEMATEL) techniques to support deeper analysis of the relative importance of three factors that scholars have identified as being related to SSR inbound contamination of MRFs. Based on the results obtained, the absence of awareness campaigns is one of the crucial factors increasing inbound contamination due to the inefficiency of the SSR system in separating unrecyclable from recyclable materials; therefore, the sorting equipment at MRFs requires further improvement. Focused analysis of causal inbound contamination factors may assist in furthering efforts to reduce SSR contamination.

1. Introduction

Solid Waste Management (SWM) is an integral component of modern communities’ environmental efforts to capture value from waste that would otherwise go directly to landfills and incinerators. Even though politically popular, and highly touted, waste management remains problematic due to expenses related to complex recycling processes and limited consumer participation [1]. In more economically developed countries seeking a robust recycling economy, waste management represents a paradigm shift where municipalities hope to recapture value from waste streams [1]. Thus, the process of recycling prevents the disposal of potentially valuable materials that would otherwise end up in a landfill or be disposed of inappropriately or at a high cost [2]. In theory, sustainable development is achievable through the effective and efficient management of solid wastes. However, much more must be accomplished to improve public adoption and decrease the costly processes required to produce viable raw materials from the waste streams.
Bafail and Abdulaal [3] define solid waste as “all neglected solid materials from municipal, industrial, and agricultural activities”. The traditional strategies for eliminating waste include landfills, composting, and incineration [4,5,6,7].
The increasing volume of waste is a global problem [7,8]. In 2018, the United States disposed of 146 million tons of Municipal Solid Waste (MSW) in landfills. However, identifying acceptable landfill space and the need to capture value from waste streams requires strategic rethinking [9]. In response to growing awareness and concern, policymakers are advocating more stringent methods to reduce, reuse, and recycle to eliminate or dramatically reduce waste.
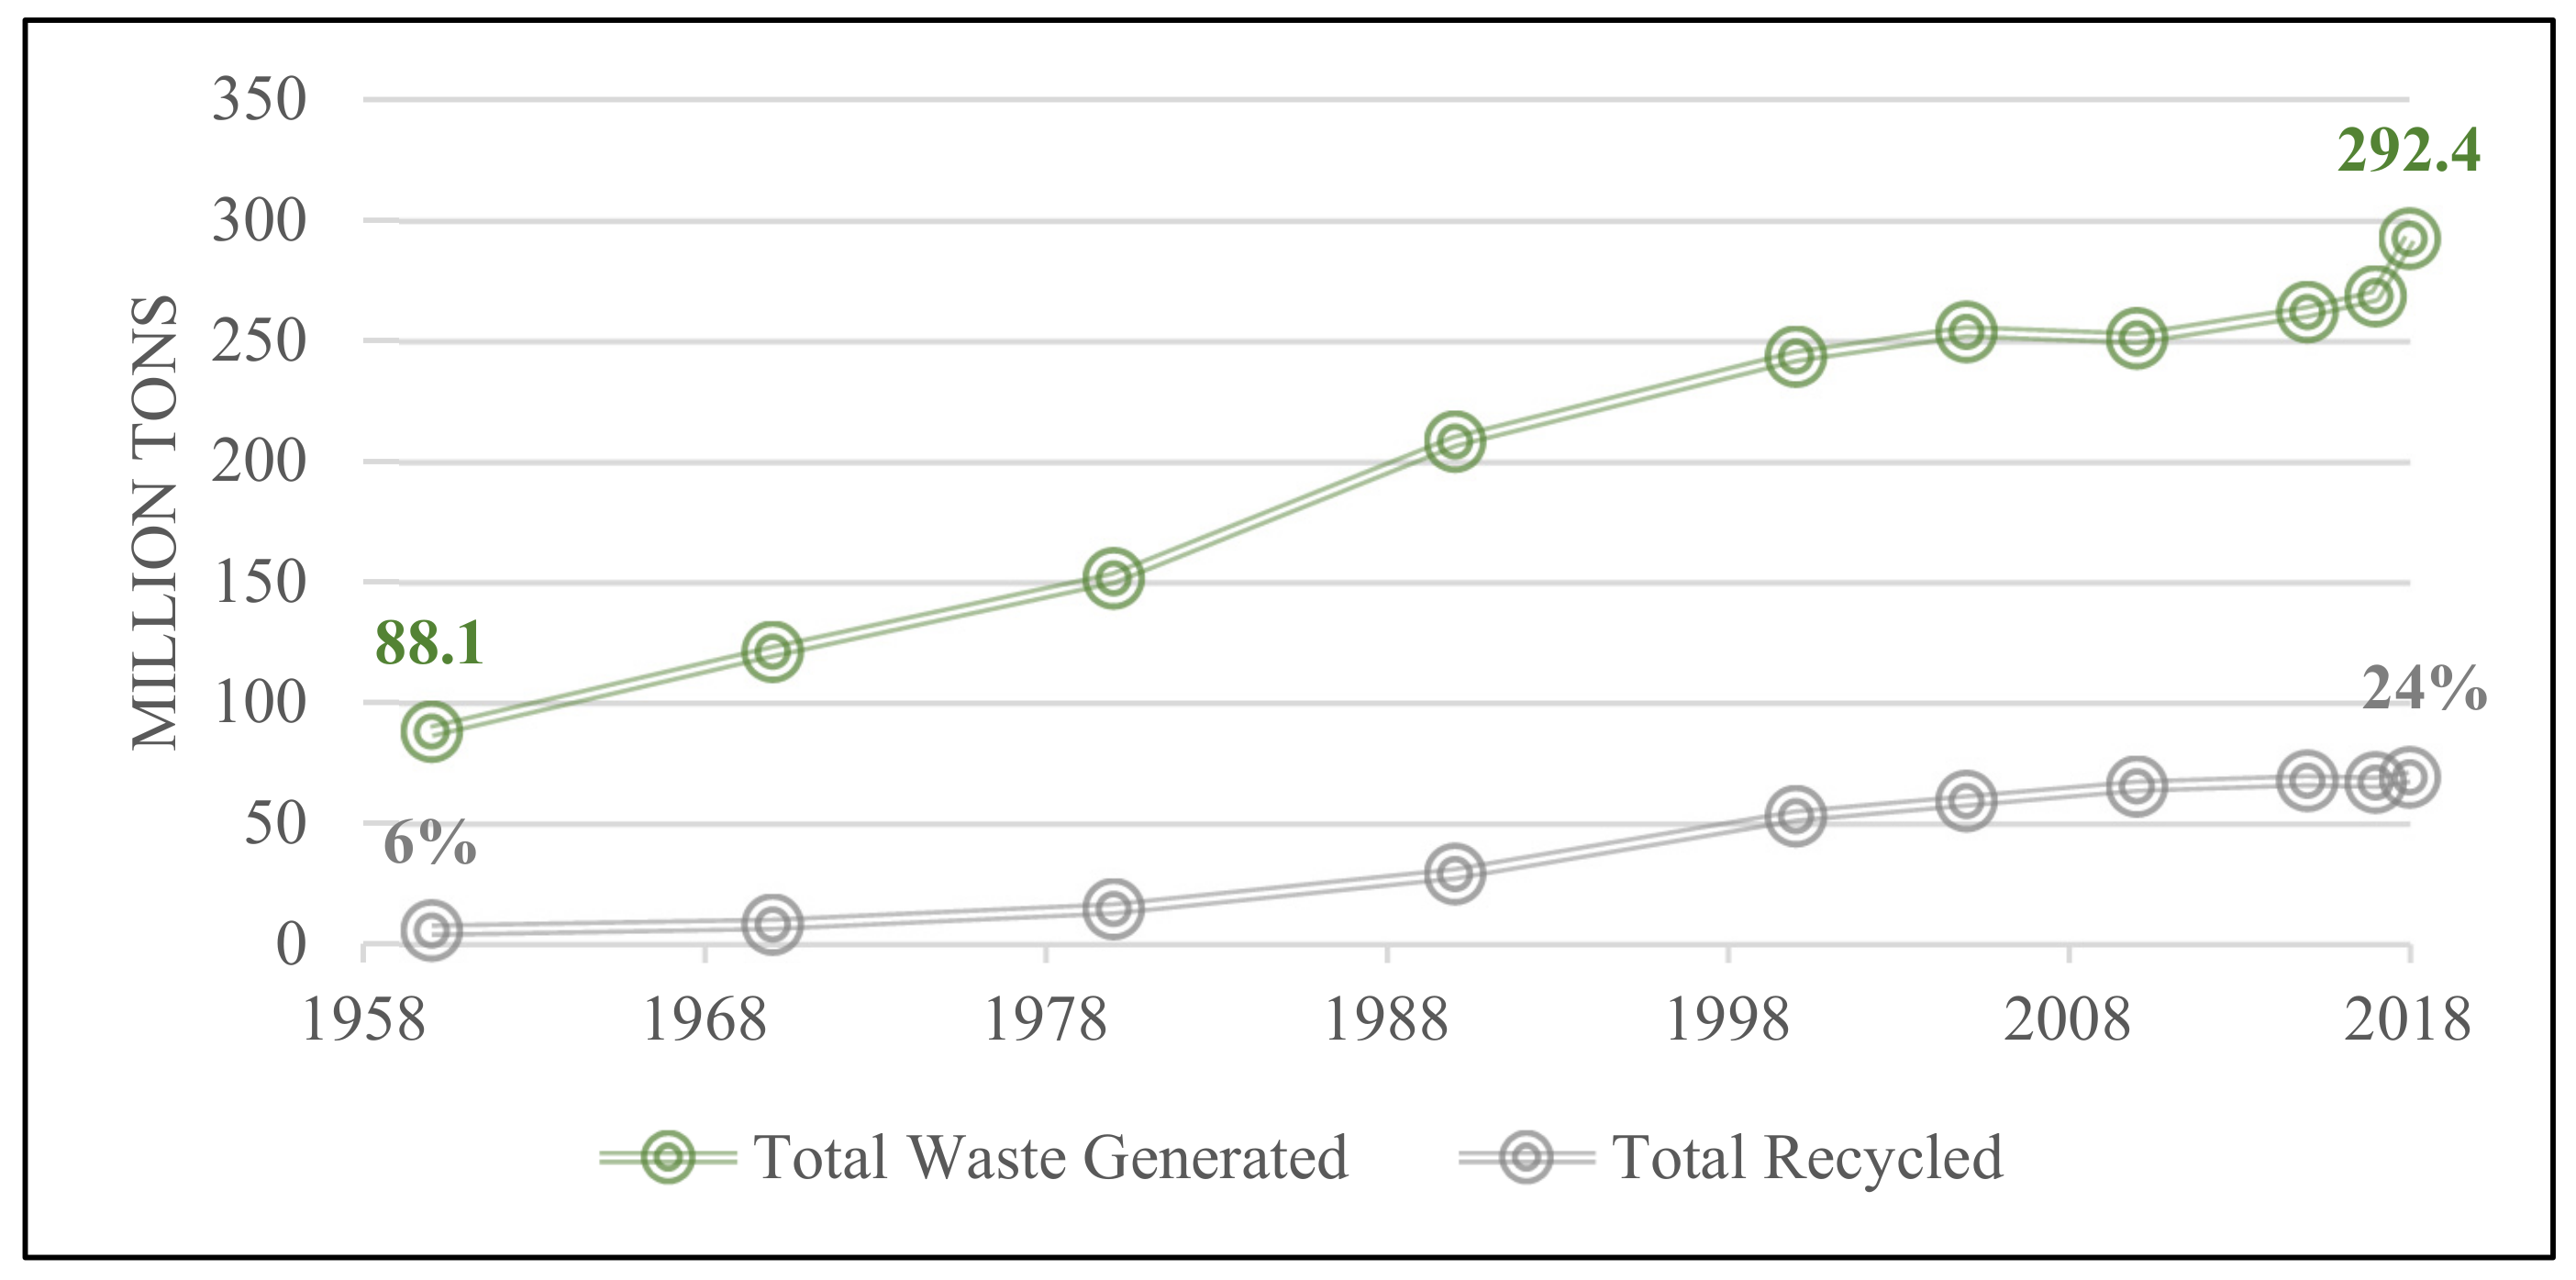
In response to greater public awareness and a 73% increase in MSW over the past 20 years, recycling is a highly visible municipal service in most communities in the United States [10]. Community-level recycling efforts in the United States began in the 1970s; by 1985, Americans recycled more than 10% of available recyclable materials. However, participation varies widely, with some American cities recycling only 1% of recyclable materials [11], highlighting the need for rethinking to make efficient and effective recycling programs available. In 2018, the United States was able to recycle 24% of the total waste generated (see Figure 1).
Figure 1. Total MSW produced and recycled in the U.S., 1960–2018 [12].
Sustainability 14 10884 g001
In recycling collection programs in the United States, materials are generally shipped to a Material Recovery Facility (MRF), where recyclables are separated, processed, and stored for eventual sale as raw materials to mills and other end markets. The recycling collection methods deployed to collect waste for MRFs include Single-Stream Recycling (SSR), Dual-Stream Recycling (DSR), Multi-Stream Recycling (MSR), and Mixed Waste Recycling (MWR) [3,13]. SSR requires that consumers place recyclable plastics, metals, paper, and glass into a single bin for collection by waste management companies [10]. DSR requires consumers to place paper recyclables in one bin and plastics, glass, and metal waste in another [5,14,15]. The MSR method uses a separate bin for paper, plastic, glass, and metal recyclables. The MWR method requires waste generators to extract recyclables after collecting garbage [3]. The primary purpose of all recycling methods is to recapture value from waste streams; their methods differ in collecting, processing, and sorting waste.
SSR is the most popular, and fastest-growing municipal recycling method in the United States. The program is attractive because consumers are not required to sort materials into bins. According to Moore [16], the number of SSR MRFs increased in Florida from 5 facilities in 1995 to 287 in 2014. Moreover, in 2005, 22% of the U.S. population with recycling programs had access to SSR programs. This percentage grew to 73% in 2014 [17].
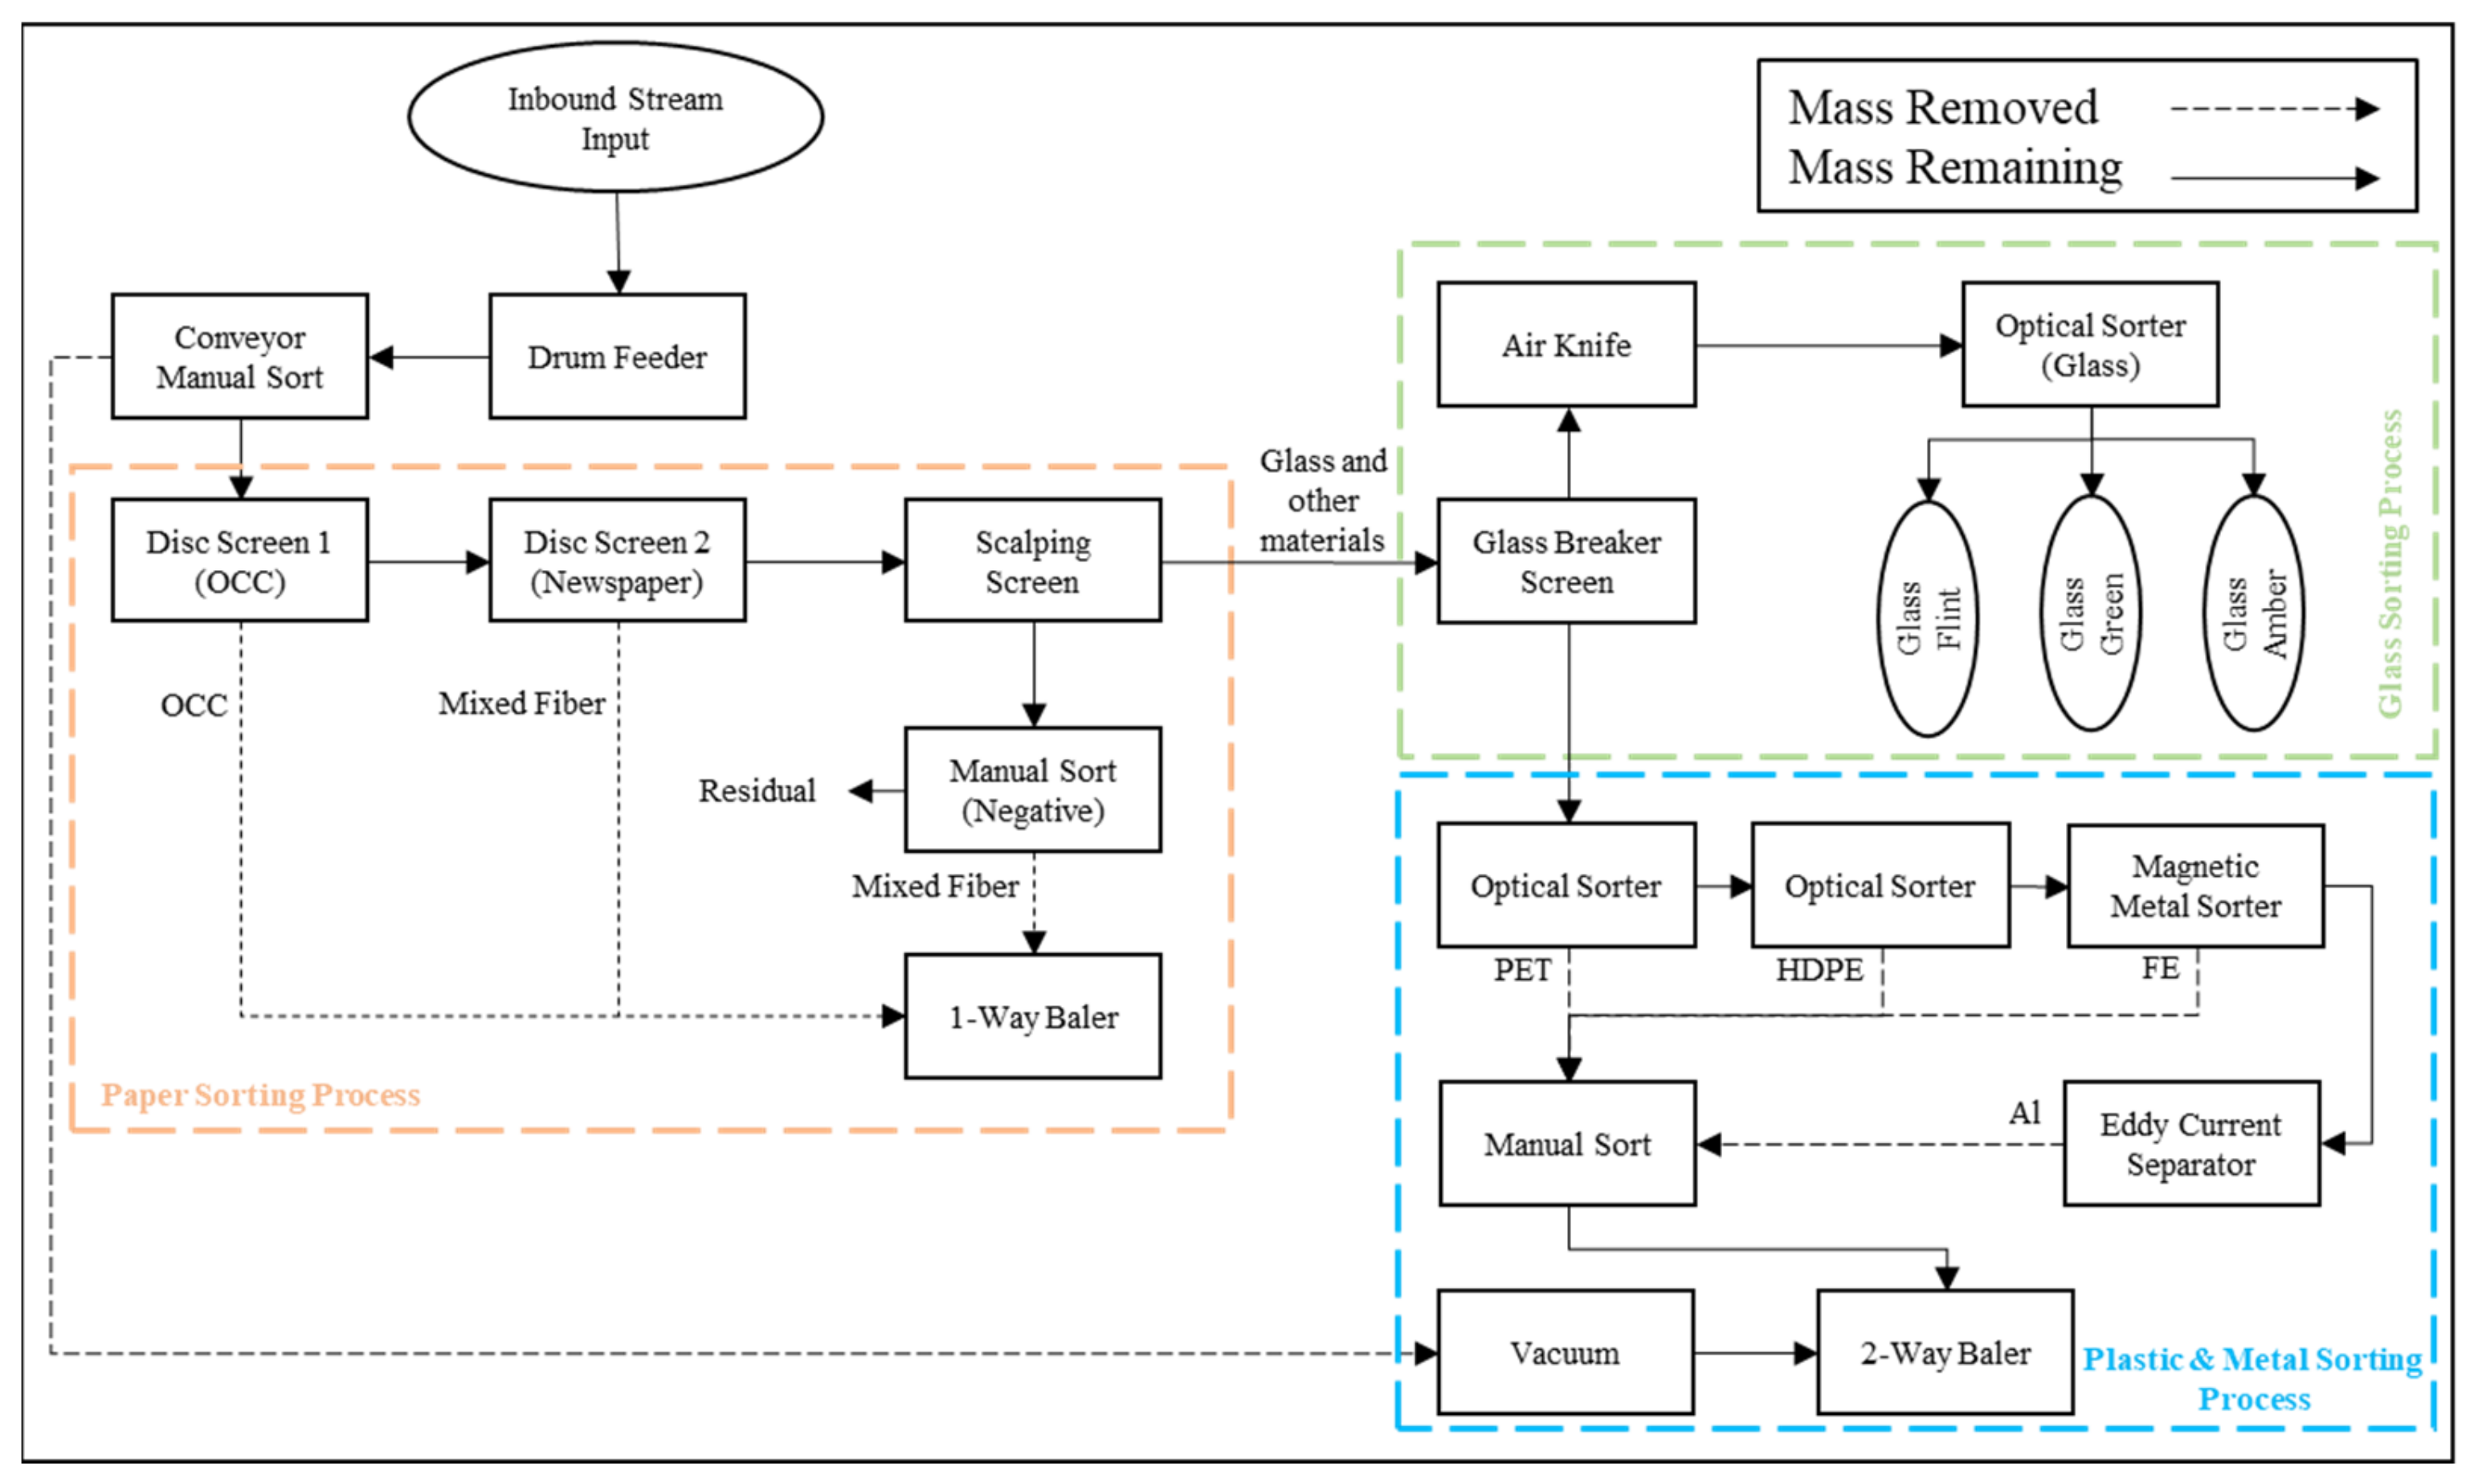
As illustrated in Figure 2, once collected, the SSR method typically involves front-end loaders on the MRF tipping floor to push the contents of the collection trucks to a drum finder. The drum distributes the materials to the first conveyor belt for personnel to remove large or potentially unacceptable items from reaching downstream equipment. In addition, plastic film is vacuumed away and sent to a two-way baler. The cardboard is subsequently recovered and diverted to a one-way baler. The separation process then recovers newsprint and removes potential contaminants. Glass waste is broken into cullet before an air knife removes glass materials. Ceramics and similar materials, not easily recyclable, are discarded. Optical sorters then examine the remaining waste stream to identify the most recycled types of plastic in the U.S., polyethylene terephthalate (PET) and high-density polyethylene (HDPE). Finally, a magnet scans the waste for ferrous recovery, and an eddy current separator identifies aluminum for recovery.
Figure 2. Materials flow in SSR at MRFs [18].
Sustainability 14 10884 g002
The commingling of recyclable materials inherent under the SSR model poses a high risk of contaminating solid waste streams by complicating the separating, sorting, and recovering materials in MRFs. Contamination in SSR refers to prohibited items that have been sorted into a SSR recycling bin. For instance, food waste, yard waste, batteries, Styrofoam, garbage, shredded paper, liquids, film plastics, plastic bags, clothes, electronics, compact disc (CDs) and video home system (VHS) tapes are all examples of prohibited items in SSR inbound stream. On the other hand, Table 1 shows some examples of accepted items in SSR.
The SSR method results in increased recycling costs leading to reduced revenues for the MRFs [19,20]. Moreover, high contamination of inbound streams results in prohibitive contamination rates in materials that are shipped to mills. In paper mills, if the prohibitive contamination rate exceeds the paper mill prohibitive standard rates, the outbound paper materials become useless [21]. High contamination levels in the waste stream also increase the incidence of recycling equipment machine failure [10]. According to Moore [16], contamination rates using SSR can be as high as 50% of the inbound stream, with an average contamination cost of USD 125 per ton (per 2000 lb). Waste Management [22] estimates that 25% of items placed in recycling are not recyclable due to their composition, grades, or contamination [23].
MRFs strive to reduce the volume of contaminants in inbound streams to harness as much of the value of recyclables as possible. One of the most important ways MRFs attempt to reduce SSR collected waste is by knowing and identifying the causes of contamination. Therefore, this paper aims to deploy the robust, scientific Decision-Making Trial and Evaluation Laboratory (DEMATEL) technique to demonstrate the effectiveness of identifying causes of contamination in the inbound stream from SSR programs arriving at MRFs. DEMATEL is a Multi-Criteria Decision-Making (MCDM) tool that is considered to be an adequate method for the identification of cause–effect chain elements in complex systems. Moreover, MRFs rely heavily on robust scientific cause-and-effect analysis within MCDM frameworks to address the issue [24]. MCDM permits decision makers to evaluate potential alternatives by simultaneously applying multiple conflicting criteria [25]. The capability of handling different criteria makes MCDM methods effective, often resulting in efficient decision-making to solve complex problems [26].
In addition, there is a lack of discussion of the causes of inbound and outbound forms of contamination in the recycling collection programs in the literature. Therefore, this paper seeks to contribute by covering some of the gaps in the literature. It will do this by using a robust scientific MCDM method to identify the causes of inbound contamination in SSR which will assist decision makers at MRFs in taking corrective actions to reduce the contamination rate in other recycling collection programs.
The balance of this paper addresses the following topics in turn. Section 2 provides additional background relating to the contamination problem. Section 3 reviews studies of existing inbound waste stream contamination and efforts to deploy techniques/methods to ameliorate the problem. Section 4 describes the DEMATEL procedure step by step. Section 5 provides a discussion of the detailed analysis undertaken by this study. The final section presents the study’s conclusions.

2. Background of Inbound Contamination Rate in SSR Programs

Until 2017, the United States shipped most of its recyclable materials to China for processing. Due to its flexible regulatory environment and low labor costs, China was a leading global processor of recycled materials. In February 2017, China announced its “National Sword Policy”, introducing a goal to reduce the importation of contaminated recyclable materials. In April 2017, China prohibited future “solid waste materials for import” and canceled the renewal of solid waste import licenses the following month. In July 2017, China informed the World Trade Organization (WTO) that it would “forbid the import of 24 types of solid waste and recyclables and require reduced contamination rates for other materials to 0.3%” [27,28]. The policy expanded and strengthened 2007 restrictions on such contaminants [29] and China’s 2013 Green Fence initiative, which implemented random inspection of such imported recyclable materials as plastics and recovered paper materials [29]. Imported recyclable materials of increasingly poor quality and containing high levels of contaminants triggered the policy changes [27]. Collectively, these changes drove up Chinese prices for recycling; by September 2017, mixed fiber recyclable material bale prices in the United States fell dramatically from average prices in July 2017 of USD 65 in the Northwest, USD 70 in the Northeast, USD 72 in the Southeast, USD 72 in the Southcentral, and USD 70 in the Southwest to average prices of USD 17, USD 32, USD 37, USD 32, and USD 30, respectively (see Figure 3, Figure 4 and Figure 5). Moreover, the average prices of mixed-fiber recyclables continued to decline to zero in all regions in the United States by September 2019. On the other hand, the average prices of OCC bales were traded between USD 106 and USD 110 in all regions in the United States in November 2016. The average prices of OCC bales increased to over USD 150 in all regions in July 2017 before they fell dramatically in May 2019 to average prices of USD 15, USD 37, USD 37.5, USD 37, and USD 20 in the Northwest, Northeast, Southeast, South Central, and Southwest, respectively. United States municipalities faced the prospect of either absorbing the increased recycling and sorting costs or shutting down recycling programs. To address these sudden changes, some municipalities resorted to stockpiling or incinerating their waste [30]. These changes also spurred interest in the development of new recycling approaches.
Figure 3. Average regional prices of mixed paper bales from November 2016 to January 2020 in Northwest, Northeast, Southeast, Southcentral, and Southwest regions in the United States [31].
Sustainability 14 10884 g003
Figure 4. Average prices of recovered OCC bales from November 2016 to January 2020 in Northwest, Northeast, Southeast, Southcentral, and Southwest regions in the United States [31].
Sustainability 14 10884 g004
Figure 5. Recyclables market regions in the United States [31].
Sustainability 14 10884 g005
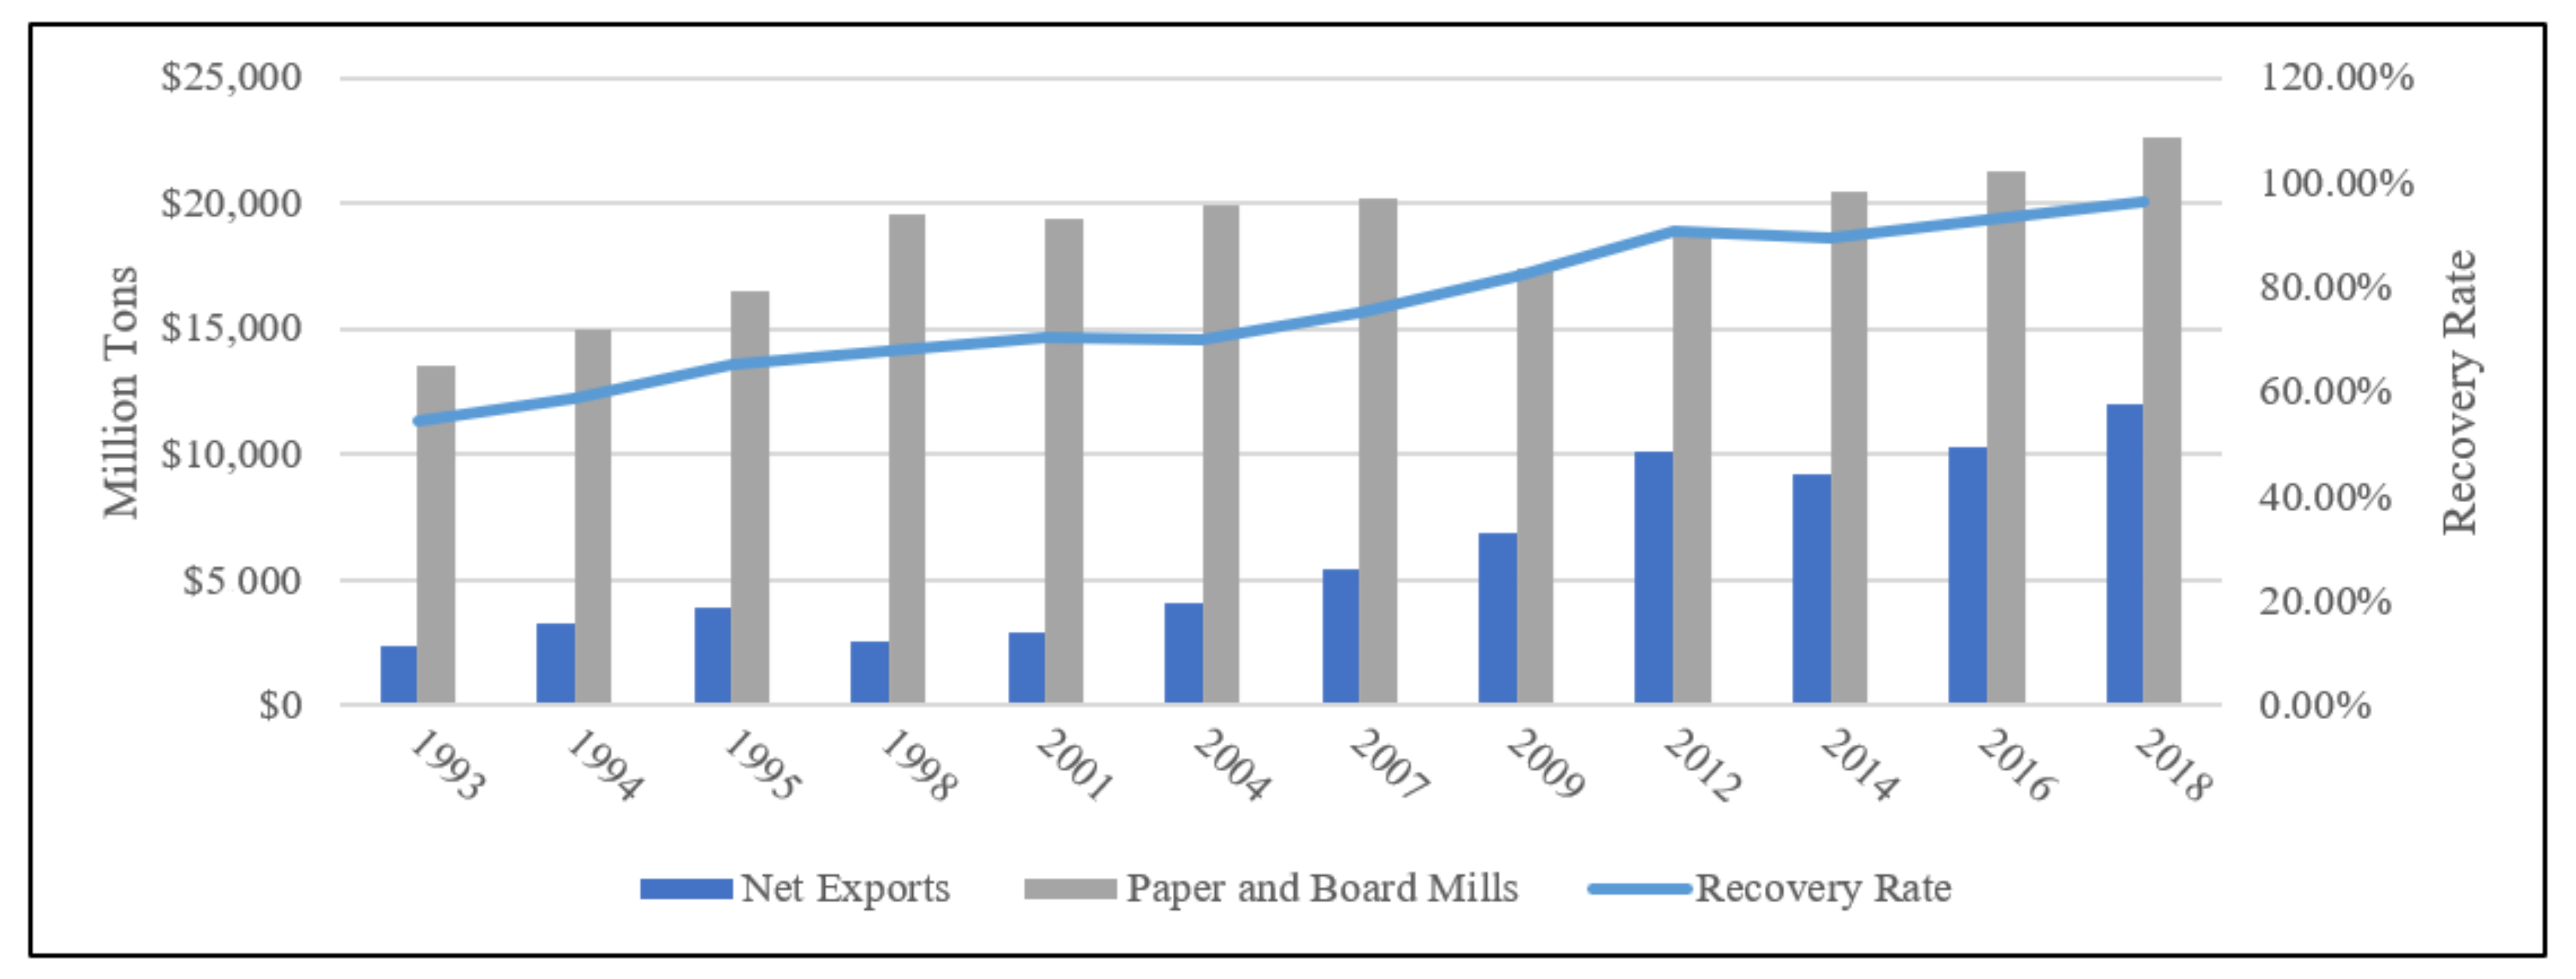
China’s new regulatory stance continued to permit the import of OCC as long as the contamination rate was less than 0.5%. Even though the quantity of OCC exported to China increased steadily (see Figure 6), the average price of OCC in the United States, like that of recovered mixed paper overall, has fallen since September 2017 (see Figure 4), regardless of the curbside collection program. The price reduction is likely attributable to revenue losses from recyclables no longer exported to China.
Figure 6. Total net exports (per million tons) and recovery rate of Old Corrugated Cardboard in the United States [17].
Sustainability 14 10884 g006
The complexities and costs inherent in the single, dual, or multi-stream recycling schemes are critical to understanding the present recycling dilemma. For example, in contrast to the minimum required consumer involvement with an SSR-based program, consumers participating in a DSR program must separate fiber, paper, and cardboard materials from glass, plastic, and metal before collection. DSR was the early standard recycling program in the United States [32]. However, numerous studies projected widespread consumer acceptance of recycling if consumers were relieved of having to identify and sort their waste as promised by SSR. Widespread adoption of SSR shifted the primary means of recyclable collection away from DSR [32].
While SSR adoption increased consumer participation in recycling efforts, some municipalities in the United States continued to use DSR, finding that the poor quality of the collected materials under the SSR approach rendered recycling no longer cost-effective [33,34,35]. For example, the high cost of advanced and intensive screening techniques, particularly in the case of plastics [35,36], is a considerable disadvantage compared to optimal MSR recycling programs [35,37,38].
While the general population more readily accepts SSR, scarcely any research directly compares the inbound and outbound material quality and contamination levels of DSR, MSR, and SSR collected materials. Thus, one cannot definitively state that poor-quality recyclables are specific to SSR programs. Regardless, the reported causes of inbound contamination in SSR require identification to take corrective action to reduce the contamination in SSR programs.

3. Literature Review

The noted lack of research comparing contamination problems among various recycling collection methods is, for all practical purposes, a secondary concern in light of overwhelming public preference and an enhanced level of participation noted by numerous researchers. Bell et al. [39] advocated using SSR in Wisconsin because of its positive effect on households adopting recycling as a waste disposal method. Damgacioglu et al. [21] supported Bell et al.’s [39] findings and indicated that SSR is the preferred recycling program because of reduced collection costs and increased collection volume. Yasar et al. [40] also supported the use of SSR because of increased participation, reduced collection costs, reduced household sorting efforts, and fewer required waste-collection vehicles [41,42,43]. Thus, despite potential disadvantages of SSR, such as increased processing costs and risks of higher contamination rates [3,18,21,43,44], the demonstrated benefits are encouraging many waste management companies and municipalities to implement the method.
Even though there are few comprehensive evaluations of collection methods, numerous studies have examined differences in collection methods by recycled material type. Tonjes et al. [41] reported that SSR collected a greater volume of paper (over 25,000 tons) than DSR from 2004 to 2016. Although trends in Tonjes et al.’s [41] study suggests efficiencies in collecting paper with SSR, there was an overall reduction in recyclable material compared to DSR.
Farrel [45] noted that fine-glass shards form during automated SSR collection. These small shards pose a significant challenge to SSR processing operations when they become lodged in paper, making the paper unrecyclable and increasing MRF costs [10,46].
According to Yedinak [47], as a result of China’s National Sword policy, the U.S.’s SSR has been revealed to have many drawbacks, increasing doubt about whether it can be sustained long-term. In order to make recycling more efficient, policies that reduce contamination levels in the recycling stream and facilitate recycling must be implemented. Across the U.S., some municipalities have begun switching from SSR to dual-stream recycling in order to curb contamination levels [48,49,50,51,52]. It has been reported in Yedlink’s [47] paper, the switch to SSR adversely impacts the quality of recycled glass. Therefore, Yedlink reported that the breakage of glass during the collection stage in SSR reduces its recovery or allows other materials and different-colored glass to contaminate it. Thus, on average, only 40% of glass can be recycled from an SSR system, compared with 90% in a multi-stream recycling system [47]. Additionally, glass is frequently cited as a contamination issue for other recycled materials, such as paper and plastic [47]. In a comparative analysis reported in Bashir et al. [53], excluding glass materials from SSR program can reduce the contamination level rate in SSR by 3.61%.
Mixing certain plastic materials such as HDPE, HDPE colored, PET, and film with other recyclables at the collection stage can cause contamination to the MRF inbound stream [44]. Rosbach [54] asserts that the U.S. currently recycles only 10% of its annual plastic waste, which is an alarming statistic. Rosbach applied a range of qualitative and quantitative techniques, which includes conducting interviews, analyzing documents, and surveying data, to identify a lack of proper education regarding recycling as the most significant factor contributing to low recycling rates in SSR [54]. Hence, raising participant awareness regarding separating recyclable and non-recyclable plastics is critical to reducing contamination rates [55]. In developing countries, end-user behavior is a critical factor in recycling program participation [56]; generally, raising consumer awareness increases the recovery rate of outbound recyclables.
Contaminants from plastics reduce the number of acceptable grades for recycling since they can damage the recycling equipment [40]. Furthermore, limiting the number of plastic grades can reduce the recovery rate since non-recyclables form a significant volume of materials in the SSR inbound stream [18,57]. Moreover, consumer placement of all plastics in a single bin complicates sorting into categories at MRFs [39].
Bashir et al. [53] conducted a comprehensive case study analysis to delineate the factors associated with decreasing the efficiency of the SSR. The researchers conclude that improving MRF performance requires extensive education and awareness programs at the communal level. A lack of education leads to an increase in unrecyclable materials in the single bin system.
Quality of materials sorted, manual versus automated sorting techniques, and residue and contamination levels are all critical factors that affect MRF production in SSR. Manual sorting of recyclables involves workers handling the waste by identifying and inspecting it visually [53]. In 2018, the Monterey Regional Waste Management District reported that although the MRF was designed to a handle single-stream recycling program and a mixed-waste recycling program with a high-quality section implemented on OCC and all plastics, it was not confident about reaching the 0.5% contamination rate set by China [53]. A Metro Waste Authority study concluded that current SSR equipment cannot meet the 5% contamination standard [53].
All of the earlier studies examined for this paper reported contamination in all recycling collection programs. However, no study reported using MCDM to help determine the cause and effect of contamination in SSR program by evaluating inbound or outbound contamination rates.
Researchers have used MCDM techniques to conclude that a decision support framework is best when it comes to assisting waste management companies in determining which SWM strategies they should implement. Despite the severe lack of previous studies that did not use MCDM in SSR programs, there are many scholars who have used MCDM in various problems within the scope of waste management.
Coban et al. [58] utilized the Technique for Order of Preference by Similarity to Ideal Solution (TOPSIS), Preference Ranking Organization Method for Enrichment Evaluation (PROMETHEE) 1, and PROMETHEE II to determine the most appropriate and sensible scenarios for municipal waste management in Istanbul. Despite using multiple methodologies, the researchers selected the same scenario to implement in Istanbul. Thus, MCDM techniques can provide a reliable framework for determining the best alternatives to handling solid waste management.
Other scholars conducted similar studies using MCDM methods. Arıkan et al. [59] also evaluated the most effective waste-disposal strategies for Istanbul using the TOPSIS, PROMETHEE, and Fuzzy TOPSIS decision support frameworks. Although their study was similar to that of Coban et al. [58], the results differed. Qazi et al. [60] also undertook studies using MCDM methods to determine the most effective technologies for MSW in Oman. Their findings were similar to those of Arıkan et al. [59], finding that anaerobic digestion followed by burning was an effective waste disposal technique to reduce the volume of waste, limit greenhouse gas emissions, and stabilize landfill costs.
Shahnazari et al. [61] identified an optimal thermochemical technology in MSW management using the Analytic Hierarchy Process (AHP) and TOPSIS MCDM models. The results of both MCDM models identified plasma as the optimal thermochemical technology in SWM, again demonstrating that MCDM methods are effective decision-making tools in SWM selection.
Alkaradaghi et al. [62] used the AHP MCDM methodology in collaboration with a Geographic Information System (GIS) to select an optimal landfill site in Iraq. Sisay et al. [63] used similar methods to Alkaradaghi et al. [62] in selecting a suitable landfill site for the town of Gondar in Ethiopia. Van Thanh [64] used the Fuzzy AHP technique combined with the Combined Compromise Solution (CcCoSo) model to find a suitable location for a solid-waste-to-energy plant. MCDM methods clearly can be successfully used to make decisions on appropriate site locations for solid waste management landfills and plants.
One area in which additional research is required is how community characteristics influence the effectiveness of different recycling programs, allowing communities to optimize their recycling programs to fit their specific needs [41]. Moreover, while the literature addressing inbound SSR contamination is sparse, no study has utilized a rigorous cause-and-effect analysis using techniques offered by DEMATEL to address that gap in the literature.

4. Materials and Methods

Within MCDM, DEMATEL provides a systematic structural modeling approach to analyzing cause-and-effect relationships of system components. The Geneva Battelle Memorial Institute of Science developed the approach between 1972 and 1979 [65,66]. Constructing an influence map is the most distinctive feature of DEMATEL. The first step in map-building requires defining an evaluation hierarchy and selecting the expert team. One must then calculate the relationship matrix and determine the appropriate degrees of influence. Creating the total relationship influence map requires R + C and R − C calculations. R represents the sums of rows, while C represents the sums of columns. Casual diagrams can be obtained by mapping the datasets of (R + C, R − C), where the horizontal axis (R + C) referred to as “Prominence” is created by adding R to C, while the vertical axis (R − C) referred to as “Relation” is created by subtracting C from R [67,68]. Furthermore, (Ri + Ci) provides a measure of how much influence the factor has exerted and received. Thus, (Ri + Ci) illustrates how important factor i is to the problem. On the other hand, it indicates that factor i influences other factors if (Ri-Ci) is positive, whereas if (Ri-Ci) is negative, other factors are influencing factor i. A typical approach to constructing a DEMATEL tool is as follows [69]:
Step #1:
An expert panel and dimensions/criteria are determined. This step involves gathering subjective opinions from a panel of experts. The challenges are determined and discussed based on the literature and expert opinions.
Step #2:
Construct a direct-relation matrix generated by making pairwise comparisons between the criteria involved. Rate the level of relationship between the criteria using the scale shown in Table 2.
X i j k represents expert k, which perceives criteria i as exerting influence on criteria j. Assume M experts and n criteria result in M non-negative matrices of nXn dimension. In the case where i = j, the value is 0, which indicates no influence. The following formula develops the average matrix A:
a i j   =   1 M k   =   1 M X i j k
Step #3:
An initial normalized direct matrix D is created by Equation (2):
D   =   A   x   S
Where   S   =   min ( 1 m a x j   =   1 n a i j , 1 m a x j   =   1 n a i j )
The value of each element in matrix D is between 0 and 1.
Step #4:
Total relation matrix T is
T   =   I     D     1
where I is the identity matrix.
Step #5:
“Prominence”, which is represented by R i   + C j , and “Relation”, which is represented by R i   C j , are computed for each criterion.
R i   =   j   =   1 n t i j
C j   =   i   =   1 n t i j
Step #6:
Map the dataset ( R i   + C j ; R i   C j ) by using the cause-and-effect diagram.
For the problem under examination, each factor’s importance is prioritized based on its relationships, including degrees of dependence or interdependence. DEMATEL sorts the critical factors into cause–effect groups and illustrates the relationships through impact relationship diagrams. Drawing upon earlier studies’ reported critical factors or criteria related to SSR programs’ inbound contamination rates, this examination classified those major criteria along three dimensions, as shown in Table 3. The criteria hierarchy for the problem under examination is illustrated in Figure 7.
The evaluation matrix, which represents the experts’ opinions, is presented in Table 4. Invitations were sent to experts to participate in this study. Experts were selected based on the qualifications and experience in solid waste management, especially in MRFs that utilize SSR programs in the United States. Table 5, Table 6 and Table 7 show the DEMATEL calculations necessary to obtain R + C and R − C values.

5. Results and Discussion

The DEMATEL decision-support technique enables researchers to identify relationships among factors or criteria related to complex problems. This paper aims to deploy this robust scientific technique to demonstrate the effectiveness of identifying contamination causes in the inbound stream from SSR programs arriving at MRFs.

5.1. Discussion Based on Weights of Criteria

Based on the results obtained from Table 7, the SSR automated sorting process has the highest rank with a prominence value (R + C) of 1.949, followed by the paucity of municipal and waste collection company educational and recycling awareness campaigns with a prominence value (R + C) of 1.428. While reporting that campaigns can reduce contamination levels in SSR programs, Moore [16] outlined various ways to achieve consumer awareness, including events, social media, traditional media, and advertising [16]. MRFs’ manual sorting processes are a third important contributing factor to high waste inbound contamination rates typical of SSR programs.
Insufficient public consumer awareness regarding the identification of recyclables and non-recyclables is fourth in terms of the SSR inbound contamination problem. Mixing recyclable materials with non-recyclable materials contributes to an increase in the inbound contamination process and may render other recyclable materials useless. For example, mixing a half-filled can with OCC may result in lower quality of OCC and make it an unusable recyclable item.
Insufficient awareness and training of workers in required manual sorting at MRFs is in fifth position, followed by consumer resistance to participation in recycling programs that require consumers to place items in appropriate containers. Meager consumer and even employee awareness regarding the importance of separating recyclable and non-recyclable materials in SSR is one of the most important influences on inbound contamination rates in SSR programs. Therefore, raising consumer and employee awareness will contribute significantly to reducing contamination.
Weather conditions are in seventh place, followed by types and conditions of machine separation at MRFs. Rainfall on poorly covered SSR waste containers likely contributes to the entry of liquids into the recyclable materials, which may make materials unsuitable for recycling. Moreover, old separating equipment may not be efficient in sorting recyclables at MRFs and may need replacement or upgrade.
Another important factor contributing to elevated SSR contamination rates is the type and shape of trucks used to collect recycling materials. For example, glass is more frequently broken during collection in SSR programs, making it much more difficult to separate at SSR facilities.
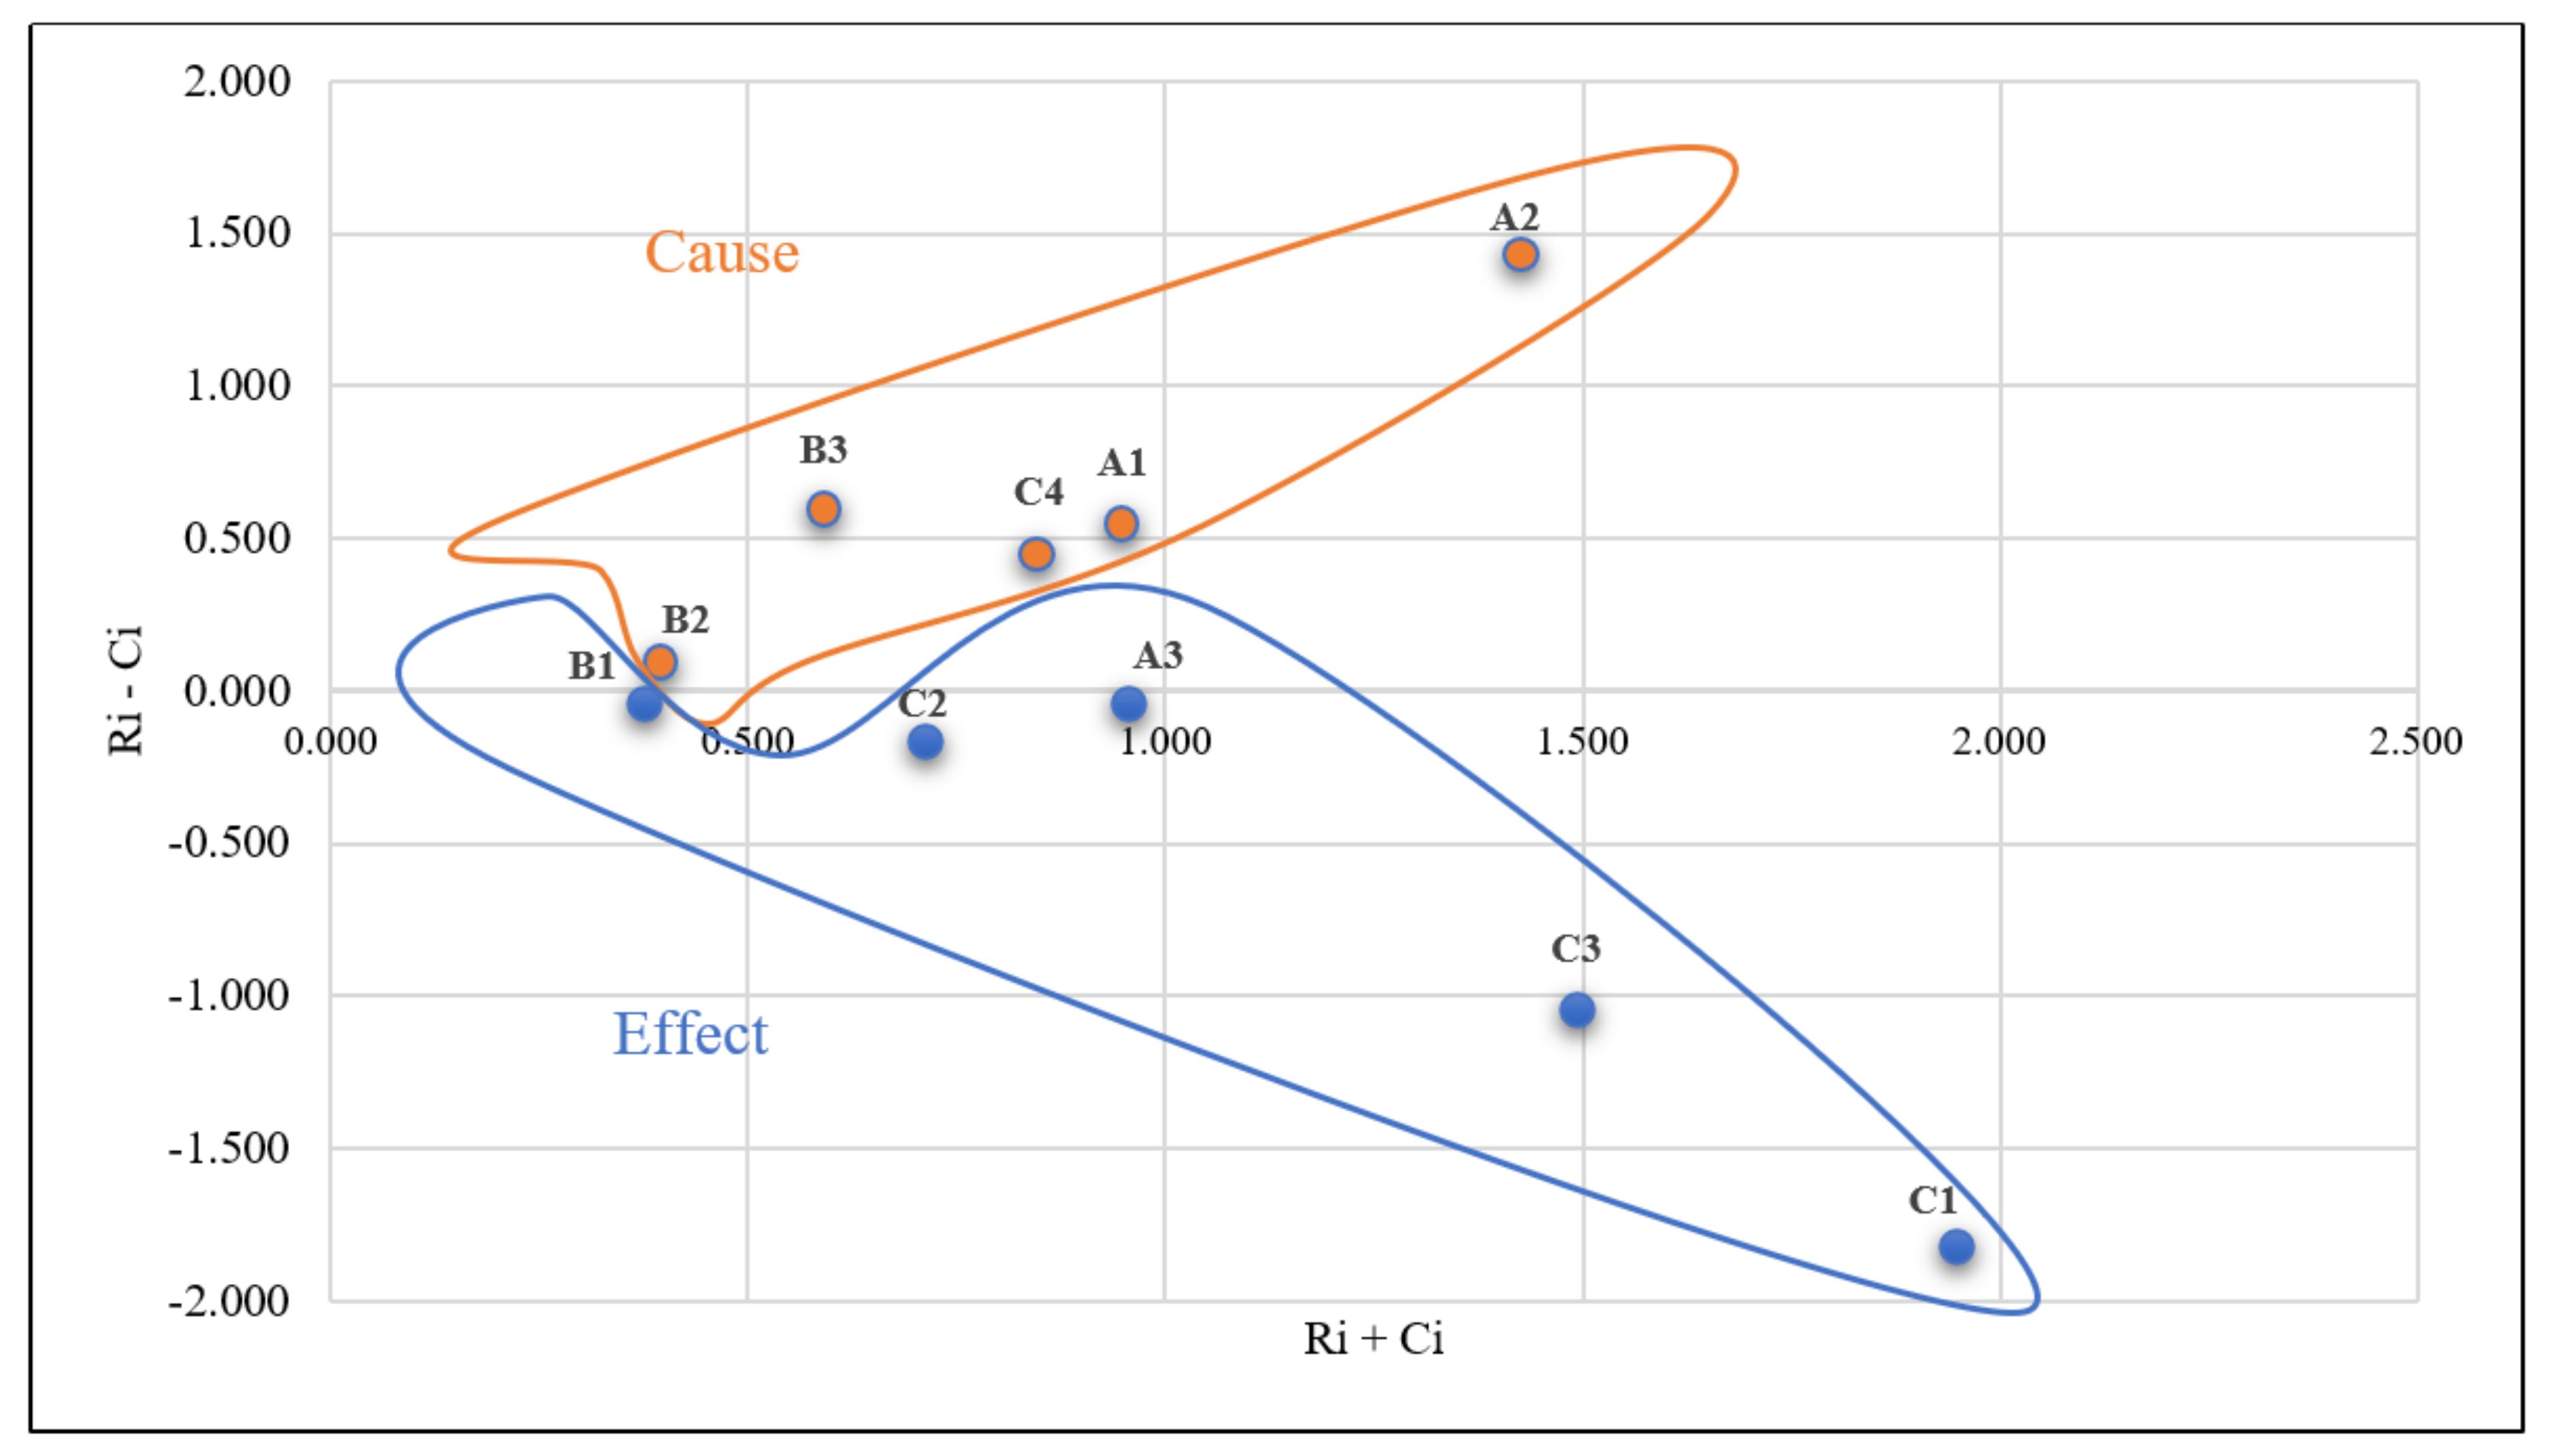
From the results obtained, the causal factors that affect the inbound contamination problem and the affected factors altered by the problem were identified and are shown in Figure 8. It can be concluded that A1, A2, B2, B3, and C4 are the causal factors, while A3, B1, C1, C2, and C3 comprise the effects groups.

5.2. Discussion Based on the Causal Relationship between/among the Criteria

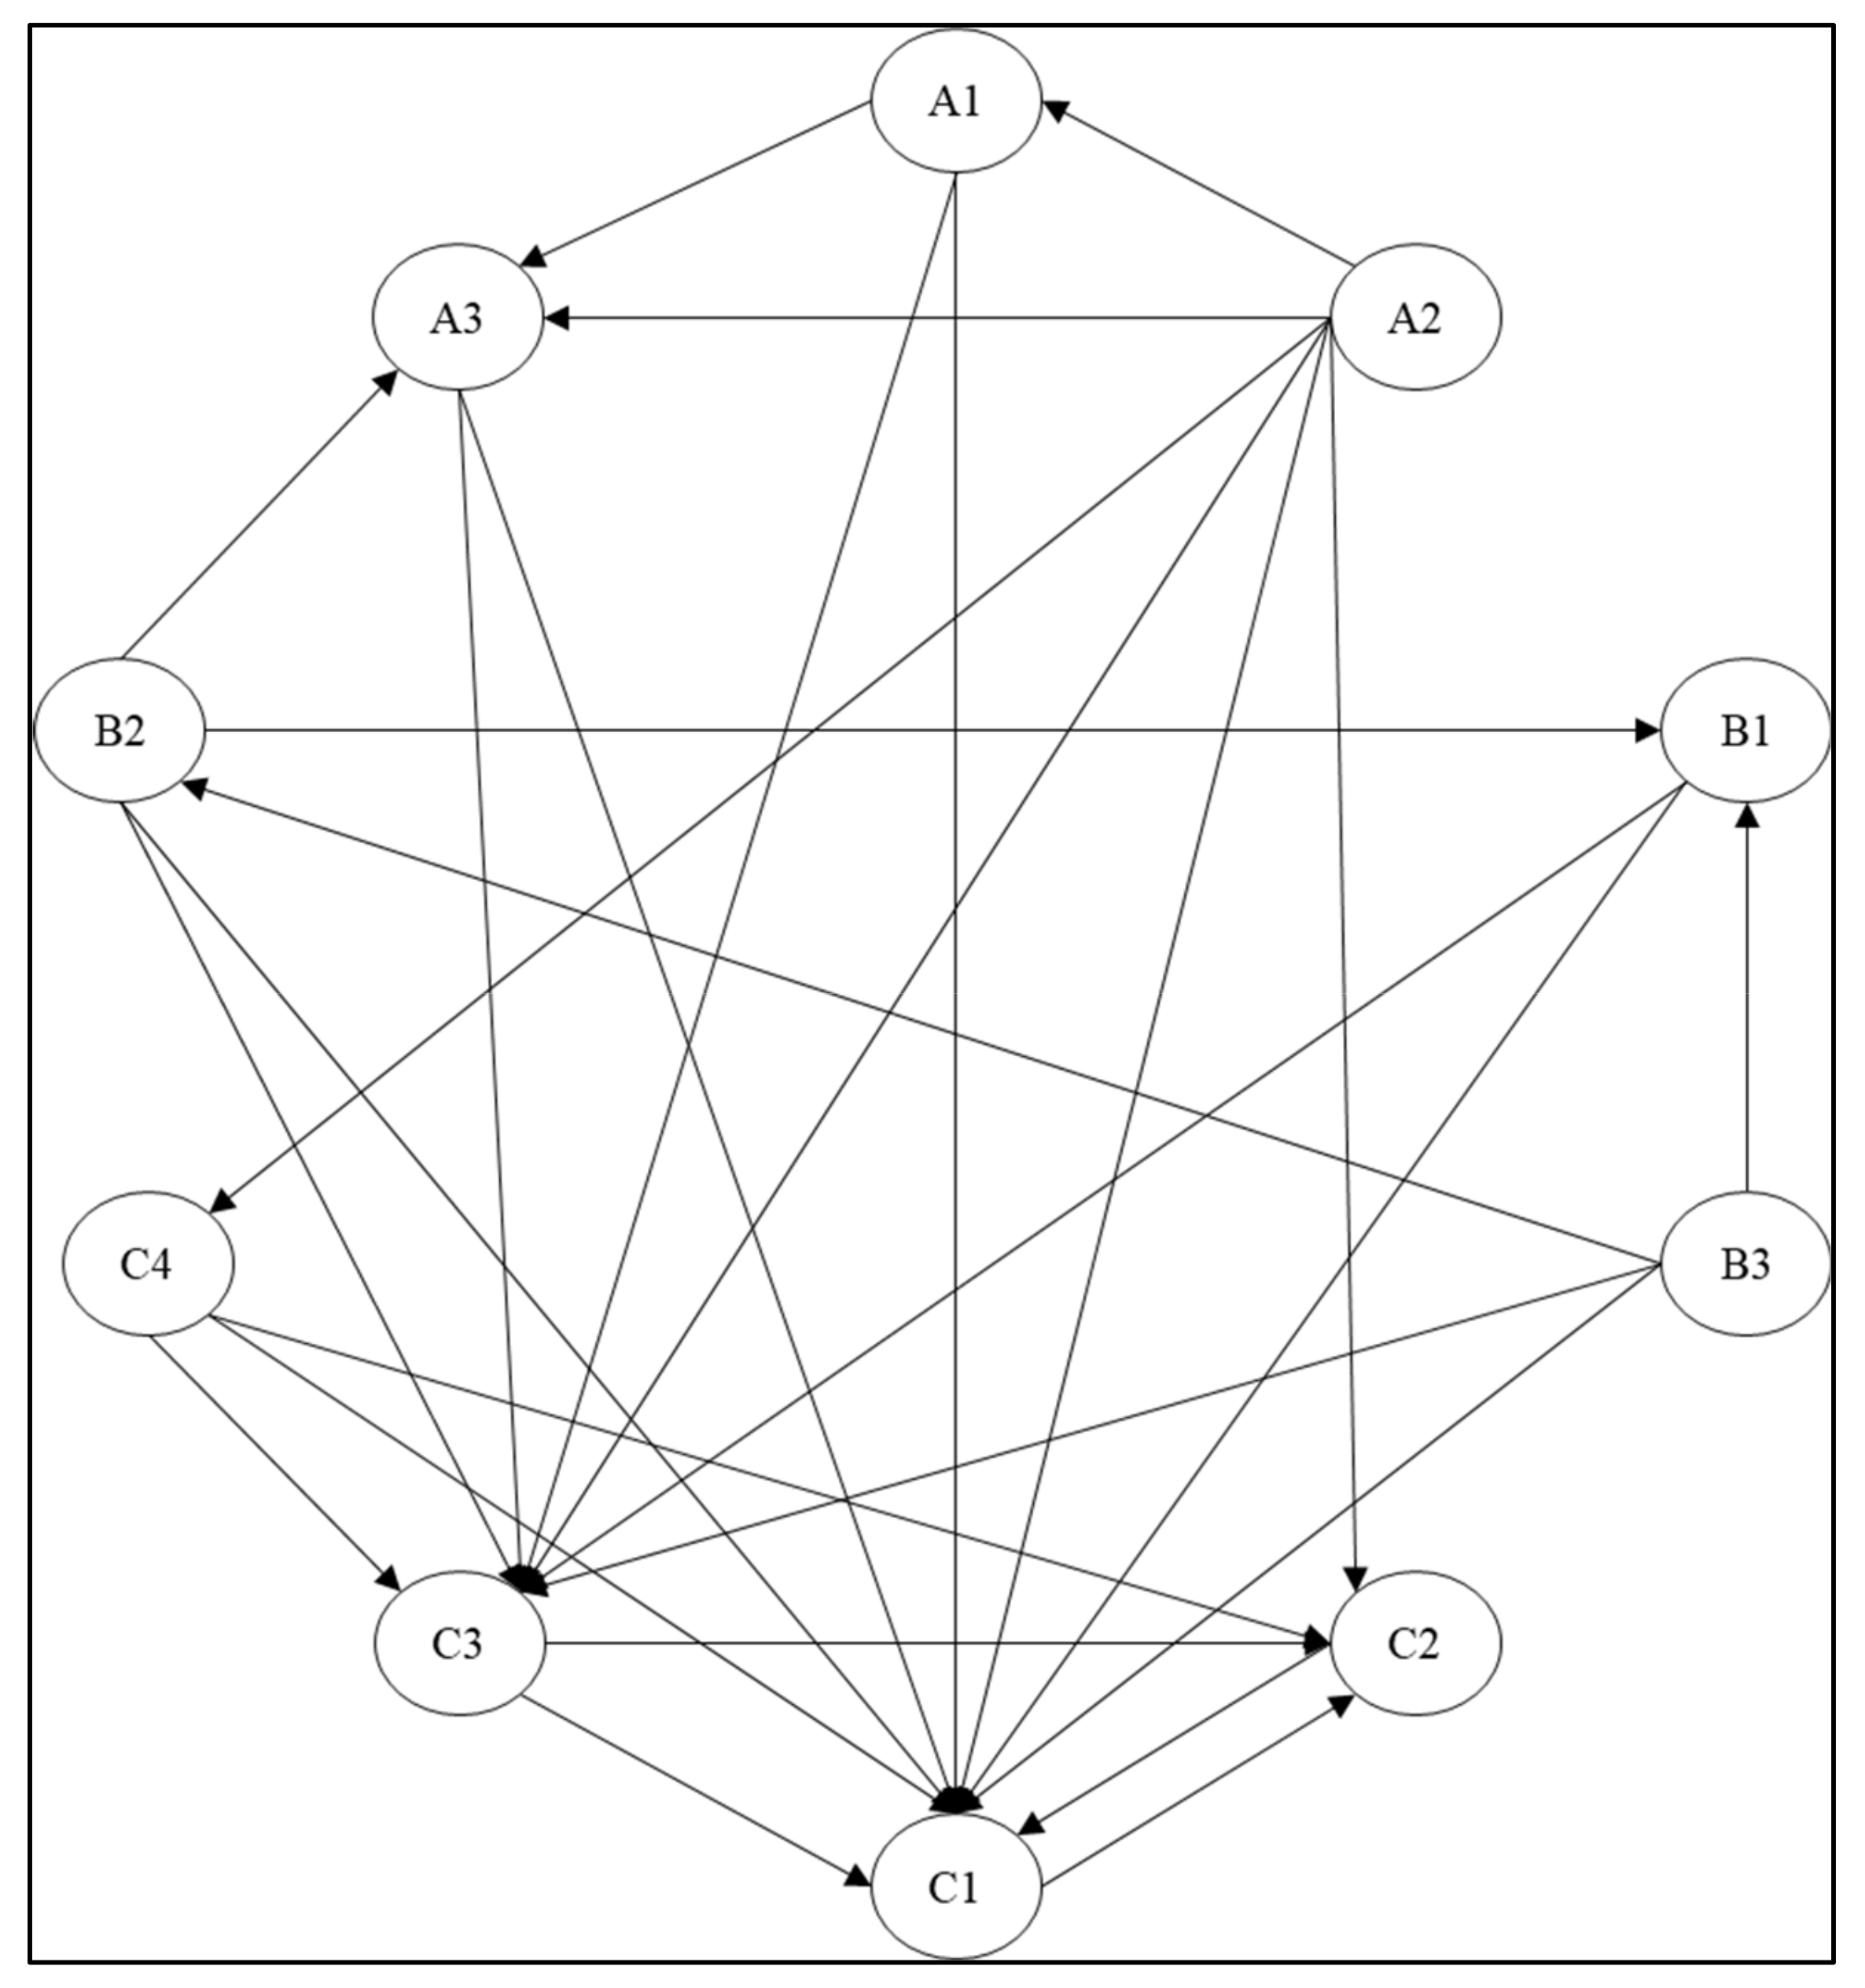
Based on the result obtained from Table 7, a cause-and-effect diagram was created, as shown in Figure 9, which explains the direct and indirect effect of criteria on each other.
Focusing on causal factors A1, A2, B2, B3, and C4 will result in a positive impact on all dimensions. For instance, insufficient or ineffective municipal and waste collection companies’ awareness campaigns (A2) will have major impacts on consumer participation in SSR programs that require consumers to identify recyclable materials and place them in appropriate containers (A3), manual sorting processes at MRFs (C3), SSR automated sorting process (C1), and condition of machine separation at MRFs (C2). When non-recyclables are placed in SSR household containers, therefore, non-recyclable materials can enter the SSR system through OCC inspections as illustrated in Figure 2, a manual process that often escapes documentation. Such practices not only present a risk of increased contamination but also increase equipment failure. For example, non-recyclable film plastic and plastic bags present unique challenges [21]. Contaminants of plastics lead to outthrows, which refer to plastics that are unsuitable for recycling since they are frequent causes of damage to recycling equipment [40]. Placing all plastics (recyclables and non-recyclables plastics) in a single bin makes sorting materials into different plastic categories at MRFs difficult [39]. Brooks et al. [70] assert that the nature of SSR operations also contributes to increased contamination in the recycling stream, especially for plastic materials [70]. Kail [71] supports this assertion and explains that higher SSR plastic contamination rates are due to the commingling of all types of materials.
Another important causal factor is the use of the most effective configuration and maintenance of recycling vehicles (B1) which also has a major impact on manual sorting processes at MRFs (C3) and the SSR automated sorting process (C1). For example, while all forms of glass are subject to breakage when loaded onto collection trucks, during transport, when unloading at the MRF, and during processing, Dhir et al. [72] found that multi-colored glass tended to have a higher rate of breakage. Broken glass requires repeated processing, making the result less desirable [10]. The MRF cap for breakage is 50%; thus, due to contamination and breaking, MRFs often designate broken glass as a residue [72]. Fitzgerald [73] reported that broken glass pieces from transportation and collection efforts increase the contamination of plastics and paper overall. Studies show that some improved efficiency is achievable through equipment replacement or upgrade. Miranda et al. [74] found that upgraded SSR sorting equipment reduced the contamination rate in one facility by 3.79%. This study supports the findings from Miranda et al.’s [74] study, since the type and condition of equipment (B2) at MRF is a causal factor contributing to the contamination problem. In addition to finding general inefficiencies, Miranda et al.’s [74] study suggested that inefficiency is also attributable to mixing some acceptable materials, such as glass, with other accepted recyclables in a single container. Further study is required to verify these findings.
The relations between all factors involved in the inbound stream contamination problem in SSR are illustrated and mapped in Figure 9.

6. Conclusions

In complex, real-life problems, identifying cause-and-effect relationships helps to better understand both the events that occur and the reasons why they occur in a system. The complexity of recycling processes and the limited participation of consumers make waste management a challenging issue despite its political popularity and the high praise that it has received.
This paper utilizes a robust and scientific technique, DEMATEL, to identify contamination causes in the inbound stream from SSR programs arriving at MRFs. This paper concludes that the SSR automated sorting process has the highest prominence in causing problems, with a prominence value (R + C) of 1.949. The lack of education and recycling awareness campaigns is second, with a prominence value (R + C) of 1.428. Moreover, the findings show that insufficient public awareness, insufficient municipal and waste collection companies’ awareness, the shape and condition of SSR containers, weather conditions, and insufficient training of workers at MRFs are causal factors, while consumer resistance to participation, configuration and maintenance of recycling vehicles, the SSR automated sorting process, types and conditions of machine separation at MRFs, and manual sorting processes at MRFs are affected factors.
It is not surprising that this study found the primary reason for contamination of inbound SSR waste to be the inefficiency of automated MRF sorting equipment. Consensus exists that material sorting in SSR is inefficient, given that SSR recycling transfers the work of sorting from individual consumers to MRFs. As a result, this study recommends upgrading the sorting equipment at SSR MRFs. As this study also found that a lack of awareness of how SSR programs operate increases the inbound contamination rate, it recommends that decision makers at SRR MRFs prepare appropriate campaigns to increase consumer and employee awareness and knowledge about SSR programs and the importance of separating recyclable and non-recyclable materials.
It is important that scholars continue to discover more causes of high contamination in SSR inbound streams. Additional investigation into the weights of each criterion’s influence on contamination may possibly assist in designing the best possible educational practice programs.
This paper suggests that future studies use an MCDM technique such as AHP, Ranking Alternatives by Perimeter Similarity (RAPS), Multiple Criteria Ranking by Alternative Trace (MCRT), VlseKriterijuska Optimizacija I Komoromisno Resenje (VIKOR), or TOPSIS to rank alternative educational methods to help choose the most effective means of achieving greater awareness for consumers and employees. Moreover, it is crucial to discover the accepted materials in SSR programs that cannot be recycled due to either the nature or the size of the material. For example, while all types of glass are prone to breakage when loaded onto collection trucks, during transportation and unloading into MRF and processing, broken pieces further contaminate plastic and paper materials. Therefore, studying the exclusion of glass materials from the SSR collection process or upgrading the screening equipment in MRFs will help decision makers in reducing SSR inbound contamination level.
Funding

This research received no external funding.

Institutional Review Board Statement

Not applicable.

Informed Consent Statement

Not applicable.

Data Availability Statement

The data supporting the findings of this study are available within the article.

Conflicts of Interest

The author declares no conflict of interest.

References

  1. Kanaoka, K. Forecasting the Value of Recyclable Waste Streams for a Circular Economy Transition in Orlando, Florida. Master’s Thesis, Duke University, Durhan, NC, USA, 2018. [Google Scholar]
  2. Maury-Ramírez, A.; Illera-Perozo, D.; Mesa, J.A. Circular Economy in the Construction Sector: A Case Study of Santiago de Cali (Colombia). Sustainability 2022, 14, 1923. [Google Scholar] [CrossRef]
  3. A Bafail, O.; Abdulaal, R.M. New approach for selecting a suitable recycling collection program for recovered paper and pulp recyclables using AHP-TOPSIS techniques. Waste Manag. Res. J. Sustain. Circ. Econ. 2021, 39, 1406–1413. [Google Scholar] [CrossRef] [PubMed]
  4. Maghmoumi, A.; Marashi, F.; Houshfar, E. Environmental and economic assessment of sustainable municipal solid waste management strategies in Iran. Sustain. Cities Soc. 2020, 59, 102161. [Google Scholar] [CrossRef]
  5. Xin, C.; Zhang, T.; Tsai, S.-B.; Zhai, Y.-M.; Wang, J. An Empirical Study on Greenhouse Gas Emission Calculations Under Different Municipal Solid Waste Management Strategies. Appl. Sci. 2020, 10, 1673. [Google Scholar] [CrossRef]
  6. Muhammad, L.J.; Badi, I.; Haruna, A.A.; Mohammed, I.; Academy, M.L. Selecting the Best Municipal Solid Waste Management Techniques in Nigeria Using Multi Criteria Decision Making Techniques. Rep. Mech. Eng. 2021, 2, 180–189. [Google Scholar] [CrossRef]
  7. Yousefloo, A.; Babazadeh, R. Designing an integrated municipal solid waste management network: A case study. J. Clean. Prod. 2019, 244, 118824. [Google Scholar] [CrossRef]
  8. Sörme, L.; Voxberg, E.; Rosenlund, J.; Jensen, S.; Augustsson, A. Coloured Plastic Bags for Kerbside Collection of Waste from Households—To Improve Waste Recycling. Recycling 2019, 4, 20. [Google Scholar] [CrossRef]
  9. Ventola, V.; Brenman, E.; Chan, G.; Ahmed, T.; Castaldi, M.J. Quantitative analysis of residential plastic recycling in New York City. Waste Manag. Res. J. Sustain. Circ. Econ. 2021, 39, 703–712. [Google Scholar] [CrossRef]
  10. Damgacioglu, H.; Perez, L.; Celik, N. Assessment and Evaluation of Contamination in Single Stream Recycling Systems Due to Broken Glass and Other Non-Recyclables; Hinkley Center for Solid and Hazardous Waste Management: Gainesville, FL, USA, 2018. [Google Scholar]
  11. Hefner, F. A Plan for Boosting Residential Material Recovery and Recycling in Alabama, No August. 2016. Available online: http://www.adem.state.al.us/programs/land/landforms/ARPReportFinal.pdf (accessed on 12 August 2022).
  12. United States Environmental Protection Agency. Advancing Sustainable Materials Management: 2018 Fact Sheet. 2020. Available online: https://www.epa.gov/sites/default/files/2020-11/documents/2018_ff_fact_sheet.pdf (accessed on 12 August 2022).
  13. Bafail, O.A.; Abdulaal, R.M. A Combined BWM-TOPSIS Approach Versus AHP-TOPSIS Approach: An Application to Solid Waste Management. In Proceedings of the 3rd International Conference on Industrial Engineering and Industrial Management, Barcelona, Spain, 12–14 January 2022; pp. 27–33. [Google Scholar] [CrossRef]
  14. Runsewe, T.; Bafail, O.; Celik, N. Performance analysis of waste collection programs in material recovery facilities. In Proceedings of the Institute of Industrial and Systems Engineers, New Orleans, LA, USA, 30 May–2 June 2020; pp. 1401–1406. [Google Scholar]
  15. Kibler, B.A.; Hanchett, J.; Lesik, N.; Mertz, J. Glass Recycling in Erie County. J. Glob. Bus. Manag. 2019, 15. [Google Scholar]
  16. Moore, K. Contamination: A Growing Challenge to Reaching Florida’ s 75% Recycling Goal. 2015. Available online: https://floridadep.gov/system/files/Single-Stream-Recycling-Contam-Webinar_21Dec15-508.pdf (accessed on 12 August 2022).
  17. Berger, L. 2014 AF&PA Community Survey (Executive Summary), no. February. 2015. Available online: http://www.afandpa.org/docs/default-source/default-document-library/2014-afpa_community-survey_exec-summary_final(1).pdf?sfvrsn=0 (accessed on 12 August 2022).
  18. Pressley, P.N.; Levis, J.W.; Damgaard, A.; Barlaz, M.A.; DeCarolis, J.F. Analysis of material recovery facilities for use in life-cycle assessment. Waste Manag. 2015, 35, 307–317. [Google Scholar] [CrossRef] [Green Version]
  19. Smith, R.L.; Takkellapati, S.; Riegerix, R.C. Recycling of Plastics in the United States: Plastic Material Flows and Polyethylene Terephthalate (PET) Recycling Processes. ACS Sustain. Chem. Eng. 2022, 10, 2084–2096. [Google Scholar] [CrossRef]
  20. Bafail, O. Comparative Analysis of Different Recycling Strategies for Paper and Pulp Contamination; University of Miami: Coral Gables, FL, USA, 2020. [Google Scholar]
  21. Damgacioglu, H.; Hornilla, M.; Bafail, O.; Celik, N. Recovering value from single stream material recovery facilities—An outbound contamination analysis in Florida. Waste Manag. 2020, 102, 804–814. [Google Scholar] [CrossRef] [PubMed]
  22. Waste Management. Driving Change; Waste Management: Houston, TX, USA, 2018. [Google Scholar]
  23. Abdel-Shafy, H.I.; Mansour, M.S.M. Solid waste issue: Sources, composition, disposal, recycling, and valorization. Egypt. J. Pet. 2018, 27, 1275–1290. [Google Scholar] [CrossRef]
  24. Colapinto, C.; Jayaraman, R.; Ben Abdelaziz, F.; La Torre, D. Environmental sustainability and multifaceted development: Multi-criteria decision models with applications. Ann. Oper. Res. 2020, 293, 405–432. [Google Scholar] [CrossRef]
  25. Kumar, A.; Sah, B.; Singh, A.R.; Deng, Y.; He, X.; Kumar, P.; Bansal, R.C. A review of multi criteria decision making (MCDM) towards sustainable renewable energy development. Renew. Sustain. Energy Rev. 2017, 69, 596–609. [Google Scholar] [CrossRef]
  26. Coelho, L.M.G.; Lange, L.; Coelho, H.M. Multi-criteria decision making to support waste management: A critical review of current practices and methods. Waste Manag. Res. J. Sustain. Circ. Econ. 2017, 35, 3–28. [Google Scholar] [CrossRef]
  27. Mazza Recycling. Mixed Paper Recycling Update; Mazza Recycling: Tinton Falls, NJ, USA, 2018. [Google Scholar]
  28. SWANA. What You Need to Know About China’s Waste Import Restrictions, SWANA. 2018. Available online: https://swana.org/Resources/RecyclingResources/ChinaWasteImportRestrictions.aspx (accessed on 15 January 2020).
  29. Flower, W. What Operation Green Fence Has Meant for Recycling, Waste 360. 2016. Available online: https://www.waste360.com/business/what-operation-green-fence-has-meant-recycling (accessed on 3 December 2019).
  30. Waste Dive. How Recycling Is Changing in All 50 States. 2019. Available online: https://www.wastedive.com/news/what-chinese-import-policies-mean-for-all-50-states/510751/ (accessed on 12 August 2022).
  31. Secondary Fiber Pricing. Secondary Materials Pricing. Recycling Markets Limited. 2019. Available online: http://www.recyclingmarkets.net/secondarymaterials/index.html (accessed on 20 September 2020).
  32. Snyder, M. Single Stream vs. Dual Stream. Facilities Services Recycling Waste Management. 2014. Available online: https://operations.tufts.edu/recycle/news/2014/10/06/single-stream-vs-dual-stream/ (accessed on 12 August 2022).
  33. Lubongo, C.; Alexandridis, P. Assessment of Performance and Challenges in Use of Commercial Automated Sorting Technology for Plastic Waste. Recycling 2022, 7, 11. [Google Scholar] [CrossRef]
  34. Andrady, A.L.; Neal, M.A. Applications and societal benefits of plastics. Philos. Trans. R. Soc. B Biol. Sci. 2009, 364, 1977–1984. [Google Scholar] [CrossRef]
  35. Ncube, L.; Ude, A.; Ogunmuyiwa, E.; Zulkifli, R.; Beas, I. An Overview of Plastic Waste Generation and Management in Food Packaging Industries. Recycling 2021, 6, 12. [Google Scholar] [CrossRef]
  36. Tesfaye, W.; Kitaw, D. Conceptualizing reverse logistics to plastics recycling system. Soc. Responsib. J. 2020, 17. [Google Scholar] [CrossRef]
  37. Compagno, F. Recycling 2020-Reduce, Reuse, and Recycle: The case Terracina-Filomena Compagno-Terracina Zero Waste activist, Italy. J. Nucl. Energy Power Gener. Technol. 2020, 4, 1–2. [Google Scholar]
  38. Cimpan, C.; Maul, A.; Jansen, M.; Pretz, T.; Wenzel, H. Central sorting and recovery of MSW recyclable materials: A review of technological state-of-the-art, cases, practice and implications for materials recycling. J. Environ. Manag. 2015, 156, 181–199. [Google Scholar] [CrossRef]
  39. Bell, J.; Huber, J.; Viscusi, W.K. Fostering Recycling Participation in Wisconsin Households through Single-Stream Programs. Land Econ. 2017, 93, 481–502. [Google Scholar] [CrossRef]
  40. Yasar, D.; Damgacioglu, H.; Bastani, M.; Celik, N. Assessment of the Impact of Single Stream Recycling on Paper Contamination in Recovery Facilities and Paper Mills. 2017. Available online: https://essayzilla.org/wp-content/uploads/2020/12/20190510073527assessmeny_of_the_impact_of_single_stream_recycling_on_paper_comntamination_in_recovery_facilites_and_paper_mills.pdf (accessed on 12 August 2022).
  41. Tonjes, D.J.; Aphale, O.; Clark, L.; Thyberg, K.L. Conversion from dual stream to single stream recycling results in nuanced effects on revenues and waste stream amounts and composition. Resour. Conserv. Recycl. 2018, 138, 151–159. [Google Scholar] [CrossRef]
  42. Bom, U.B.; Belbase, S.; Lila, R.B. Public Perceptions and Practices of Recycling in the City of Laramie in Wyoming. 2017. Available online: https://www.mdpi.com/2313-4321/2/3/11/pdf?version=1500722626 (accessed on 12 August 2022).
  43. Lakhan, C. A Comparison of Single and Multi-Stream Recycling Systems in Ontario, Canada. Resources 2015, 4, 384–397. [Google Scholar] [CrossRef]
  44. Morawski, C. Understanding Economic and Environmental Impacts of Single-Stream Collection Systems. Container Recycling Institute: Culver City, CA, USA, 2009; pp. 1–32. [Google Scholar]
  45. Farrell, M. Single stream MRF comes to New England. Biocycle 2003, 44, 46–49. [Google Scholar]
  46. Leblanc, R. How Recycling Can Boost Corporate Social Responsibility; The Balance Small Business: New York, NY, USA, 2018. [Google Scholar]
  47. Yedinak, E. Recycling Past and Present and the New Innovation Challenge for Materials at End-of-Life. J. Sci. Policy Gov. 2022, 20. [Google Scholar] [CrossRef]
  48. Koerth, M. The Era of Easy Recycling May Be Coming to an End. FiveThirtyEight. 2019. Available online: https://fivethirtyeight.com/features/the-era-of-easy-recycling-may-be-coming-to-an-end/ (accessed on 19 August 2022).
  49. Roper, E. Minnesota Recyclers Scrambling in Wake of Chinese Restrictions. Star Tribune. 2018. Available online: https://www.startribune.com/minnesota-recyclers-scrambling-in-wake-of-chinese-restrictions/488198641/ (accessed on 18 August 2022).
  50. Pyzyk, K. Lake Worth, Florida Reverting to Dual-Stream Collection Next Month. WESTDIVE. 2018. Available online: https://www.wastedive.com/news/lake-worth-florida-dual-stream-collection/531504/ (accessed on 18 August 2022).
  51. Staub, C. Dual-Stream Collection Regains Appeal in Some Areas. Resource Recycling, Inc. 2018. Available online: https://resource-recycling.com/recycling/2018/07/17/dual-stream-collection-regains-appeal-in-some-areas/ (accessed on 18 August 2022).
  52. Rosengren, C. Why Nebraska’s Biggest MRF Is Done with Commercial Single-Stream. WESTDIVE. 2018. Available online: https://www.wastedive.com/news/nebraska-biggest-mrf-done-with-commercial-single-stream/525855/ (accessed on 18 August 2022).
  53. Bashir, M.J.K.; Chong, S.-T.; Chin, Y.-T.; Yusoff, M.S.; Aziz, H.A. Single Waste Stream Processing and Material Recovery Facility (MRF); Springer: Berlin/Heidelberg, Germany, 2022. [Google Scholar] [CrossRef]
  54. Rosbach, D. Feasibility Analysis and a plan for Plastic Recycling Center. Worcester Polytechnic Institute. 2022. Available online: https://digital.wpi.edu/downloads/jm214s309 (accessed on 12 August 2022).
  55. Fitzgerald, G.C.; Krones, J.S.; Themelis, N.J. Greenhouse gas impact of dual stream and single stream collection and separation of recyclables. Resour. Conserv. Recycl. 2012, 69, 50–56. [Google Scholar] [CrossRef]
  56. Rousta, K.; Zisen, L.; Hellwig, C. Household Waste Sorting Participation in Developing Countries—A Meta-Analysis. Recycling 2020, 5, 6. [Google Scholar] [CrossRef]
  57. Leblanc, R. An Overview of Single Stream Recycling and Its Challenges; The Balance Small Business: New York, NY, USA, 2018. [Google Scholar]
  58. Coban, A.; Ertis, I.F.; Cavdaroglu, N.A. Municipal solid waste management via multi-criteria decision making methods: A case study in Istanbul, Turkey. J. Clean. Prod. 2018, 180, 159–167. [Google Scholar] [CrossRef]
  59. Arıkan, E.; Şimşit-Kalender, Z.T.; Vayvay, Ö. Solid waste disposal methodology selection using multi-criteria decision making methods and an application in Turkey. J. Clean. Prod. 2017, 142, 403–412. [Google Scholar] [CrossRef]
  60. Qazi, W.A.; Abushammala, M.F.; Azam, M.-H. Multi-criteria decision analysis of waste-to-energy technologies for municipal solid waste management in Sultanate of Oman. Waste Manag. Res. J. Sustain. Circ. Econ. 2018, 36, 594–605. [Google Scholar] [CrossRef] [PubMed]
  61. Shahnazari, A.; Rafiee, M.; Rohani, A.; Nagar, B.B.; Ebrahiminik, M.A.; Aghkhani, M.H. Identification of effective factors to select energy recovery technologies from municipal solid waste using multi-criteria decision making (MCDM): A review of thermochemical technologies. Sustain. Energy Technol. Assess. 2020, 40, 100737. [Google Scholar] [CrossRef]
  62. Alkaradaghi, K.; Ali, S.S.; Al-Ansari, N.; Laue, J.; Chabuk, A. Landfill Site Selection Using MCDM Methods and GIS in the Sulaimaniyah Governorate, Iraq. Sustainability 2019, 11, 4530. [Google Scholar] [CrossRef]
  63. Sisay, G.; Gebre, S.L.; Getahun, K. GIS-based potential landfill site selection using MCDM-AHP modeling of Gondar Town, Ethiopia. Afr. Geogr. Rev. 2020, 40, 105–124. [Google Scholar] [CrossRef]
  64. Van Thanh, N. Optimal Waste-to-Energy Strategy Assisted by Fuzzy MCDM Model for Sustainable Solid Waste Management. Sustainability 2022, 14, 6565. [Google Scholar] [CrossRef]
  65. Peleckis, K. Application of the DEMATEL Model for Assessing IT Sector’s Sustainability. Sustainability 2021, 13, 13866. [Google Scholar] [CrossRef]
  66. Chen, Y.; Wei, X.; Zhang, L.; Shi, Y. Sectoral Diversification and the Banks’ Return and Risk: Evidence from Chinese Listed Commercial Banks. Procedia Comput. Sci. 2013, 18, 1737–1746. [Google Scholar] [CrossRef]
  67. Atthirawong, W.; Panprung, W.; Leerojanaprapa, K. Using DEMATEL to Explore the Relationship of Factors Affecting Consumers’ Behaviors in Buying Green Product. In Proceedings of the 32nd European Conference on Modelling and Simulation, Wilhelmshaven, Germany, 22–25 May 2018; pp. 317–322. [Google Scholar] [CrossRef]
  68. Tzeng, G.-H.; Chiang, C.-H.; Li, C.-W. Evaluating intertwined effects in e-learning programs: A novel hybrid MCDM model based on factor analysis and DEMATEL. Expert Syst. Appl. 2007, 32, 1028–1044. [Google Scholar] [CrossRef]
  69. Thakkar, J.J. Multi-Criteria Decision Making; Springer: Berlin/Heidelberg, Germany, 2021; Volume 336. [Google Scholar]
  70. Brooks, A.L.; Wang, S.; Jambeck, J.R. The Chinese import ban and its impact on global plastic waste trade. Sci. Adv. 2018, 4, eaat0131. [Google Scholar] [CrossRef] [Green Version]
  71. Kail, B. Bins to Bales: Recycling ‘Still Working’ Despite Fiscal Stress. The Day, 2019. Available online: https://www.theday.com/local-news/20190518/bins-to-bales-recycling-still-working-despite-fiscal-stress/(accessed on 12 August 2022).
  72. Dhir, R.K.; Limbachiya, M.C.; Dyer, T.D. Autogenous Grinding of Glass Cullet in a stirred mill. In Recycling and Reuse of Glass Cullet; University of Exeter: Exeter, UK, 2001. [Google Scholar] [CrossRef]
  73. Fitzgerald, D. Recycling Contamination: Why Glass is Now Deemed Unrecyclable. The Times, 2019. [Google Scholar]
  74. Miranda, R.; Monte, M.C.; Blanco, A. Analysis of the quality of the recovered paper from commingled collection systems. Resour. Conserv. Recycl. 2013, 72, 60–66. [Google Scholar] [CrossRef]
Figure 7. Criteria hierarchy of inbound contamination in SSR programs.
Sustainability 14 10884 g007
Figure 8. Mapping cause and effect of inbound contamination in SSR programs.
Sustainability 14 10884 g008
Figure 9. Cause-and-effect diagram of inbound contamination in SSR programs.
Sustainability 14 10884 g009
Table 1. Examples of accepted recyclable materials in SSR.
CategorySub-CategoryDefinition
MetalAluminum CansEmpty aluminum beer, food cans, and soft drink cans.
Aluminum Foil and Pie PlatesAluminum foil, pie plates, and clean catering trays.
Tin/Steel CansTin-plated steel cans, usually food containers, and aerosol cans, as well as steel caps.
GlassMixed-Glass Containers and JarsClear, green, and amber glass bottles and jars.
PaperOld Corrugated Cardboard (OCC)Brown “cardboard” boxes with a wavy core.
NewspaperNewspaper including other paper normally distributed inside newspapers such as ads and flyers.
Mixed PaperOffice papers, printed, or unprinted paper including white, colored, coated, and uncoated papers, magazines, telephone books, catalogs, paperboard, chipboard, brown paper bags, mail, bagged shredded paper, and other printed material.
PlasticsPETColored and clear plastic bottles coded PET #1 such as soda bottle and, water bottles.
Natural HDPEClear plastic bottles coded HDPE #2 such as gallon water bottles and milk jugs.
Colored HDPEPigmented plastic bottles coded HDPE #2 such as shampoo and orange-juice bottles.
Mixed PlasticsAll plastic containers coded #3 to #7 such as pill bottles and gallon jugs.
Table 2. Evaluation score used in DEMATEL pairwise matrix.
Verbal JudgmentNumerical Scale
No influence0
Very low influence1
Low influence 2
High influence3
Very high influence4
Table 3. Dimensions for the inbound contamination in SSR.
Dimension Criteria
Awareness—AA1Insufficient public consumer awareness regarding identification of recyclables and non-recyclables.
A2Insufficient or ineffective municipal and waste collection companies’ awareness campaigns related to sorting recyclables and non-recyclables.
A3Consumer resistance to participation in recycling programs that require consumers to identify recyclable materials and place them in appropriate containers.
Inbound Materials—BB1Use of the most effective configuration and maintenance of recycling vehicles. As noted in earlier studies, glass shards are problematic in recycling paper. If improperly placed in a recycling vehicle, glass may become unusable.
B2The most effective shape and condition of SSR containers in household areas. Transferring recyclable materials from the consumer container to the collection vehicle typically does not involve human intervention. All containers used throughout the inbound transportation of recyclables must be of a design that limits breaking glass recyclables, resulting in downstream contamination of paper recyclables.
B3Weather conditions (e.g., rainy, cloudy, clear). Rain may reach recyclable materials, resulting in inbound contamination.
MRF—CC1SSR automated sorting process.
C2Types and condition of machine separation at MRFs. The separating equipment may be old and in need of replacement or upgrade.
C3Manual sorting processes at MRFs. Manual separation may introduce additional problems into the recycling process.
C4Insufficient awareness and training of workers in required manual sorting at MRFs.
Table 4. Matrix A represents experts’ opinions.
A1A2A3B1B2B3C1C2C3C4
A10040004040
A24040004044
A30000004040
B10000002010
B20011001010
B30003302020
C10000000100
C20000004010
C30000003100
C40000004340
Table 5. Dimension normalization of the direct relation of matrix D.
A1A2A3B1B2B3C1C2C3C4
A10.0000.0000.2000.0000.0000.0000.2000.0000.2000.000
A20.2000.0000.2000.0000.0000.0000.2000.0000.2000.200
A30.0000.0000.0000.0000.0000.0000.2000.0000.2000.000
B10.0000.0000.0000.0000.0000.0000.1000.0000.0500.000
B20.0000.0000.0500.0500.0000.0000.0500.0000.0500.000
B30.0000.0000.0000.1500.1500.0000.1000.0000.1000.000
C10.0000.0000.0000.0000.0000.0000.0000.0500.0000.000
C20.0000.0000.0000.0000.0000.0000.2000.0000.0500.000
C30.0000.0000.0000.0000.0000.0000.1500.0500.0000.000
C40.0000.0000.0000.0000.0000.0000.2000.1500.2000.000
Table 6. Relation matrix of total influence, matrix T.
A1A2A3B1B2B3C1C2C3C4
A10.0000.0000.2000.0000.0000.0000.2810.0260.2410.000
A20.2000.0000.2400.0000.0000.0000.3910.0660.3310.200
A30.0000.0000.0000.0000.0000.0000.2350.0220.2010.000
B10.0000.0000.0000.0000.0000.0000.1090.0080.0500.000
B20.0000.0000.0500.0500.0000.0000.0760.0070.0630.000
B30.0000.0000.0080.1580.1500.0000.1450.0130.1180.000
C10.0000.0000.0000.0000.0000.0000.0110.0510.0030.000
C20.0000.0000.0000.0000.0000.0000.2100.0130.0510.000
C30.0000.0000.0000.0000.0000.0000.1620.0580.0030.000
C40.0000.0000.0000.0000.0000.0000.2660.1740.2090.000
Table 7. Calculation of prominence, relation, weight, and final criteria weight.
R i C j R i   +   C j R i     C j W j W j ¯   =   W j j   =   1 n W j RankIdentity
A10.7490.2000.9490.5491.0960.0924Effect
A21.4280.0001.4281.4282.0200.1702Effect
A30.4570.4980.955−0.0400.9560.0816Cause
B10.1680.2080.375−0.0400.3770.03210Cause
B20.2460.1500.3960.0960.4070.0349Effect
B30.5910.0000.5910.5910.8350.0707Effect
C10.0641.8861.949−1.8222.6680.2251Cause
C20.2740.4380.712−0.1640.7300.0628Cause
C30.2231.2691.493−1.0461.8230.1543Cause
C40.6480.2000.8480.4480.9600.0815Effect
Publisher’s Note: MDPI stays neutral with regard to jurisdictional claims in published maps and institutional affiliations.