Article

Aggregate Evaluation and Geochemical Investigation of Limestone for Construction Industries in Pakistan: An Approach for Sustainable Economic Development

1
National Centre of Excellent in Geology, University of Peshawar, Peshawar 25130, Pakistan
2
GIS and Space Applications in Geosciences (GSAG), National Centre of GIS and Space Applications (NCGSA), Islamabad 44000, Pakistan
3
Institute of Chemical Sciences, University of Peshawar, Peshawar 25120, Pakistan
4
Department of Geology, Shaheed Benazir Bhutto University, Sheringal 18050, Pakistan
5
Department of Economic Geology and Geochemistry, Faculty of Geology and Geoenvironment, School of Earth Sciences, National and Kapodistrian University of Athens, Panepistiomiopolis, Zografou, 15784 Athens, Greece
6
Department of Historical Geology-Paleontology, Faculty of Geology and Geoenvironment, School of Earth Sciences, National and Kapodistrian University of Athens, Panepistimiopolis, Zografou, 15784 Athens, Greece
*
Authors to whom correspondence should be addressed.
Sustainability 2022, 14(17), 10812; https://doi.org/10.3390/su141710812
Submission received: 29 July 2022 / Revised: 22 August 2022 / Accepted: 23 August 2022 / Published: 30 August 2022
(This article belongs to the Special Issue Advances in Sustainable Construction and Building Materials)

Abstract

:
The present study investigates the aggregate suitability and geochemical characteristics of limestone (LS) from the Samana Suk Formation, Pakistan, for the construction industry. With the advent of CPEC, the demand for construction materials has seen a manifold increase. The Sheikh Budin Hills and Trans Indus Ranges comprise huge deposits of limestone and provide great potential for source rocks for construction materials in the region. In the Upper Indus Basin of Pakistan, the Samana Suk Formation is acknowledged as the most significant carbonate deposits of Mesozoic strata. The results of aggregate parameters reveal that specific gravity (SG = 2.6); water absorption (WA = 0.47%); bulk density (BD = 1.58 g/cm3); flakiness index (FI = 16.8%); elongation index (EI = 16.39%); soundness (S = 1.6%); aggregate impact value (AIV = 14%); Los Angeles Abrasion value (LAAV = 23.51%); clay lumps (CL = 0.35%); uniaxial compressive strength (UCS = 86.7 MPa); point load test (PLT = 5.18 MPa); ultrasonic pulse velocity (UPV = 5290 m/s); and Schmidt hammer rebound test (SHRT = 49 N) are in accordance with the ASTM, ISRM, and BSI. Petrographically, the LS is dominantly composed of ooids, peloids, bioclasts, and calcite mineral (CaCO3) with a trace concentration of dolomite [(Ca,Mg)CO3]. The mineralogical and geochemical study (n = 18) revealed that the LS is dominantly composed of calcite (95.81%); on average, it is composed of 52.08 wt.% CaO; 1.13 wt.% SiO2; 0.66 wt.% MgO; 0.80 wt.% Al2O3; and 0.76 wt.% Fe2O3, and loss on ignition (LOI) was recorded as 42.13 wt.%. On the other hand, P2O5, TiO2, MnO, K2O and Na2O were found in trace amounts. The regression analysis demonstrated that the empirical correlation equation for estimating uniaxial compressive strength with ultrasonic pulse velocity is more reliable than the Schmidt hammer rebound test and point load test. Consequently, the feasibility of using LS of the Samana Suk Formation as an aggregate for construction materials and cement manufacturing is recommended based on the testing results of mechanical, physical, and geochemical properties.

1. Introduction

The construction industry contributes significantly to the socio-economic development of a country. The demand for construction materials in Pakistan has increased exponentially since the start of the China–Pakistan Economic Corridor (CPEC) in 2015. In light of the CPEC projects, it is essential to explore new avenues for construction materials. Limestone (LS) is one of the most prevalent construction materials. It is an important sedimentary rock dominantly composed of calcite (CaCO3) mineral [1,2]. As a raw material, LS is widely used in many industries, especially in the construction and cement industries. The production of Portland cement mainly depends on the limestone availability, as it is the major raw material used in cement. Lime (CaO) produced by the ignition of pulverized calcite constitutes about 75% of the Portland cement’s composition [3]. Similarly, LS as an aggregate constitutes the major raw material of concrete. As an aggregate material via extracted quarrying operations and crushing, it is used in the construction of roads, buildings, bridges, and tunnel lining, and is essential for the development of the modern economy [4]. In order to evaluate aggregate suitability for any construction application, it is of the utmost necessity to perform a series of engineering tests, including specific gravity (SG); water absorption test (WA); bulk density (BD); flakiness index (FI); elongation index (EI); aggregate impact values (AIV); Los Angeles abrasion value (LAAV); uniaxial compressive strength (UCS); point load test (PLT); ultrasonic pulse velocity (UPV); and Schmidt hammer rebound test (SHRMT) [5].
Previously, researchers such as Ioannou et al. [6] and Ahsan et al. [7] worked on the suitability of limestone as an aggregate for construction purposes. Zarif and Tuğrul [8] studied the properties of the aggregate of limestone rocks in order to assess its use in concrete in Istanbul, Turkey. The outcomes of their study recommend the use of limestone in concrete. Likewise, Ben Salah et al. [9], Kayabaşı et al. [10], and Kamani and Ajalloeian [11] evaluated limestone for its usage in the construction industry. The influence of petrographic characteristics on the mechanical properties of limestone in Egypt was examined by Shinawi et al. [12]. Qaid et al. [13] and Hussain et al. [14] conducted a study on the geochemical and physical assessment of limestone. Similarly, Bilqees and Shah [15] worked on limestone deposits in the Kohat area, Pakistan, for industrial applications, and suggested its suitability for cement production. Jan et al. [16] studied limestone from the Nizampur area and recommend its use in the cement, glass, and paper industries. Bilqees et al. [17] evaluated the Abbottabad limestone and found that it can be used in various industries, including cement production. Bilqees et al. [18] also worked on the Samana Suk Formation, Kawagarh Formation, Lockhart Limestone, and Margalla Hill Limestone of the Abbottabad area and qualified them for cement and construction usage. Naeem et al. [19] carried out physio-mechanical studies of limestone rocks in the Abbottabad, Cherat, and Taxila areas of Pakistan. Likewise, Malahat et al. [20] and Rehman et al. [21] worked on the aggregate suitability of limestone in Khyber Pakhtunkhwa. Sakesar limestone at the Salt Range was studied by Hassan et al. [22]. Moreover, Rehman et al. [23] and Asif et al. [24] evaluated the suitability of limestone from the Kohat area for its usage as an aggregate. However, there are still huge reserves of limestone in Pakistan that have not yet been evaluated.
A large number of correlation equations for estimating the UCS using the PLT, UPV, and SHRT have been developed over time. Broch and Franklin [25], Bieniawski [26], Cargill and Shakoor [27], Akram and Bakar [28], and Salah, et al. [29] developed correlation equations for the estimation of UCS from PLT. Similarly, Sharma and Singh [30], Kurtuluş et al. [31], Yagiz [32], and Sarkar et al. [33] formulated correlation equations for the calculation of UCS from UPV. For the estimation of UCS from SHRT, Singh et al. [34], Sheorey [35], Haramy and DeMarco [36], O’Rourke [37], and Shalabi et al. [38] developed correlation equations. However, no such correlation equations for the estimation of UCS have been developed by researchers on the local geology of Pakistan. Moreover, most of the above researchers developed single correlation equations based on a variety of rocks, which underestimates the authenticity of these equations. Using these correlation equations for all types of rocks results in UCS values with large variability. Therefore, an attempt has been made in the current study to develop empirical correlation models to be used for specific rock types and local geology. These models will be beneficial for geologists, engineers, and researchers in conducting studies on similar types of rocks. For this purpose, the LS of the Samana Suk Formation (SSF) of the Middle Jurassic age was selected for the present investigation. The SSF is a commonly distinguishable stratum spread over a wide area of northern Pakistan. It is regarded as the most dominant lithological strata of carbonates in the Mesozoic strata of the Samana Range (SR); Kohat Tribal Range (KTR); Trans Indus Ranges (TIR); Salt Range (SR); Kala Chitta Range (KCR); and Hazara Mountains (HM) [39]. The data obtained were also subjected to a regression analysis to establish a correlation between different characteristic features.
The current research work is designed as a continuation of the earlier research works, in order to assess the unexplored and untested limestone resources of the Southern Khyber Pakhtunkhwa, Pakistan, where limestone deposits are abundant. Furthermore, the scope of this study aims to establish simple correlation equations of UCS with PLT, UPV, and SHRT.

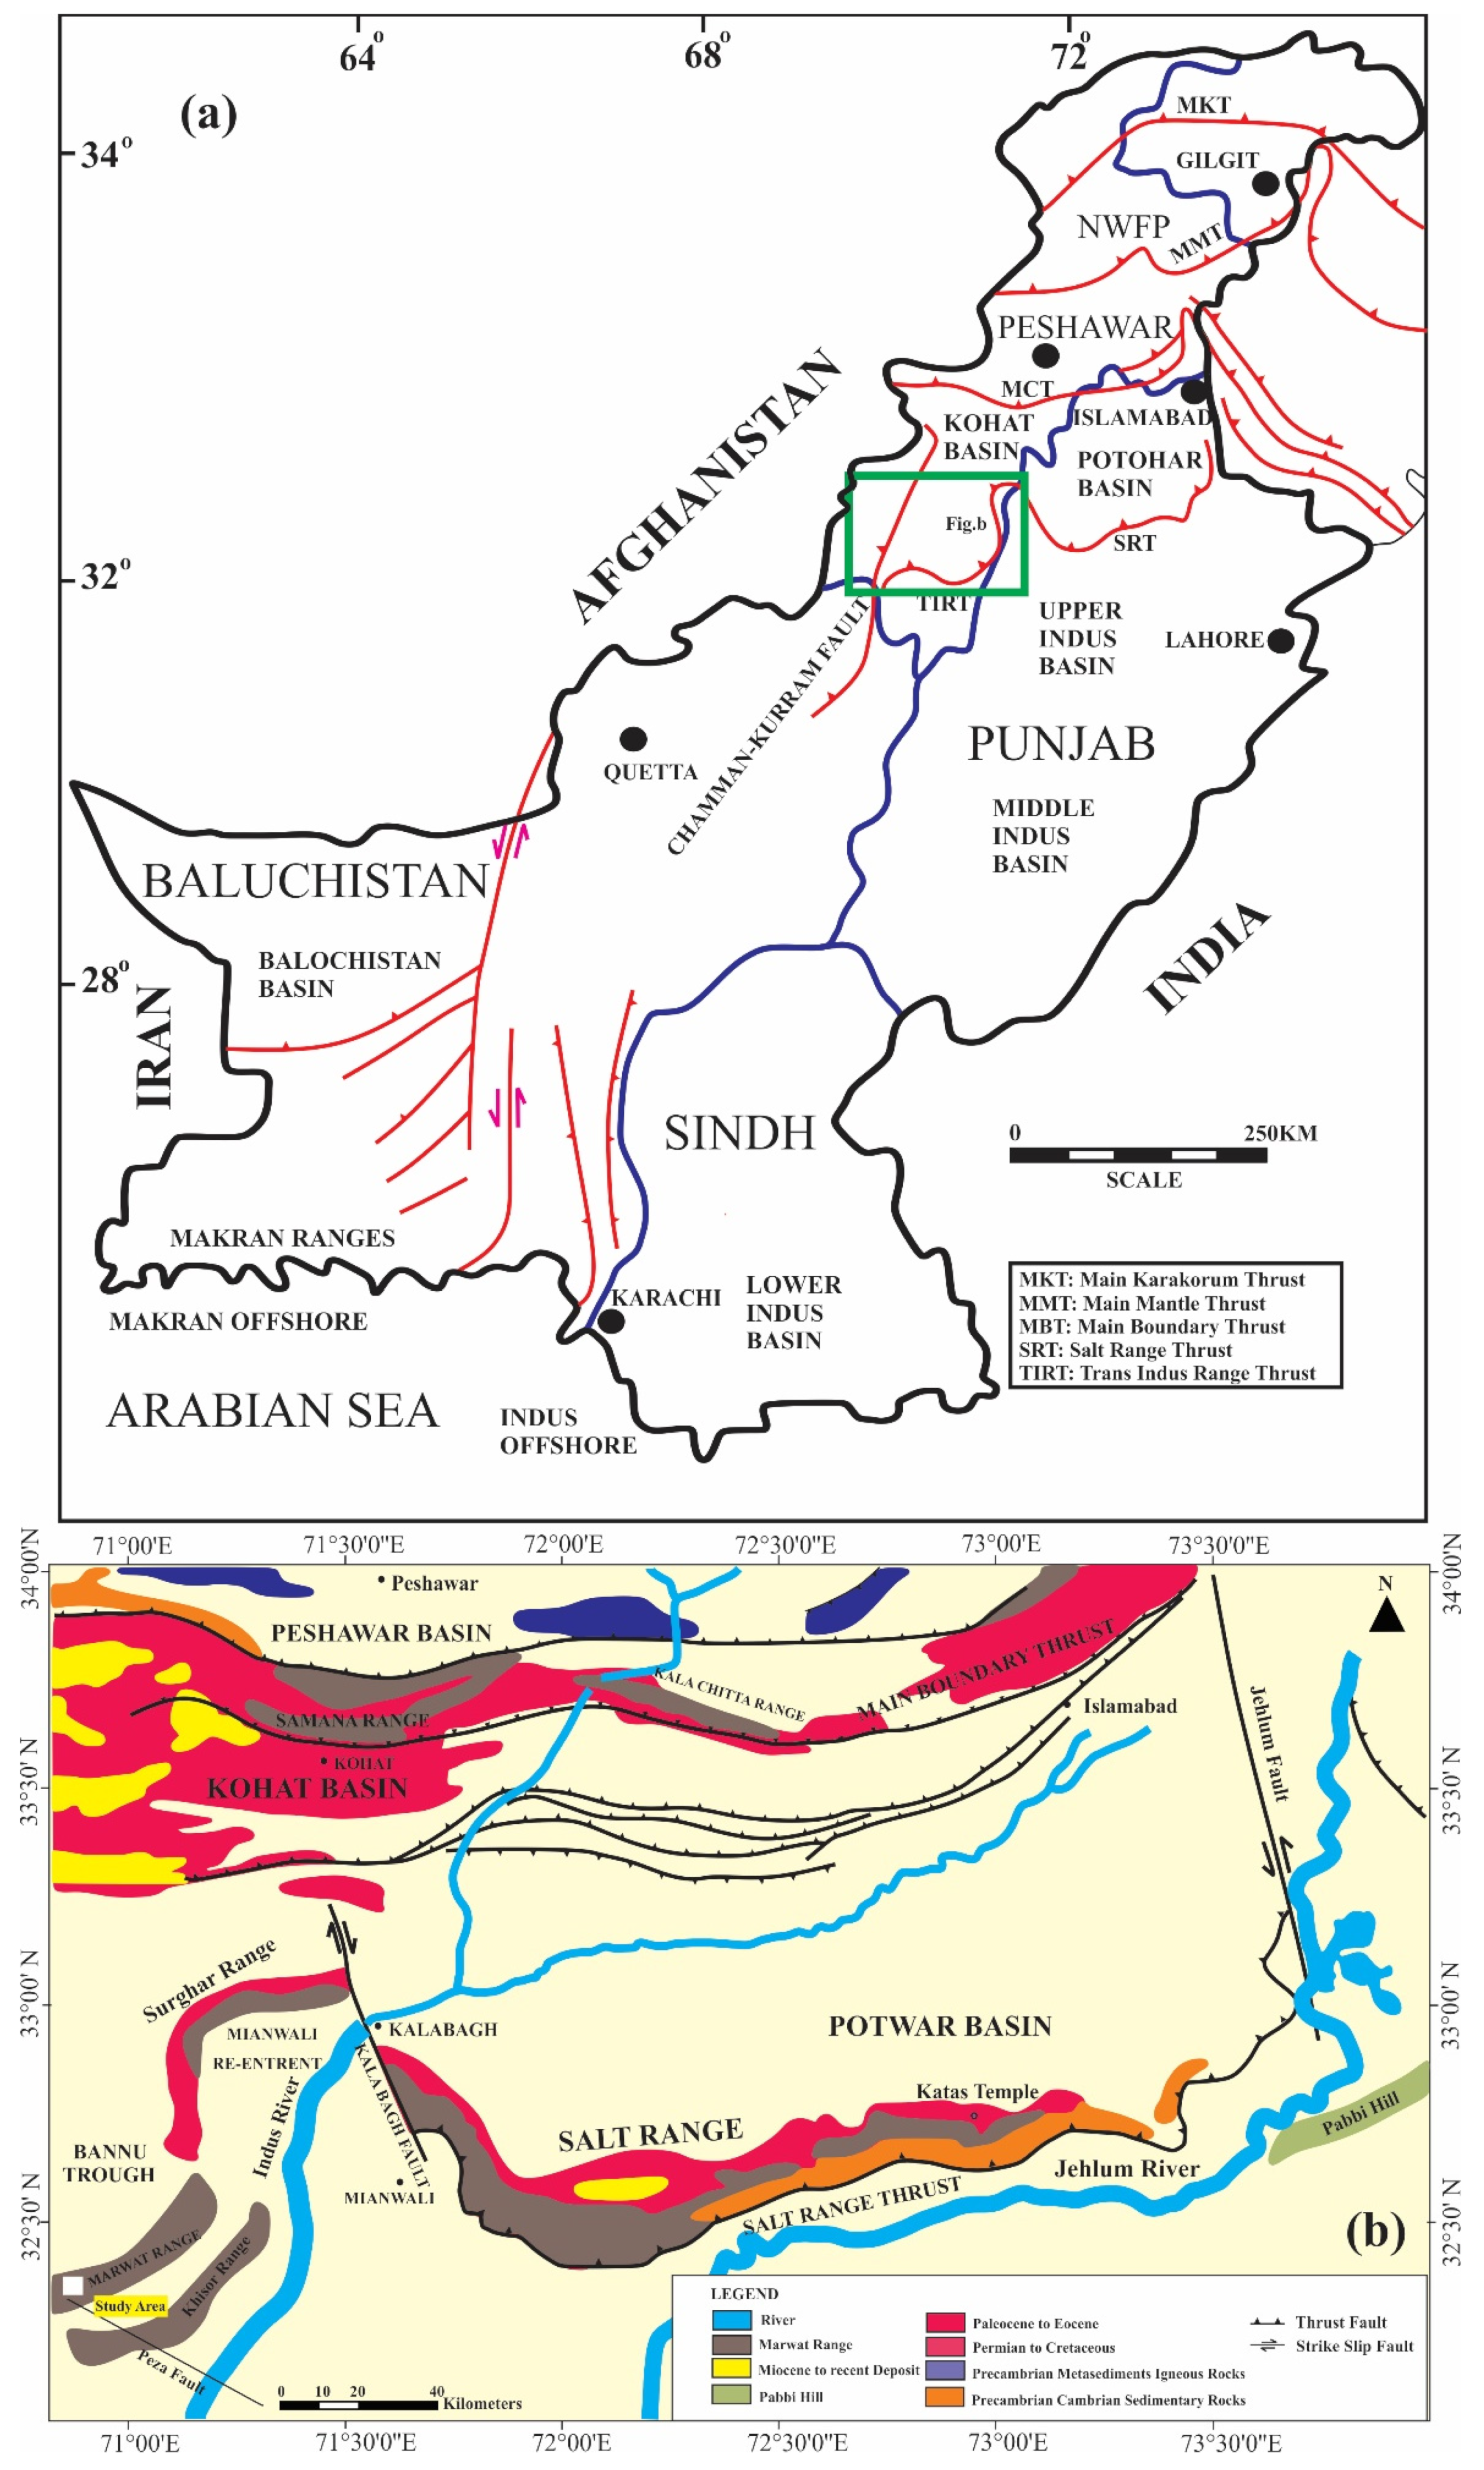
2. Geological Setting

The western extension of the Salt Range constitutes the TIR in the lesser Himalayas. The study area is the south-western part of the Marwat Range (MR) in the TIR, as shown in Figure 1. Structurally, the study area possesses many thrust faults: Sheikh Budin Thrust, Pezu Fault, and Paniala Fault [40,41]. Stratigraphically, the study area is composed of rocks ranging from the Early Permian to the Pliocene–Pleistocene with three main unconformities [42]. The Datta Formation and SSF of the Jurassic age are well developed (Figure 2). The SSF is mainly composed of limestone, which is yellowish-brown and grey in color, as shown in Figure 2.

3. Materials and Methods
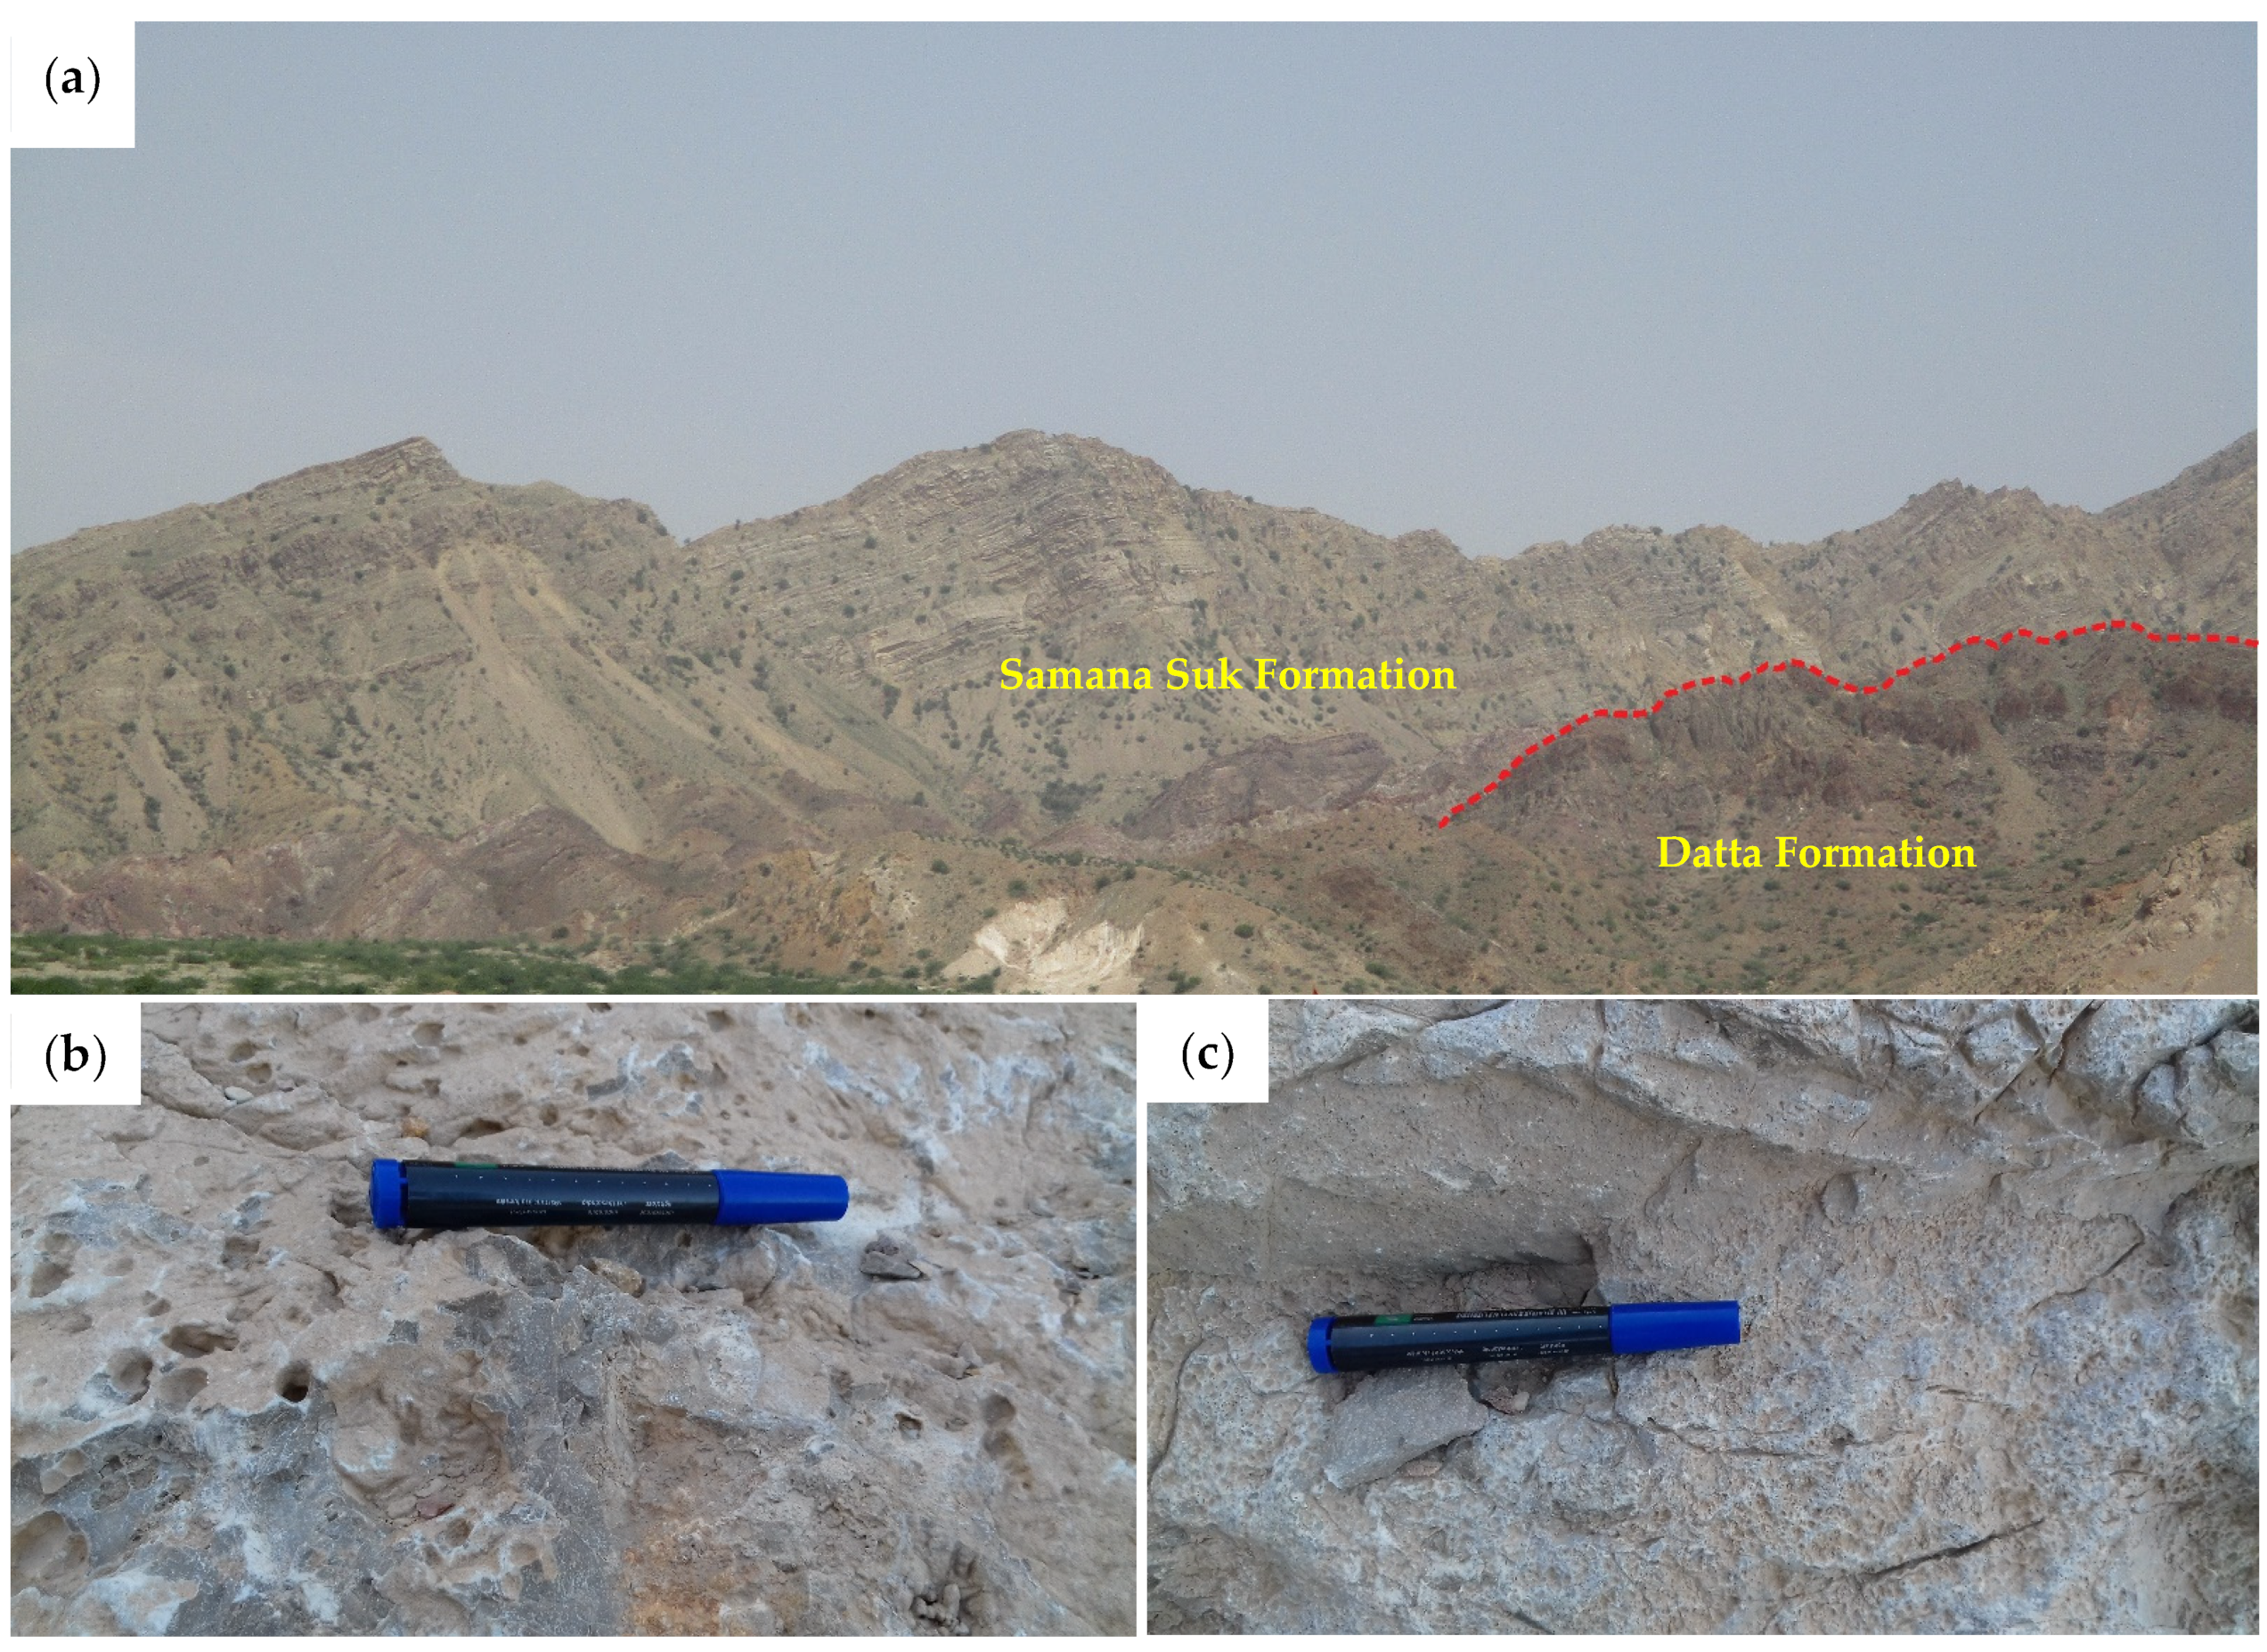
3.1. Study Area

This study was conducted along the Sheikh Budin Hills (SBH) section, situated in the District of Laki Marwat at a distance of 8 km. This area lies in Toposheet No. 38 L/15 of the Survey of Pakistan at Latitude 32°17′43″ N and Longitude 70°45′10″ E (Figure 1). In the SBH section, the SSF is composed of massive and medium to thick-bedded limestone. This section is accessible from Peshawar through Laki Marwat in the northeast and Dera Ismail Khan in the south via the Indus Highway. The thickness of the SSF in the studied section is 87.57 m [44].

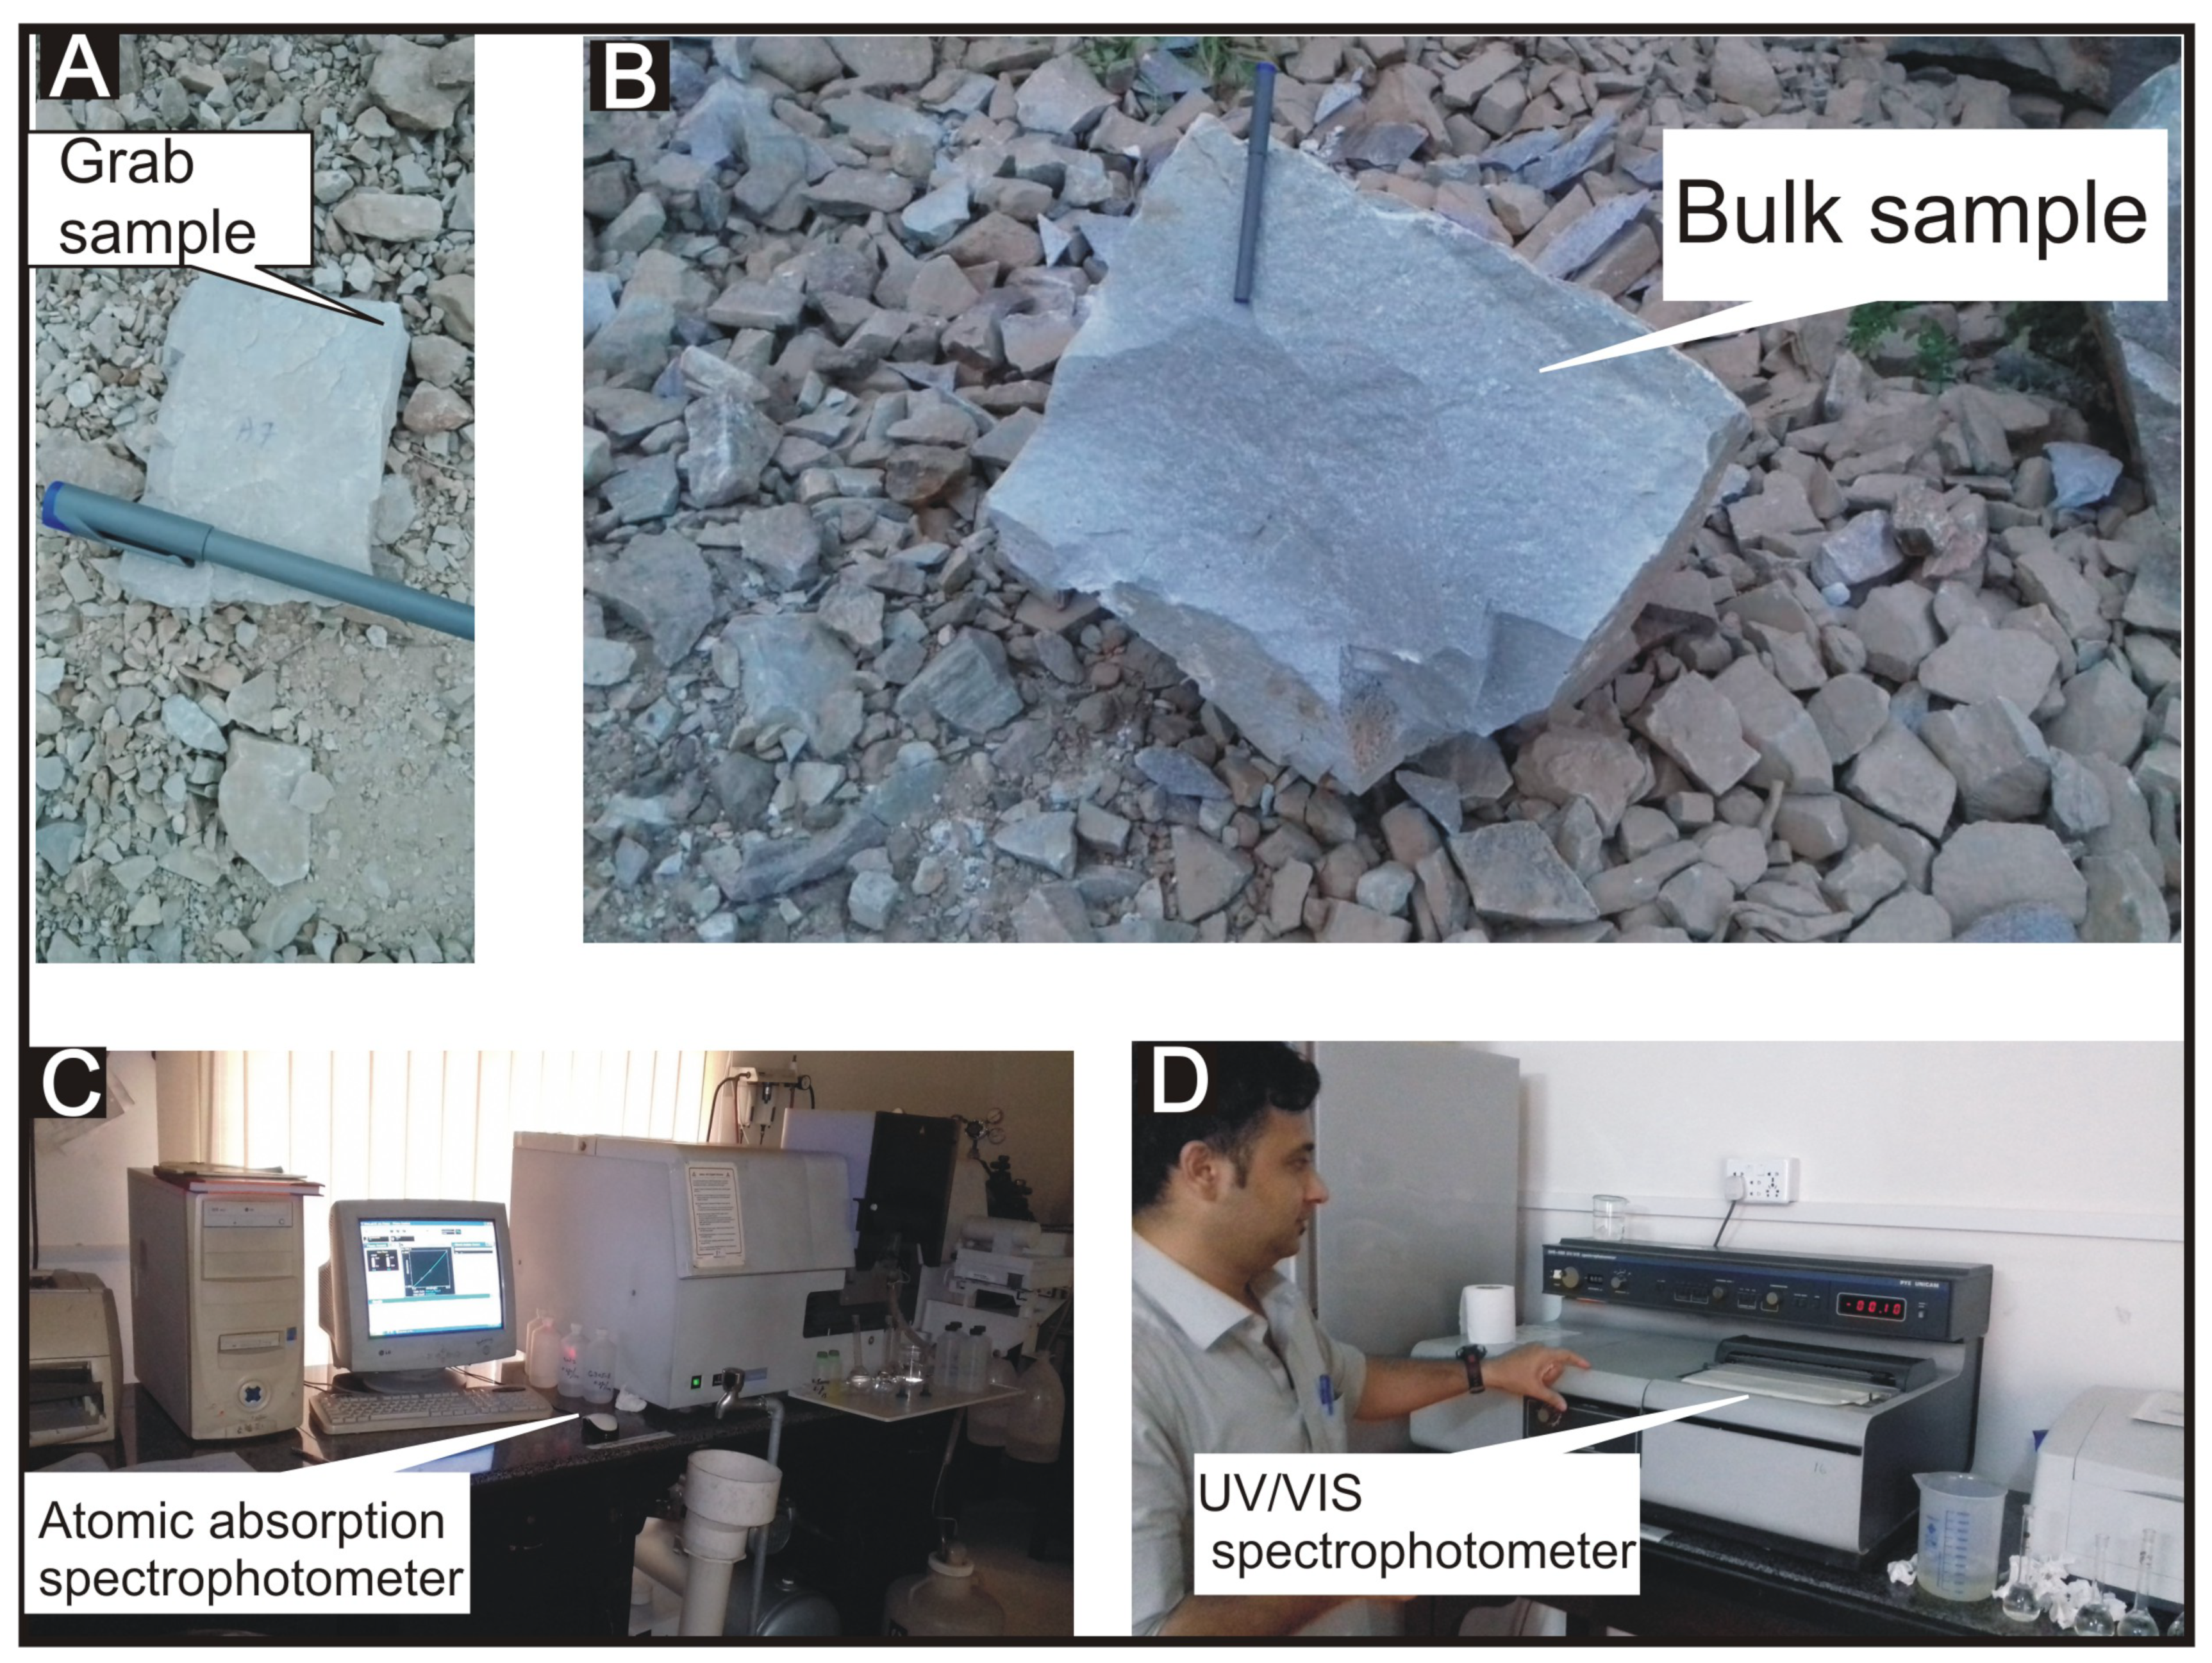
3.2. Samples Collection and Testing Procedure

An 87.5 m thick section of the SSF at SBH was sampled and geological observations were recorded. Two types of rock samples were collected: grab samples for geochemical analysis, i.e., major oxides evaluation, and for petrographic studies; and bulk samples for the determination of mechanical properties (Figure 3A,B). The rock samples were mainly limestone and were fresh, homogeneous, isotropic, and with no major discontinuity or macroscopic structural phenomenon. To preserve the in situ conditions, the rock specimens were saturated before measuring the rock properties. The collected samples were evaluated for BD ASTM C29 [45]; BS812-112 [46]; SG and WA tests ASTM C127 [47]; FI and EI ASTM D4791 [48]; aggregate soundness test ASTM C88-05 [49]; AIV BS 812–112 [50]; CL and friable particles ASTM C142/C142M-10 [51]; LAAV ASTM C131 [52]; and the compressive strength of cubes ASTM C170-16 [53]. PLT ASTM D5731-95 [54]; UPV ASTM D2845-00 [55]; and SHRMT ASTM D5873-00 [56] were performed to determine the physical and mechanical properties of LS. All the engineering tests were performed according to the different international standards of ASTM, ISRM, and BSI. The cube specimens for UCS were prepared by 3″ by 3″ in all dimensions. Major oxides determinations including (CaO, MgO, Na2O, K2O, MnO, P2O5, TiO2, Fe2O3, and Al2O3) were conducted using atomic absorption spectrophotometer (Model AA700, PerkinElmer, Waltham, MA, USA) and UV/VIS spectrophotometer (UV/VIS 400 technique) in the National Centre of Excellence in Geology, University of Peshawar, Pakistan (Figure 3C,D). The ASTM C289-07 [57] test was performed to explore the alkali–silica reactivity of the aggregate of the LS: a chemical reaction takes place under specific humid conditions between the silica that exists in aggregate and alkalis present in the cement, thus, forming an alkali–silica gel which leads to swelling/expansion owing to the absorption of water and, eventually, results in the cracking of concrete.

3.3. Petrography

The petrographic analysis is used to assess the mineral composition of aggregate parameters and infuse the reactive constituents. The detailed petrography was performed by ASTM C295 [58] to observe the various depositional and diagenetic fabrics and to explain the possible effects of these depositional and diagenetic fabrics on the engineering properties of the investigated rocks.

3.4. Statistical Analysis

A statistical analysis such as the Pearson correlation matrix analysis (PCMA) was performed by the XLSTAT version. Graphical representation was carried out by Sigma plot (ver.12.5, 2016 Systat Software, Inc., San Jose, CA, USA) For the comparison of the analytical results, descriptive statistics were carried out for standard deviation, mean, minimum, and maximum, using Microsoft Excel 2013.

4. Results and Discussion

4.1. Engineering Properties

The measured minimum, maximum, and mean values of all the geo-mechanical parameters of limestone are within BSI (British Standards International) and ASTM (American Standards for Testing Material) standards limits for road and concrete aggregate, and these are presented in Table 1. Table 2 demonstrates the measured minimum, maximum, and mean values of UCS, PLT, UPV, and SHRT. The SG of the studied samples ranges from 2.66 to 2.67 (2.66). According to ASTM C127 [47], the value of SG for the aggregate used in concrete should not be less than 2.6, and WA should not exceed 2.5%. Thus, the value obtained is within the range of the ASTM. The BD varies from 1.54 to 1.59 g/cm3 (1.58 g/cm3). The calculated values of the BD of the aggregate samples are well within the permissible range. The values of FI and EI of the limestone samples range from 15.20 to 19.40% (16.84%) and 14.12–18.80% (16.39%), respectively, which are within the limits of BS 812 105.1 [59] and BS 812 105.2 [60], respectively. FI and El are physical properties that are related to the shape of the aggregate fragments. Higher values indicate lower strength and anisotropic properties when used as aggregate for road and concrete [19,61].
The soundness value ranges from 1.3 to 1.9% (1.6%), which shows that all the aggregate samples of the SSF are well within the permissible range (<12%) of ASTM C88-05 [49]. The AIV is an important index test that provides instant measures of the pulverization resistance of an aggregate against abrupt shock and impact [62]. The AIV of the LS samples ranges from 12.37 to 16.44% (14.07%). Thus, the aggregate impact values are well within the range of the permissible limits of BS 812. The LAAV ranges from 21.76% to 26.04% (23.51%), which is less than 40%, as quantified by ASTM C131 [52]. The lower the value of LAAV, the greater the durability of the aggregate, while the higher the value, the lesser the durability. Clay lump and friable particles vary from 0.24 to 0.42% (0.35%), less than 1%, as specified by ASTM C142/C142M-10 [51]. The UCS of the limestone cubes from the Samana Suk Formation ranges from 73.83 to 101.47 MPa (86.77 MPa) (Table 2), which is in the category of high strength, according to the International Society for Rock Mechanics [63], while Selby [64] classified them as moderately strong rocks. The desirable UCS values for the specimens made with aggregates of strong and competent limestone rocks range from 50 to 100 MPa [65]. Furthermore, PLT values vary from 4.76 to 5.89 MPa (5.18 MPa), which makes those rocks strong, according to the strength classification of rocks by Selby [64]. UPV ranges from 4853.50 to 5729.32 m/s (5290.08 m/s), which falls into the excellent category, according to a study conducted by Malhotra [66] on crushed limestone in concrete, while SHRT varies from 43 to 58 N (49 N) (Table 2). The SHRT values place the LS in the category of moderately strong to strong rocks [64].
The obtained values of SG, WA, FI, EI, AIV, and LAAV are consistent with the findings of Naeem et al. [19], and Bilqees et al. [18]. Similarly, the results of PLT are in agreement with results of Akram et al. [67] conducted on the Sakesar limestone, while they differs in the case of the values of UCS.

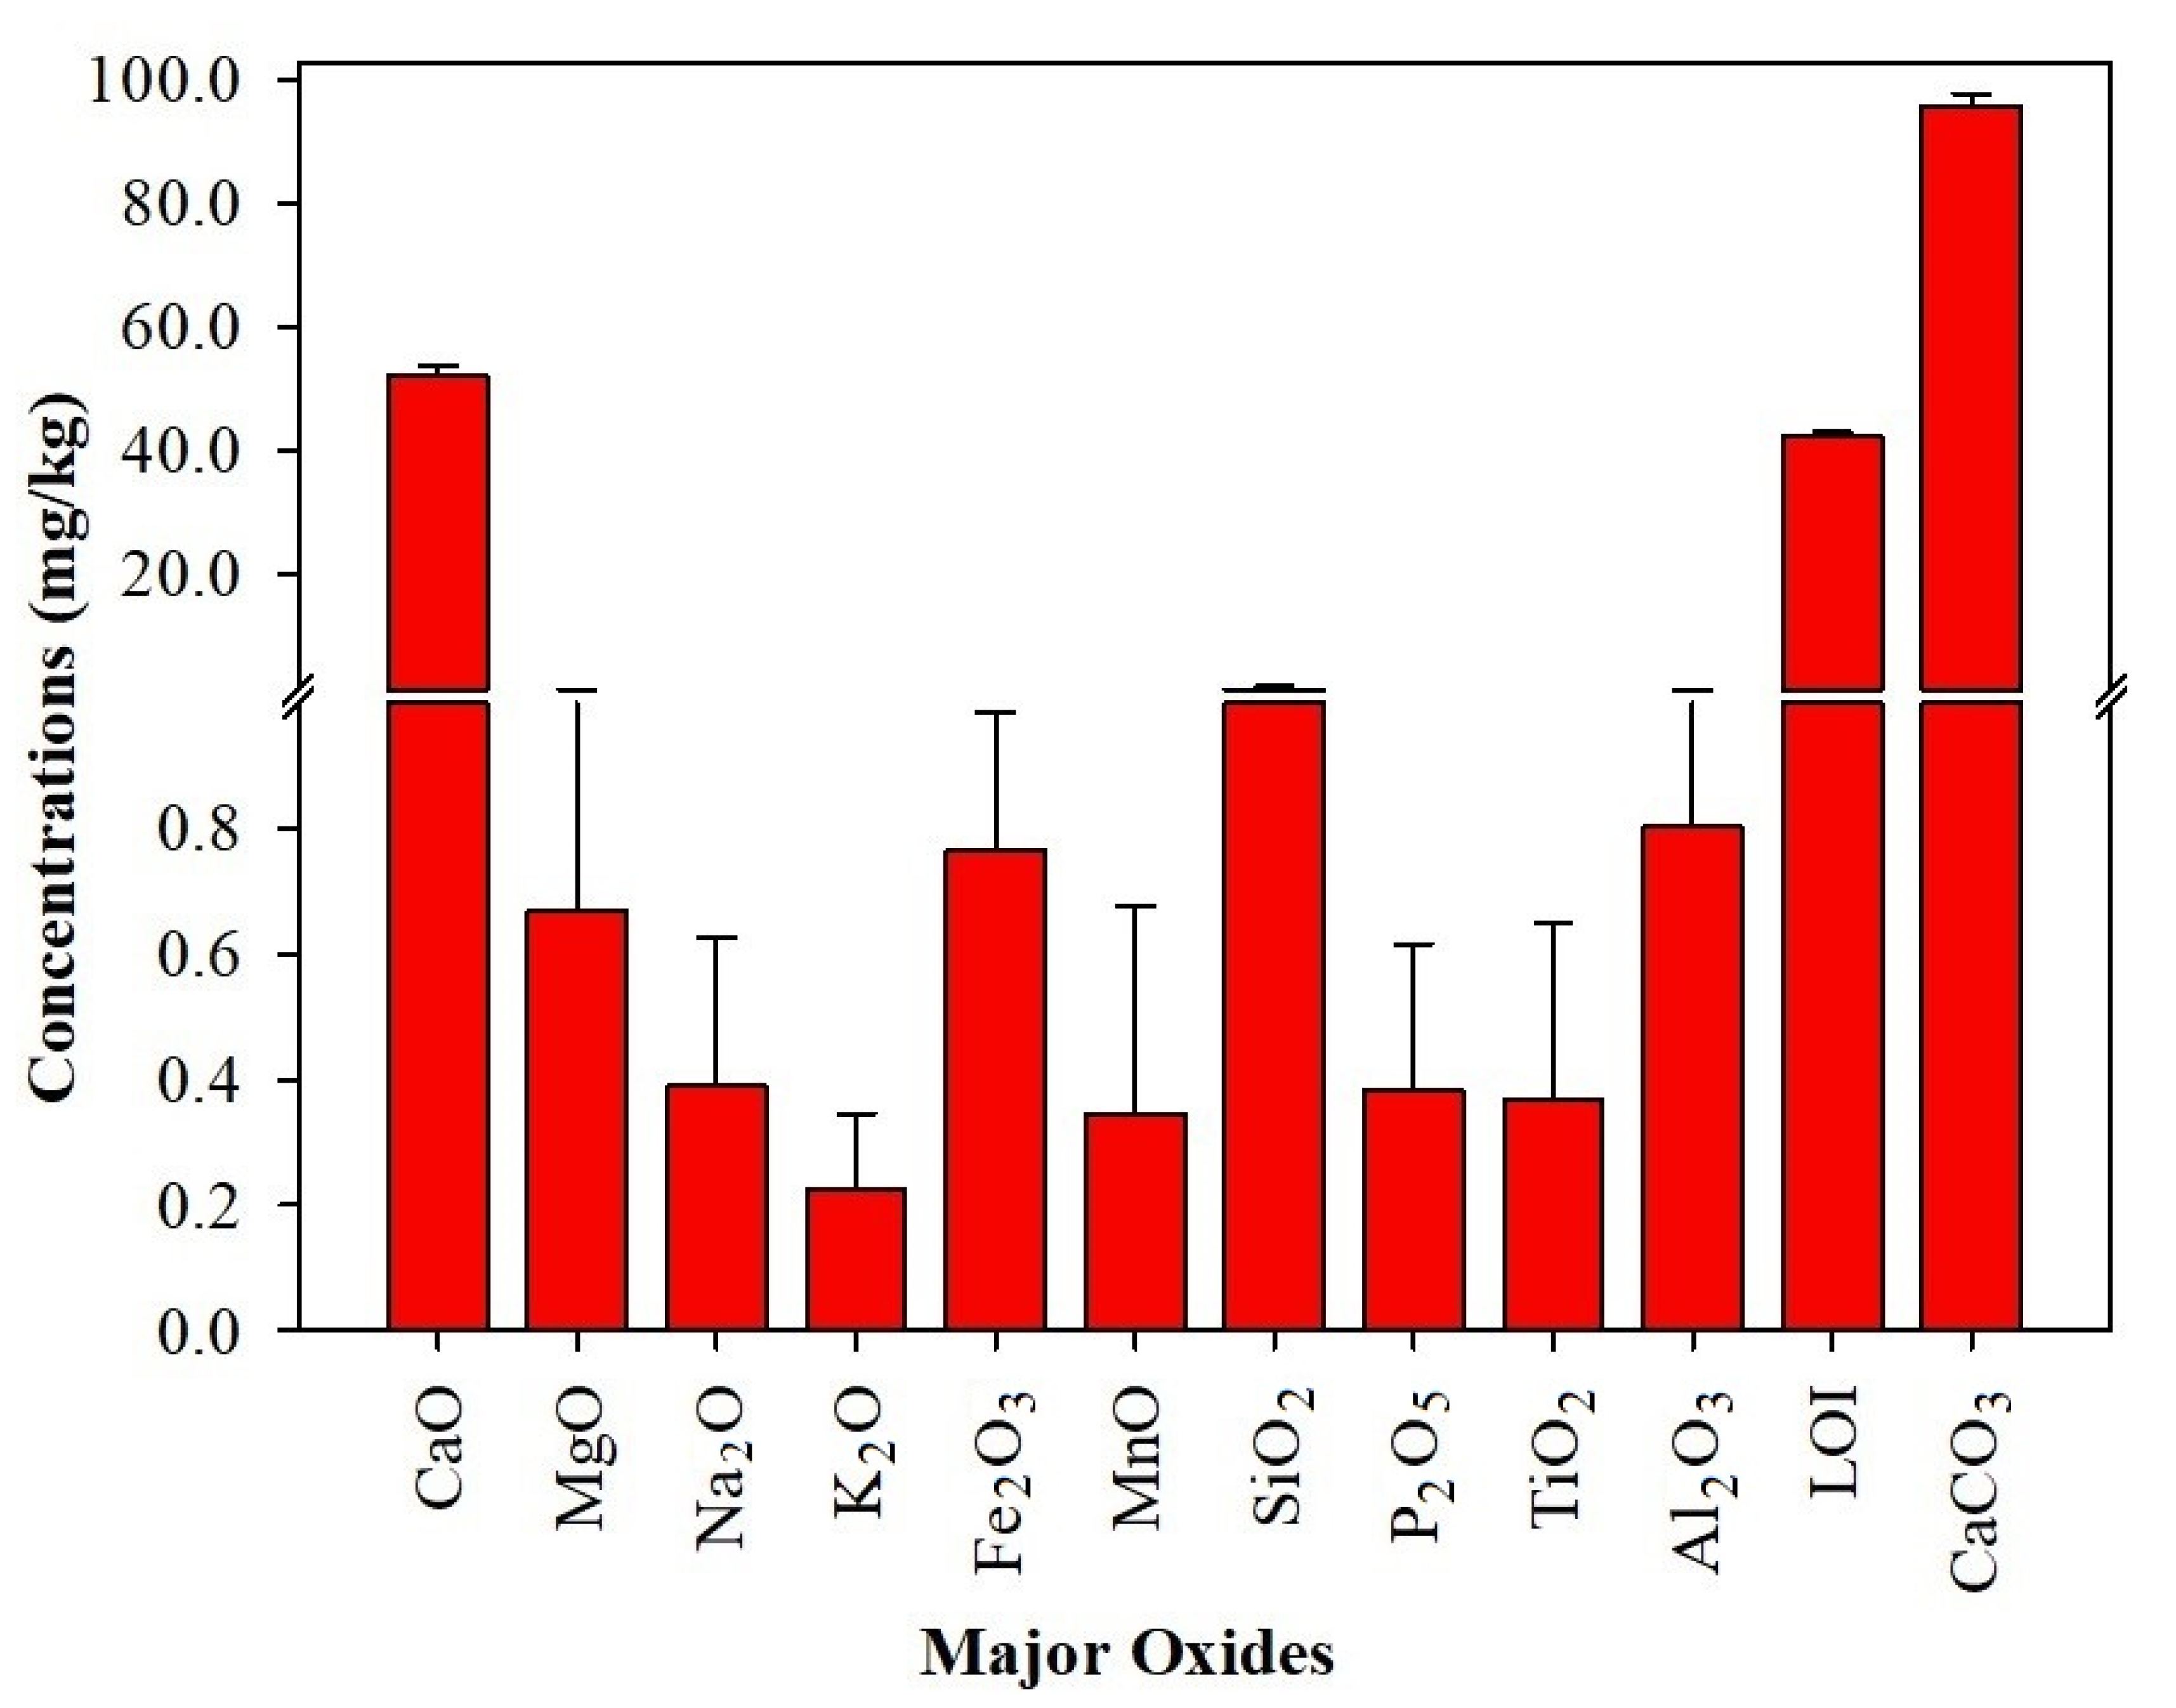
4.2. Mineralogical and Chemical Evaluation

The results of the mineralogical study and chemical analyses in the form of the major oxides are shown in Figure 4. The LS of the study area is dominantly comprised of calcite (95.69%). It has a high concentration of CaO, which ranges from 49.96 to 55.20% (52.08%). The correlation coefficient results exhibit a significant positive correlation of LOI to CaO (r = 0.867) and CaCO3 (r = 0.950) (Table 3). In our case, the LOI value corresponds to the CO2 removal from CaCO3 during the ignition of the pulverized sample at 1000 °C. Furthermore, both LOI and CaO show strong negative correlations with SiO2 (Table 3) that signifies the purity of limestone. The higher concentration of calcite and, subsequently, of CaO, enhances the strength and durability of the aggregate and is required for the cement industry [68] by the international standards. The value of MgO varies from 0.11 to 1.47% (0.66%), indicating the prevalence of less saline nature of the limestone origin by which extensive leaching takes place. Moreover, the LS of SSF contains a low Na2O 0.03–0.84% (0.38%) and K2O 0.03 to 0.40% (0.22%) content. Fe2O3 varies from 0.34 to 1.09% (0.76%) and its presence may be attributed, mainly, to the substitution of Ca by Fe in the structure of the calcite. It is noted that a higher amount of iron can cause deterioration in the building construction [69]. The percentages of K2O, MnO, P2O5, TiO2, Fe2O3, and Al2O3 are less than 1.00%, while SiO2 is less than 2%. The percentage of MnO, SiO2, P2O5, TiO2, and Al2O3 varies from 0.09 to 0.98% (0.34%); 0.34 to 1.77% (1.13%); 0.05 to 0.80% (0.38%); 0.03 to 0.83% (0.36%); and 0.35 to 1.84% (0.80%), respectively. Furthermore, the concentration of the LOI ranges from 40.11 to 43.27% (42.08%) depending on the SiO2 content, as discussed earlier. These results of the mineralogical composition of LS are in agreement with the study conducted on similar types of rocks in the Abbottabad area by Bilqees et al. [18].
Furthermore, the Sc (dissolved silica) ranges from 29.30 to 73.92 mmol/L, whereas Rc (reduction in alkalinity) varies from 137 to 225 mmol/L. These results illustrate that the aggregates of the SSF are innocuous in terms of ASR and, thus, have no deleterious effect on the concrete-reinforcing steel, as shown in Figure 5 [70].

4.3. Petrographic Evaluation

The mechanical properties of rocks are highly influenced by their petrographic features. The petrographic analysis of rock offers significant insights into its mechanical behavior under stress by studying its grain shape, grain size, fabric, grain boundaries, mineralogical composition, and weathering [71,72]. A petrographic examination of the SSF samples was carried out according to ASTM C 295. The study performed under petrographic microscopic explains the nature of aggregate material [73] in terms of ASR potential, which affects the durability of hardened concrete [74]. A silica gel is formed when the silica of aggregates reacts with the alkali of cement in the presence of water. The silica gel causes osmotic pressure, which results in the breaking of the bond between aggregate and cement, thus, leading to cracks in the structures [75]. Similarly, the clay minerals also create cracks in the structure by expansion and contraction [76,77]. Therefore, the petrography of the SSF was essential to determine any deleterious materials in the aggregate. Moreover, it would also help in unraveling the diagenetic features that affect the engineering properties of rocks.
The LS at the SBH section is yellowish-grey to grey. It is medium to coarse-grained, compact, hard, massive, and medium to thickly bedded limestone. According to the Dunham [78] classification, the LS is comprised of three microfacies, namely: grainstone, packstone, and wackestone. The modal mineralogy of the studied rock samples is presented in Table 4. The observed stylolites suggest that the rock underwent chemical compaction (Figure 6c,e,f). Stylolites affected the strength of the rocks (Figure 7). The rock samples with stylolites (SSK1-3 and 6) have low values of the UCS, compared to those specimens with no stylolites (SSK4 and 5). The chemical compaction may be attributed to the overburden pressure and/or tectonic stress in the past. Furthermore, microscopic studies reveal that the limestone is dominantly composed of ooids, peloids, bioclasts, and calcite. Micritization was reported in bioclasts. The allochems are tightly packed and compacted, thus, showing mechanical compaction (Figure 6b–e). Calcite is fine-grained. Dolomite crystals are present in trace amounts (Figure 6a,c). There is no silica phase identified microscopically. Consequently, it is concluded that the LS of SSF has no deleterious and harmful minerals, as specified by ASTM C295 [58], to produce the alkali carbonate reaction (ACR) and ASR in the concrete.
The effect of petrographic features and microstructure on the properties of aggregates was explained by Ramsay et al. [79], Hartley [80], and Lees and Kennedy [81]. Consequently, a petrographic study was performed on LS to determine its suitability as an aggregate source. These petrographic findings are also supported by the geochemical analysis and the ASR tests. Therefore, it can be assessed that the limestone of the SSF can be termed suitable for both the cement and construction industries.

4.4. Aggregate Suitability of Limestone for the Construction Industry

The mineral composition of LS is reflected by its chemical composition. Limestone that is used in cement must contain a minimum of 70% calcite ASTM C150/C150M-18 [82]. The percentage of MgO in the clinker should not surpass 5% in the process of cement manufacturing [83]. A high percentage of MgO content causes expansion in cement, which leads to a loss of concrete strength [84]. Moreover, alkali-rich limestone is not considered suitable for the cement industry because it causes the deterioration of concrete. These alkalis affect the quality of cement by causing alkali–silica reactions, which result in the formation of a swelling gel [85,86]. The swelling gel has an adverse effect on the concrete and can cause severe problems in aged structures [84]. On the contrary, the strength of concrete is enhanced by an increase in the concentration of CaO. This is because pure limestone possesses high values of strength [87]. The mineralogical and geochemical evaluation of the LS (Figure 4) shows that it has a high calcite content (95.69) and low contents of alkalis, magnesia, and silica (<2%). The higher concentration of calcite and lower amounts of alkalis, magnesia, and silica make it suitable for cement manufacturing, as the obtained values are within the international standards (ASTM [82]). The values of alkalis in LS are lower than the objectionable limit for the usage in the cement industry. Therefore, the LS of the study area at SBH is recommended for its exploitation as a raw material in the cement industry.
Aggregates constitute about 60–80% of the concrete by volume. Thus, their characteristics influence the strength, workability, and durability of the concrete [69,88,89]. Limestone commonly produces good quality concrete aggregates under normal conditions [68,90,91]. Therefore, the LS samples of the SSF performance as aggregates was evaluated. The results of all the mineralogical and geotechnical analyses performed suggest that the limestone of the SSF qualifies for all the tests (ASTM) and is suitable as an aggregate in different construction industries.

4.5. Estimation of UCS from PLT, UPV, and SHRT

UCS was calculated from PLT, UPV, and SHRT by a simple regression analysis (SRA). The SRA describes a relationship between two variables. Linear (y = ax + b); logarithmic (y = a lnx + b); power (y = axb); and exponential (y = aebx) functions may be applied for establishing a simple predictive model. The model will be significant if the p-value is less than 0.05. Equations are accompanied by a coefficient of determination (R2) that is often called the proportion of variation (explained by the variable x). It follows 0 < R2 < 1. When the value of R2 is close to 1, most of the variability in y is explained by the regression model [92]. In the present study, the SRA was attained by plotting UCS against Is (50) (Figure 8a). The following correlation equation was obtained:
U C S = 24.15   I s   50 38.23 ( R 2 = 0.79 )
where Is (50) is the point load index at 50 mm diameter. The relationship between the UCS and the UPV for LS is shown in Equation (2) (Figure 8b).
U C S = 0.03   U P V 104 ( R 2 = 0.90 )
Similarly, the correlation equation for the UCS and SHRT (Figure 8c) is given below:
U S C = 1.92   S H R T 7.42 ( R 2 = 0.83 )
These obtained models for the estimation of UCS from PLT, UPV and SHRT are statistically significant (p ≤ 0.05), with p-values less than 0.05. Moreover, a comparison of the results is essential to check the validity of the obtained correlation equations (Figure 8). Figure 8d displays the actual measured uniaxial compressive strength values plotted against the calculated uniaxial compressive strength values for the LS for Equation (1). Similarly, Figure 8e shows the actual measured uniaxial compressive strength values plotted against the calculated uniaxial compressive strength values for Equation (2). For Equation (3), the actual measured uniaxial compressive strength values are plotted against the calculated uniaxial compressive strength values in Figure 8f. The nearer the data points to the correlation line, the closer the prediction is to the actual value. This comparison analysis illustrates that although all the obtained equations are good enough to predict UCS, using UPV for the estimation of UCS is more reliable than using PLT and SHRT. The data points are closer to the correlation line for Equation (2) (Figure 8e), as compared to the data points for Equations (3) and (1) (Figure 8d,f).
Furthermore, the obtained equation for PLT is in good agreement with the one which was derived by Read et al. [93]. Similarly, the derived equation for UPV is somehow close to the obtained equation of Aldeeky and Al Hattamleh [94]. However, in their case, the rock used was basalt. Finally, the obtained equation for SHRT is in fair agreement with the derived equation of Tandon and Gupta [95], despite the fact that they used quartzite rock.

4.6. Relationship between Geo-Mechanical and Petrographic Properties

The geo-mechanical properties of rocks are greatly affected by their petrographic characteristics. The petrographic and textural features of the rock control its mechanical properties [96]. As the petrographic studies reveal that the LS of the SSF was dominantly composed of ooids, peloids, and bioclasts, and these constituents greatly affected the geo-mechanical properties of the LS. The samples (SSK3, SSK4 and SSK5) with a high percentage of ooids (mean 53%) and peloids (mean 28.3%) and a low percentage of bioclasts reveal high strength, as compared to those samples (SSK1, SSK2 and SSK6) which have a low percentage of ooids and peloids and a high content of bioclasts (mean 16.6%) (Table 4). Therefore, ooids and peloids showed a moderate positive correlation with the UCS, while bioclasts showed a linear negative but significant (p ≤ 0.05) correlation with the latter (Figure 9a–c). The decrease in the values of UCS with the increasing percentage of bioclasts is due to the micritization of ooids, which negatively affected the rock strength. Further, the boundaries between the bioclasts and groundmass act as a weak zone, facilitating the propagation of fracture during compressive loading. The adverse impact of bioclasts on the UCS was also reported in studies conducted by Naeem et al. [19], and Asif et al. [24]. Furthermore, the values of UCS are directly proportional to the values of SG and BD (Figure 9d,e). On the contrary, UCS is inversely proportional to the values of WA, AIV, soundness, LAAV, and CL (Figure 9f–j).

5. Conclusions

I. 
This research study was performed to examine the aggregate suitability and geochemical properties of limestone from the Sheikh Budin Hills, north-western Pakistan.
II. 
All the results of the aggregate parameters (SG = 2.6, WA = 0.47%, BD = 1.58 g/cm3, FI = 16.8%, EI = 16.39%, S = 1.6%, AIV = 14%, LAAV = 23.51%, CL = 0.35%, UCS = 86.7 MPa, PLT = 5.18 MPa, UPV = 5290 m/s, SHRT = 49 N) are well within the range of the values permissible for its exploitation as an engineering material in the construction industry.
III. 
The mineralogical and geochemical evaluation of limestone indicates that it is mainly made of the mineral calcite (95.81%), and it qualifies the international standard that is required for cement manufacturing. Pearson’s correlation analysis resulted in establishing a strong positive correlation among CaCO3, CaO, and LOI. Moreover, the ASR test also proved it to be suitable for its usage as an aggregate material.
IV. 
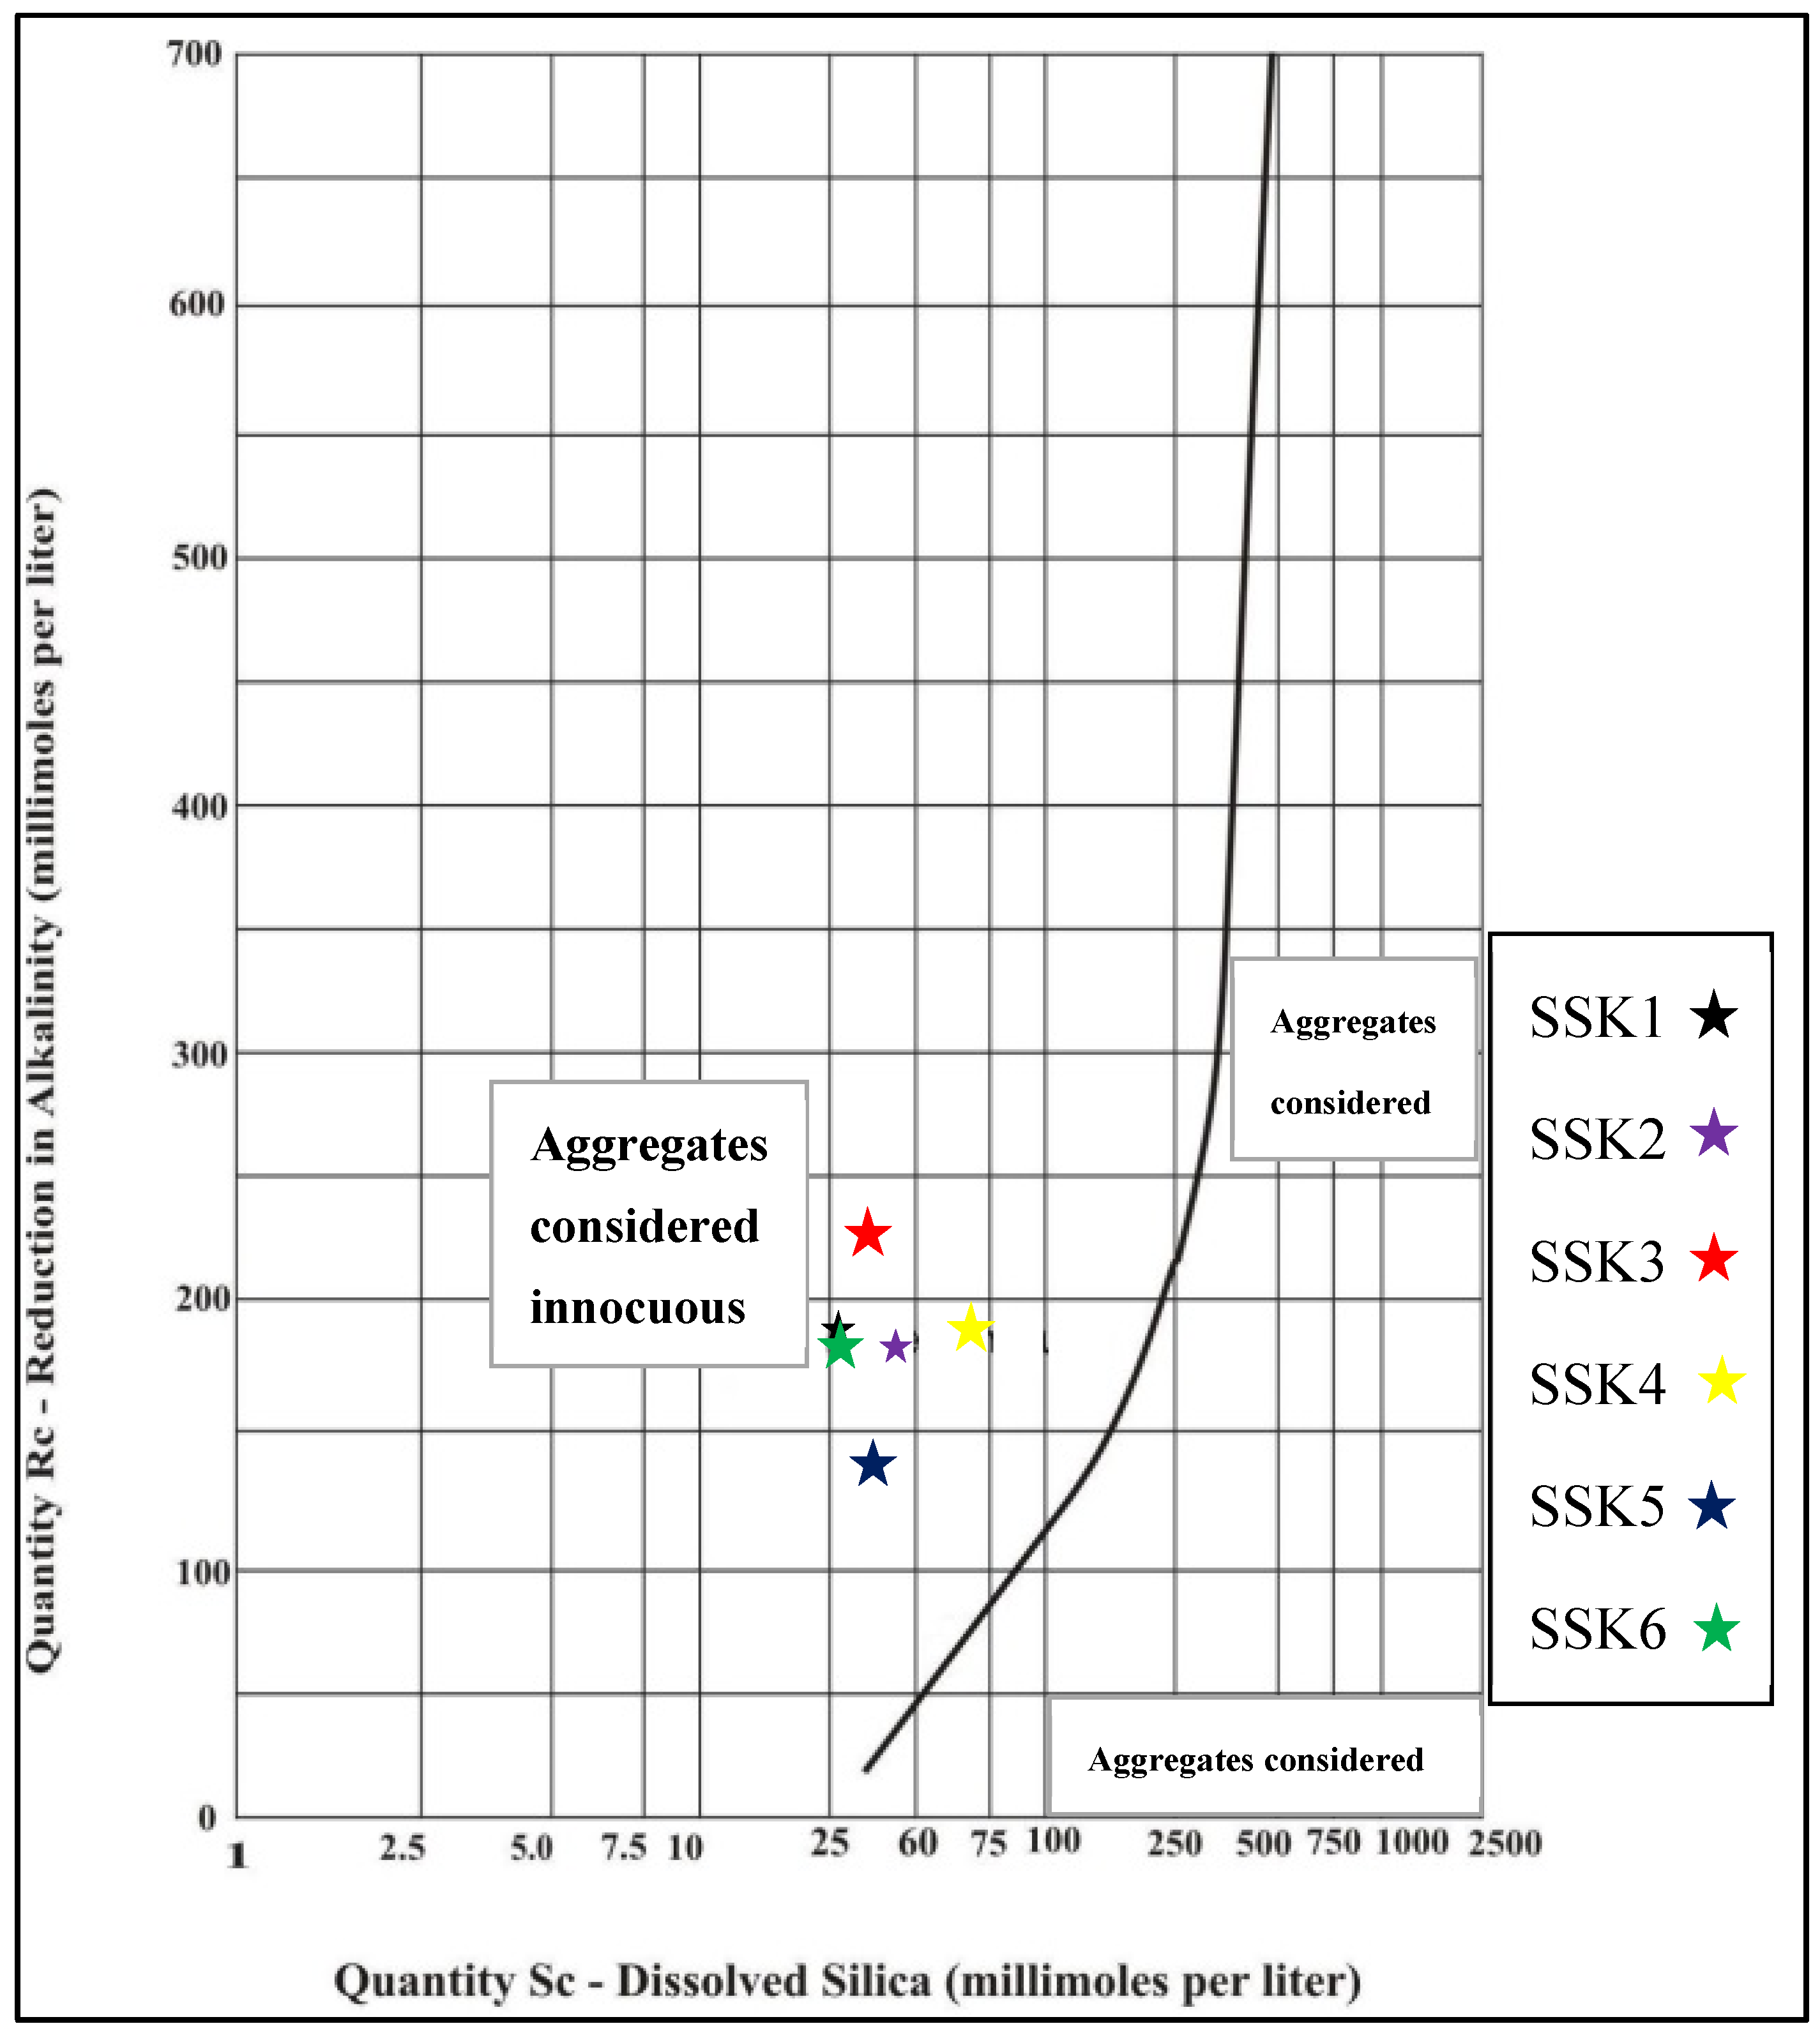
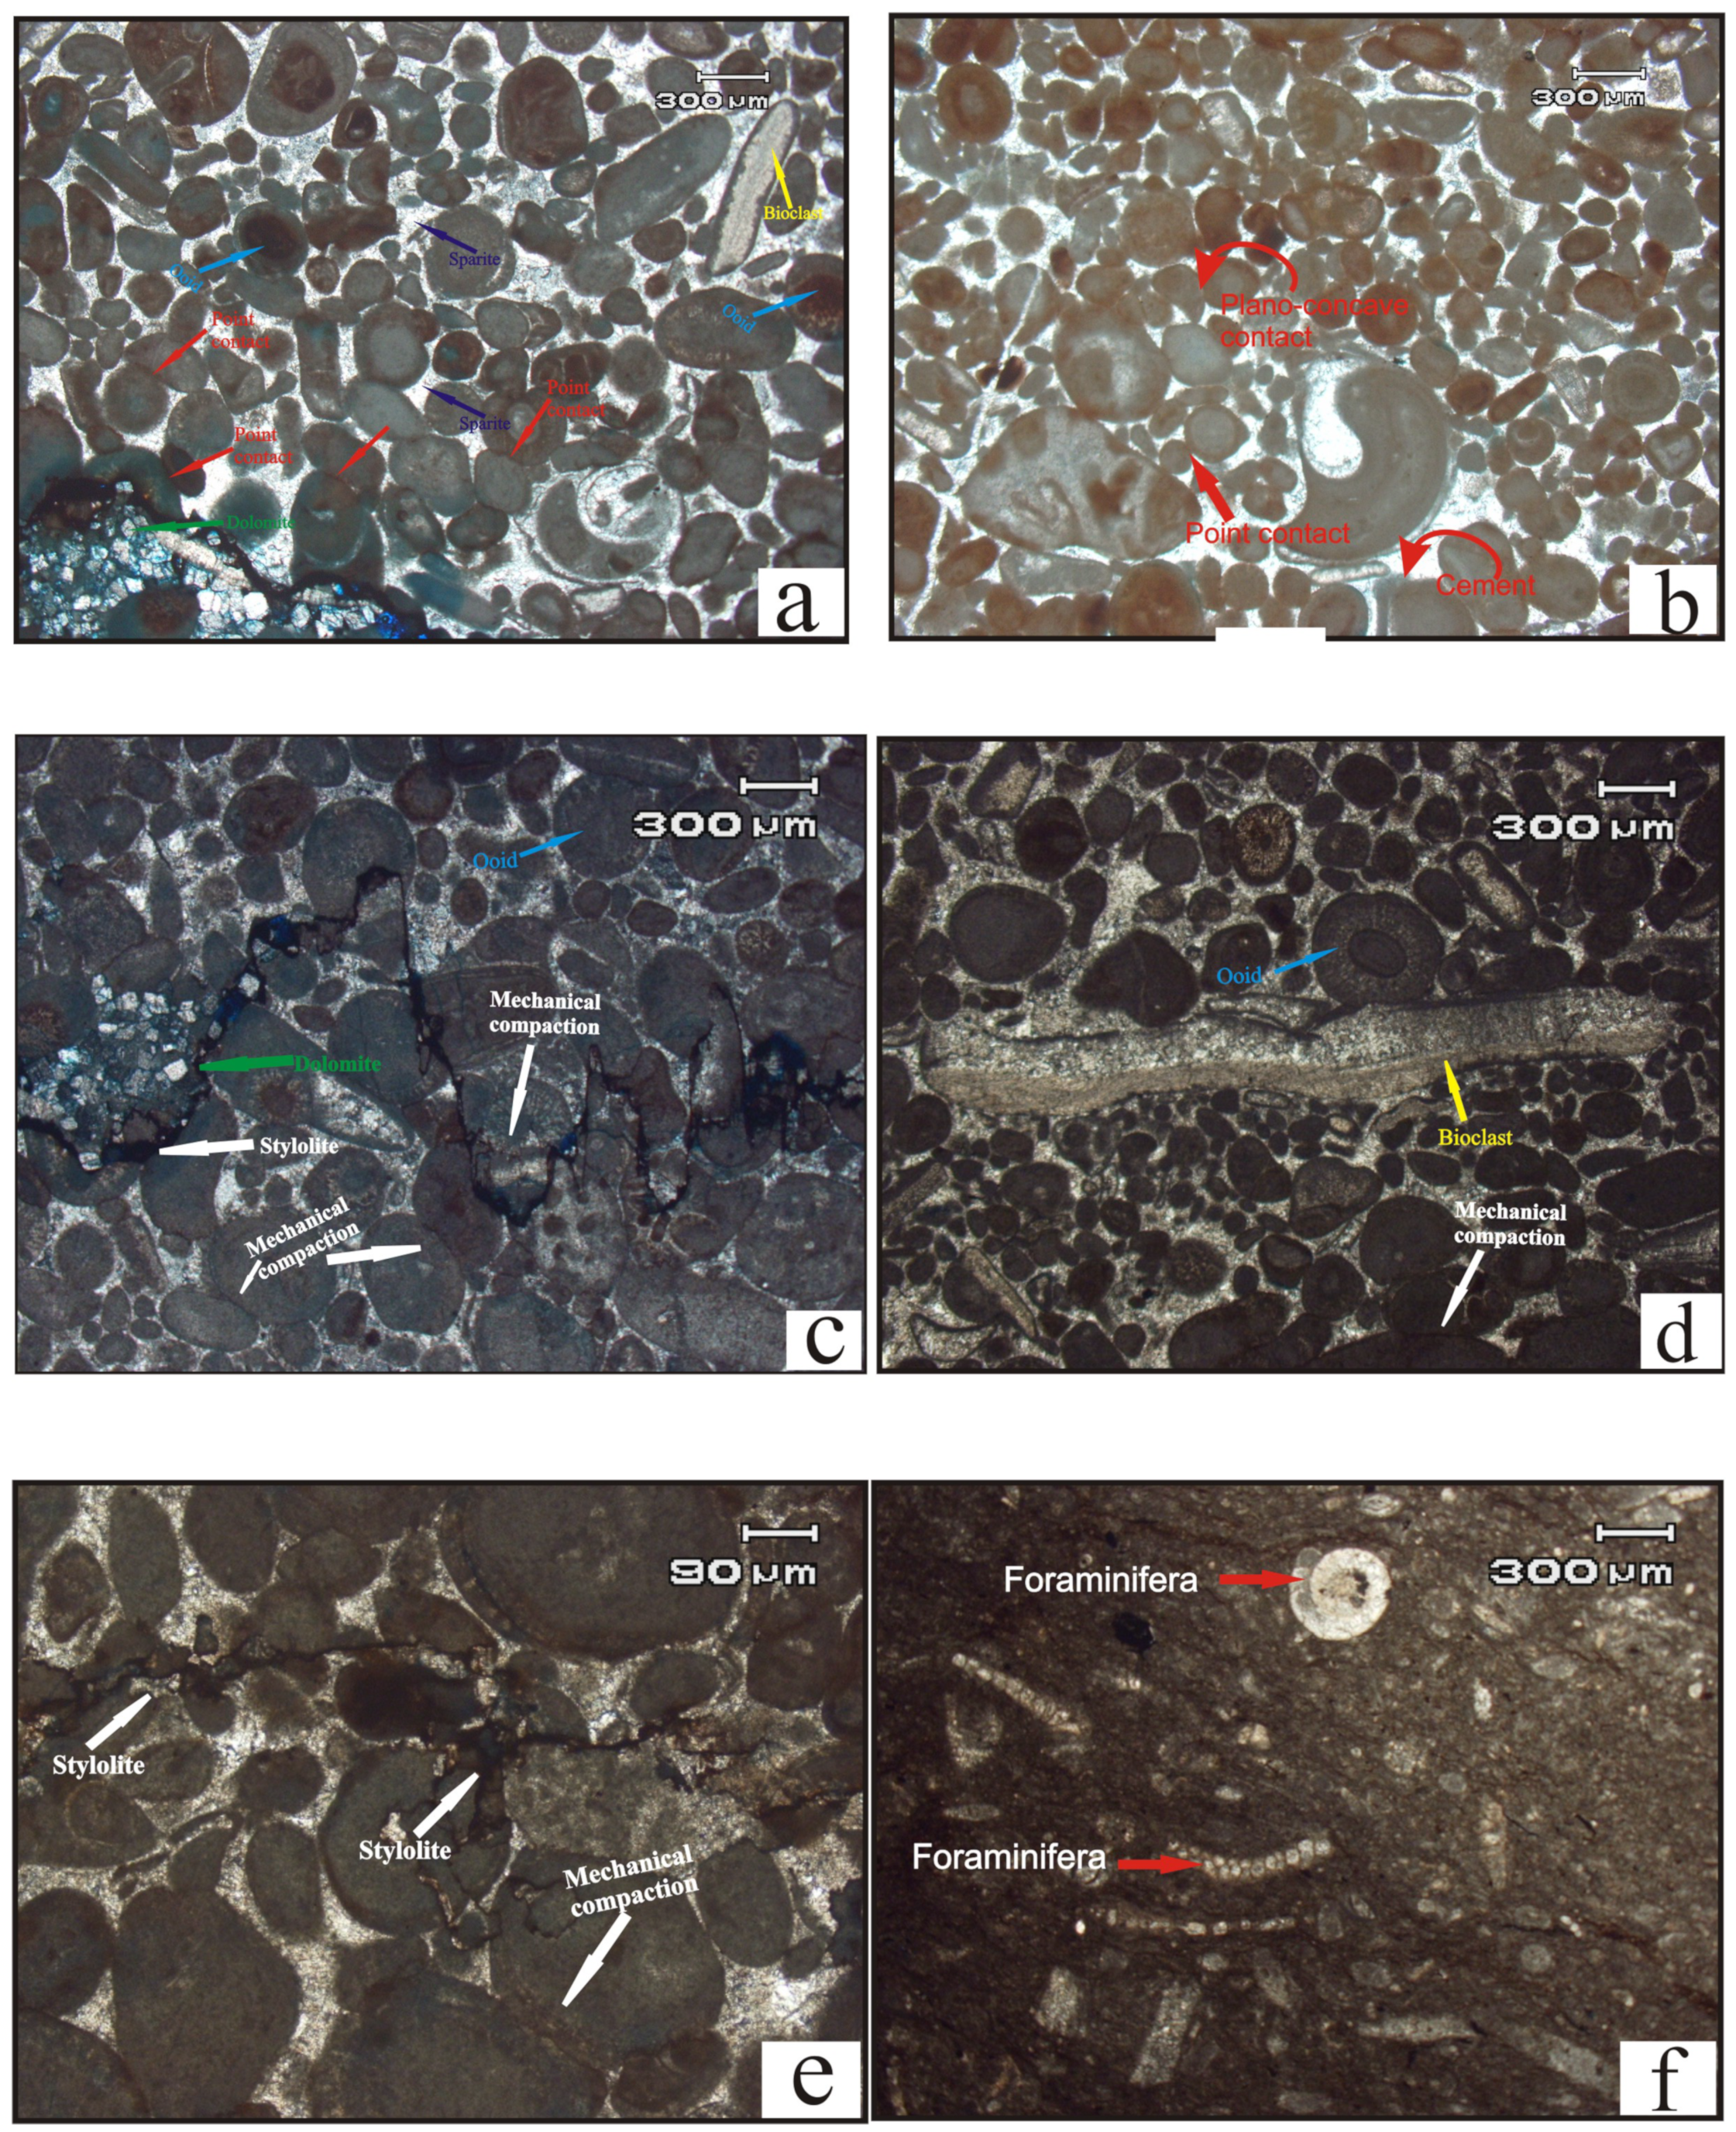
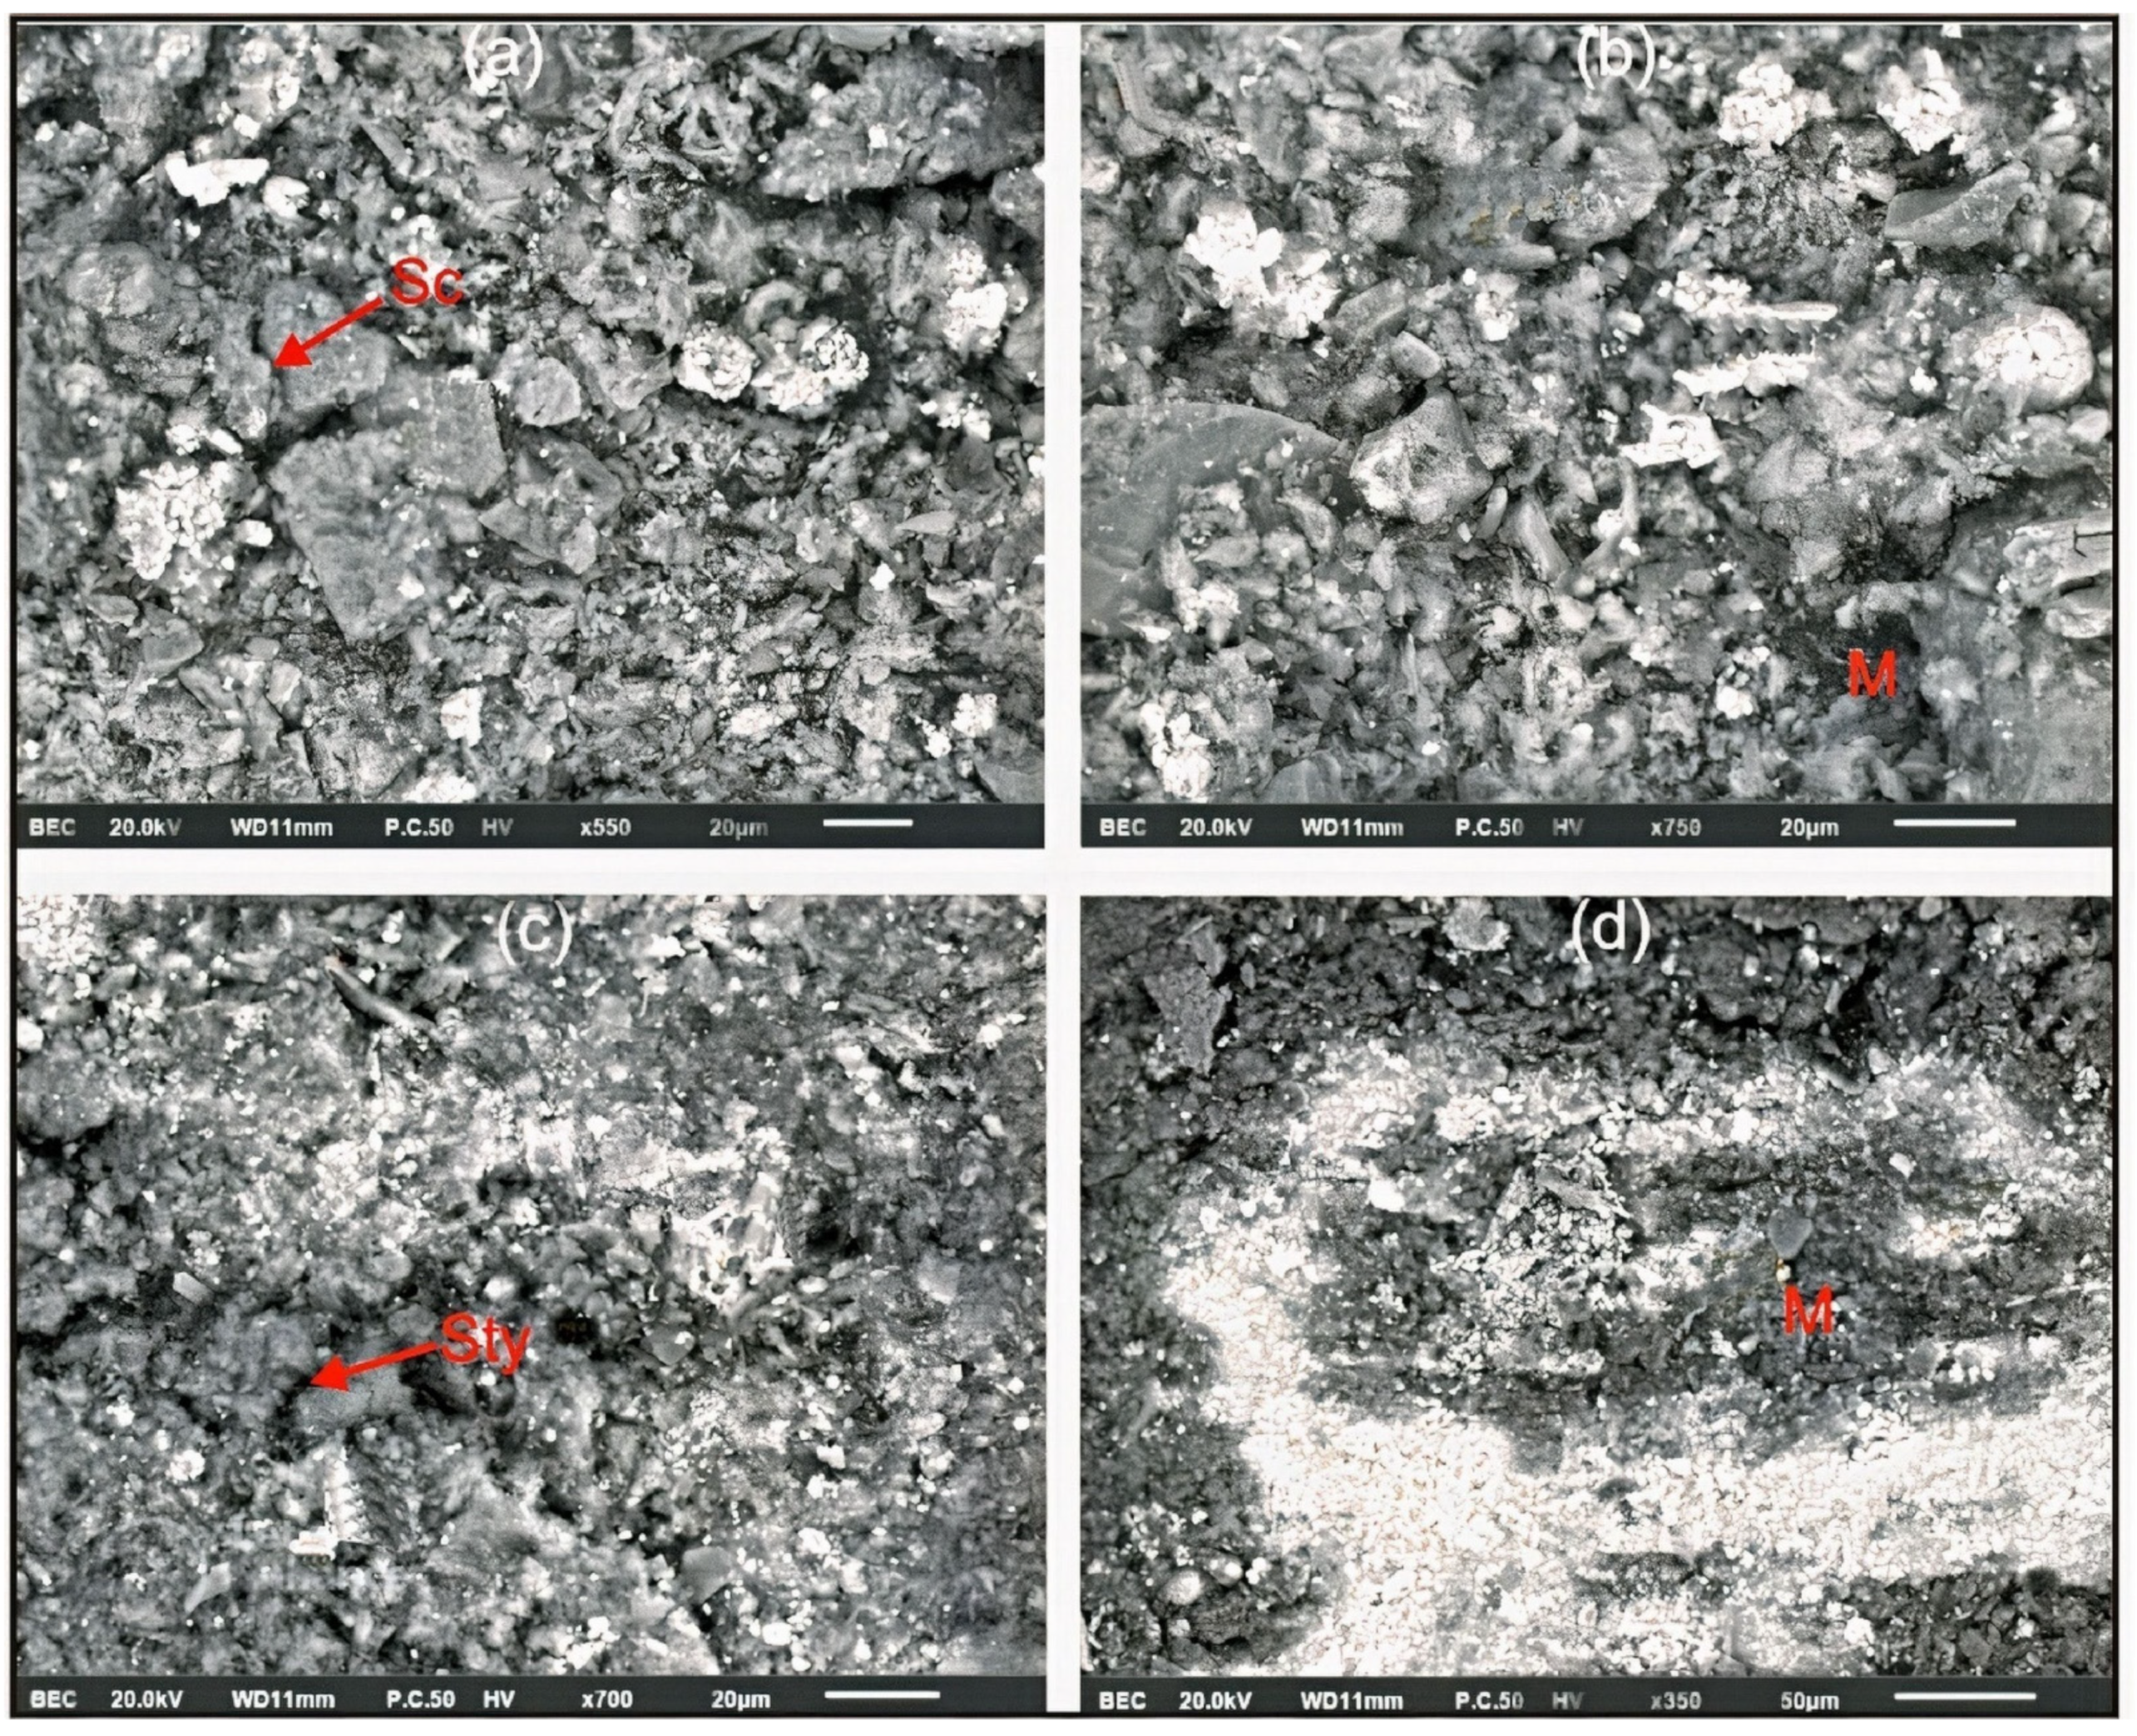
The petrographic studies suggest that the limestone is free of any deleterious or harmful materials that can lead to alkali–silica reactivity. These studies also show that the diagenetic fabric of the limestone is well compacted, thus, resulting in the high strength of these rocks.
V. 
This research study developed empirical correlation equations for the estimation of UCs from PLT, UPV, and SHRT. These correlation equations will be quite helpful for practicing engineers, geologists and researchers. It will also motivate and encourage more researchers to carry out these sorts of studies for the development of more correlation models, in order to check the validity of these equations. Furthermore, the regression analysis exhibited that the empirical correlation equation for estimating uniaxial compressive strength with ultrasonic pulse velocity is more reliable than the Schmidt hammer rebound test and the point load test. Therefore, this study recommends the use of the UPV test for the estimation of UCs on the basis of its higher level of accuracy.
VI. 
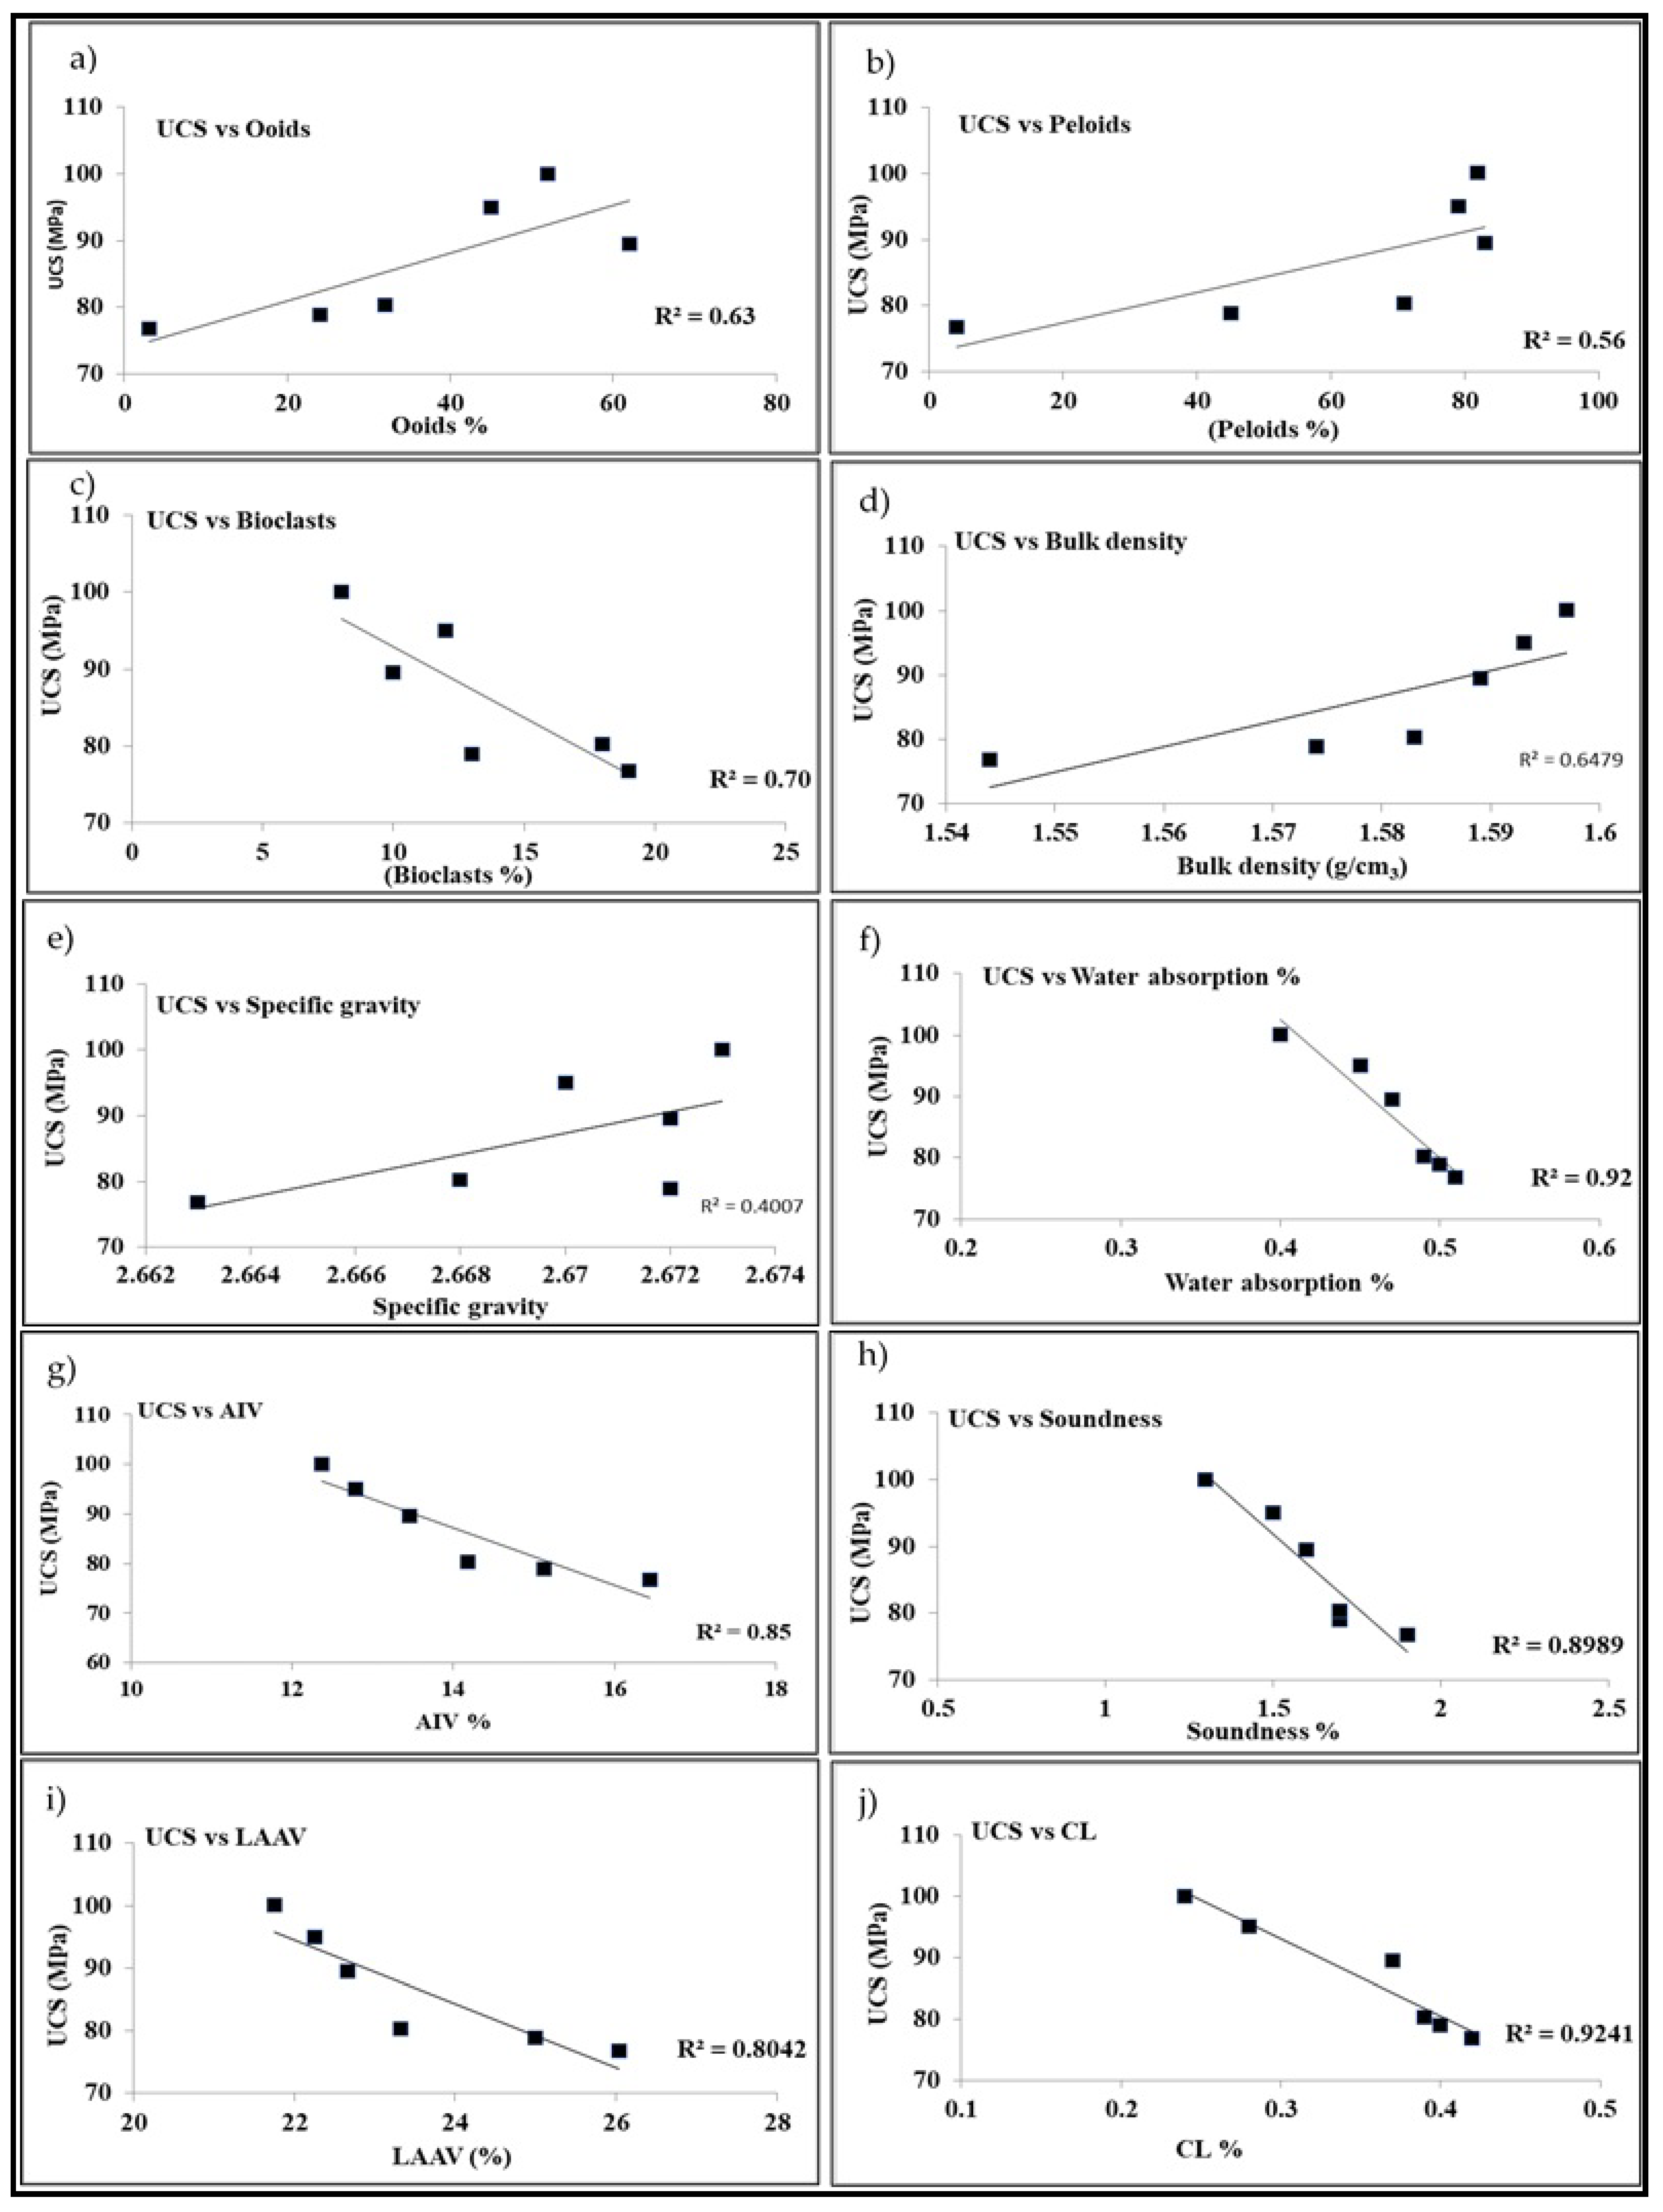
Moreover, this research study also revealed that the strength of rocks is directly proportional with ooids and peloids, while inversely proportional to bioclasts. Specific gravity and bulk density had a positive influence on the UCS values of limestone; however, the aggregate impact value, Los Angeles abrasion value, water absorption, and soundness adversely affected the UCS and other mechanical properties.
VII. 
It can be concluded from the above discussion that the studied limestone has great potential for use as a raw material in the construction industries. Therefore, the limestone of the studied area can be used as a raw material in various ongoing and future projects under CPEC. Consequently, it will play a pivotal role in the economic development of the country.

Author Contributions

Conceptualization, A.K. and L.A.; methodology, A.K., L.A. and W.A.; software, A.K., L.A., W.A. and H.T.J.; validation, A.K., L.A., W.A. and H.T.J.; formal analysis, A.K., L.A., W.A. and S.Z.; investigation, A.K., L.A., W.A. and S.J.; resources, L.A.; data curation, A.K., L.A., W.A., S.Z., S.J., H.T.J. and G.K.; writing—original draft preparation, A.K. and L.A.; writing—review and editing, W.A., L.A., H.T.J., C.V. and G.K.; visualization, L.A. and W.A.; supervision, L.A.; project administration, L.A.; funding acquisition, H.T.J. and C.V. All authors have read and agreed to the published version of the manuscript.

Funding

This research received no external funding.

Institutional Review Board Statement

Not applicable.

Informed Consent Statement

Not applicable.

Data Availability Statement

Not applicable.

Acknowledgments

The senior author would like to express gratitude to the National Center of Excellence for providing the opportunity and facility for this research. The National and Kapodistrian University of Athens is kindly thanked for funding the publication of this work.

Conflicts of Interest

The authors declare no conflict of interest.

References

  1. Janjuhah, H.T.; Kontakiotis, G.; Wahid, A.; Khan, D.M.; Zarkogiannis, S.D.; Antonarakou, A. Integrated Porosity Classification and Quantification Scheme for Enhanced Carbonate Reservoir Quality: Implications from the Miocene Malaysian Carbonates. J. Mar. Sci. Eng. 2021, 9, 1410. [Google Scholar] [CrossRef]
  2. Janjuhah, H.T.; Alansari, A.; Vintaned, J.A.G. Quantification of microporosity and its effect on permeability and acoustic velocity in Miocene carbonates, Central Luconia, offshore Sarawak, Malaysia. J. Pet. Sci. Eng. 2019, 175, 108–119. [Google Scholar] [CrossRef]
  3. Bensted, J. δ-dicalcium silicate and its hydraulicity. Cem. Concr. Res. 1978, 8, 73–76. [Google Scholar] [CrossRef]
  4. Galetakis, M.; Alevizos, G.; Leventakis, K. Evaluation of fine limestone quarry by-products, for the production of building elements—An experimental approach. Constr. Build. Mater. 2012, 26, 122–130. [Google Scholar] [CrossRef]
  5. Khanlari, G.; Naseri, F. Prediction of aggregate modified index (AMI) using geomechanical properties of limestones. Bull. Eng. Geol. Environ. 2018, 77, 803–814. [Google Scholar] [CrossRef]
  6. Ioannou, I.; Petrou, M.F.; Fournari, R.; Andreou, A.; Hadjigeorgiou, C.; Tsikouras, B.; Hatzipanagiotou, K.J.G.S. London, Special Publications. Crushed limestone as an aggregate in concrete production: The Cyprus case. Geol. Soc. London Spéc. Publ. 2010, 331, 127–135. [Google Scholar] [CrossRef]
  7. Ahsan, N.; Gondal, M.J.I.J.o.A. Aggregate suitability studies of limestone outcrops in Dhak pass, western Salt range, Pakistan. Int. J. Agric. Appl. Sci. 2016, 4, 69–75. [Google Scholar]
  8. Zarif, I.; Tuğrul, A. Aggregate properties of Devonian limestones for use in concrete in Istanbul, Turkey. Bull. Eng. Geol. 2003, 62, 379–388. [Google Scholar] [CrossRef]
  9. Ben Salah, I.; Ben M’Barek, M.; Mezza, S.; Boughdiri, M. Geotechnical study of the Aptian limestone of the kef region. Open J. Geol. 2018, 8, 1084–1101. [Google Scholar] [CrossRef]
  10. Kayabaşı, A.; Soypak, R.; Göz, E. Evaluation of limestone quarries for concrete and asphalt production: A case study from Ankara, Turkey. Arab. J. Geosci. 2018, 11, 1–22. [Google Scholar] [CrossRef]
  11. Kamani, M.; Ajalloeian, R. Evaluation of the mechanical degradation of carbonate aggregate by rock strength tests. J. Rock Mech. Geotech. Eng. 2019, 11, 121–134. [Google Scholar] [CrossRef]
  12. Shinawi, A.E.; Mésároš, P.; Zeleňáková, M.J.S. The Implication of Petrographic Characteristics on the Mechanical Behavior of Middle Eocene Limestone, 15th May City, Egypt. Sustainability 2020, 12, 9710. [Google Scholar] [CrossRef]
  13. Qaid, A.M.; Alqubati, N.; Al-Hawbani, A.M. Physical and Geochemical Assessment of Limestone of Amran Group in Arhab Area-North Sana’a for Industrial Uses. Tech. BioChemMed 2021, 2, 28–38. [Google Scholar]
  14. Hussain, V.; Bilqees, R.; Nasreen, S. Petrology and industrial application of Nizampur Limestones, NWFP, Pakistan. Pak. J. Sci. Ind. Res. 1989, 32, 775–779. [Google Scholar]
  15. Bilqees, R.; Shah, T. Industrial applications of limestone deposits of Kohat, NWFP: A research towards the sustainability of the deposits. Biol. Sci. PJSIR 2007, 50, 293–298. [Google Scholar]
  16. Jan, N.; Bilqees, R.; Riaz, M.; Noor, S.; Younas, M. Study of limestone from Nizampur area for industrial utilization. J. Chem. Soc. Pak. 2009, 31, 16–20. [Google Scholar]
  17. Bilqees, R.; Tahirkheli, T.; Pirzada, N.; Abbas, S.M. Industrial applications of Abbottabad limestone; utilizing its chemical and engineering properties. J. Himal. Earth Sci. 2012, 45, 91. [Google Scholar]
  18. Bilqees, R.; Sarwar, M.R.; Haneef, M.; Khan, T. Source of cement raw material for the construction of Bhasha Dam in Gilgit Diamir District, Pakistan. J. Himal. Earth Sci. 2015, 48, 1–8. [Google Scholar]
  19. Naeem, M.; Khalid, P.; Sanaullah, M.; ud Din, Z. Physio-mechanical and aggregate properties of limestones from Pakistan. Acta Geod. Geophys. 2014, 49, 369–380. [Google Scholar] [CrossRef]
  20. Malahat, F.; Naseer, A.; Bilqees, R. Engineering and Mineralogical Assessment of Coarse Aggregates used in District Mardan. J. Himal. Earth Sci. 2018, 51, 34–43. [Google Scholar]
  21. Rehman, S.U.; Ahmed, M.; Hasan, F.; Hassan, S.; Rehman, F.; Ullah, M.F. Aggregate suitability studies of Middle Jurassic Samana Suk Formation exposed at Sheikh Budin Hill, Marwat Range, Pakistan. J. Biodivers. Environ. Sci. 2018, 12, 159–168. [Google Scholar]
  22. Hassan, E.; Hannan, A.; Rashid, M.; Ahmed, W.; Zeb, M.; Khan, S.; Ahmad, A. Resource assessment of Sakesar limestone as aggregate from salt range Pakistan based on geotechnical properties. Int. J. Hydrol. 2020, 4, 24–29. [Google Scholar] [CrossRef]
  23. Rehman, G.; Zhang, G.; Rahman, M.U.; Rahman, N.U.; Usman, T.; Imraz, M.J.A.G.e.G. The engineering assessments and potential aggregate analysis of mesozoic carbonates of Kohat Hills Range, KP, Pakistan. Acta Geod. Geophys. 2020, 55, 477–493. [Google Scholar] [CrossRef]
  24. Asif, A.R.; Islam, I.; Ahmed, W.; Sajid, M.; Qadir, A.; Ditta, A. Exploring the potential of Eocene carbonates through petrographic, geochemical, and geotechnical analyses for their utilization as aggregates for engineering structures. Arab. J. Geosci. 2022, 15, 1–19. [Google Scholar] [CrossRef]
  25. Broch, E.; Franklin, J. The point-load strength test. Int. J. Rock Mech. Min. Sci. Geomech. Abstr. 1972, 9, 669–676. [Google Scholar] [CrossRef]
  26. Bieniawski, Z. The point-load test in geotechnical practice. Eng. Geol. 1975, 9, 1–11. [Google Scholar] [CrossRef]
  27. Cargill, J.S.; Shakoor, A. Evaluation of empirical methods for measuring the uniaxial compressive strength of rock. Int. J. Rock Mech. Min. Sci. Geomech. Abstr. 1990, 27, 495–503. [Google Scholar] [CrossRef]
  28. Akram, M.; Bakar, M.A. Correlation between uniaxial compressive strength and point load index for salt-range rocks. Pak. J. Eng. Appl. Sci. 2016, 1, 1–8. [Google Scholar]
  29. Salah, H.; Omar, M.; Shanableh, A. Estimating unconfined compressive strength of sedimentary rocks in United Arab Emirates from point load strength index. J. Appl. Math. Phys. 2014, 2, 296–303. [Google Scholar] [CrossRef]
  30. Sharma, P.; Singh, T. A correlation between P-wave velocity, impact strength index, slake durability index and uniaxial compressive strength. Bull. Eng. Geol. Environ. 2008, 67, 17–22. [Google Scholar] [CrossRef]
  31. Kurtuluş, C.; Irmak, T.S.; Sertçelik, I. Physical and mechanical properties of Gokceada: Imbros (NE Aegean Sea) island andesites. Bull. Eng. Geol. Environ. 2010, 69, 321–324. [Google Scholar] [CrossRef]
  32. Yagiz, S. P-wave velocity test for assessment of geotechnical properties of some rock materials. Bull. Mater. Sci. 2011, 34, 947. [Google Scholar] [CrossRef]
  33. Sarkar, K.; Vishal, V.; Singh, T. An empirical correlation of index geomechanical parameters with the compressional wave velocity. Geotech. Geol. Eng. 2012, 30, 469–479. [Google Scholar] [CrossRef]
  34. Singh, R.; Hassani, F.; Elkington, P. The application of strength and deformation index testing to the stability assessment of coal measures excavations. In Proceedings of the 24th US Symposium on Rock Mechanics (USRMS), College Station, TX, USA, 20 June 1983. [Google Scholar]
  35. Sheorey, P. Schmidt hammer rebound data for estimation of large scale in situ coal strength. Int. J. Rock Mech. Min. Sci. Geomech. Abstr. 1984, 21, 39–42. [Google Scholar] [CrossRef]
  36. Haramy, K.; DeMarco, M. Use of the Schmidt hammer for rock and coal testing. In Proceedings of the 26th US Symposium on Rock Mechanics (USRMS), Rapid City, SD, USA, 26 June 1985. [Google Scholar]
  37. O’Rourke, J. Rock index properties for geoengineering in underground development. Min. Eng. 1989, 41, 106–109. [Google Scholar]
  38. Shalabi, F.I.; Cording, E.J.; Al-Hattamleh, O.H. Estimation of rock engineering properties using hardness tests. Eng. Geol. 2007, 90, 138–147. [Google Scholar] [CrossRef]
  39. Nizami, A.; Sheikh, R. Sedimentology of the Middle Jurassic Samana Suk Formation, Makarwal Section, Surghar Range, Trans Indus Ranges, Pakistan. Geol. Bull. Punjab Univ. 2009, 44, 11–25. [Google Scholar]
  40. Blisniuk, P.M.; Sonder, L.J.; Lillie, R.J. Foreland normal fault control on northwest Himalayan thrust front development. Tectonics 1998, 17, 766–779. [Google Scholar] [CrossRef]
  41. Bilal, A.; Mughal, M.S.; Janjuhah, H.T.; Ali, J.; Niaz, A.; Kontakiotis, G.; Antonarakou, A.; Usman, M.; Hussain, S.A.; Yang, R. Petrography and Provenance of the Sub-Himalayan Kuldana Formation: Implications for Tectonic Setting and Palaeoclimatic Conditions. Minerals 2022, 12, 794. [Google Scholar] [CrossRef]
  42. Ali, A. Structural Analysis of the Trans-Indus Ranges: Implications for the Hydrocarbon Potential of the NW Himalayas, Pakistan. Ph.D. Thesis, National Centre of Excellence in Geology, University of Peshawar, Peshawar, Pakistan, 2010. [Google Scholar]
  43. Ali, S.K.; Janjuhah, H.T.; Shahzad, S.M.; Kontakiotis, G.; Saleem, M.H.; Khan, U.; Zarkogiannis, S.D.; Makri, P.; Antonarakou, A. Depositional Sedimentary Facies, Stratigraphic Control, Paleoecological Constraints, and Paleogeographic Reconstruction of Late Permian Chhidru Formation (Western Salt Range, Pakistan). J. Mar. Sci. Eng. 2021, 9, 1372. [Google Scholar] [CrossRef]
  44. Nizami, A.R. Microfacies analysis and diagenetic settings of the middle Jurassic Samana Suk Formation, Sheikh Budin Hill section, trans Indus ranges-Pakistan. Geol. Bull. Punjab Univ. 2009, 44, 69–84. [Google Scholar]
  45. ASTM C29; Standard Test Method for Bulk Density (“Unit Weight”) and Voids in Aggregate. American Society for Testing and Materials, Annual Book: West Conshohocken, PA, USA, 2009.
  46. BS 812-112; Methods of Determination of Aggregate Impact Value (AIV). British Standard Institution: London, UK, 1990.
  47. ASTM C127-07; Standard Test Method for Density, Relative Density (Specific Gravity), and Absorption of Coarse Aggregate. ASTM International: West Conshohocken, PA, USA, 2012.
  48. ASTM D4791; Standard Test Method for Flat Particles, Elongated Particles, or Flat and Elongated Particles in Coarse Aggregate. ASTM International: West Conshohocken, PA, USA, 2010.
  49. ASTM C88-05; Standard Test Method for Soundness of Aggregate by Use of Sodium Sulfate or Magnesium Sulfate. ASTM International: West Conshohocken, PA, USA, 2005; Volume 4.2, pp. 37–42.
  50. BS 812-112; Testing Aggregates. Method for Determination of Aggregate Impact Value (AIV). British Standarts Institution: London, UK, 1990.
  51. ASTM C142/C142M-10; Standard Test Method for Clay Lumps and Friable Particles in Aggregates. ASTM International: West Conshohocken, PA, USA, 2010.
  52. ASTM C131; Standard Test Method for Resistance to Degradation of Small-Size Coarse Aggregate by Abrasion and Impact in the Los Angeles Machine. ASTM International: West Conshohocken, PA, USA, 2006.
  53. ASTM C170-16; Standard Test Method for Compressive Strength of Dimension Stone. ASTM International: West Conshohocken, PA, USA, 2016.
  54. ASTM D 5731-95; Standart Test Method for Determination of the Point Load Strength Index of Rock. ASTM International: West Conshohocken, PA, USA, 1995.
  55. ASTM D 2845-00; Standard Test Method for Laboratory Determination of Pulse Velocities and Ultrasonic Elastic Constants of Rock. ASTM International: West Conshohocken, PA, USA, 2000.
  56. ASTM D5873-00; Standard Test Method for Determination of Rock Hardness by Rebound Hammer Method. ASTM International: West Conshohocken, PA, USA, 2000.
  57. ASTM C289-07; Standard Test Method for Potential Alkali-Silica Reactivity of Aggregates (Chemical Method). ASTM International: West Conshohocken, PA, USA, 2007.
  58. ASTM C295; Standard Guide for Petrographic Examination of Aggregrates for Concret. ASTM International: West Conshohoken, PA, USA, 2012.
  59. BS 105.1; Testing Aggregates. Methods for Determination of Particle Shape. Flakiness Index. British Standard Institution: London, UK, 1989.
  60. BS 812-105-2; Testing Aggregates. Methods for Determination of Particle Shape. Elongation Index. British Standard Institution: London, UK, 1990.
  61. Khan, J.; Ahmed, W.; Yasir, M.; Islam, I.; Janjuhah, H.T.; Kontakiotis, G. Pollutants Concentration during the Construction and Operation Stages of a Long Tunnel: A Case Study of Lowari Tunnel,(Dir–Chitral), Khyber Pakhtunkhwa, Pakistan. Appl. Sci. 2022, 12, 6170. [Google Scholar] [CrossRef]
  62. Smith MR, C.L. Aggregates: Sand, Gravel and Crushed Rock Aggregates for Construction Purposes; Geological Society: London, UK, 2001; Volume 17. [Google Scholar]
  63. ISRM. ISRM suggested method for determination of the Schmidt hammer rebound hardness: Revised version. In The ISRM Suggested Methods for Rock Characterization, Testing and Monitoring: 2007-2014; Springer: Berlin/Heidelberg, Germany, 2008; pp. 25–33. [Google Scholar]
  64. Selby, M. A rock mass strength classification for geomorphic purposes: With tests from Antarctica and New Zealand. Z. Geomorphol. Stuttg. 1980, 24, 31–51. [Google Scholar] [CrossRef]
  65. Hatheway, A.W. The complete ISRM suggested methods for rock characterization, testing and monitoring; 1974–2006. Environ. Eng. Geosci. 2009, 15, 47–48. [Google Scholar] [CrossRef]
  66. Malhotra, V. Testing Hardened Concrete: Non-Destructive Methods, ACI Monograph No. 9, ACI; Iowa State University Press: Ames, IA, USA, 1976. [Google Scholar]
  67. Akram, M.; Farooq, S.; Naeem, M.; Ghazi, S. Prediction of mechanical behaviour from mineralogical composition of Sakesar limestone, Central Salt Range, Pakistan. Bull. Eng. Geol. Environ. 2017, 76, 601–615. [Google Scholar] [CrossRef]
  68. Lea, F. The Chemistry of Cement and Concrete; Arnold: London, UK, 1970; Volume 243, p. 727. [Google Scholar]
  69. Boynton, R.S. Chemistry and Technology of Lime and Limestone; John Wiley&Sons. Inc.: New York, NY, USA, 1980. [Google Scholar]
  70. Grattan-Bellew, P.; Chan, G. Comparison of the morphology of alkali–silica gel formed in limestones in concrete affected by the so-called alkali–carbonate reaction (ACR) and alkali–silica reaction (ASR). Cem. Concr. Res. 2013, 47, 51–54. [Google Scholar] [CrossRef]
  71. Irfan, T. Mineralogy, fabric properties and classification of weathered granites in Hong Kong. Q. J. Eng. Geol. Hydrogeol. 1996, 29, 5–35. [Google Scholar] [CrossRef]
  72. Yasir, M.; Ahmed, W.; Islam, I.; Sajid, M.; Janjuhah, H.T.; Kontakiotis, G. Composition, Texture, and Weathering Controls on the Physical and Strength Properties of Selected Intrusive Igneous Rocks from Northern Pakistan. Geosciences 2022, 12, 273. [Google Scholar] [CrossRef]
  73. French, W. Concrete petrography: A review. Q. J. Eng. Geol. Hydrogeol. 1991, 24, 17–48. [Google Scholar] [CrossRef]
  74. López-Buendía, A.; Climent, V.; Verdú, P. Lithological influence of aggregate in the alkali-carbonate reaction. Cem. Concr. Res. 2006, 36, 1490–1500. [Google Scholar] [CrossRef]
  75. Ferraris, C.F.; Ferraris, C.F. Alkali-Silica Reaction and High Performance Concrete; NIST Interagency/Internal Report (NISTIR); National Institute of Standards and Technology: Gaithersburg, MD, USA, 1995. [Google Scholar] [CrossRef]
  76. Chen, F.H. Foundations on Expansive Soils; Elsevier: Amsterdam, The Netherlands, 2012; Volume 12. [Google Scholar]
  77. Janjuhah, H.T.; Ishfaque, M.; Mehmood, M.I.; Kontakiotis, G.; Shahzad, S.M.; Zarkogiannis, S.D. Integrated Underground Mining Hazard Assessment, Management, Environmental Monitoring, and Policy Control in Pakistan. Sustainability 2021, 13, 13505. [Google Scholar] [CrossRef]
  78. Dunham, R.J. Classification of Carbonate Rocks According to Depositional Textures; American Association of Petroleum Geosciences: Tulsa, OK, USA, 1962; pp. 108–121. [Google Scholar]
  79. Ramsay, D.; Dhir, R.; Spence, I. The role of rock and clast fabric in the physical performance of crushed-rock aggregate. Eng. Geol. 1974, 8, 267–285. [Google Scholar] [CrossRef]
  80. Hartley, A. A review of the geological factors influencing the mechanical properties of road surface aggregates. Q. J. Eng. Geol. 1974, 7, 69–100. [Google Scholar] [CrossRef]
  81. Lees, G.; Kennedy, C.K. Quality, shape and degradation of aggregates. Q. J. Eng. Geol. 1975, 8, 193–209. [Google Scholar] [CrossRef]
  82. ASTM C150/C150M-18; Standard Specification for Portland Cement. ASTM International: West Conshohocken, PA, USA, 2018.
  83. Oates, J. Lime and Limestone: Chemistry and Technology, Production and Uses; WileyVCH: Weinheim, Germany, 1998. [Google Scholar]
  84. Hewlett, P. Lea’s Chemistry of Cement and Concrete. 2004; Volume 4. Available online: https://www.elsevier.com/books/leas-chemistry-of-cement-and-concrete/hewlett/978-0-7506-6256-7 (accessed on 28 July 2022).
  85. Ertek, N.; Öner, F. Mineralogy, geochemistry of altered tuff from Cappadocia (Central Anatolia) and its use as potential raw material for the manufacturing of white cement. Appl. Clay Sci. 2008, 42, 300–309. [Google Scholar] [CrossRef]
  86. Insley, H. Microscopy of Ceramics and Cements; Academic Press, Inc.: New York, NY, USA, 1950. [Google Scholar]
  87. Tayeh, B.A.; Hasaniyah, M.W.; Zeyad, A.; Yusuf, M.O. Properties of concrete containing recycled seashells as cement partial replacement: A review. J. Clean. Prod. 2019, 237, 117723. [Google Scholar] [CrossRef]
  88. Smith, R.C. Materials of Construction; McGraw Hill Book, Gregg Division: New York, NY, USA, 1979. [Google Scholar]
  89. Derucher, K.N.; Heins, C.P. Materials for Civil and Highway Engineers. Prentice-Hill: Englewood Cliffs, NJ, USA, 1981.
  90. Hobbs, D.W. Alkali-Silica Reaction in Concrete; Thomas Telford Publishing: London, UK, 1988. [Google Scholar]
  91. Mehta, P.K. Concrete: Structure, Properties, and Materials; Prentice-Hall: Englewood Cliffs, NJ, USA, 1986. [Google Scholar]
  92. Aboutaleb, S.; Bagherpour, R.; Behnia, M.; Aghababaei, M. Combination of the physical and ultrasonic tests in estimating the uniaxial compressive strength and Young’s modulus of intact limestone rocks. Geotech. Geol. Eng. 2017, 35, 3015–3023. [Google Scholar] [CrossRef]
  93. Read, J.; Thornton, P.; Regan, W. A rational approach to the point load test. In Proceedings of the Third Australia-New Zealand Conference on Geomechanics, Wellington, New Zealand, 12–16 May 1980; p. 2. [Google Scholar]
  94. Aldeeky, H.; Al Hattamleh, O. Prediction of engineering properties of basalt rock in Jordan using ultrasonic pulse velocity test. Geotech. Geol. Eng. 2018, 36, 3511–3525. [Google Scholar] [CrossRef]
  95. Tandon, R.S.; Gupta, V. Estimation of strength characteristics of different Himalayan rocks from Schmidt hammer rebound, point load index, and compressional wave velocity. Bull. Eng. Geol. Environ. 2015, 74, 521–533. [Google Scholar] [CrossRef]
  96. Sajid, M.; Coggan, J.; Arif, M.; Andersen, J.; Rollinson, G. Petrographic features as an effective indicator for the variation in strength of granites. Eng. Geol. 2016, 202, 44–54. [Google Scholar] [CrossRef] [Green Version]
Figure 1. Geological map showing location of the study area in Sheikh Budin Hills, Marwat Range Pakistan (Modified from Ali et al. [43]), (a) geographical location of Pakistan, and (b) a regional structural map of the study area (The black lines indicate the fault lines and the blue lines are the river flow).
Sustainability 14 10812 g001
Figure 2. (a) The outcrop view of the Samana Suk Formation overlaying Datta Formation at foot of the hills. (b,c) A close-up view of the limestone exposure in the study area.
Sustainability 14 10812 g002
Figure 3. (A) Grab sample. (B) Bulk sample. (C,D) Major oxides determination in progress.
Sustainability 14 10812 g003
Figure 4. The major oxides compounds and calcite content of the limestone of the Samana Suk Formation.
Sustainability 14 10812 g004
Figure 5. Calculated data (stars) of the alkali–silica reactivity on the graph.
Sustainability 14 10812 g005
Figure 6. Photomicrographs showing important petrographic features in the investigated samples of the Samana Suk Formation: grainstone microfacies (ad), packstone microfacies (e), and wackstone microfacies (f).
Sustainability 14 10812 g006
Figure 7. Scanning electron microscopy images showing the fabric and morphology of the limestone of the Samana Suk Formation ((ad); Sc: suture contact; M: matrix; Sty: stylolite).
Sustainability 14 10812 g007
Figure 8. Correlation between UCS and PLT (a); UCS and UPV (b); UCS and SHRT (c); actual measured UCS vs. estimated UCS for Equation (1) (d); actual measured UCS vs. estimated UCS for Equation (2) (e); actual measured UCS vs. estimated UCS for Equation (3) (f); and actual measured UCS (MPa) vs. estimated UCS (MPa).
Sustainability 14 10812 g008
Figure 9. Regression analysis of UCS vs. ooids (a); peloids (b); bioclasts (c); BD (d); SG (e); WA (f); AIV (g); soundness (h); LAAV (i); and CL (j) in the LS of SSF.
Sustainability 14 10812 g009
Table 1. Test results performed on the aggregates parameters for construction industries in Pakistan.
Sample IDSGWA (%)BD (g/cm3)FI (%)EI (%)S (%)AIV (%)LAAV (%)CL (%)
SSK1 2.670.501.5719.4018.801.715.1325.000.40
SSK2 2.660.491.5816.0817.161.714.1823.320.39
SSK3 2.670.471.5915.2014.121.613.4622.660.37
SSK4 2.670.401.5916.1615.121.312.3721.760.24
SSK5 2.670.451.5916.6416.961.512.7922.260.28
SSK6 2.660.511.5417.5616.161.916.4426.040.42
Minimum 2.660.401.5415.2014.121.312.3721.760.24
Maximum 2.670.511.5919.4018.801.916.4426.040.42
Mean 2.660.471.5816.8416.391.614.0623.510.35
Standards (limits) for aggregates ASTM 127 (<2.6) for road and concrete aggregateASTM 127 (<2.5%) for concrete aggregateASTM C-29 (1.2–1.75 g/cm3)BS-882 (<40%) for road and cement concreteBS-812 105.2 (max. limit 25%) for cement concreteASTM C88 (L < 12%) for concrete aggregateBS 812:112 (max. 30%) for cement concreteASTM C-131 (<40%) for road aggregatesASTM C-142-10 (<1%) for road aggregate
SG = specific gravity; WA = water absorption; BD = bulk density; FI = flakiness index; EI = elongation index; S = soundness; AIV = aggregate impact value; LAAV = Los Angeles abrasion value; CL = clay lumps.
Table 2. Strength test results performed on the limestone samples for construction industries in Pakistan.
Sample IDUCS (MPa)PLT (MPa)UPV (m/s)SHRT (N)
SSK1a 78.444.925148.6544
SSK1b 81.925.085219.1846
SSK1c 76.464.815046.3643
SSK2a 83.415.255328.6748
SSK2b 80.094.925219.1847
SSK2c 77.394.815114.0945
SSK3a 85.604.925291.6749
SSK3b 90.985.035366.2051
SSK3c 92.075.305442.8652
SSK4a 98.345.685482.0152
SSK4b 100.285.795602.9456
SSK4c 101.475.895729.3258
SSK5a 97.515.465562.0450
SSK5b 95.275.355482.0152
SSK5c 92.265.085404.2653
SSK6a 79.755.084980.3943
SSK6b 76.865.034948.0545
SSK6c 73.834.764853.5046
Minimum 73.834.764853.5043
Maximum 101.475.895729.3258
Mean 86.775.185290.0849
Standards (Limits) High strength 60–200 MPa ISRM (ISRM 2008)Strong rock 4–10 MPa (Selby 1980)UPV > 4575 m/s (Excellent) (Malhotra 1976)Moderate to strong rock 40–60 N (Selby 1980)
UCS = uniaxial compressive strength; PLT = point load test; UPV = ultrasonic pulse velocity; SHRT = Schmidt hammer rebound test; MPa = megapascal; m/s = meter/second; N = rebound number.
Table 3. Pearson correlation analysis among major oxides and calcite of the limestone samples.
Major OxidesCaOMgONa2OFe2O3MnOSiO2P2O5TiO2Al2O3LOICaCO3
CaO 1.00----------
MgO −0.8571.00---------
Na2O −0.1330.3051.00--------
Fe2O3−0.1710.2000.2771.00-------
MnO −0.3040.055−0.3850.2771.00------
SiO2−0.7940.6450.1360.2220.1361.00-----
P2O50.143−0.060−0.0330.239−0.033−0.0271.00----
TiO2−0.2970.0250.0140.3570.2690.215−0.1521.00---
Al2O3−0.6530.4300.085−0.0610.0850.5600.0730.3911.00--
LOI 0.867−0.781−0.079−0.284−0.504−0.632−0.068−0.232−0.06111.00-
CaCO30.946−0.838−0.112−0.259−0.363−0.769−0.045−0.324−0.07020.9501.00
Table 4. Modal composition of the limestone of Pakistan.
Sample. ID.Micrite %Sparite %AllochemsDolomite %Silica %Stylolites/FracturesDunham
Classification
Silica Reactivity
OoidsPeloidsBioclastsTotal
SSK1 11312421135800yesPackstoneInnocuous
SSK2 363239188920yesGrainstoneInnocuous
SSK3 156221109310yesGrainstoneInnocuous
SSK4 28523089000noGrainstoneInnocuous
SSK5 364534129100noGrainstoneInnocuous
SSK6 75231192300yesWackstoneInnocuous
Publisher’s Note: MDPI stays neutral with regard to jurisdictional claims in published maps and institutional affiliations.

