
Digital Finance and Collaborative Innovation: Case Study of the Yangtze River Delta, China


Abstract
:1. Introduction
2. Review of the Literature and Research Hypotheses
3. Methodology and Data
3.1. Econometric Model
3.2. Variable Selection
3.2.1. Explanatory Variables: Urban Collaborative Innovation (coin)
3.2.2. Explanatory Variables: Digital Finance (DIF)
3.2.3. Mediation Variables
3.2.4. Control Variables
3.3. Data and Sample
3.4. Preliminary Investigation
4. Results
4.1. Baseline Regression Estimation Results—H1 Test
4.2. Estimated Results of Local Effects—Test of H2, H3, and H4
4.3. Estimated Results of the Spillover Effect—Test of H5 and H6
4.4. Robustness Test
5. Conclusions and Recommendations
5.1. Conclusions
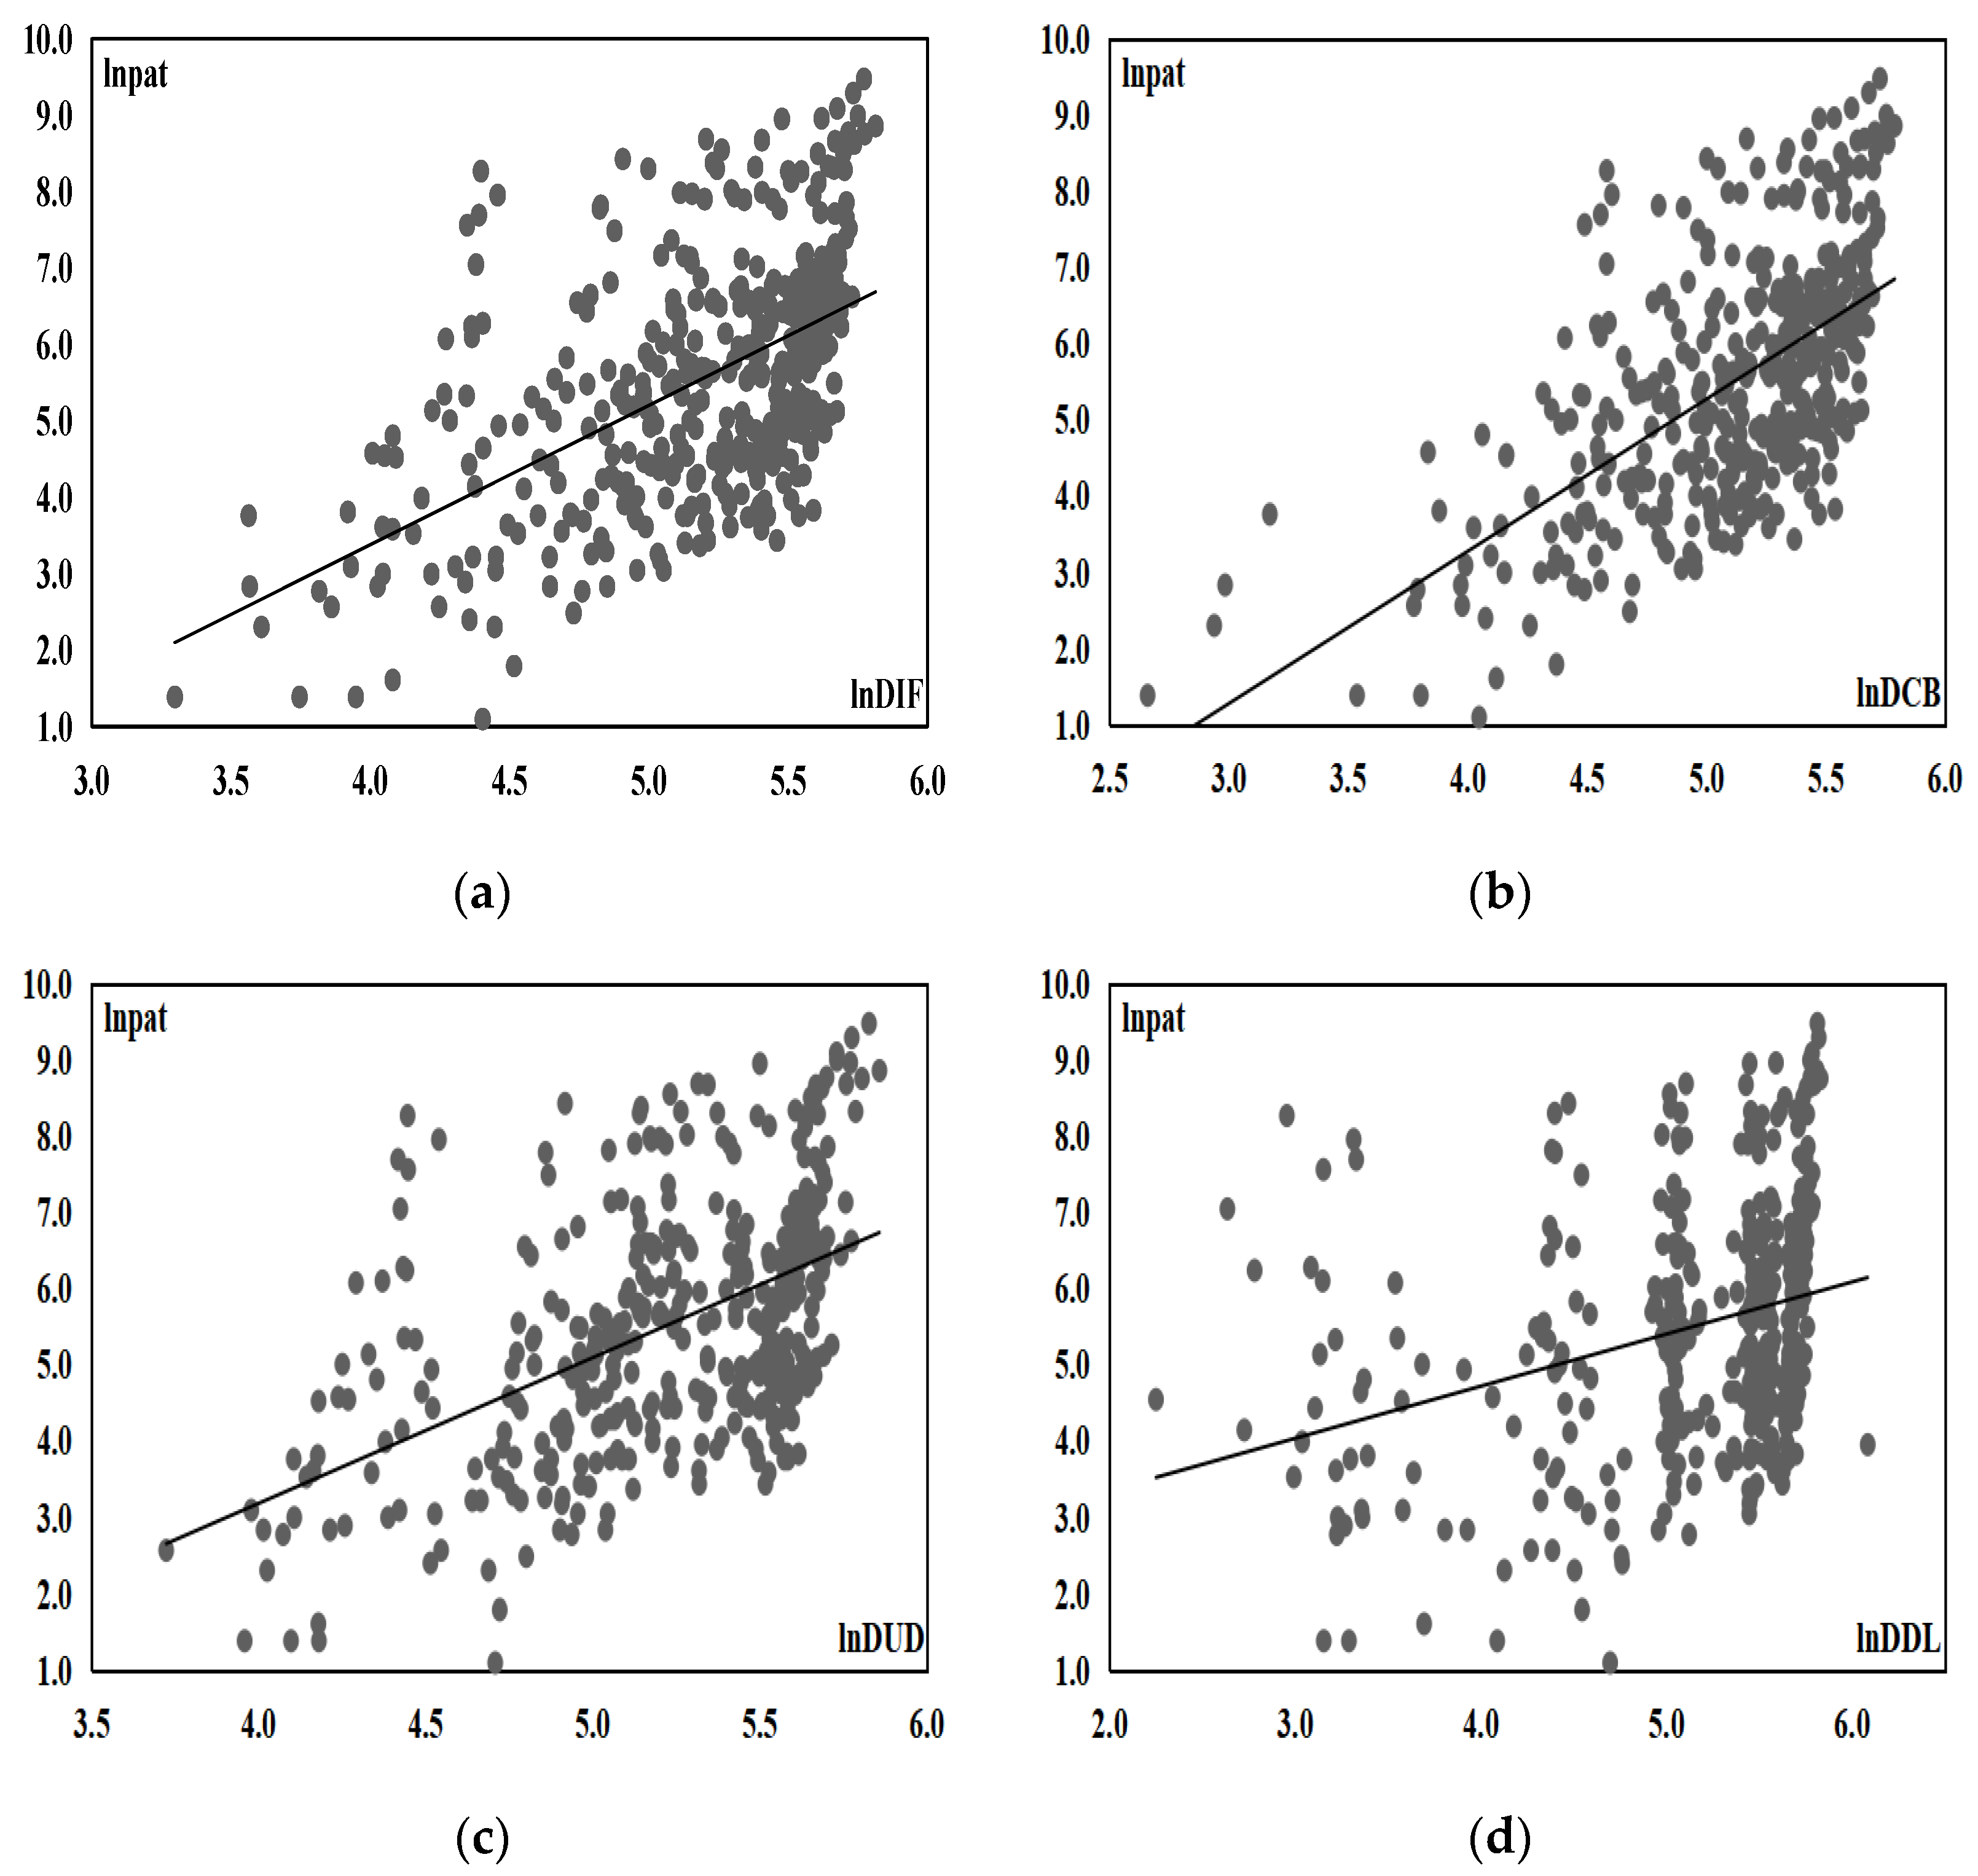
- (1)
- The scatter charts indicate a positive correlation between the improvement of digital finance, coverage breadth, depth of use, and degree of digitization, on the one hand, and the number of cooperative patents on the other. The correlation coefficients both exceed 0.5, which shows that digital finance can positively drive collaborative innovation and development;
- (2)
- The results of the GMM also confirm that digital finance can significantly drive collaborative innovation and development, but there are significant differences in the coverage breadth, depth of use, and degree of digitization. The role of the depth of use is the most significant, followed by the breadth of coverage and the degree of digitization, indicating that when promoting the coverage of digital financial services, the most important thing is to enhance the penetration of digital financial services, guiding costumers to use digital financial tools in depth, and actively participate in the development of digital technologies;
- (3)
- Digital finance can provide a positive local effect by increasing the scale of credit, driving social consumption, and assisting industrial upgrading, and indirectly drives the improvement of innovation performance, thereby providing favorable conditions for collaborative innovation;
- (4)
- Digital finance can promote the flow of R&D capital and R&D personnel. This also forms a positive spillover effect, which indirectly drives collaborative innovation.
5.2. Recommendations
- (1)
- Promote the integration of digital technology and financial services. Under the guidance of the Chinese national new infrastructure policy, the government should fully support the development and investment into emerging technologies such as big data, artificial intelligence, and industrial Internet; accelerate the effective flow of digital information; and create a favorable atmosphere for digital development in the YRD. In addition, traditional financial institutions should focus on digital transformation, promoting deep, inclusive integration, and the equal allocation of financial services. Finally, decision makers should make every effort to build an interconnected digital financial ecosystem, efficiently deploying digital financial tools, strengthening the positive spillover of digital finance, and realize the complementarity of digital financial resources;
- (2)
- Give full play to the effect of digital finance on the credit scale, social consumption, and industrial upgrading. The government should guide traditional financial institutions to apply digital technology to credit assessment, risk control, and service supervision, so as to continuously alleviate information asymmetry and reduce agency costs, thereby promoting the expansion of credit scale. In addition, it is necessary to expand the advantages of digital finance in third-party payment, credit loans, etc., constantly easing constraints on consumption and the use of mobile for e-commerce by issuing consumer electronic coupons. Finally, thanks to digital finance, small and micro-enterprises and individual industrial and commercial stakeholders can be driven to start businesses, activate the service industry market, and promote the advancement and rationalization of the industrial structure, while promoting the development of high-tech industries, driving the creation of new forms of sharing economy industries, and realizing industrial transformation and upgrading;
- (3)
- Give full play to the liquidity of the digital finance and encourage the free flow of R&D, which will drive innovation knowledge spillover conducive to the collaborative learning of cross-regional innovation. Therefore, it is necessary to give full play to the dominant position of digital finance in the allocation of the innovative capital, break down institutional barriers in cities, promote the integrated high-quality development of the YRD, and strengthen the implementation of cooperation and innovation projects between cities. At the same time, strengthening the main role of high-tech talents, continuously improving the reform of the registration system, lowering the threshold for high-tech talents to settle down, and promoting equal allocation of R&D manpower are important measures to implement. In addition, it is necessary to prevent the excessive flow of R&D and avoid the crowding-out effect of urban R&D, because the crowding-out effect will cause the distorted allocation of R&D, which will be detrimental to collaborative innovation and development of cities.
Author Contributions
Funding
Institutional Review Board Statement
Informed Consent Statement
Data Availability Statement
Conflicts of Interest
References
- Wang, Y.; Wang, C.; Mao, X.; Liu, B.; Zhang, Z.; Jiang, S. Spatial pattern and benefit allocation in regional collaborative innovation of the Yangtze River Delta, China. Chin. Geogr. Sci. 2021, 5, 900–914. [Google Scholar] [CrossRef]
- Tang, S.; Wu, X.; Zhu, J. Digital finance and enterprise technology innovation: Structural feature, mechanism identification and effect difference under financial supervision. J. Manag. World 2020, 36, 52–66. [Google Scholar]
- Ozili Peterson, K. Impact of digital finance on financial inclusion and stability. Borsa Istanb. Rev. 2018, 18, 329–340. [Google Scholar] [CrossRef]
- Scott, S.V.; Van Reenen, J.; Zachariadis, M. The long-term effect of digital innovation on bank performance: An empirical study of SWIFT adoption in financial services. Res. Policy 2017, 46, 984–1004. [Google Scholar] [CrossRef]
- Manyika, J.; Lund, S.; Singer, M.; White, O.; Berry, C. Digital Finance for All: Powering Inclusive Growth in Emerging Economies; McKinsey Global Institute: Chicago, IL, USA, 2016; Volume 9. [Google Scholar]
- Wang, Q.; Yang, J.; Chiu, Y.; Lin, T. The impact of digital finance on financial efficiency. Manag. Decis. Econ. 2020, 41, 1225–1236. [Google Scholar] [CrossRef]
- Huang, Y.; Huang, Z. The development of digital finance in China: Present and future. China Econ. Q. 2018, 17, 1489–1502. [Google Scholar]
- Zheng, W.; Zhao, H.; Fan, H. A research on the incentive effect of digital finance development on regional innovation. Sci. Res. Manag. 2021, 42, 138–146. [Google Scholar]
- Hartmut, H. Financial Market and Technological Innovation. Ind. Innov. 2011, 18, 351–368. [Google Scholar]
- Demertzis, M.; Merler, S.; Wolff, G.B. Capital markets union and the fintech opportunity. J. Financ. Regul. 2018, 4, 157–165. [Google Scholar] [CrossRef]
- Han, H.; Gu, X. Linkage between inclusive digital finance and high-tech enterprise innovation performance: Role of debt and equity financing. Front. Psychol. 2021, 12, 814408. [Google Scholar] [CrossRef]
- Yao, L.; Yang, X. Can digital finance boost SME innovation by easing financing constraints? Evidence from Chinese GEM-listed companies. PLoS ONE. 2022, 17, e0264647. [Google Scholar] [CrossRef] [PubMed]
- Fei, F.; Huan, L.; Song, W. Can regional collaborative innovation improve innovation efficiency? An empirical study of Chinese cities. Growth Change 2020, 51, 440–463. [Google Scholar]
- Guan, J.C.; Zuo, K.R.; Chen, K.H.; Yam, R.C.M. Does country-level R&D efficiency benefit from the collaboration network structure? Res. Policy 2016, 45, 770–784. [Google Scholar]
- Guo, Z.; Peng, Y.; Chen, Y. How digital finance affects the continuous technological innovation of Chinese energy companies? Front. Energy Res. 2022, 10, 833436. [Google Scholar] [CrossRef]
- Li, J.; Li, B. Digital inclusive finance and urban innovation: Evidence from China. Rev. Dev. Econ. 2022, 26, 1010–1034. [Google Scholar] [CrossRef]
- Fan, W.; Wu, H.; Liu, Y. Does digital finance induce improved financing for green technological innovation in China? Discret. Dyn. Nat. Soc. 2022; in press. [Google Scholar] [CrossRef]
- Liu, J.; Jiang, Y.; Gan, S.; He, L.; Zhang, Q. Can digital finance promote corporate green innovation? Environ. Sci. Pollut. Res. 2022, 29, 35828–35840. [Google Scholar] [CrossRef]
- Hanley, D.; Li, J.; Wu, M. High-speed railways and collaborative innovation. Reg. Sci. Urban. Econ. 2022, 93, 103717. [Google Scholar] [CrossRef]
- Yang, R.; Che, T.; Lai, F. The Impacts of production linkages on cross-regional collaborative innovations: The role of inter-regional network capital. Technol. Forecast. Soc. Change 2021, 170, 120905. [Google Scholar] [CrossRef]
- Scherngell, T.; Hu, Y. Collaborative knowledge production in China: Regional evidence from a gravity model approach. Reg. Stud. 2011, 45, 755–772. [Google Scholar] [CrossRef]
- Zang, X.; Ma, Y.; Wang, C. Study on the motivations and influencing factors of regional synergy innovation based on the perspective of efficiency. Soft Sci. 2017, 31, 6–9. [Google Scholar]
- Ying, L.; Li, M.; Yang, J. Agglomeration and driving factors of regional innovation space based on intelligent manufacturing and green economy. Environ. Technol. Innov. 2021, 22, 101398. [Google Scholar] [CrossRef]
- Fan, F.; Zhang, X.; Wang, X. Are there political cycles hidden inside collaborative innovation efficiency? An empirical study based on Chinese cities. Sci. Public Policy 2022, 49, 532–551. [Google Scholar] [CrossRef]
- Luo, D.; Luo, M.; Lv, J. Can digital finance contribute to the promotion of financial sustainability? A financial efficiency perspective. Sustainability 2022, 14, 3979. [Google Scholar] [CrossRef]
- Foellmi, R.; Zweimüller, J. Income distribution and demand-induced innovations. Rev. Econ. Stud. 2006, 73, 941–960. [Google Scholar] [CrossRef]
- Zhang, X.; Yang, T.; Wang, C.; Wan, G. Digital finance and household consumption: Theory and evidence from China. J. Manag. World 2020, 36, 48–63. [Google Scholar]
- Zheng, W.; Zhao, H. Can the development of digital finance drive the convergence of regional technological innovation?—Empirical evidence from 284 cities in China. Mod. Econ. Sci. 2021, 43, 99–111. [Google Scholar]
- Griliches, Z. Capital-Skill Complementarity. Rev. Econ. Stat. 1969, 51, 465–468. [Google Scholar] [CrossRef]
- Zhou, H.; Xu, G. Research on the impact of green finance on China’s regional ecological development based on system GMM model. Resour. Policy 2022, 75, 102454. [Google Scholar] [CrossRef]
- Yu, N.; Wang, Y. Can digital inclusive finance narrow the Chinese urban-rural Income gap? the perspective of the regional urban-rural income structure. Sustainability 2021, 13, 6427. [Google Scholar] [CrossRef]
- Acs, Z.J.; Audretsch, D.B. Patents as a measure of innovative activity. Kyklos 1989, 42, 171–180. [Google Scholar] [CrossRef]
- Guo, F.; Wang, J.; Wang, F.; Kong, T.; Zhang, X.; Cheng, Z. Measuring the development of digital financial inclusion in China: Index compilation and spatial characteristics. China Econ. Q. 2020, 19, 1401–1418. [Google Scholar]
- Chang, S. The determinants and motivations of China’s outward foreign direct investment: A spatial gravity model approach. Glob. Econ. Rev. 2014, 43, 244–268. [Google Scholar] [CrossRef]
- Zipf, G.K. The P1 P2/D hypothesis: On the intercity movement of persons. Am. Sociol. Rev. 1946, 11, 677–686. [Google Scholar] [CrossRef]
- Bai, J.; Wang, Y.; Jiang, F.; Li, J. R&D element flow, spatial knowledge spillovers and economic growth. Econ. Res. J. 2017, 52, 109–123. [Google Scholar]
- Cai, W.; Ye, P. Local-neighborhood effects of different environmental regulations on green innovation: Evidence from prefecture level cities of China. Environ. Dev. Sustain. 2022, 24, 4810–4834. [Google Scholar] [CrossRef]


| Variables | Symbols | Mean | Std. Dev. | Min | Max | |
|---|---|---|---|---|---|---|
| Explained variables | Collaborative innovation | lncoin | 5.513 | 1.609 | 1.099 | 9.474 |
| Explanatory variables | Digital finance | lnDIF | 5.170 | 0.476 | 3.299 | 5.813 |
| Breadth of coverage | lnDCB | 5.121 | 0.491 | 2.660 | 5.788 | |
| Depth of use | lnDUD | 5.219 | 0.433 | 3.723 | 5.857 | |
| Degree of digitization | lnDDL | 5.162 | 0.723 | 2.250 | 6.082 | |
| Mediating variables | Regional credit scale | lnloan | 0.102 | 0.356 | −0.750 | 1.116 |
| Social consumption | lnscon | 0.838 | 0.580 | −0.855 | 2.128 | |
| Industrial upgrading | lnindu | 2.688 | 0.899 | 0.982 | 5.912 | |
| R&D capital flow | lnrdcf | 4.377 | 1.714 | 0.380 | 7.998 | |
| R&D personnel turnover | lnrdlf | 4.032 | 1.423 | 1.131 | 8.185 | |
| Control variables | Economic development | lnpgdp | 10.62 | 0.560 | 9.016 | 12.013 |
| Human capital | lnhuma | 4.937 | 0.772 | 3.080 | 7.156 | |
| Degree of fdi | lnfdi | 0.761 | 0.786 | −2.671 | 2.232 | |
| International trade | lntrad | 2.926 | 1.054 | 0.576 | 5.586 | |
| Infrastructure | lnroad | 3.061 | 0.382 | 1.396 | 3.837 | |
| Government support | lngove | 1.058 | 0.610 | −0.826 | 2.641 |
| Variables | (1) | (2) | (3) | (4) | (5) | (6) |
|---|---|---|---|---|---|---|
| lncoin | lncoin | lncoin | lncoin | lncoin | lncoin | |
| L1.lncoin | 0.483 *** | 0.470 *** | 0.556 *** | 0.546 *** | 0.630 *** | 0.691 *** |
| (6.677) | (24.233) | (31.162) | (24.121) | (49.327) | (41.406) | |
| lnDIF | 0.527 *** | 0.546 *** | 0.553 *** | |||
| (3.928) | (10.449) | (10.329) | ||||
| lnDCB | 0.484 *** | |||||
| (7.450) | ||||||
| lnDUD | 0.500 *** | |||||
| (15.335) | ||||||
| lnDDL | 0.196 *** | |||||
| (10.085) | ||||||
| lnpgdp | 0.004 | 0.090 ** | 0.357 *** | 0.340 *** | 0.324 *** | 0.400 *** |
| (0.029) | (2.445) | (6.342) | (5.712) | (5.585) | (7.736) | |
| lnhuma | 0.102 | 0.043 | 0.009 | −0.056 | 0.045 | 0.025 |
| (1.206) | (1.120) | (0.177) | (−1.082) | (0.959) | (0.665) | |
| lnfdi | −0.021 | 0.052 *** | 0.038 ** | 0.026 * | 0.027 | −0.034 * |
| (−0.387) | (3.644) | (2.417) | (1.796) | (1.456) | (−1.676) | |
| lntrad | 0.045 | 0.125*** | 0.346 *** | 0.322 *** | 0.274 *** | 0.271 *** |
| (0.799) | (3.547) | (10.453) | (6.918) | (8.894) | (7.749) | |
| lnroad | 0.116 | 0.672 *** | 0.076 | 0.337 *** | 0.029 | 0.084 |
| (0.613) | (11.937) | (0.774) | (3.283) | (0.334) | (0.882) | |
| lngove | 0.035 | −0.204 *** | −0.188 *** | −0.199 *** | −0.247 *** | −0.142 *** |
| (0.631) | (−4.674) | (−6.664) | (−4.411) | (−8.457) | (−3.321) | |
| Constant | −0.813 | −3.203 *** | −5.198 *** | −4.977 *** | −4.716 *** | −4.382 *** |
| (−0.533) | (−6.981) | (−8.651) | (−8.849) | (−8.568) | (−9.147) | |
| Method | FE | DIF-GMM | SYS-GMM | SYS-GMM | SYS-GMM | SYS-GMM |
| AR(1) test | 0.0003 | 0.0002 | 0.0001 | 0.0002 | 0.0002 | |
| AR(2) test | 0.4809 | 0.5980 | 0.4109 | 0.7212 | 0.6132 | |
| Sargan test | 0.3937 | 0.9158 | 0.9379 | 0.9416 | 0.8946 | |
| Observations | 409 | 328 | 369 | 369 | 369 | 369 |
| R2 | 0.810 |
| Variables | (1) | (2) | (3) | (4) | (5) | (6) | (7) |
|---|---|---|---|---|---|---|---|
| lncoin | lnloan | lnscon | lnindu | lncoin | lncoin | lncoin | |
| L1.lncoin | 0.556 *** | 0.544 *** | 0.540 *** | 0.561 *** | |||
| (31.162) | (33.032) | (27.628) | (31.525) | ||||
| L1.lnloan | 0.930 *** | ||||||
| (53.824) | |||||||
| L1.lnscon | 0.744 *** | ||||||
| (44.827) | |||||||
| L1.lnindu | 0.801 *** | ||||||
| (61.848) | |||||||
| lnDIF | 0.553 *** | 0.068 *** | 0.156 *** | 0.126 *** | 0.467 *** | 0.452 *** | 0.244 *** |
| (10.329) | (11.012) | (13.922) | (18.827) | (8.643) | (7.236) | (4.832) | |
| lnloan | 0.340 *** | ||||||
| (4.009) | |||||||
| lnscon | 0.171 *** | ||||||
| (3.323) | |||||||
| lnindu | 0.613 *** | ||||||
| (9.851) | |||||||
| lnpgdp | 0.357 *** | −0.207 *** | 0.357 *** | 0.290 *** | 0.412 *** | 0.254 *** | −0.111 * |
| (6.342) | (−14.265) | (19.743) | (17.082) | (6.871) | (4.170) | (−1.926) | |
| lnhuma | 0.009 | 0.153 *** | −0.113 *** | −0.219 *** | −0.073 | 0.009 | 0.006 |
| (0.177) | (12.359) | (−9.550) | (−19.150) | (−1.424) | (0.180) | (0.092) | |
| lnfdi | 0.038 ** | 0.005 | 0.069 *** | 0.014 *** | 0.038 ** | 0.047 *** | 0.106 *** |
| (2.417) | (1.121) | (8.793) | (3.553) | (2.271) | (2.760) | (4.396) | |
| lntrad | 0.346 *** | 0.056 *** | −0.071 *** | 0.061 *** | 0.299 *** | 0.339 *** | 0.247 *** |
| (10.453) | (7.703) | (−10.882) | (6.206) | (6.239) | (9.674) | (8.938) | |
| lnroad | 0.076 | −0.003 | 0.015 | −0.068 *** | 0.022 | 0.045 | 0.457 *** |
| (0.774) | (−0.202) | (0.619) | (−6.340) | (0.191) | (0.465) | (4.700) | |
| lngove | −0.188 *** | −0.023 *** | 0.048 *** | 0.022 *** | −0.205 *** | −0.183 *** | −0.241 *** |
| (−6.664) | (−4.424) | (5.462) | (4.107) | (−5.608) | (−5.706) | (−5.319) | |
| Constant | −5.198 *** | 0.997 *** | −3.697 *** | −2.098 *** | −4.571 *** | −3.539 *** | −1.119 ** |
| (−8.651) | (5.696) | (−14.489) | (−12.319) | (−7.058) | (−4.588) | (−2.003) | |
| Method | SYS-GMM | SYS-GMM | SYS-GMM | SYS-GMM | SYS-GMM | SYS-GMM | SYS-GMM |
| AR(1) test | 0.0002 | 0.0181 | 0.0001 | 0.0438 | 0.0002 | 0.0002 | 0.0002 |
| AR(2) test | 0.5980 | 0.7323 | 0.9240 | 0.2680 | 0.5713 | 0.5898 | 0.4994 |
| Sargan test | 0.9158 | 0.8983 | 0.8652 | 0.8748 | 0.9208 | 0.9204 | 0.9537 |
| Observations | 369 | 369 | 369 | 369 | 369 | 369 | 369 |
| Variables | (1) | (2) | (3) | (4) | (5) |
|---|---|---|---|---|---|
| lncoin | lnrdcf | lnrdlf | lncoin | lncoin | |
| L1.lncoin | 0.556 *** | 0.533 *** | 0.531 *** | ||
| (31.162) | (25.702) | (28.170) | |||
| L1.lnrdcf | 0.819 *** | ||||
| (58.988) | |||||
| L1.lnrdlf | 0.753 *** | ||||
| (35.059) | |||||
| lnDIF | 0.553 *** | 0.090 *** | 0.088 *** | 0.291 *** | 0.366 *** |
| (10.329) | (5.267) | (2.915) | (5.445) | (7.103) | |
| lnrdcf | 0.260 *** | ||||
| (8.944) | |||||
| lnrdlf | 0.230 *** | ||||
| (9.021) | |||||
| lnpgdp | 0.357 *** | 0.177 *** | 0.155 *** | 0.035 | 0.193 *** |
| (6.342) | (10.172) | (3.242) | (0.850) | (3.502) | |
| lnhuma | 0.009 | 0.052 ** | −0.025 | −0.021 | 0.029 |
| (0.177) | (1.986) | (−0.575) | (−0.401) | (0.581) | |
| lnfdi | 0.038 ** | −0.030 *** | 0.052 *** | 0.035 *** | 0.068 *** |
| (2.417) | (−3.367) | (3.529) | (3.476) | (3.905) | |
| lntrad | 0.346 *** | −0.010 | 0.019 | 0.279 *** | 0.285 *** |
| (10.453) | (−0.921) | (1.133) | (9.665) | (10.228) | |
| lnroad | 0.076 | 0.290 *** | −0.086 | 0.068 | 0.097 |
| (0.774) | (6.014) | (−1.463) | (0.985) | (1.589) | |
| lngove | −0.188 *** | 0.015 | 0.269 *** | −0.179 *** | −0.141 *** |
| (−6.664) | (0.659) | (11.181) | (−5.902) | (−3.727) | |
| Constant | −5.198 *** | −2.549 *** | −0.989 ** | −1.068 ** | −3.337 *** |
| (−8.651) | (−14.676) | (−2.118) | (−2.138) | (−5.710) | |
| Method | SYS-GMM | SYS-GMM | SYS-GMM | SYS-GMM | SYS-GMM |
| AR(1) test | 0.0002 | 0.0017 | 0.0005 | 0.0003 | 0.0002 |
| AR(2) test | 0.5980 | 0.0176 | 0.9179 | 0.7652 | 0.6321 |
| Sargan test | 0.9158 | 0.8786 | 0.8918 | 0.8982 | 0.9551 |
| Observations | 369 | 369 | 369 | 369 | 369 |
| Variables | (1) | (2) | (3) | (4) | (5) |
|---|---|---|---|---|---|
| lnipat | lnnpat | OLS | FE | IV | |
| L1.lnipat | 0.449 *** | ||||
| (20.458) | |||||
| L1.lnnpat | 0.523 *** | ||||
| (32.382) | |||||
| lnDIF | 0.782 *** | 0.518 *** | 1.323 *** | 1.500 *** | 1.193 *** |
| (13.662) | (11.304) | (12.788) | (2.855) | (8.571) | |
| lnpgdp | 0.508 *** | 0.362 *** | 1.076 *** | 0.168 | 1.083 *** |
| (7.396) | (7.190) | (6.349) | (0.746) | (5.968) | |
| lnhuma | −0.036 | 0.124 *** | 0.014 | −0.037 | 0.023 |
| (−0.769) | (2.915) | (0.168) | (−0.247) | (0.247) | |
| lnfdi | 0.013 | −0.013 | 0.086 | 0.080 | 0.068 |
| (0.521) | (−0.631) | (1.343) | (0.856) | (1.071) | |
| lntrad | 0.337 *** | 0.312 *** | 0.205 *** | 0.127 * | 0.196 ** |
| (5.163) | (15.068) | (2.642) | (1.712) | (2.526) | |
| lnroad | 0.165 ** | 0.043 | −0.280 ** | −0.133 | −0.251 * |
| (2.298) | (0.555) | (−2.172) | (−0.391) | (−1.645) | |
| lngove | −0.110 *** | −0.227 *** | 0.448 *** | 0.100 | 0.487 *** |
| (−3.222) | (−5.698) | (3.824) | (1.024) | (3.959) | |
| Constant | −7.913 *** | −5.505 *** | −13.108 *** | −3.618 | −12.635 *** |
| (−9.986) | (−11.154) | (−8.199) | (−1.235) | (−7.197) | |
| AR(1) test | 0.0002 | 0.0007 | |||
| AR(2) test | 0.7219 | 0.2961 | |||
| Sargan test | 0.9338 | 0.9385 | |||
| Kleibergen–Paap rk LM statistic | 136.920 *** | ||||
| (0.000) | |||||
| Cragg–Donald Wald F statistic | 363.352 | ||||
| [19.93] | |||||
| Observations | 369 | 369 | 410 | 410 | 410 |
| R2 | 0.691 | 0.755 | 0.690 |
Publisher’s Note: MDPI stays neutral with regard to jurisdictional claims in published maps and institutional affiliations. |
© 2022 by the authors. Licensee MDPI, Basel, Switzerland. This article is an open access article distributed under the terms and conditions of the Creative Commons Attribution (CC BY) license (https://creativecommons.org/licenses/by/4.0/).
Share and Cite
Zhao, H.; Zheng, W.; Loutfoullina, I. Digital Finance and Collaborative Innovation: Case Study of the Yangtze River Delta, China. Sustainability 2022, 14, 10784. https://doi.org/10.3390/su141710784
Zhao H, Zheng W, Loutfoullina I. Digital Finance and Collaborative Innovation: Case Study of the Yangtze River Delta, China. Sustainability. 2022; 14(17):10784. https://doi.org/10.3390/su141710784
Chicago/Turabian StyleZhao, Hongyan, Wanteng Zheng, and Irina Loutfoullina. 2022. "Digital Finance and Collaborative Innovation: Case Study of the Yangtze River Delta, China" Sustainability 14, no. 17: 10784. https://doi.org/10.3390/su141710784
APA StyleZhao, H., Zheng, W., & Loutfoullina, I. (2022). Digital Finance and Collaborative Innovation: Case Study of the Yangtze River Delta, China. Sustainability, 14(17), 10784. https://doi.org/10.3390/su141710784