1. Introduction
With the notable rise in the tourism economy during holidays in China, the travel characteristics and needs of people have significantly changed. Some suburban expressways that have been put into operation within the last 20 years still experience long-term congestion, which greatly exceeds the possibility of traffic congestion according to the design expectation. Thus, this leads to serious traffic pollution [
1] and social benefit loss. This phenomenon has caused scholars to question the rationality of the design hourly volume (DHV) as an expressway geometric design basis.
Peabody discussed the general law of annual HV in descending order in 1941. After arranging hourly traffic volume (HV) data over 1 year in descending order, the decrease rate of the peak HV was characterized by a steep-to-slow transition process and was the most prominent at approximately the 30th to 50th hour [
2]. This becomes the basic rule of DHV method. In the following decades, Cameron, Walker, Bailey, and other scholars gradually clarified the concept of knee-of-the-curve using a large number of traffic data. In other words, the 30th highest hourly volume (30 HV) is at the typical position where the speed of HV decline slows down [
3,
4,
5]. Sharma analyzed the economy of choosing different DHV, and they considered that using 30 HV as DHV can balance engineering cost and traffic efficiency [
6]. Subsequently, the industry gradually established a consistent and predictable relationship between the 30 HV and the annual average daily traffic volume (AADT) [
4].
Until the end of the last century, the 30 HV factor, i.e., the ratio of the 30 HV to the AADT, was used as the DHV factor to guide expressway design [
7,
8]. The product of the predicted AADT, directional nonuniformity coefficient D, and recommended value of the DHV factor was adopted as the DHV for the proposed road.
Some scholars found that travel characteristics will have an impact on the annual traffic volume characteristics. Glauz found that the traffic growth rate of tourist roads was 1.5–2 times that of other roads [
9]. Using the data of Texas, Walters found that the truck ratio and the nonuniformity of direction of expressway would affect the estimation of DHV [
10]. On the basis of the observed data, Sharma found that the proposed direction inhomogeneity coefficient D would have a significant impact on the calculation of design hour traffic volume [
11,
12]. Capparuccini found seasonal fluctuations in traffic volume in some areas [
13]. These studies indicate that the DHV based on the 30 HV and the 30 HV factor could be determined via the traditional rule of the peak HV distribution [
5]. This quantity is closely related to the travel characteristics of people. The season, time of day, population, economy, policy, and other special factors such as COVID-19 pandemic [
14] affect the distribution characteristics of traffic volume, thereby affecting the hourly traffic distribution.
In DHV research considering travel characteristic differences, AADT estimation has received attention. Sharma and Liu analyzed data pertaining to Alberta Province and used a nonparametric test method to analyze the pattern of holiday traffic fluctuations [
15]. Using a neural network algorithm, an AADT estimation method considering holiday travel characteristics was proposed [
16]. Capparuccini, Byrne, and Splawinska used regression analysis or artificial neural networks to analyze data for Florida, Delaware, and Vermont and proposed an AADT estimation method considering seasonal changes [
12,
17,
18]. Satish also considered seasonal factors and established an AADT estimation method using July and August data [
19]. These studies have positively contributed to the improvement in the DHV estimation accuracy under different travel characteristics. However, they still assumed that the distribution of the peak HV, including the 30 HV, conforms to the original derivation pattern. In other words, these studies are based on the typicality of the 30 HV. Bailey and Sharma studied the limitations of the applicability of the 30 HV as the DHV, but they mainly focused on the variation in the ratio of the 30 HV to the AADT [
20,
21], rather than the change in travel characteristics.
In general, the reason for taking 30HV as DHV is that 30 HV has good predictability and is in the knee-of-the-curve. It can balance economy and efficiency. Subsequently, scholars found that people’s travel characteristics would influence the distribution of traffic volume, and then affect the applicability of DHV method. A large number of studies focused on the impact of travel characteristics on the predictability of 30 HV, which focuses on solving the prediction accuracy of AADT under different travel characteristics. On the other hand, the impact of travel characteristics on the typicality of 30 HV remains unclear.
In 1990, China collected and analyzed regional HV data and verified the applicability of the 30 HV as the DHV. According to the actual conditions in China, the value of the DHV factor was studied. Considering meteorological conditions and expressway location, recommended values of the DHV factor were provided for different regions throughout China [
22], which have been used to date [
23]. However, since 1999, China has increased the number of statutory holidays. At the same time, national car ownership rapidly increased, from 14.5 million to 402 million vehicles, a 27.6-fold increase. In particular, the free expressway policy during holidays implemented in 2012 has promoted the rapid development of the tourism economy and altered the characteristics of public travel behavior. Expressways have become the focus of social attention due to normalized congestion issues [
24,
25,
26]. This change in travel characteristics may affect the applicability of the DHV and may result in widespread congestion today.
Although the DHV method has been consistently used for decades, the rise in China’s tourism economy may directly affect the HV distribution, which constitutes the basis of this method. What is the impact of significant changes in the holiday travel demand on the peak HV distribution? Does the 30 HV still conform to the geometric design requirements of suburban expressways under the background of the tourism economy? How should the DHV be corrected? Exploring whether the standards of the DHV and its parameters are still applicable in the geometric design of suburban expressways within the context of the tourism economy and proposing corresponding correction methods could provide new solutions to the problem of widespread traffic congestion.
This paper collected traffic data from 2017 to 2019 at the Xi’an Ring Expressway Traffic Observatory in China and selected annual hourly traffic samples satisfying the analysis needs. A dataset of the HV and HV factors in descending order was compiled. Compared to the traditional specifications, the change in the annual HV value and the HV factor of the peak hour distribution under the background of the tourism economy, typicality of the 30 HV factor, and applicability of the DHV factor were analyzed. Lastly, combined with traffic characteristics considering the tourism economy, this paper proposes suggestions for DHV correction.
Section 2 describes the source of data and preprocessing methods, including the selection of analysis data, the elimination of low-reliability data, and the interpolation of missing data.
Section 3 studies the differences between the hourly annual HV distribution and peak HV distribution of suburban expressways and the traditional laws under the background of tourism economy, as well as finds the changes in the travel characteristics and peak HV distribution characteristics of suburban expressways and the inapplicability of DHV.
Section 4 discusses the reliability of data interpolation method, traffic demand under the background of tourism economy, the correction of the DHV method, and the transferability of the results.
Section 5 summarizes the findings.
2. Materials and Methods
Because the first hundreds of hours of traffic demonstrated a rapid decline in characteristics, choosing the traffic factor during a given hour as the basis of geometric design could seriously affect the economy and service level of road construction. On the basis of the analysis of the distribution of the HV factor during the first hundreds of hours, scholars proposed the HV value during different hours as the basis for DHV determination. Among these approaches, a representative and widely used metric is the DHV based on the 30 HV. Researchers also proposed that the traffic volume during the 20th to 40th hours could be employed as the DHV. The selection of the 30 HV value as the DHV mainly considers two aspects. First, the fluctuation in the 30 HV factor is relatively negligible, which ensures that the predicted results closely reflect the actual traffic conditions. Second, the 30th hour is the position in which the decline rate of the HV exhibits a steep-to-slow transition. The application of this HV as the DHV could ensure that the traffic remains smooth within 99.67% of the year, while this approach would not cause a substantial increase in the project scale due to an increase in the number of service objects, i.e., a balance between the traffic efficiency and engineering economy would be maintained. Under the background of the tourism economy, whether the 30 HV factor still exhibits the above characteristics remains the key question to be answered in this paper.
In order to answer this question, this paper collects traffic data of Xi’an Ring Expressway from 2017 to 2019. On the basis of the collected data, the overall distribution of annual hourly traffic volume was tested, while HV distribution characteristics, 30th highest hourly volume typicality, and DHV factor applicability were investigated.
2.1. Data Acquisition
In this paper, 8760 h of HV data at traffic observation stations along the Xi’an Ring Expressway from 2017 to 2019 were collected. These data were obtained from the Road Network Center of Shaanxi Provincial Department of Transportation.
By the end of 2019, vehicle ownership in Xi’an reached 3.43 million vehicles, ranking eighth in China, with a large traffic scale and high traffic demand. There are 17 sections of the Xi’an expressway surrounding the city. Each section contains traffic observation stations, and traffic data can be obtained throughout the year, which can meet the requirements of sample diversity. The main sections of the expressway opened in 2003. After a long period of operation, the expressway is no longer in a period of rapid traffic growth. The annual hourly traffic volume and traffic composition are relatively stable. The expressway subgrade width is 35 m. According to the two-way six-lane design, the design speed is 120 km/h, and access is controlled. The expressway exhibits the characteristics of typical suburban areas. Research on the characteristics of the annual HV is greatly affected by the integrity and generality of traffic data. The factors influencing the integrity of traffic data include the lack of data due to road reconstruction, expansion, maintenance, and damage of observation instruments. The general factors include travel restrictions attributed to uncontrollable factors, such as the traffic ban during the COVID-19 pandemic period [
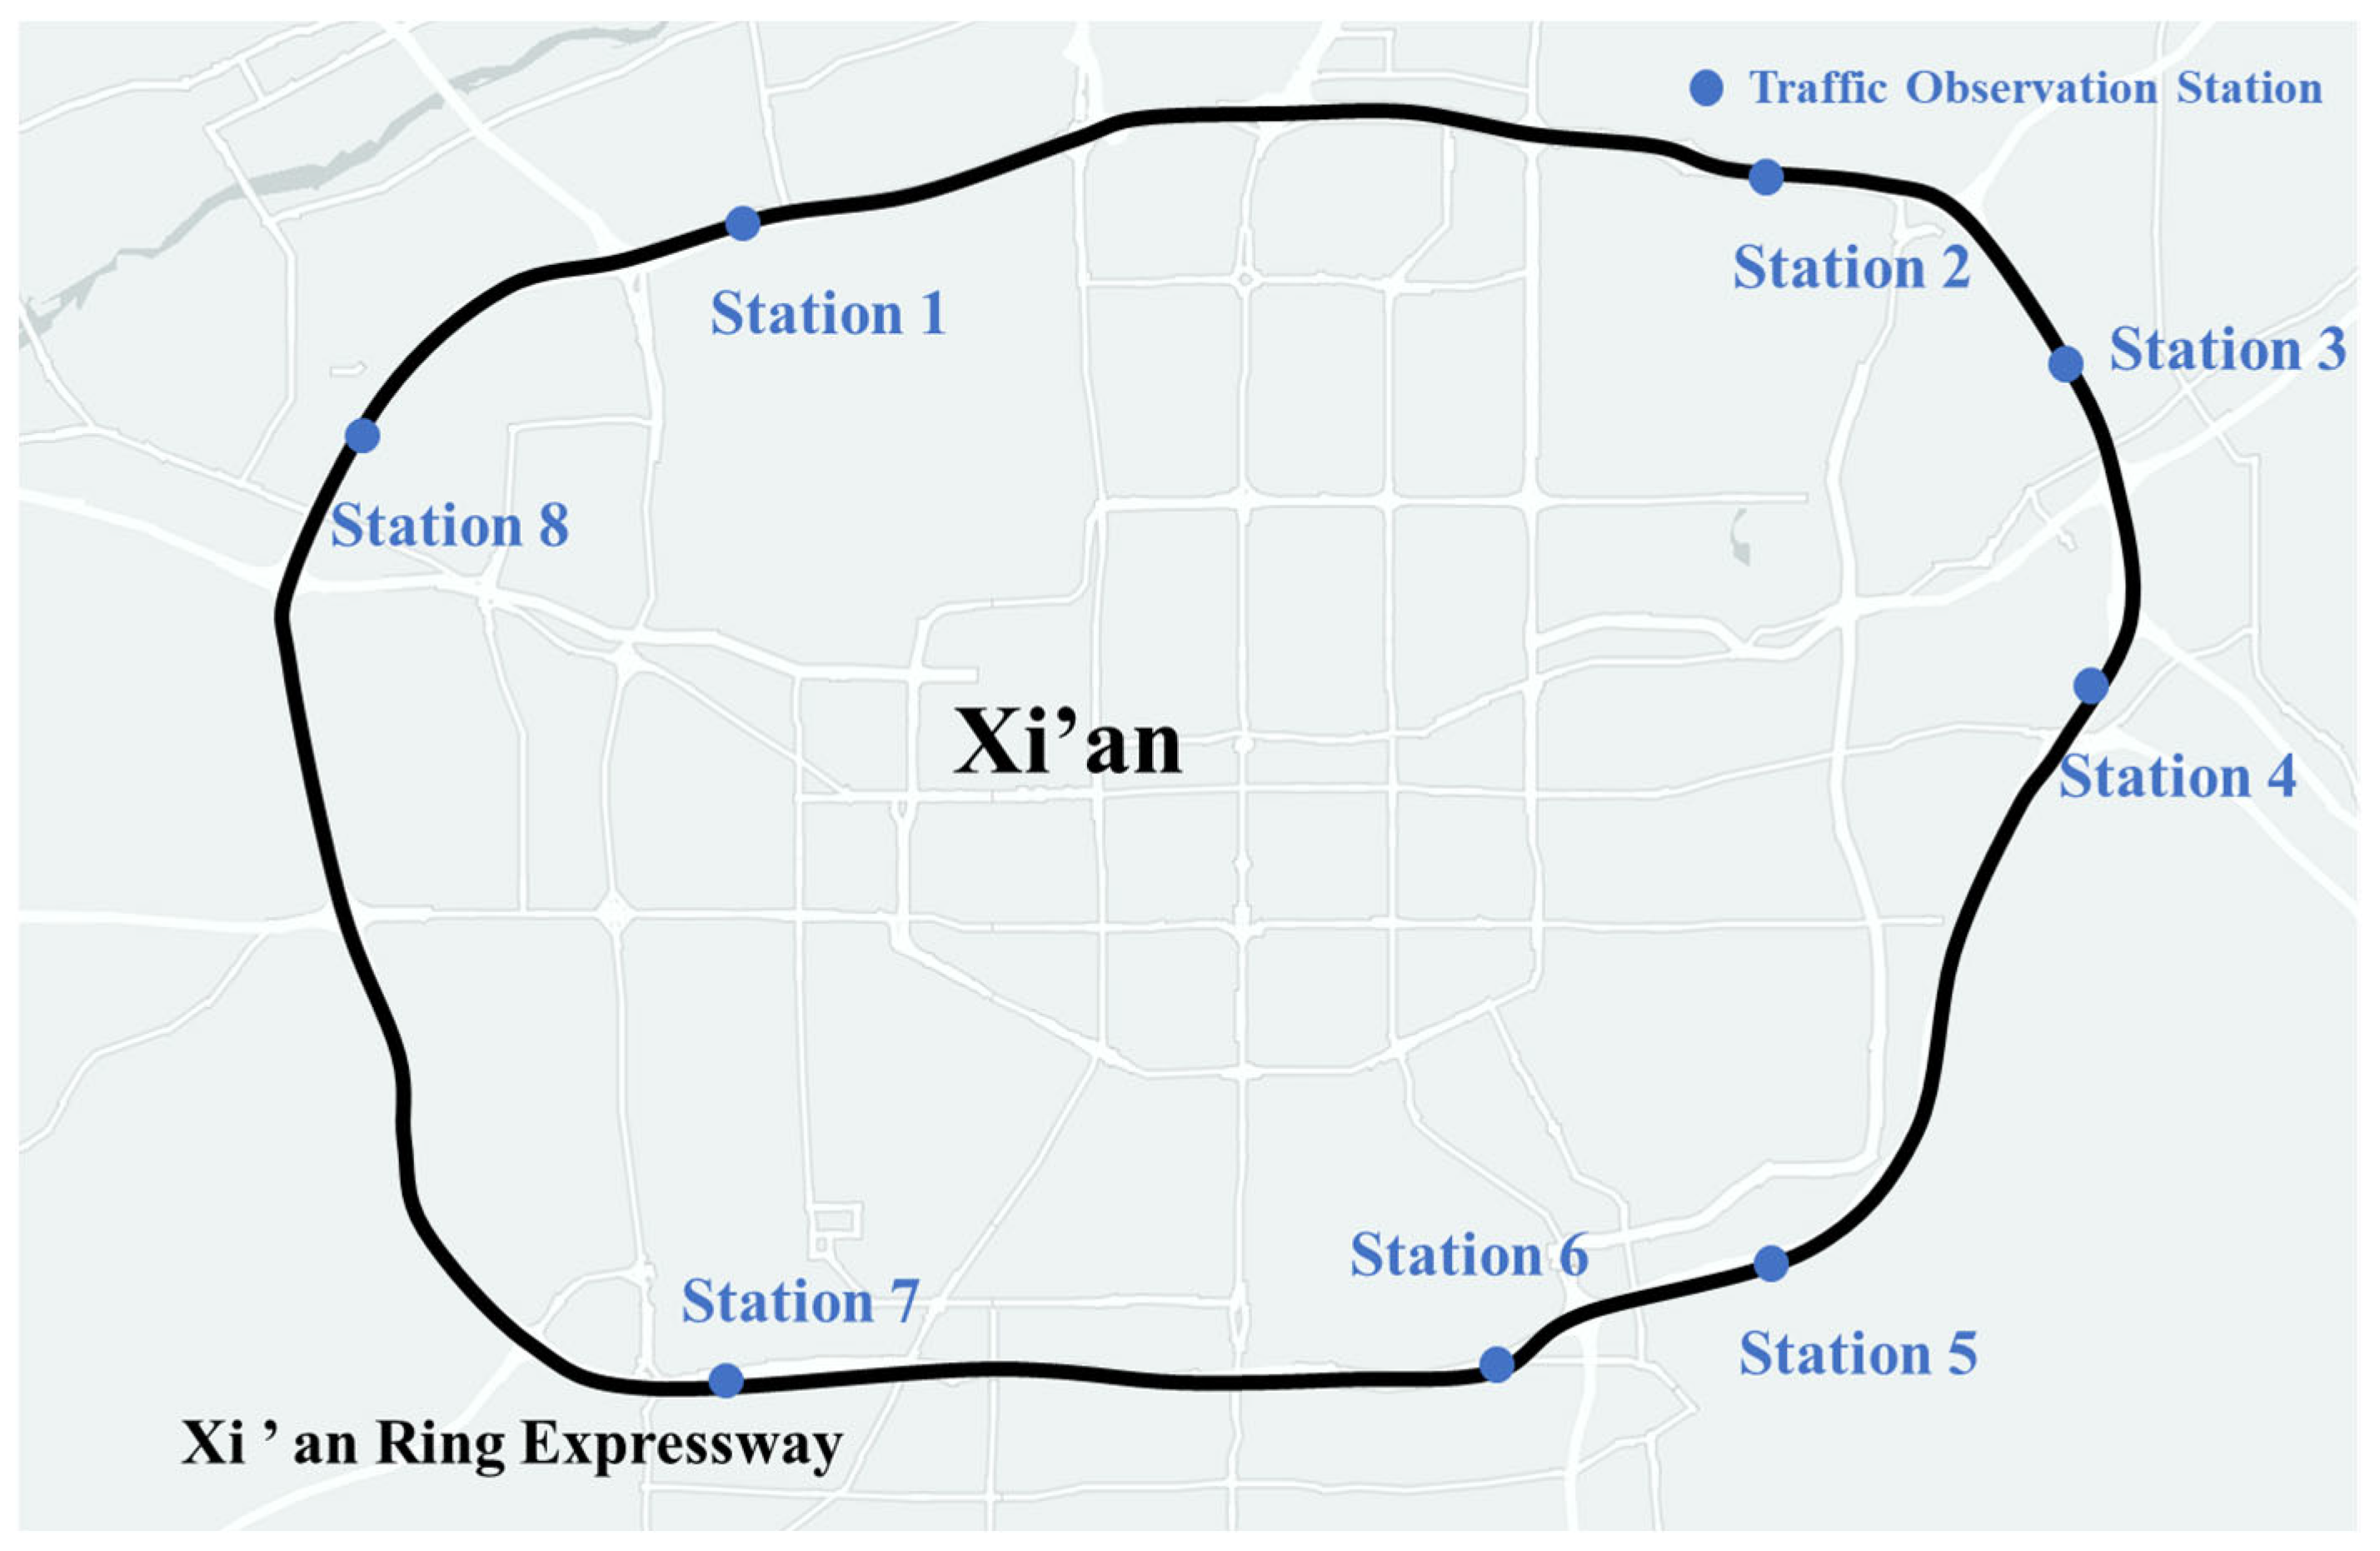
27]. On the basis of the above considerations, this paper selected traffic data for 3 years before the 2020 COVID-19 epidemic as the basis for analysis. Due to the notable lack of hourly traffic data at nine stations during the survey year, eight stations with relatively complete data and no missing data during holidays were selected to obtain 209,748 h of traffic data. The locations of the observation stations are shown in
Figure 1. The overall characteristics of the collected data are shown in
Table 1.
2.2. Data Preprocessing
Although integrity requirements were considered in data selection, a small amount of missing data remained during data collection. There are usually two approaches to missing data. One method without processing involves the direct use of collected traffic data as the total annual traffic, but this approach could lead to a lower than actual AADT value. The second method entails the interpolation of missing hourly traffic data. For example, the average traffic volume during the same hour of the previous and following weeks could be used as the traffic volume during the missing hour. Although the HV obtained via interpolation is not real survey data, due to the periodicity of traffic fluctuations, the interpolation and actual values slightly differ. The annual total traffic volume after interpolation could essentially represent the actual annual total traffic volume. Therefore, this paper adopts the second method to interpolate the missing data, as shown in Equation (1).
where
is the HV of the missing hour (the order of this hour in 8760 h of the year is
),
is the HV of the same hour in the previous week, and
is the HV of the same hour in the following week.
China uses unidirectional AADT to calculate DHV. The product of AADT and the di-rection inhomogeneity coefficient D was adopted as an estimate of unidirectional AADT. However, some scholars pointed out that the characteristics of the uneven direction of expressways would affect the accuracy of the analysis [
10,
11,
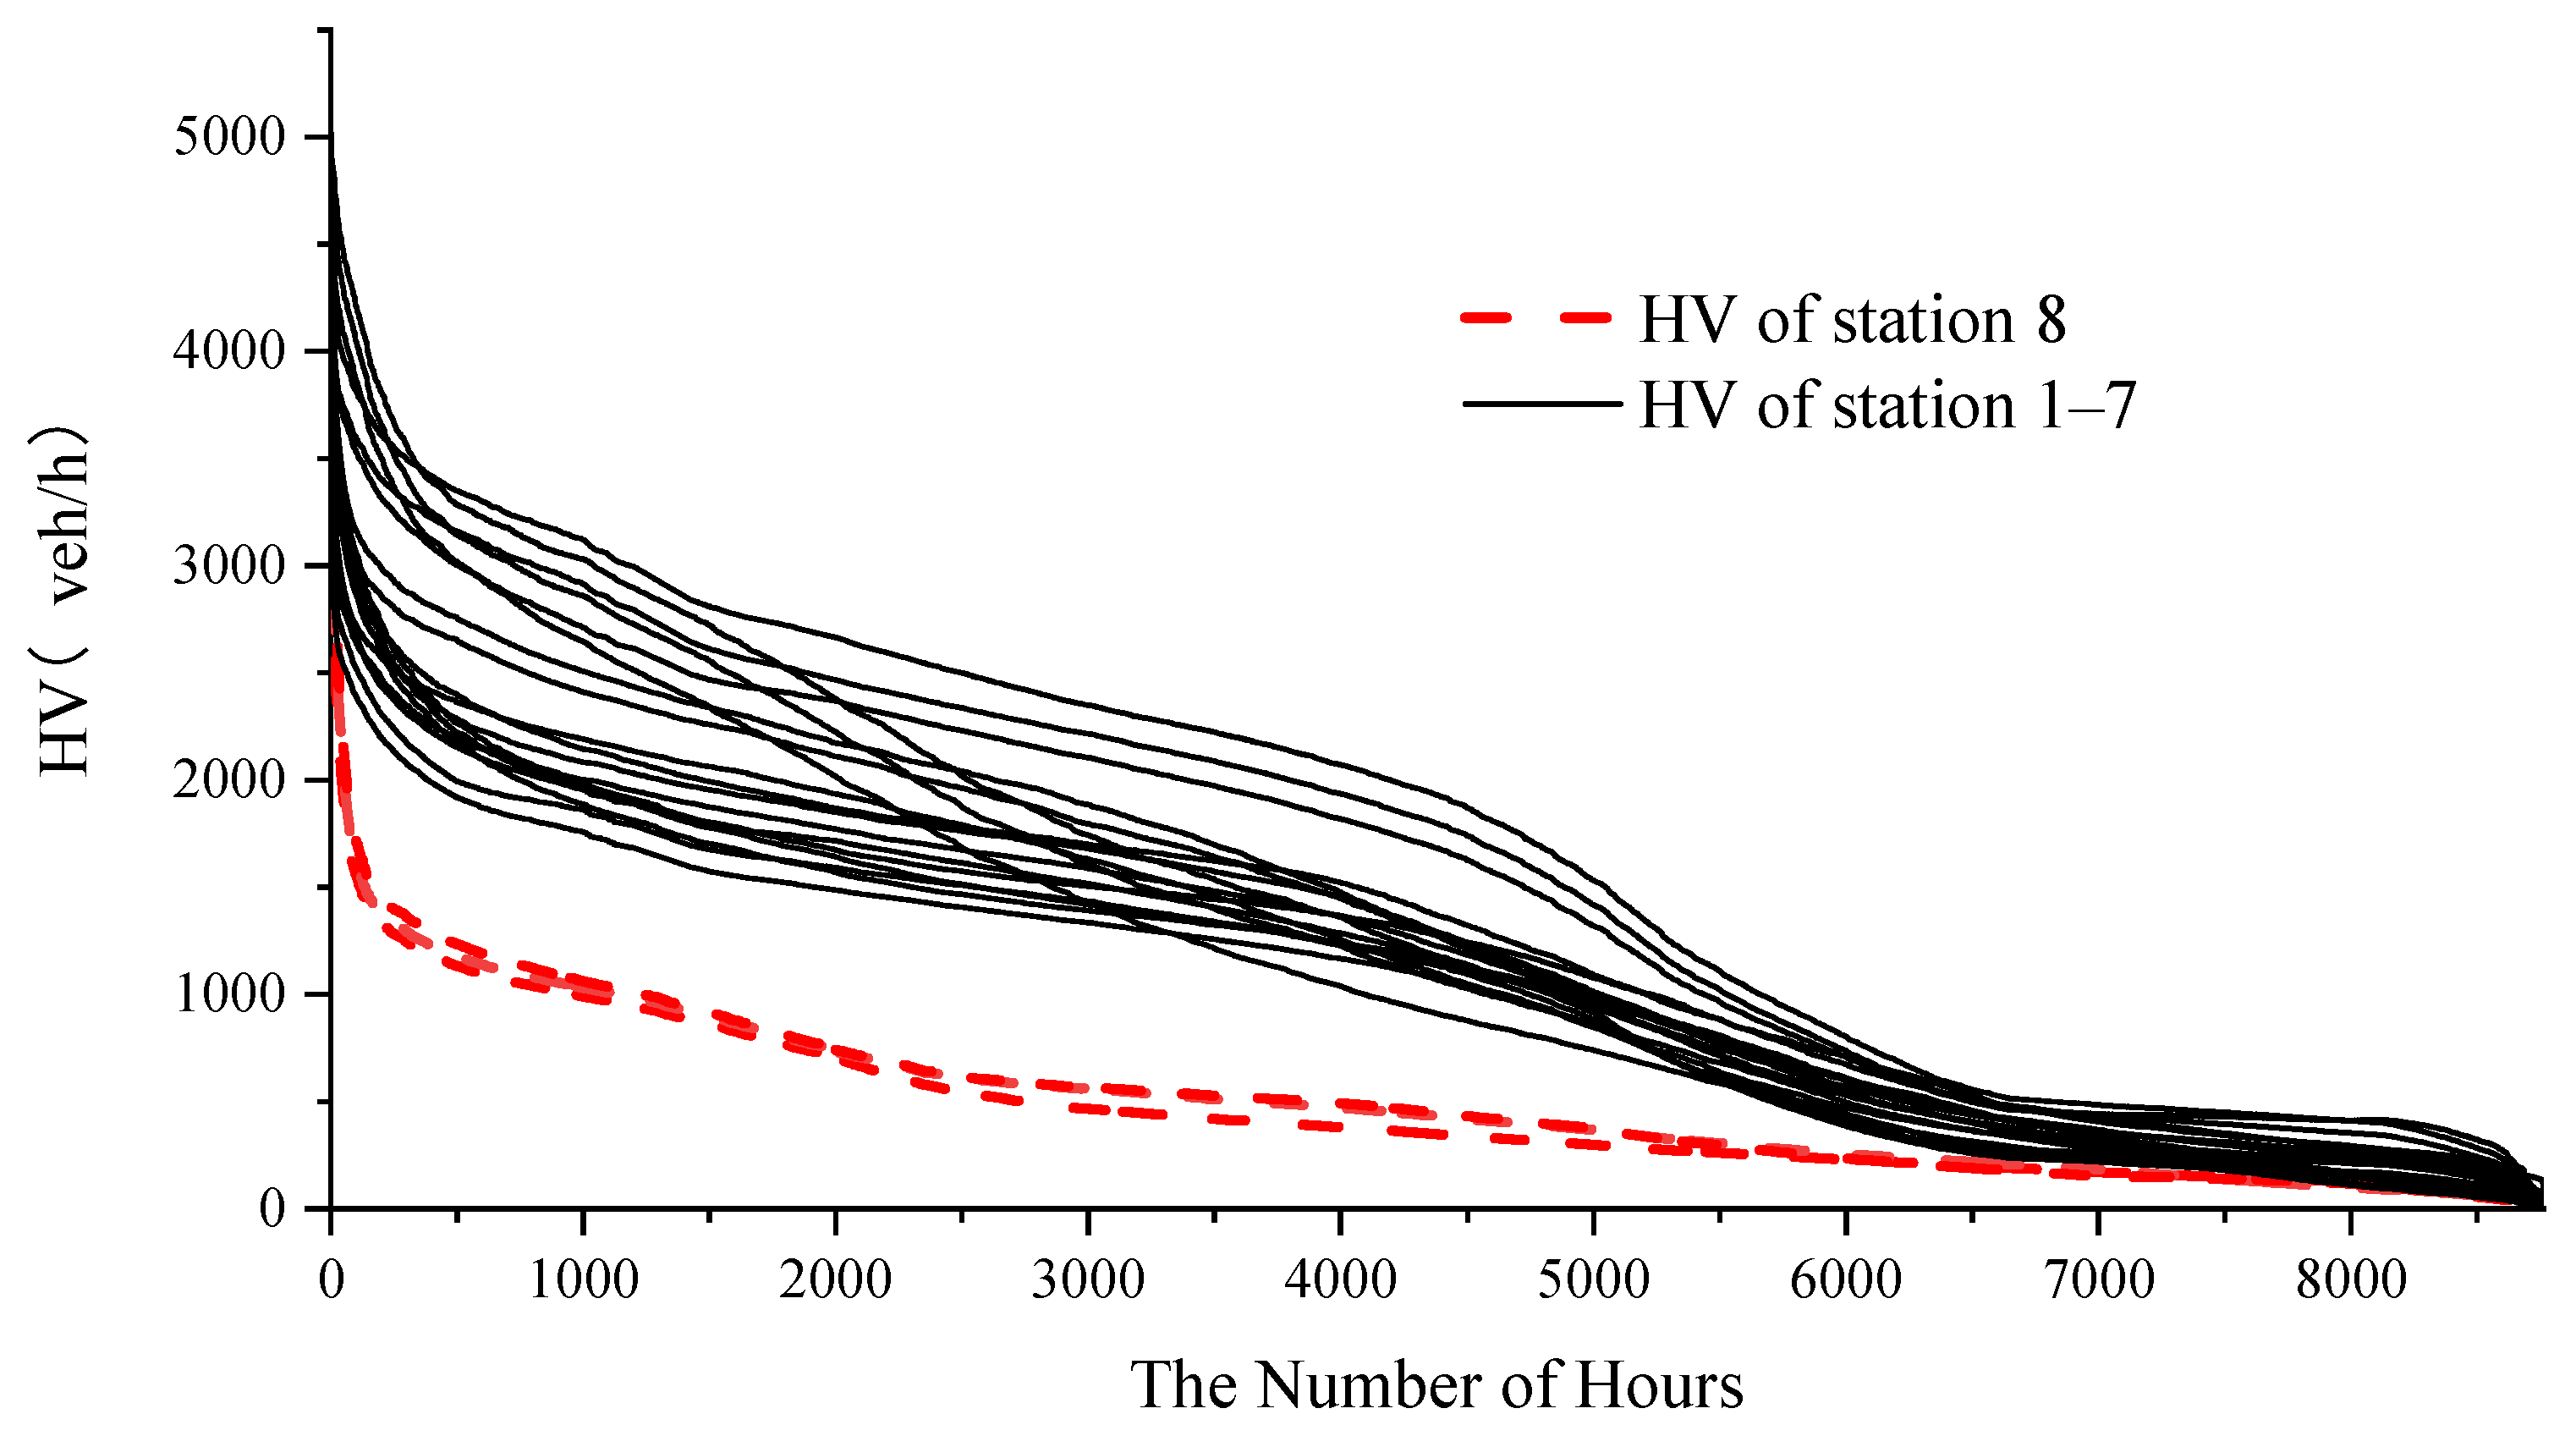
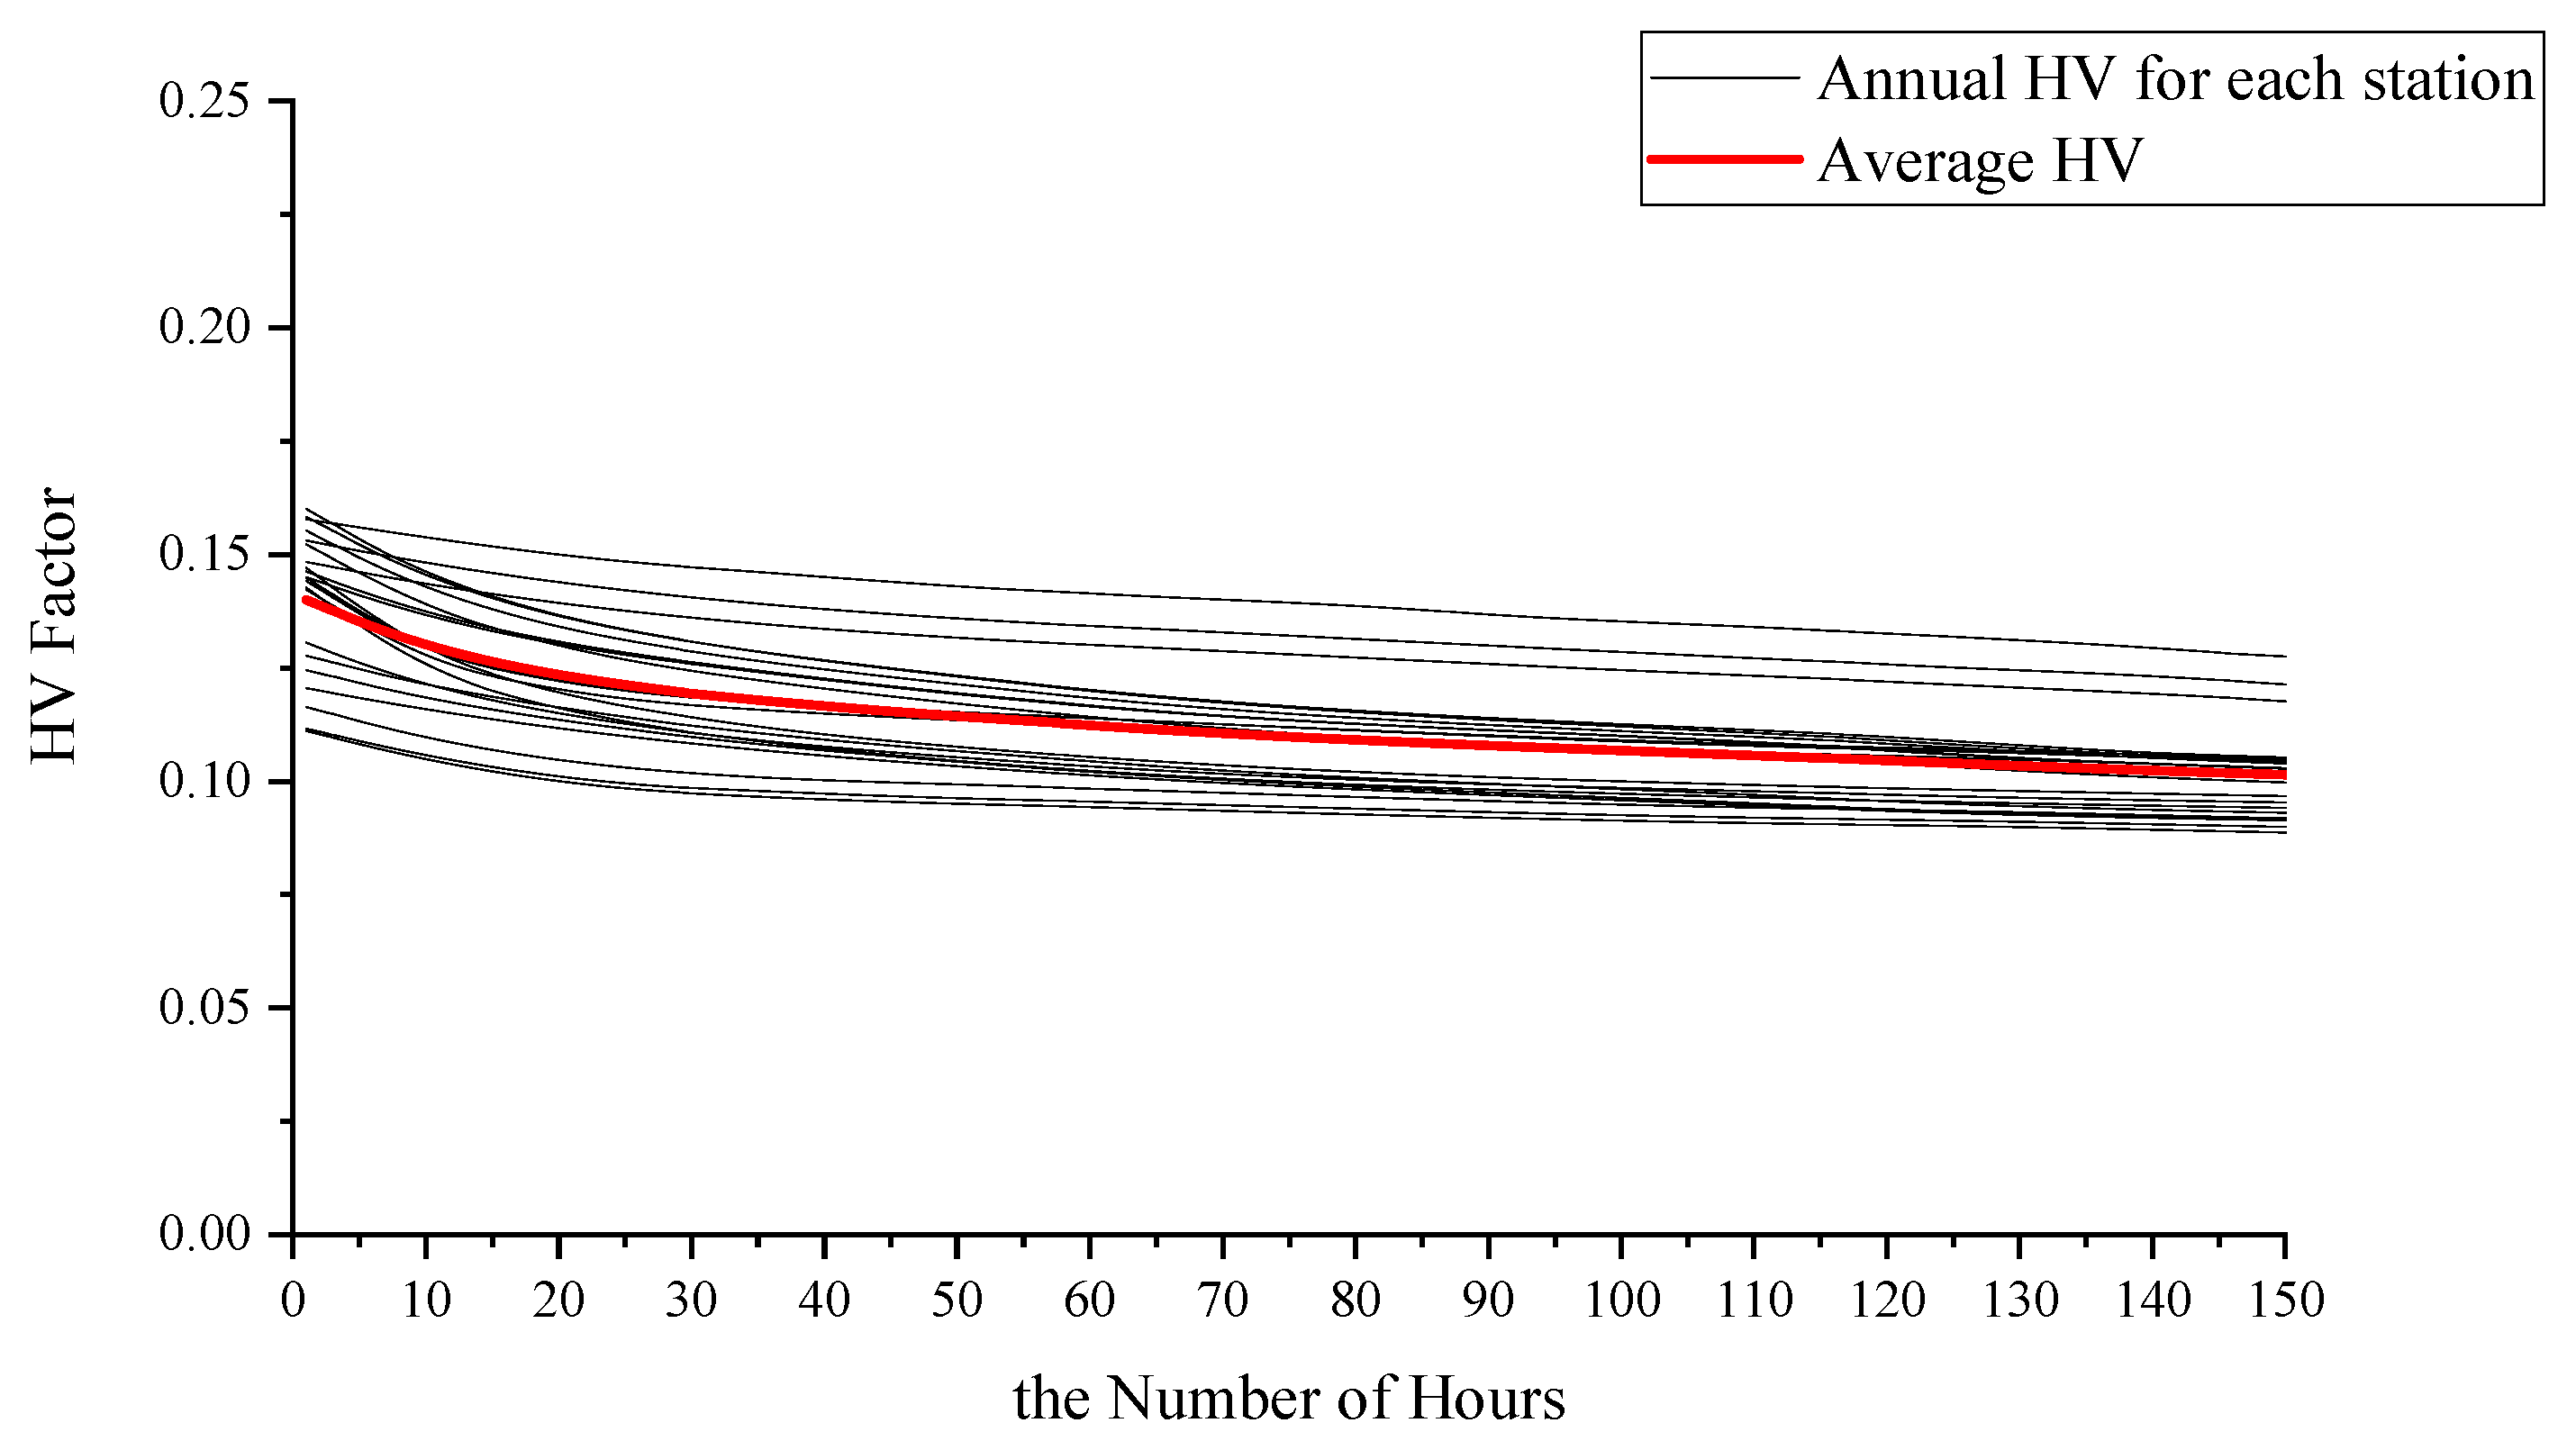
12]; hence, this paper directly used the actual unidirectional traffic data instead of the product of AADT and D to make the research more accurate. Then, the HV and AADT are considered unidirectional indicators in the sections below. After the above processing steps, 8760 h traffic data at eight stations over 3 years could be obtained. Single-year data were arranged in descending order, and the HV curve is shown in
Figure 2. The figure shows that the HV change characteristics of station 8 significantly differed from those of the other seven stations. To determine the causes of this phenomenon, we investigated the geographical location and service objective of this station. The survey revealed that the traffic through this station mostly encompassed transit traffic, residential traffic rarely occurred, and many alternative paths were available. Therefore, the traffic services of this station did not exhibit suburban traffic characteristics. Hence, the data for this station were excluded from the subsequent analysis.
3. Results
The distribution of the HV and HV factors constituted the basis of DHV determination. The HV factor is the ratio of the traffic volume during a given hour to the AADT. To analyze the distribution rule of the HV and HV factors, the annual HV value and HV factor at the seven stations were arranged in descending order and then averaged according to the hour. Thus, the distribution of the HV and the HV factor for the Xi’an suburban expressway could be obtained as the basis for analysis. The purpose was to evaluate whether the distribution characteristics of the HV and HV factors are consistent with the traditional distribution under the background of the tourism economy.
3.1. Analysis of the Annual Overall HV Distribution Characteristics
The traditional annual overall distribution characteristics of the HV indicated that the HV sharply declined during the first few hundred hours. As determined in the Peabody survey, the HV decreased by 58% over 280 h and by 90% over 350 h [
2]. In geometric design, if the first HV value is used as the DHV, this approach could lead to a sharp increase in the scale of road engineering, and the increase in service objects could be limited. If the average HV value is used as the DHV, this could lead to a reduction in the road service level and even long-term congestion.
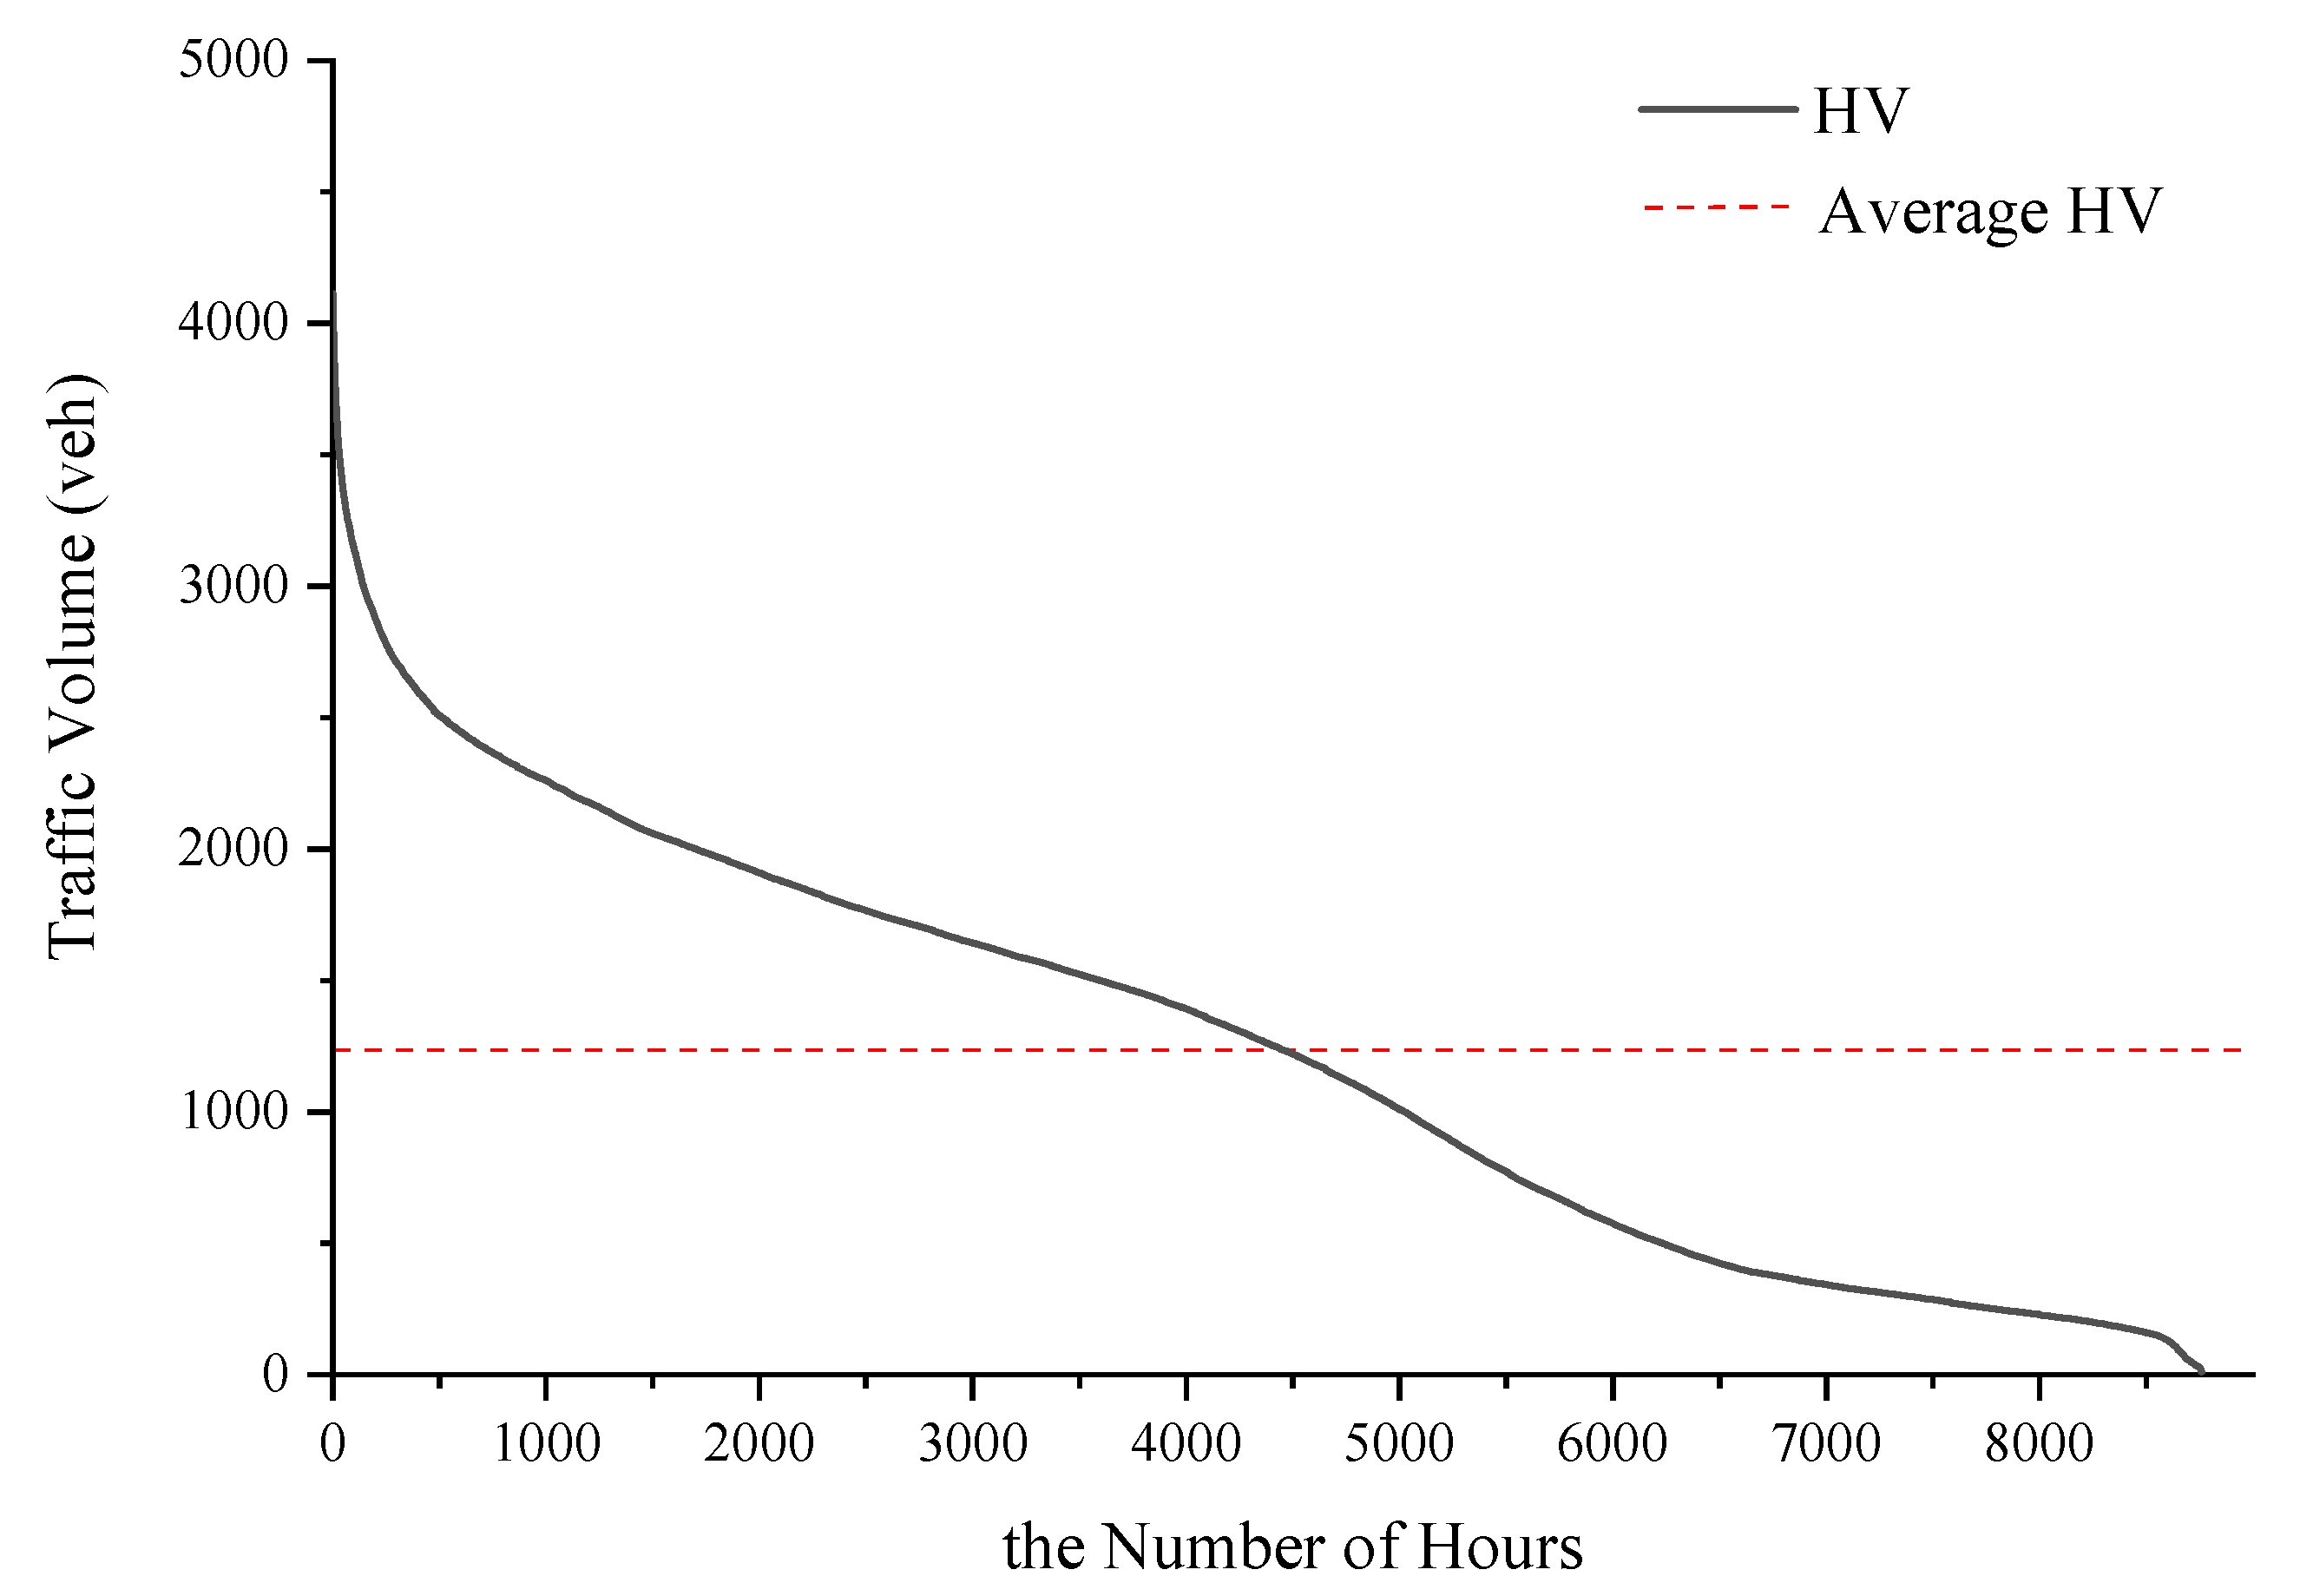
Data for the Xi’an Ring Expressway from 2017 to 2019 indicated that the average annual total traffic volume reached 107,222 veh, and the average annual daily traffic volume reached 29,376 veh. The HV during the first hour was 4112 veh.
Figure 3 shows the overall distribution curve of the annual HV of the Xi’an expressway. The reference line in the figure indicates the average HV value. The figure reveals that the annual overall trend in the rate of decline of HV was basically consistent with the traditional rule; the HV also rapidly declined during the first few hundred hours. However, compared to the traditional rule, the decline rate significantly decreased, 33% over 280 h and 36% over 350 h, accounting for only 57% and 40%, respectively, of Peabody’s results. This suggests that, under the background of the tourism economy, the high level of the traffic operation time was significantly higher than that according to the traditional rule, as shown in
Figure 4.
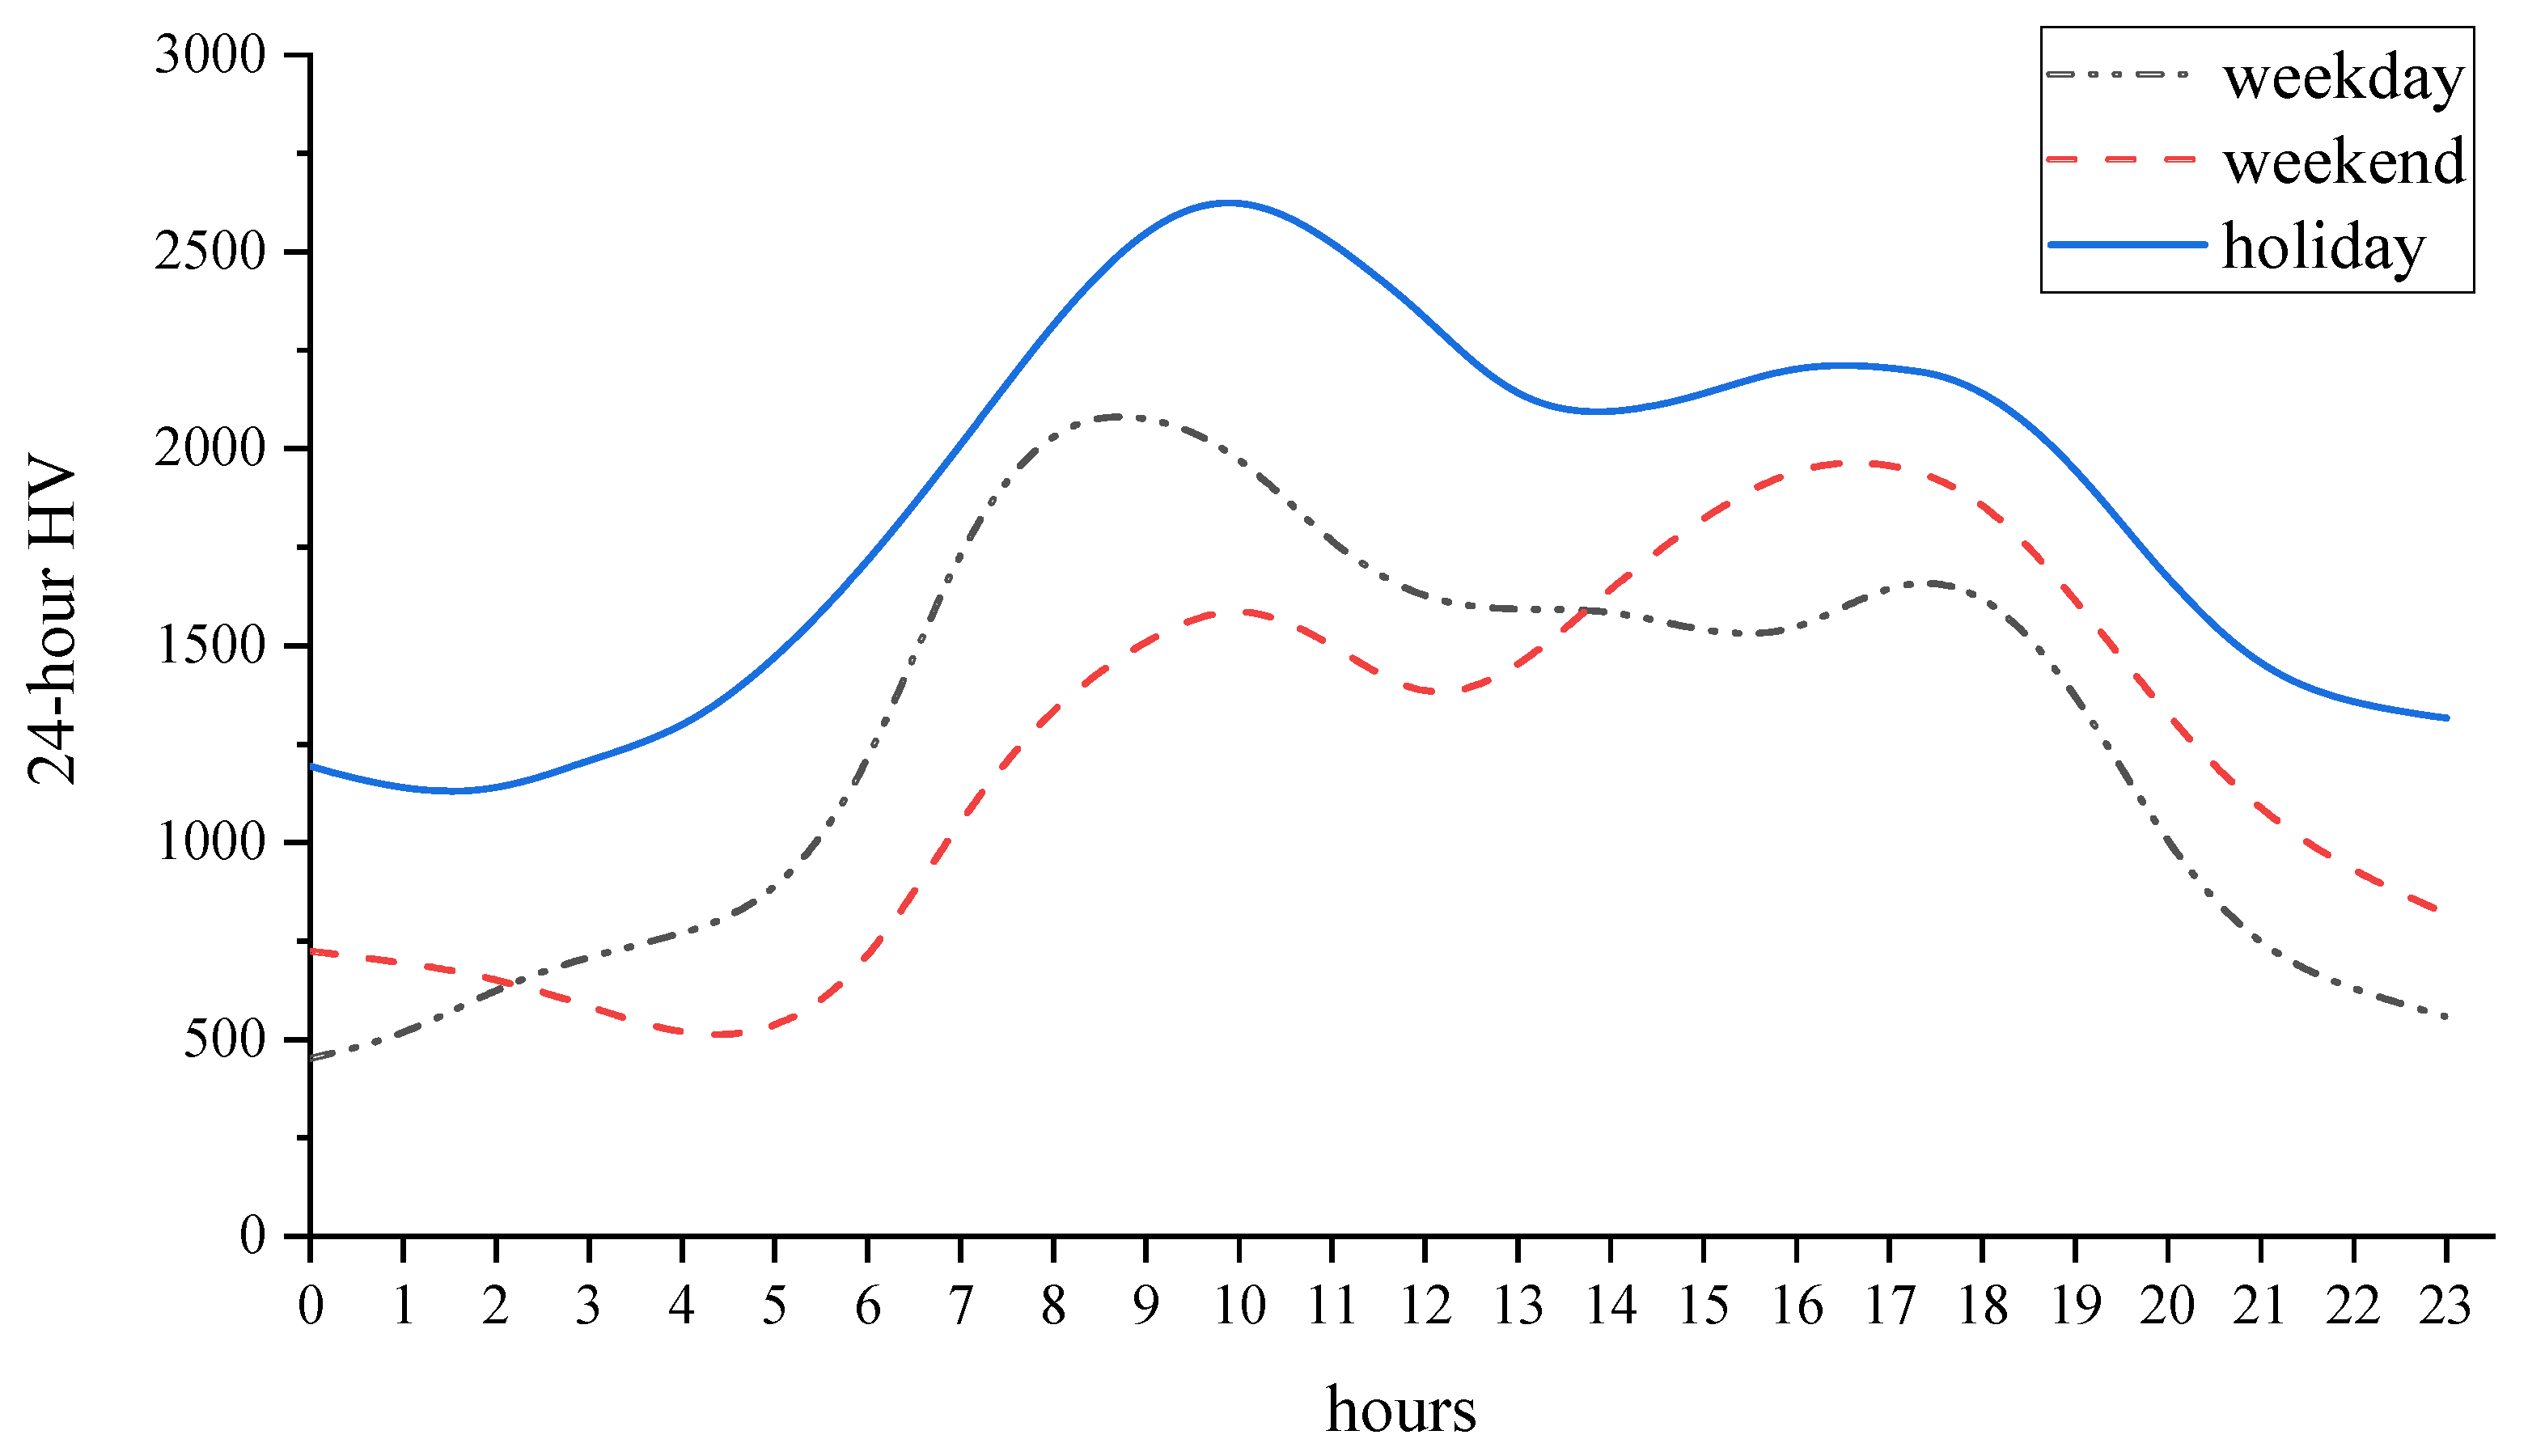
Figure 4 shows the 24 h traffic change curves for working days, weekends, and holidays. The characteristics of the morning and evening travel peaks were not obvious, and the peak duration significantly increased. For example, the period of a high traffic volume on working days continued from 7:00 a.m. to 7:00 p.m. Holidays also exhibited a similar pattern, but the traffic volume was higher. The travel characteristics of people significantly changed over the traditional rule.
In contrast, under the background of the tourism economy, the HV during the first hour reached 4112 veh, which is 316 veh more than the HV during the 10th hour, representing a decrease of 7%. It is uneconomic to directly use the first HV as the DHV. In addition, the average annual HV value reached 1236 veh, corresponding to 4356 h. If the average value was employed as the DHV, service requirements would not have been met during approximately half of the year.
In summary, the annual overall distribution trend of the HV within the context of the tourism economy was basically consistent with the traditional rule, but certain indicators changed significantly. As such, to determine the DHV, the HV factor during peak hours and the corresponding hours must be reconsidered.
3.2. Analysis of the Distribution Characteristics of the HV Factor during Peak Hours
In the traditional rule, the HV distribution characteristics of peak hours mainly showed that the HV around the 30th hour decreased from fast to slow. The fluctuation of the 30 HV factor was small and relatively stable. On the basis of the above two aspects, this paper analyzes the distribution characteristics of peak hour traffic volume under the background of tourism economy.
3.2.1. Stability Analysis of the HV Factor during Peak Hours
First, under the background of the tourism economy, we determined if the 30 HV factor still exhibits the characteristics of slight fluctuations.
Figure 5 shows a curve of the HV factor during peak hours and the average HV factor during peak hours at seven stations over 3 years. For convenience, this figure only shows the change trend of the traffic volume factor during the first 150 h. During the first 150 h, the HV factor did not fluctuate significantly. According to the American Association of State Highway and Transportation Officials (AASHTO), the fluctuation range of the first hourly traffic factor should remain within 14%, while the fluctuation range of the 30 HV factor should remain within only 7% [
28]. Within the context of the tourism economy, the fluctuation range of the first HV factor reached 4.7%, while the fluctuation range of the 30 HV factor reached 4.5%, and the fluctuation range did not significantly vary. This suggests that the fluctuation in the HV factor during peak hours, including the 30th hour, remained relatively consistent.
3.2.2. Analysis of the Decline Rate of the HV Peak Hours
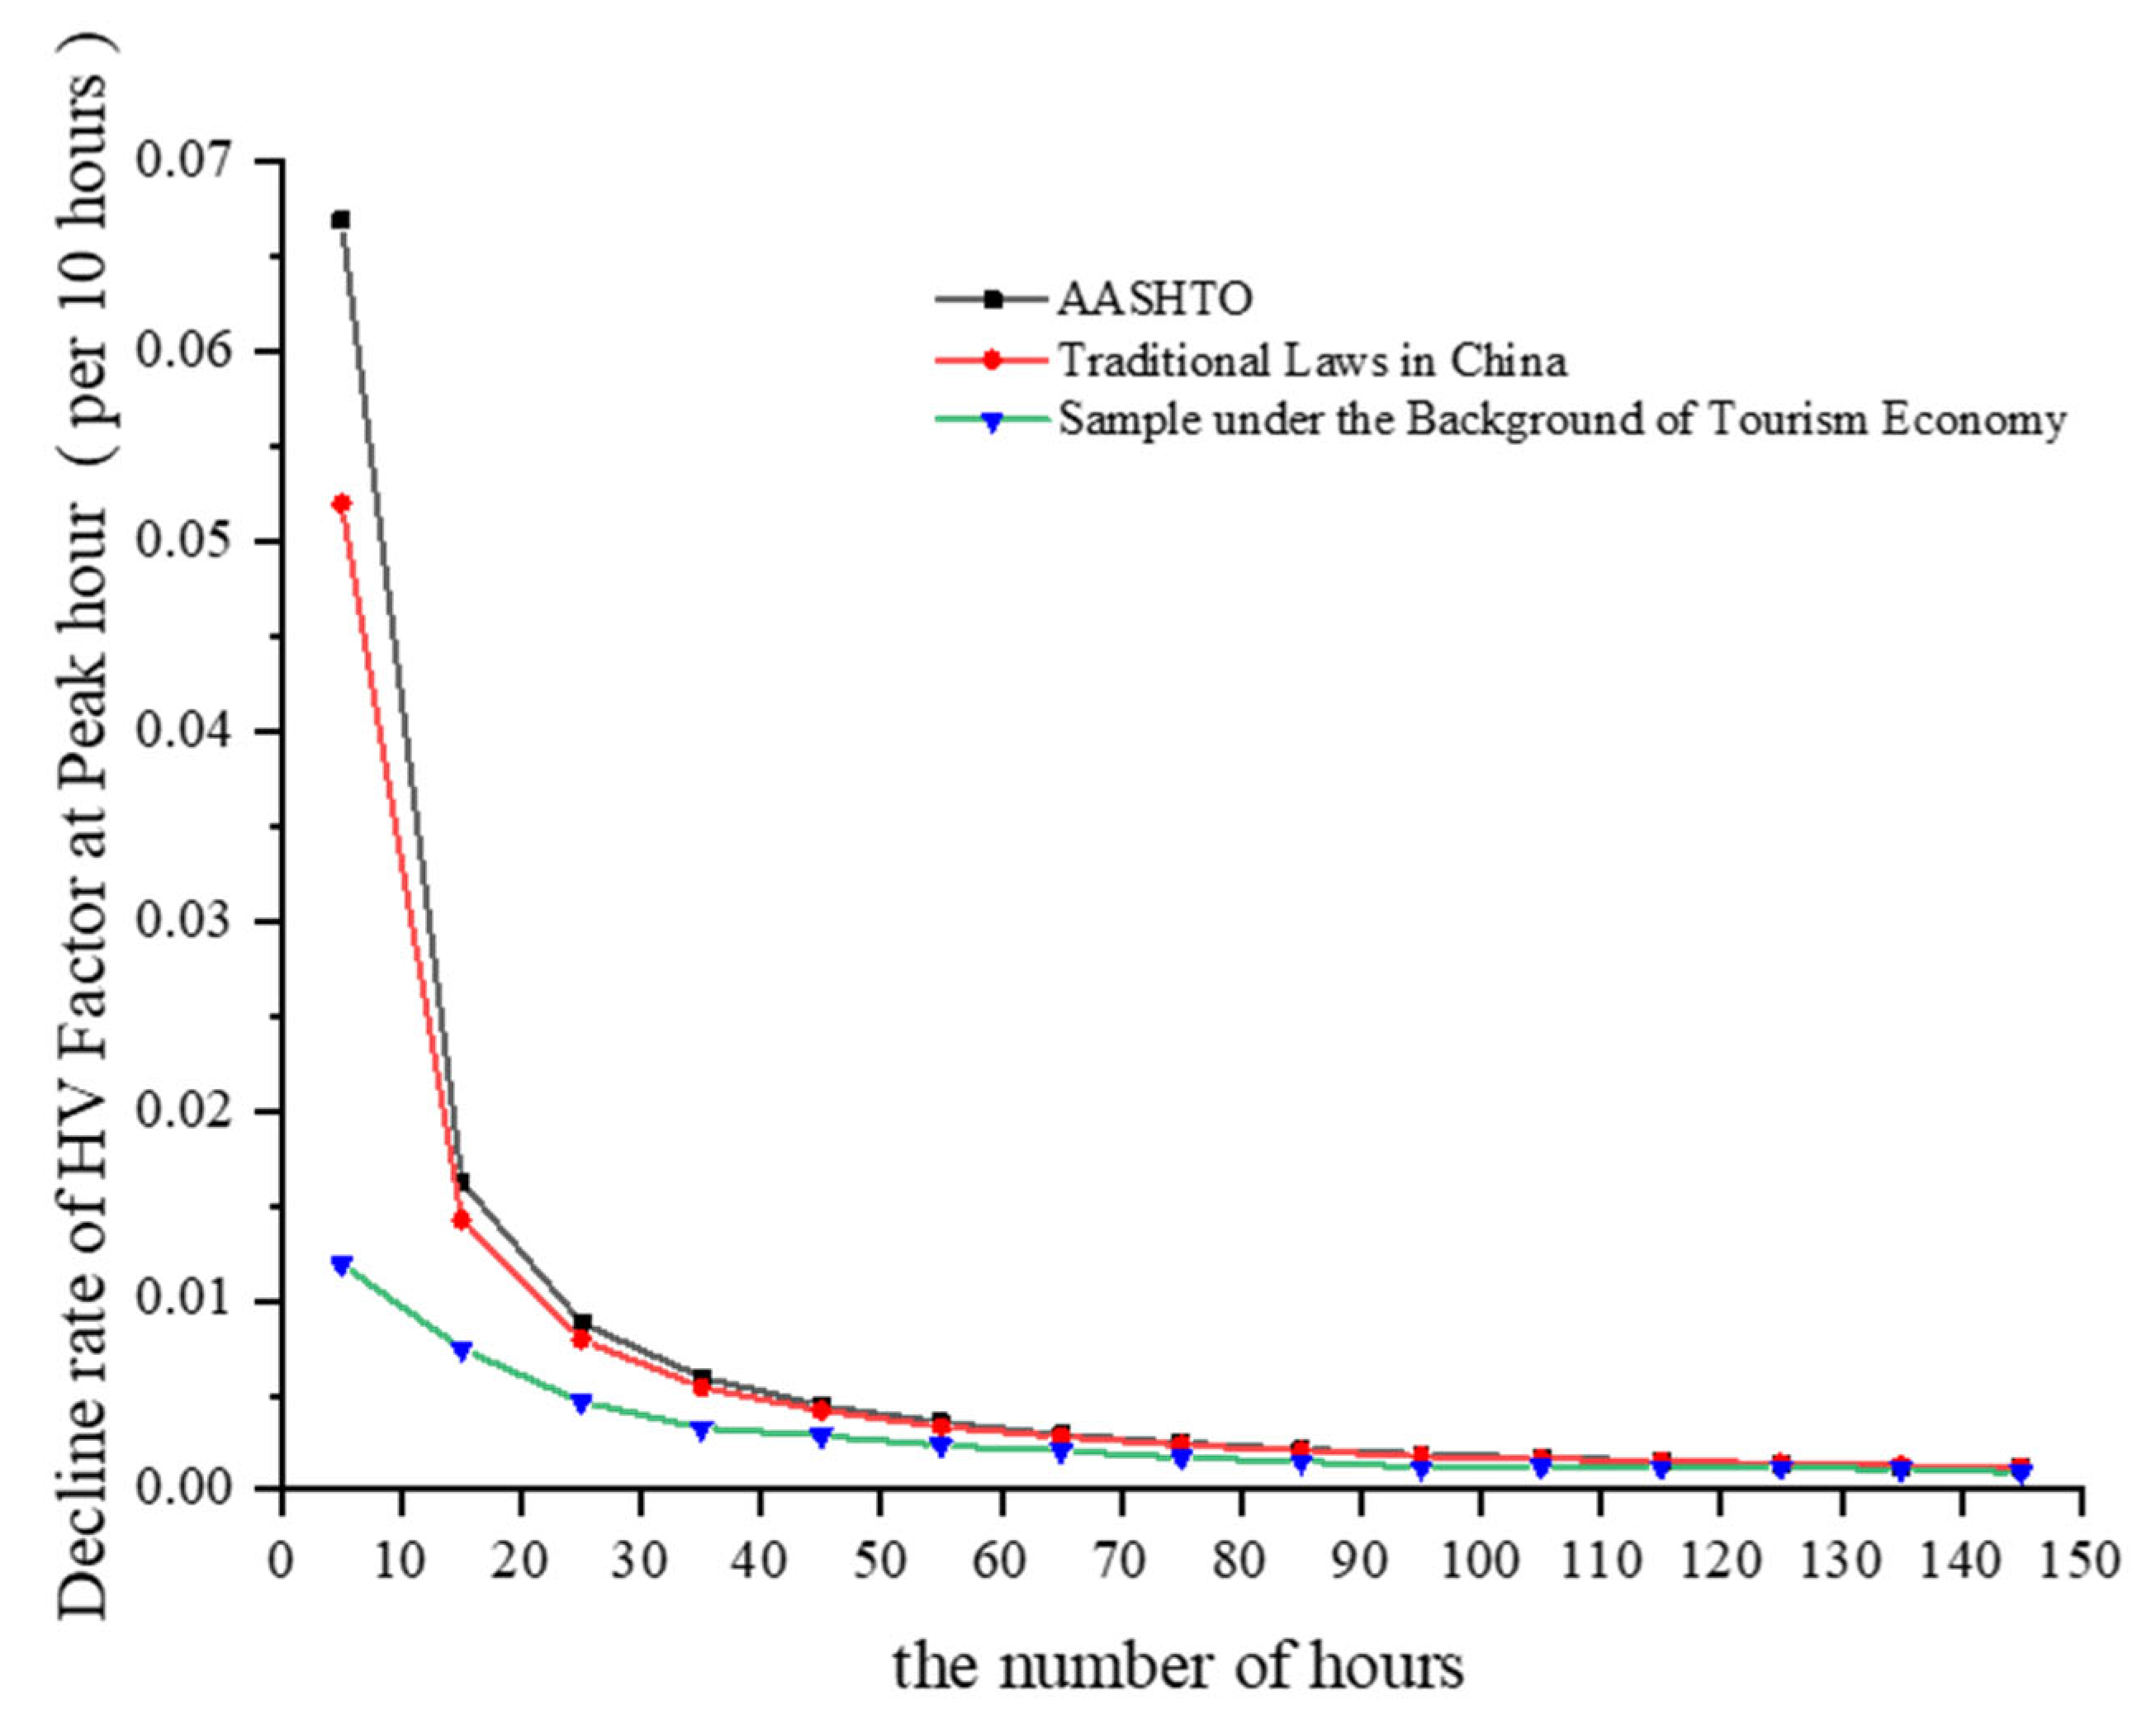
In addition, under the background of the tourism economy, did the decline rate of the HV factor near the 30th hour still follow the traditional trend? To answer this question, this paper compared the difference in the HV factor between successive 10 h intervals during the first 150 h, and comparison samples were derived from statistical results provided by AASHTO [
28] and data pertaining to the end of the last century in China [
22], as shown in
Figure 6.
Figure 6 clearly shows that the decline rate of the HV factor during the peak hours for suburban expressways in China was significantly lower than that of the traditional HV factor. Overall, the slope of the sample curve was lower within the top 150 h range, and the HV factor decreased by 4.4%, while the values for the United States and China were 12.2% and 10.3%, respectively, indicating significant differences. Second, in terms of the typicality of the 30 HV factor, in the empirical curves for the United States and China, the 30th hour represented the characteristic position of a sharp decrease in the HV factor; the HV factor decreased by 9.1% and 7.4%, respectively, during the first 30 h, while, from 30 to 60 h, the HV factor decreased by 1.4% and 1.3%, respectively. The difference between the two sides divided by the 30th hour reached 7.7% and 6.1%, respectively. However, the curve under the background of the tourism economy did not reveal this feature; the traffic volume factor during the first 30 h decreased by 2.4%, while the traffic volume factor from 30 to 60 h decreased by 0.8%. The difference between the two sides divided by the 30th hour reached only 1.5%. This revealed that the decline rate of the HV factor during peak hours for suburban expressways in China was low and slightly varied. Therefore, it could not be concluded that the HV factor during peak hours under the background of the tourism economy exhibited similar characteristics to those under the traditional rule.
In general, compared to the traditional distribution of the HV factor, the fluctuation in the peak HV factor of suburban expressways under the background of the tourism economy was limited. The decline rate significantly decreased. A sharp change in the decline rate of the HV factor during the 30th hour was no longer observed. This could indicate that the 30 HV no longer exhibited traditional typical characteristics.
3.3. Analysis of the Influence of the Change in the HV Factor during Peak Hours on the Design Parameters
Through the above analysis, we clarified the change characteristics of the HV factor distribution during peak hours under the background of the tourism economy. However, it remains necessary to further clarify the numerical change in the HV factor during peak hours to clearly answer the key question of whether the DHV factor is still applicable. The traffic volume factor from 20th to 40th hour is usually used as the DHV factor; hence, the next section only analyzes the change in the traffic volume factor from 20th to 40th hour under the background of the tourism economy.
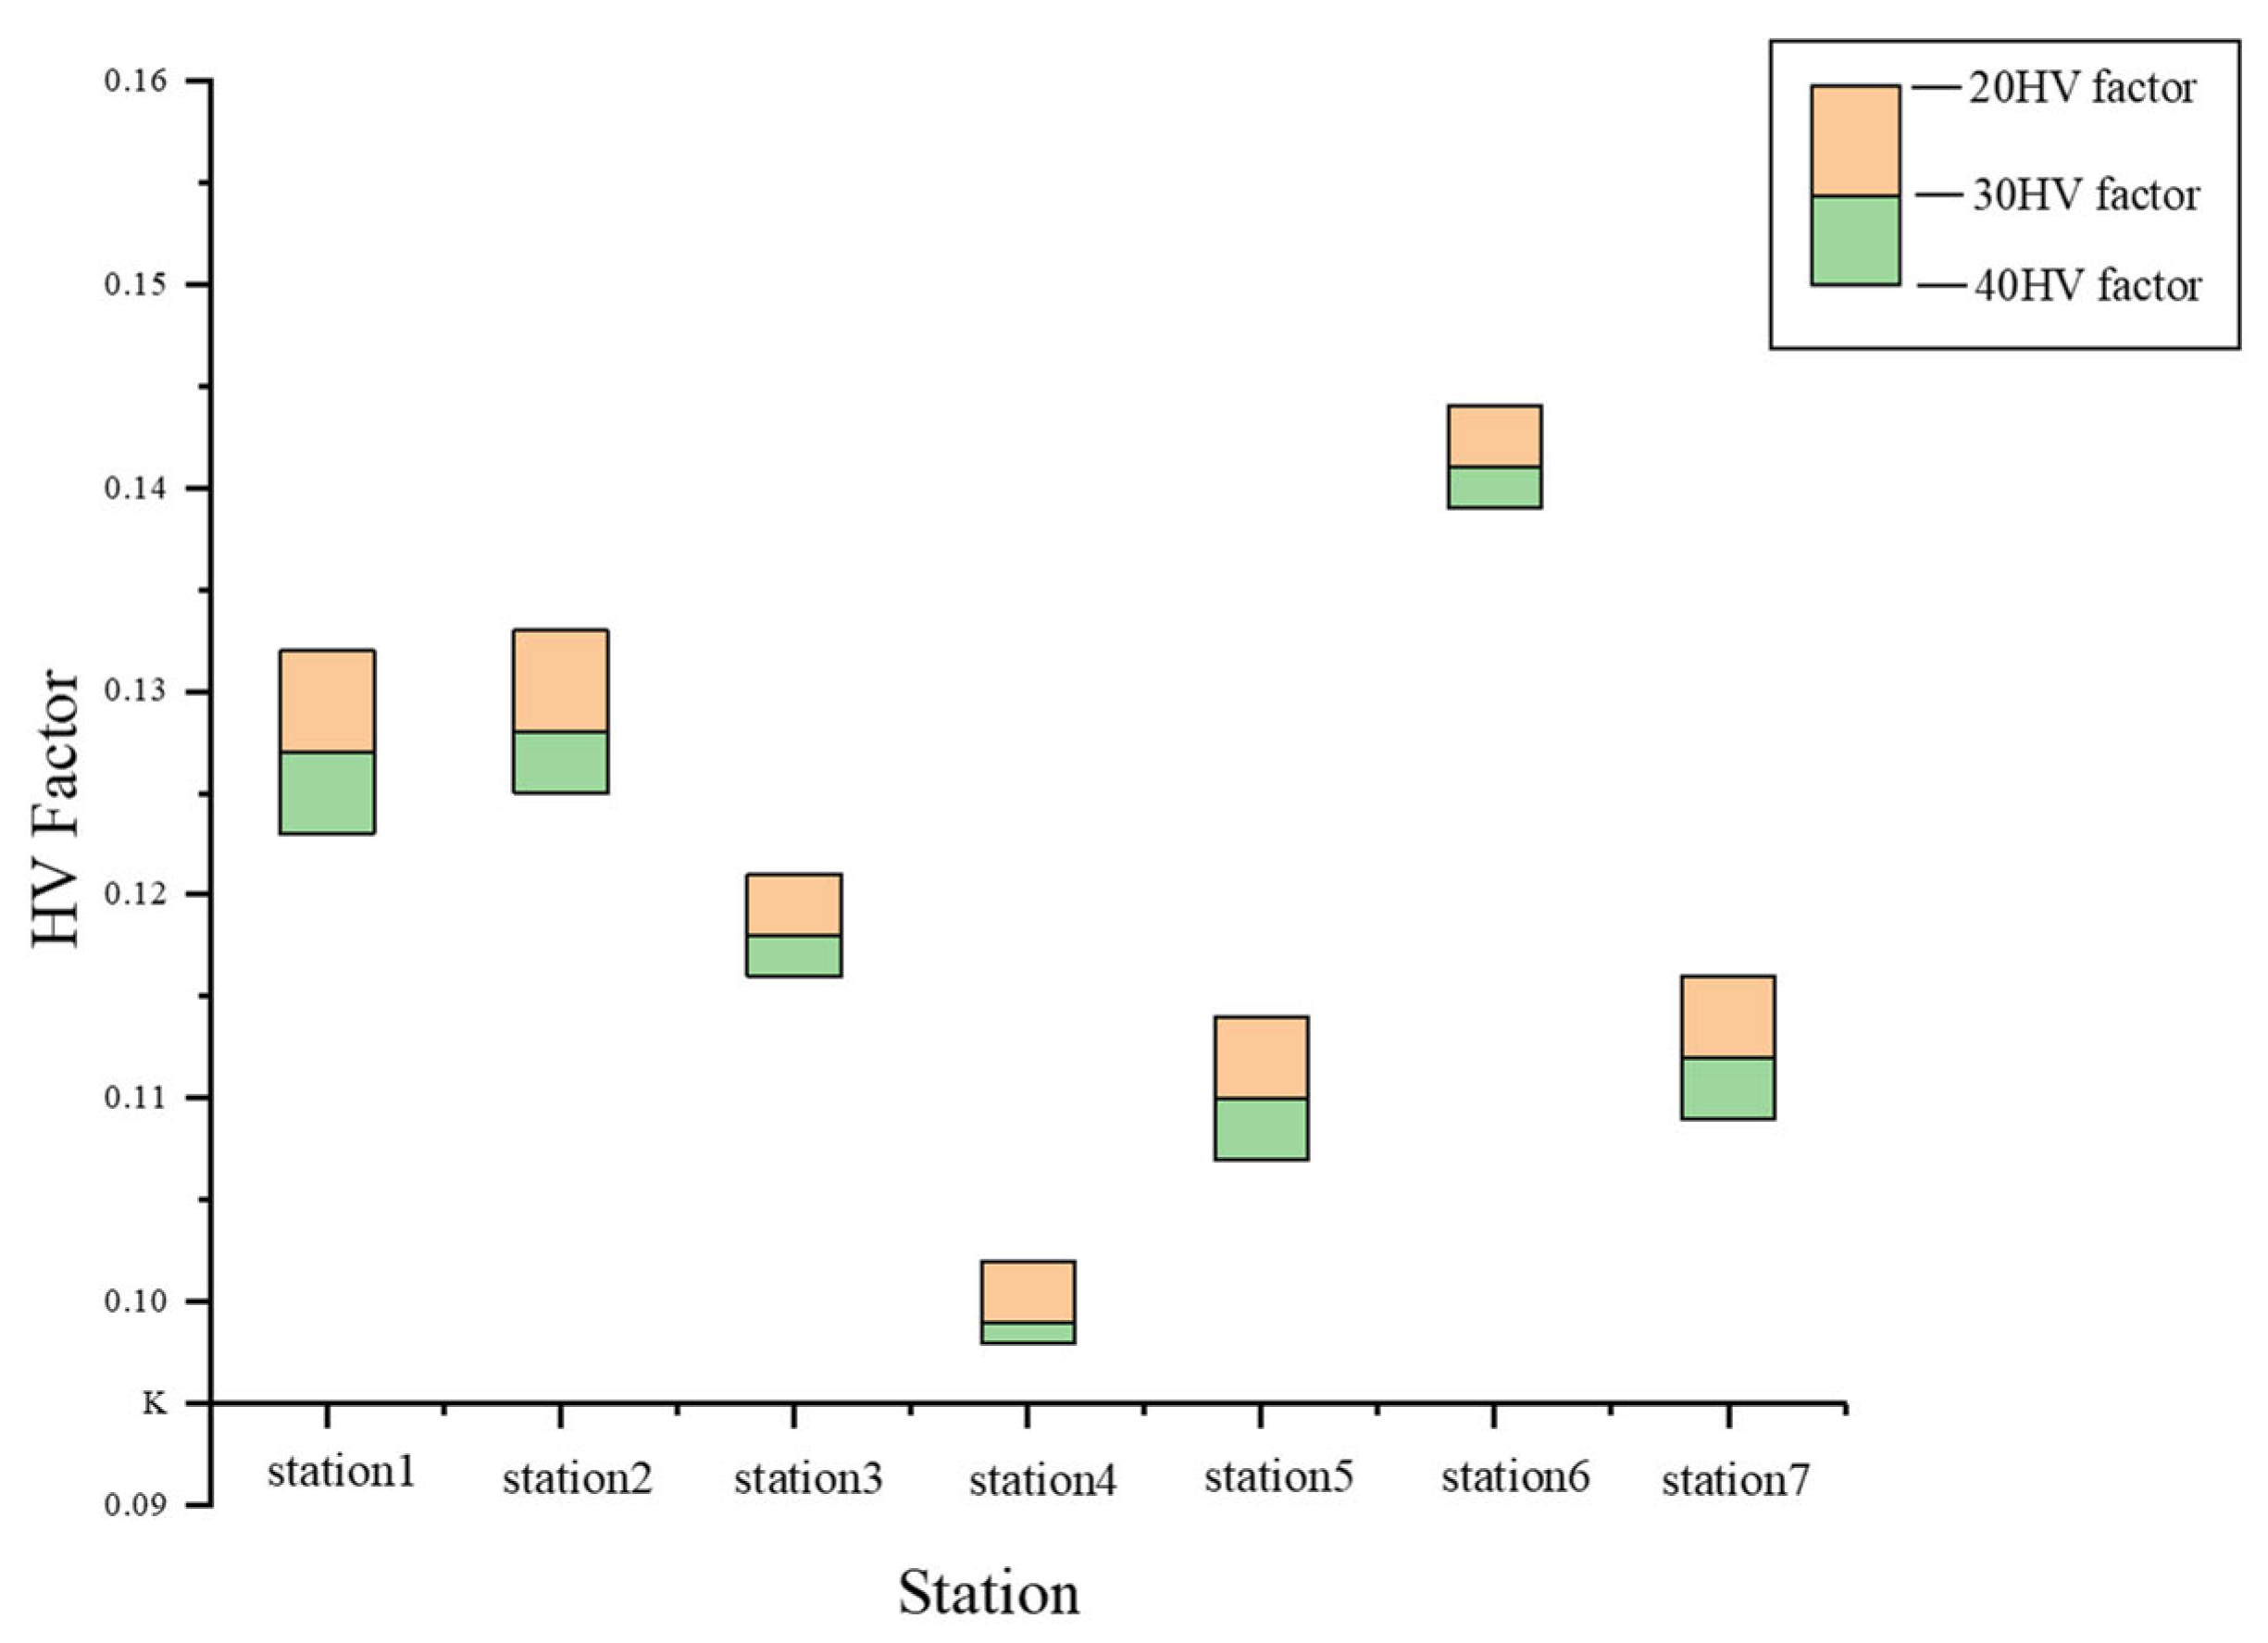
Figure 7 shows a histogram of the 20th, 30th, and 40th hourly traffic factors at each observation station along the Xi’an suburban expressway. The upper limit, middle line, and lower limit of each column correspond to the 20th, 30th, and 40th hourly traffic factors, respectively, of the section where each station is located. The recommended value of the DHV factor for suburban expressways in Northwest China is 0.095 [
23]. Even the 40 HV factor at each station exceeded the recommended value. In terms of specific stations, station 6 exhibited the largest difference from the recommended value. The traffic volume factors at station 6 during the 20th, 30th, and 40th hours were 0.144, 0.141, and 0.139, respectively. Even with the smallest difference at station 4, the 20th, 30th, and 40th hourly traffic factors reached 0.102, 0.099, and 0.098, respectively. Overall, the average values of the 20th, 30th, and 40 HV factors at all stations were 0.123, 0.119, and 0.116, respectively, which were 29%, 25%, and 22% higher, respectively, than the recommended values. This suggests that the difference between the actual and expected design values of the maximum traffic volume to satisfy the service level reached approximately 25%. The recommended value of the DHV factor is much lower than the actual traffic demand of suburban expressways under the background of the tourism economy.
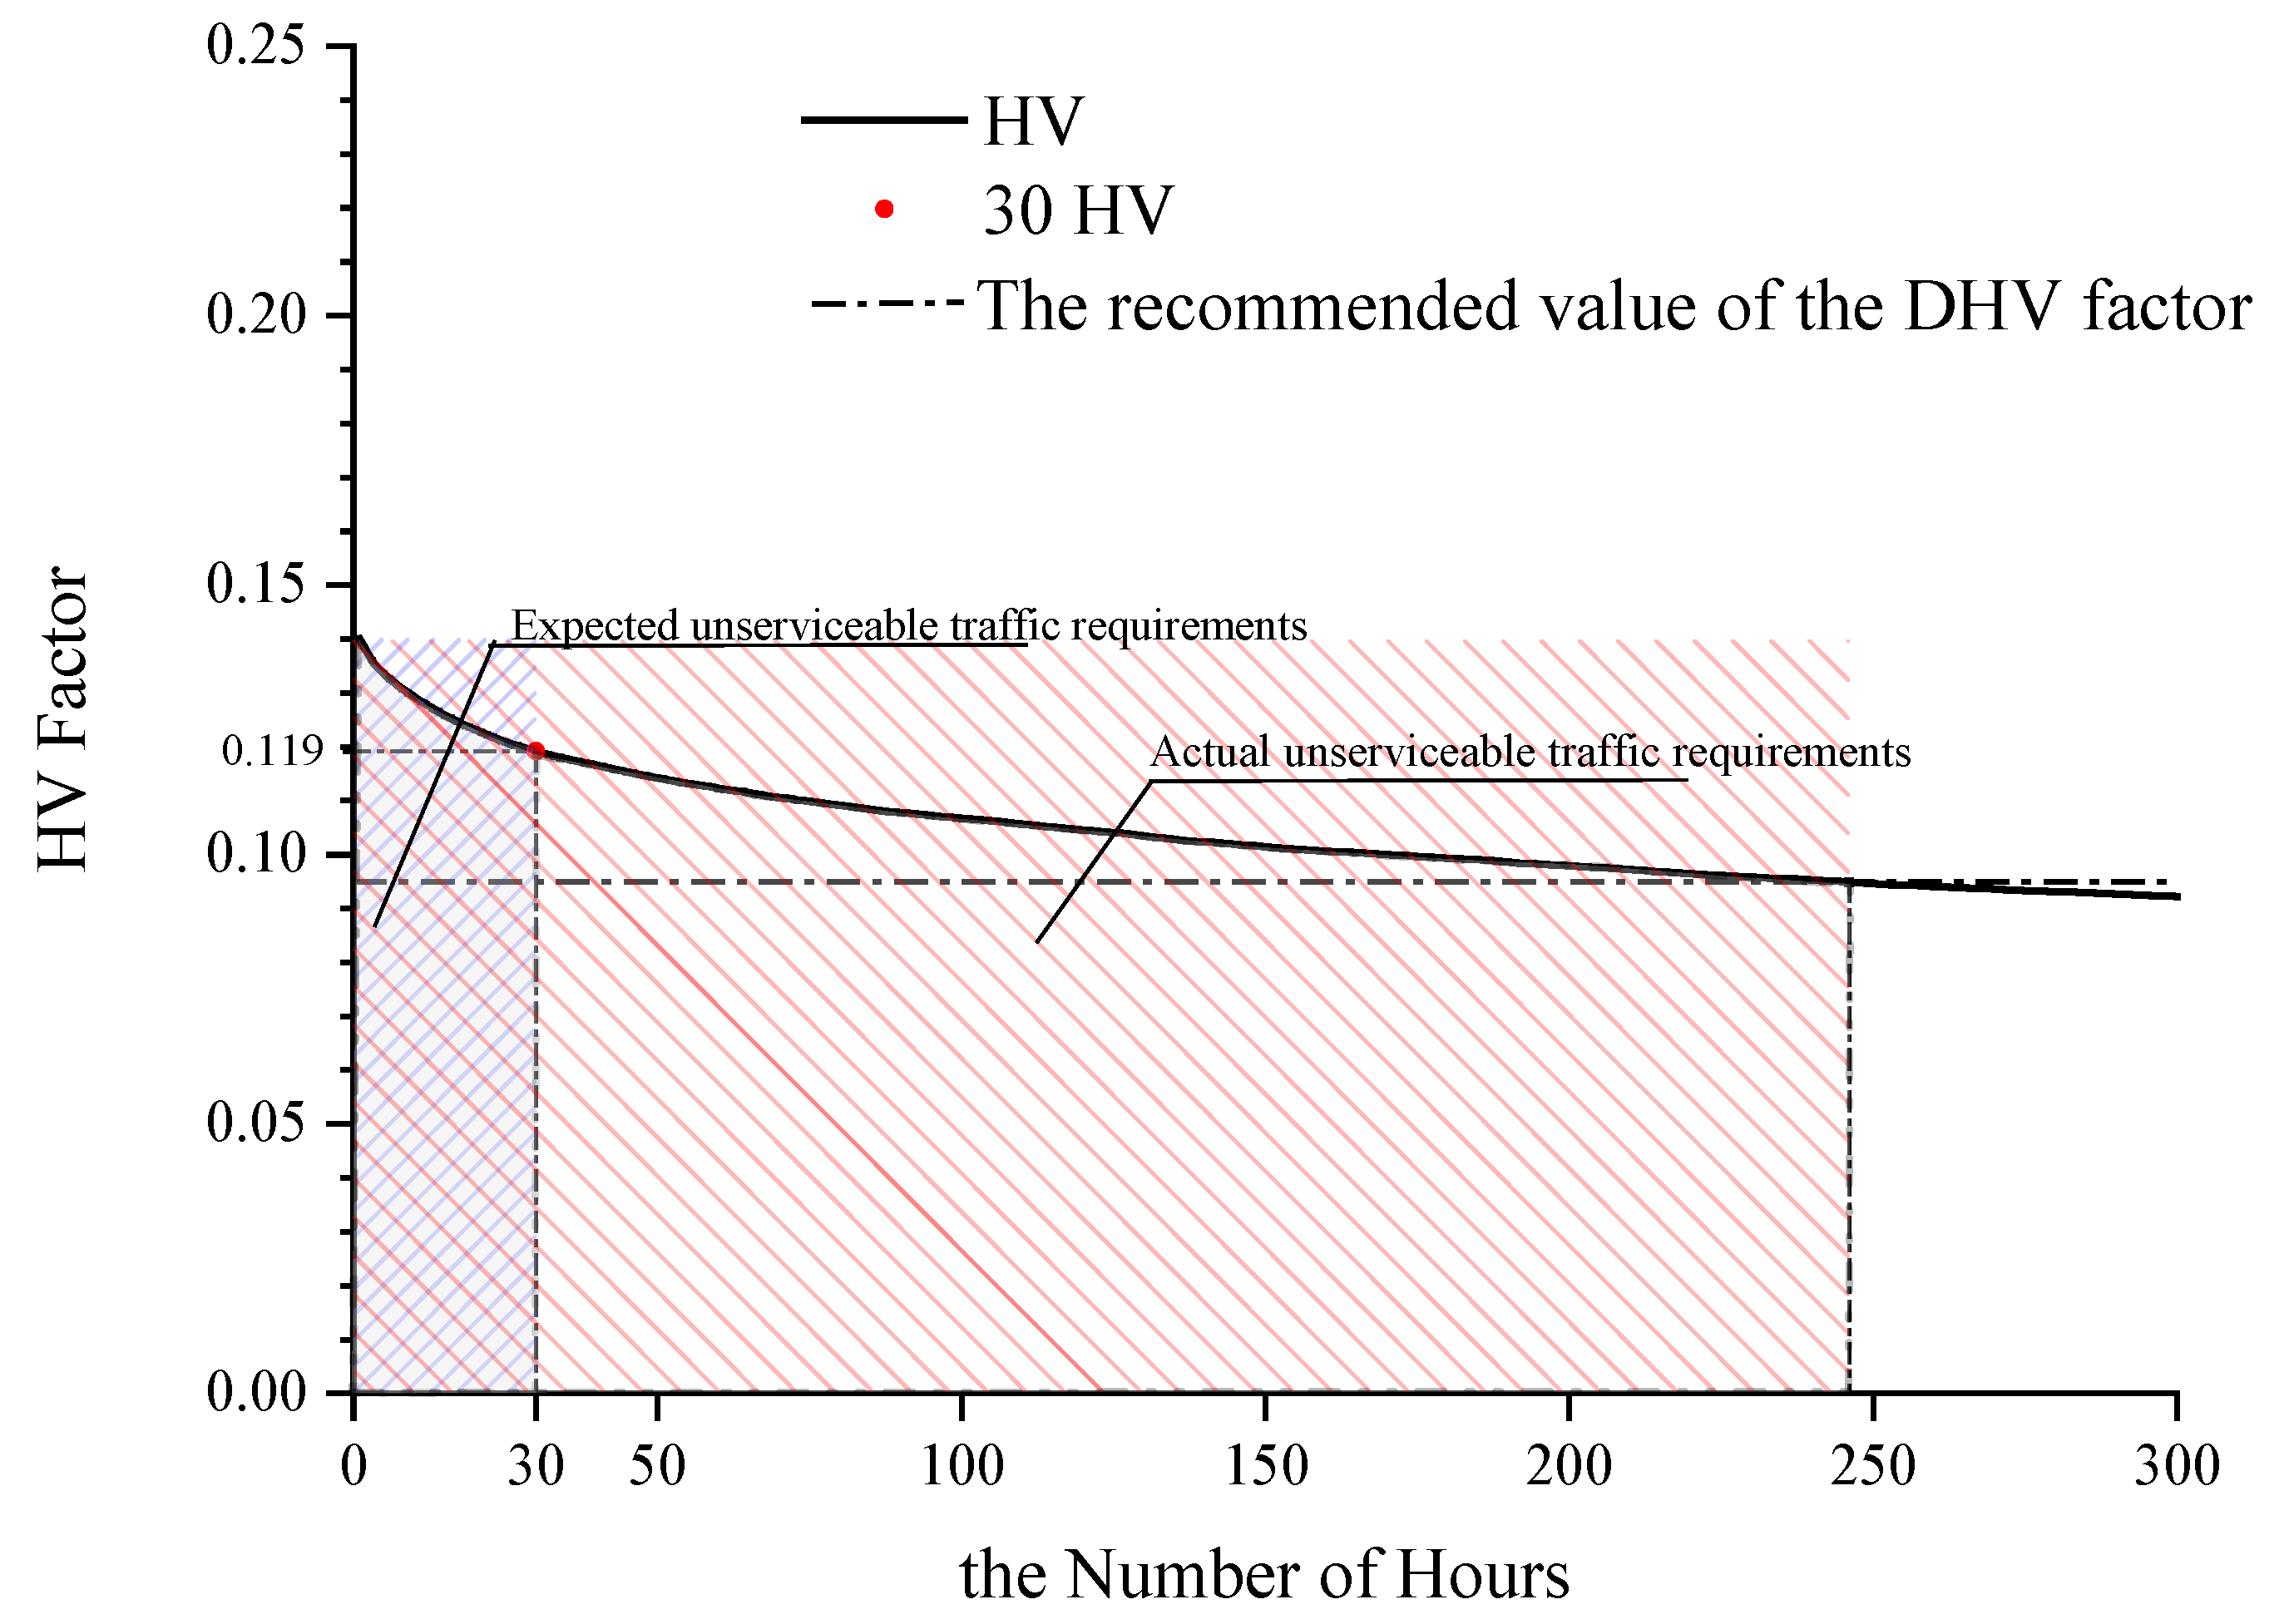
If the recommended value is used as the DHV factor, what is the actual corresponding hour? By comparing the HV factor during the first 300 h to the recommended value, we could intuitively analyze the numerical change in the HV factor. As shown in
Figure 8, the reference line indicates the recommended value of the DHV factor.
Figure 8 shows that the hour corresponding to the recommended value of the DHV factor under the background of the tourism economy was the 245th hour, far exceeding the 30th hour. The shaded area in the graph indicates the unsatisfiable traffic demand. If the recommended value of the DHV factor is employed, the actual unsatisfiable traffic demand could be 6.8 times higher than expected, indicating that expressway congestion could be greatly aggravated.
The above data demonstrate that, under the background of the tourism economy, the actual peak HV value and the HV factor greatly increased, and the ratio of the 20th–40th HV to the AADT, as represented by the recommended value, notably differed from the actual value. In summary, the peak hourly traffic is polarized, and the current recommended value of the DHV factor is too low.
4. Discussion
4.1. Accuracy of Data Interpolation
The integrity of the annual HV data greatly impacts the analysis results. If part of the hourly traffic is missing, the calculated annual total traffic and average daily traffic could be lower, resulting in a higher HV factor than the actual value. After 8760 ho of yearly data collection, due to hardware or software problems and uncontrollable factors, a small amount of missing data is inevitable. The processing steps of missing data generally include random value interpolation, mean or median interpolation, and platform interpolation. Compared to the method without interpolation, the methods of random value interpolation and mean or median interpolation could yield AADT values more closely reflecting the actual conditions to a certain extent, but the reliability is difficult to evaluate, and the error between the interpolation and true values exhibits randomness, which could affect HV distribution rule analysis. The platform interpolation method used in this paper is more suitable for HV research. The platform interpolation method uses similar values obtained from the complete data to replace missing values [
29], and the HV exhibits fluctuations with monthly, weekly, and daily cycles [
30]. Therefore, weekly HV data could be considered a complete dataset. With the use of the average traffic volume during the same hour of the previous and following weeks as the traffic volume during the missing hour, the interpolation accuracy could be improved. To verify this method, this paper randomly compared the difference between the traffic volume during a given hour and the average traffic volume during the same hour of the previous and following weeks, and a total of 50 groups were sampled. It was found that the error in this interpolation method remained within 9%, and the influence of every 100 interpolations on the AADT did not exceed 1‰.
4.2. Traffic Demand within the Context of the Tourism Economy
For a long time, most countries, including China, the United States, and Japan, chose the HV during the 30th hour as the DHV according to the HV change characteristics for 1 year. One of the reasons is that the main service object of expressways in suburban areas is commuter traffic on working days. Therefore, the annual average value of the maximum HV on working days is roughly equal to that during the 30th hour, and the 30th hour provides planning significance. However, according to the analysis results of this paper, the 30 HV has lost its planning significance.
To support this result, the annual average value of the maximum HV on working days, weekends, and holidays and the corresponding hours were determined. The annual average value of the maximum HV on working days, weekends, and holidays greatly deviated from the 30 HV, and the corresponding hours were the 478th, 485th, and 160th hours, respectively. There are three main reasons for this phenomenon. First, HV during holidays always occurs at a high level. Data indicate that 72% of the first 30 h occur during holidays. Especially at stations 1 and 3, all of the first 30 h of traffic occurred during holidays, and a large number of holiday hours were observed at the peak position. Second, suburban highways no longer serve only weekday commuter traffic. The average annual maximum value during weekends differs by only 34 veh from that on working days, and peak hours can also occur during weekends. Third, the peak time extension is the most important factor, and continuous peak hours always occur. This phenomenon is clearly shown in
Figure 4. Traffic peaks lasting several hours are very common, such as the top five peak hours at station 1 in the afternoon of 7 October 2017.
The above analysis revealed that the free holiday policy and the large number of passenger cars owned by families have altered public travel characteristics under the background of China’s tourism economy. The distribution rule of the 24 h traffic volume factor shown in
Figure 4 reflects this change. In fact, a substantial increase in the duration of traffic peaks suggests that the number of hours reaching or exceeding the recommended value of the DHV may be larger, which further indicates why the HV factor during peak hours under the background of the tourism economy exhibited a higher level and a gradual decline. This result is corroborated by the long-term and massive congestion of suburban expressways in China. In summary, under the background of the tourism economy, the travel characteristics of people have fundamentally changed, and the 30 HV factor has lost its original planning significance.
4.3. Correction of the Recommended Value of the DHV Factor
On the basis of the value and distribution structure of the HV factor during peak hours, the HV factor during peak hours is significantly higher than that according to the traditional rule and experiences a slower declining trend, which to a certain extent results in a more unfavorable economic environment of road design. Adaptations to the polarization characteristics of the peak hourly traffic to improve the DHV only remain advantageous for short periods, which may be unwise in terms of engineering economy. However, considering only the above analysis results, the actual hour corresponding to the recommended value of the DHV factor is the 245th hour. Ignoring this part of the traffic demand could lead to the current congestion situation that cannot be easily alleviated. Therefore, it is urgent to reconsider the selection of the DHV value. In addition, the representativeness of the characteristics of the rapid change in the decline rate of the HV factor near the 30th hour under the traditional rule has been greatly reduced, resulting in the determination of the new DHV more likely depending on the willingness to pay for traffic efficiency enhancement.
If allowed by the economic conditions of the area where the proposed road is located, the 20th–40th HV factor could still be used under the background of the tourism economy, but the recommended value of the DHV factor should be increased to 11.6–12.3%. This may lead to an increase in the number of lanes on new roads, but the number of traffic congestion hours will not exceed 30 h, which could better balance traffic efficiency and safety. If the economy is limited, the DHV should be slightly increased, e.g., the 80th–100th hourly traffic factor could be employed as the DHV factor. Consequently, the recommended value of the corresponding DHV factor would vary between 10.6% and 11%. This approach would not increase the project size greatly, but the number of congestion hours could significantly increase.
It should be noted that the data in this study were obtained from eight stations along the Xi’an suburban expressway, one of which was excluded because of its location and traffic characteristics atypical of suburban areas. More expressway traffic samples in suburban areas should be supplemented to verify the specifications obtained in this study. In addition, the impact of the proposed revision of the DHV factor on the project scale remains unclear. Relevant construction data are needed to verify the rationality of this revision proposal.
In addition to the economic problems of engineering, other effects brought by improving DHV also need to be weighed. In terms of positive impacts, first of all, increasing the number of lanes can alleviate the gas and noise pollution caused by congestion. It can also alleviate the problem of fuel transition consumption to a certain extent. Secondly, higher traffic efficiency can improve regional social benefits. Third, it can increase the satisfaction of road users. However, if this measurement is viewed from an overall sustainable perspective, the uncertainties therein need to be treated with caution.
Increasing the DHV factor will increase the number of lanes, which means further increases in land use. At the same time, it means an increase in interference to the environment: causing greater changes to the original topography, geomorphology and environment, aggravating the destruction of the original vegetation, enhancing ecological isolation, increasing the difficulty of soil and water conservation, and expanding the impact on hydrology [
31,
32,
33,
34]. When dealing with the above problems, whether such measures have obvious advantages should be further evaluated. In addition, the adjustment of DHV factor should also consider the sustainable development orientation of national transportation policy, such as improving the route and capacity of public transport to transfer traffic demand.
Since the nature of travel of local people is affected by geographical location, environment, climate, and day and night [
22], there may be some differences in DHV factors in various regions of China, but the changes of travel rules under the background of tourism economy should be consistent with the northwest region. Local traffic survey data should be combined with the correction of this factor in each region.
Intercity highways rarely undertake commuting traffic, while the change in their traffic characteristics may be different from that of suburban highways [
35]. This is also the reason why many countries, including China and the United States, choose the DHV coefficient on the basis of the traffic characteristics of suburban and intercity (urban and rural) highways, respectively [
9,
28]. On the other hand, due to the common tourism traffic between cities on holidays, the applicability of DHV may also change under the background of tourism economy. This concept should be further verified by future research.
Other countries and regions differ from China in urban layout and people’s living habits. Thus, their travel characteristics may be different. The revised parameters proposed in this paper may not apply to other countries. Yet this study can provide a new perspective for solving the same problem abroad.
5. Conclusions
On the basis of annual 8760 h traffic data obtained at traffic observation stations along the Xi’an suburban expressway from 2017 to 2019, this paper analyzed the distribution of the hourly traffic factor of this suburban expressway under the background of the tourism economy. It was found that the travel characteristics of people have greatly changed, and the distribution of the hourly traffic factor has fundamentally shifted.
There exists a contradiction between the actual 30 HV factor and the recommended value. The recommended value of the DHV in the specification corresponded to a number of hours greater than 200, with the 30 HV factor under the background of the tourism economy being 25% higher than the recommended value. The number of lanes designed with the recommended value of the existing DHV factor could be smaller than that required to meet the actual traffic demand. In other words, the normal congestion of suburban expressways is due to insufficient design capacity caused by DHV failure.
Daytime traffic peaks on suburban expressways persist for a long time. The period of a high traffic volume on working days continued from 7:00 a.m. to 7:00 p.m., resulting in a significant increase in the number of hours with a high traffic volume under the background of the tourism economy over the traditional context.
The variation in the HV factor during peak hours is lower than that in the HV factor under the traditional rule. The difference between the two sides divided by the 30th hour reached 7.7% and 6.1%, respectively. The HV factors in peak hours exhibited a slow and consistent downward trend, which differs from the typical characteristics of the 30 HV under the traditional rule.
In economically developed regions, the 20th to 40th HV could still be used as a design basis, whereby the factor of DHV is 11.6–12.3%. When the economic conditions are limited, the 80th to 100 HV could be employed, whereby the factor of DHV is 10.6–11%. However, the DHV factor should be determined in conjunction with traffic surveys. In the absence of traffic survey data, the results of this study could be considered for suburban expressways in Northwest China.
While increasing the DHV factor, general sustainability issues such as the impact of increased engineering scale on land use, environment, and ecology, and the interaction with public transport policies should be taken into account.


