


Ganodiesel: A New Biodiesel Feedstock from Biomass of the Mushroom Ganoderma lucidum


 ,
,  ,
,  ,
,  and
and 
Abstract
:1. Introduction
2. Materials and Methods
2.1. Microorganism and Medium
2.2. Stock Culture and Inoculum Preparation
2.3. Batch Fermentation
2.4. Optimisation of Medium Compositions Using RSM
2.5. Repeated-Batch Fermentation Using Optimised Condition
2.6. Extraction of Lipid
2.6.1. Soxhlet Extraction
2.6.2. Solvent Extraction
2.6.3. Ultrasonic-Assisted Extraction
2.7. Ganodiesel Production through Transesterification
2.8. Analytical Methods
2.8.1. Determination of Extracellular Polysaccharide Yield
2.8.2. Determination of Endopolysaccharide Yield
2.8.3. Determination of Biomass Concentration
2.8.4. Determination of Lipid Yield
2.9. Kinetic Calculations
2.10. Statistical Analysis
| Y: | predicted response | : | interaction coefficient |
| : | constant coefficient | : | quadratic coefficient |
| : | linear coefficient | : | coded values |
2.11. Determination of Biodiesel Properties
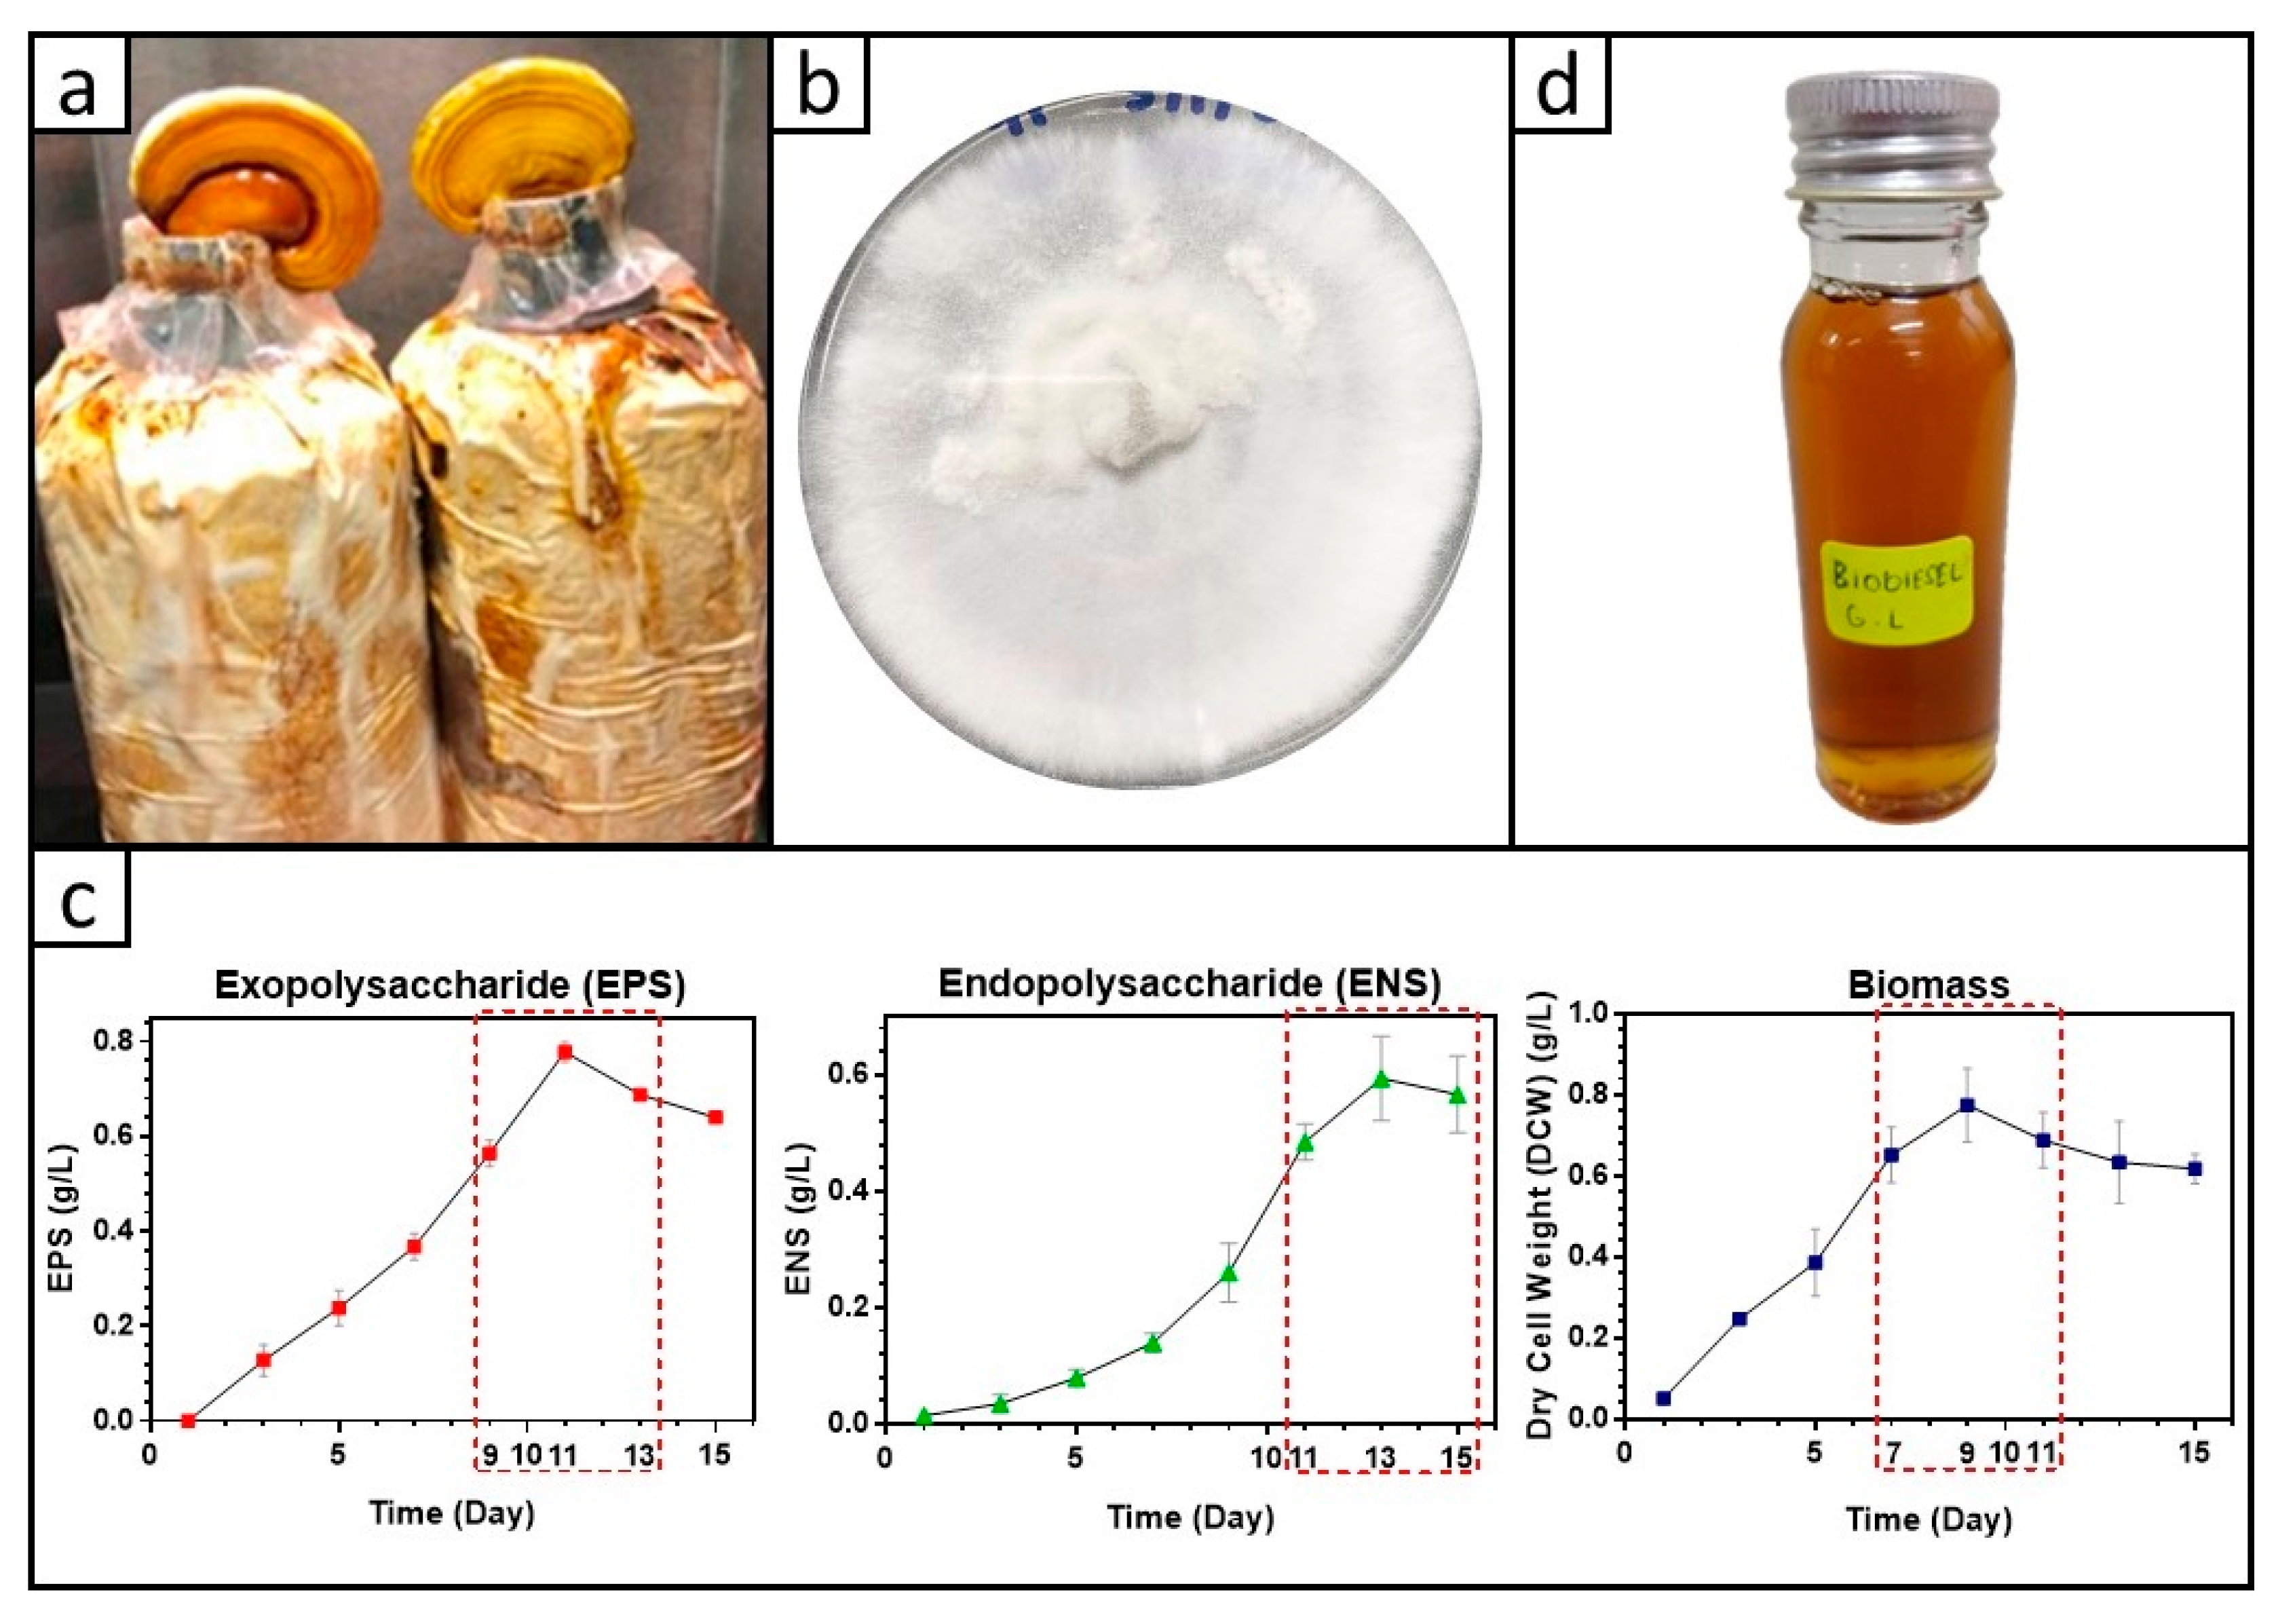
3. Results
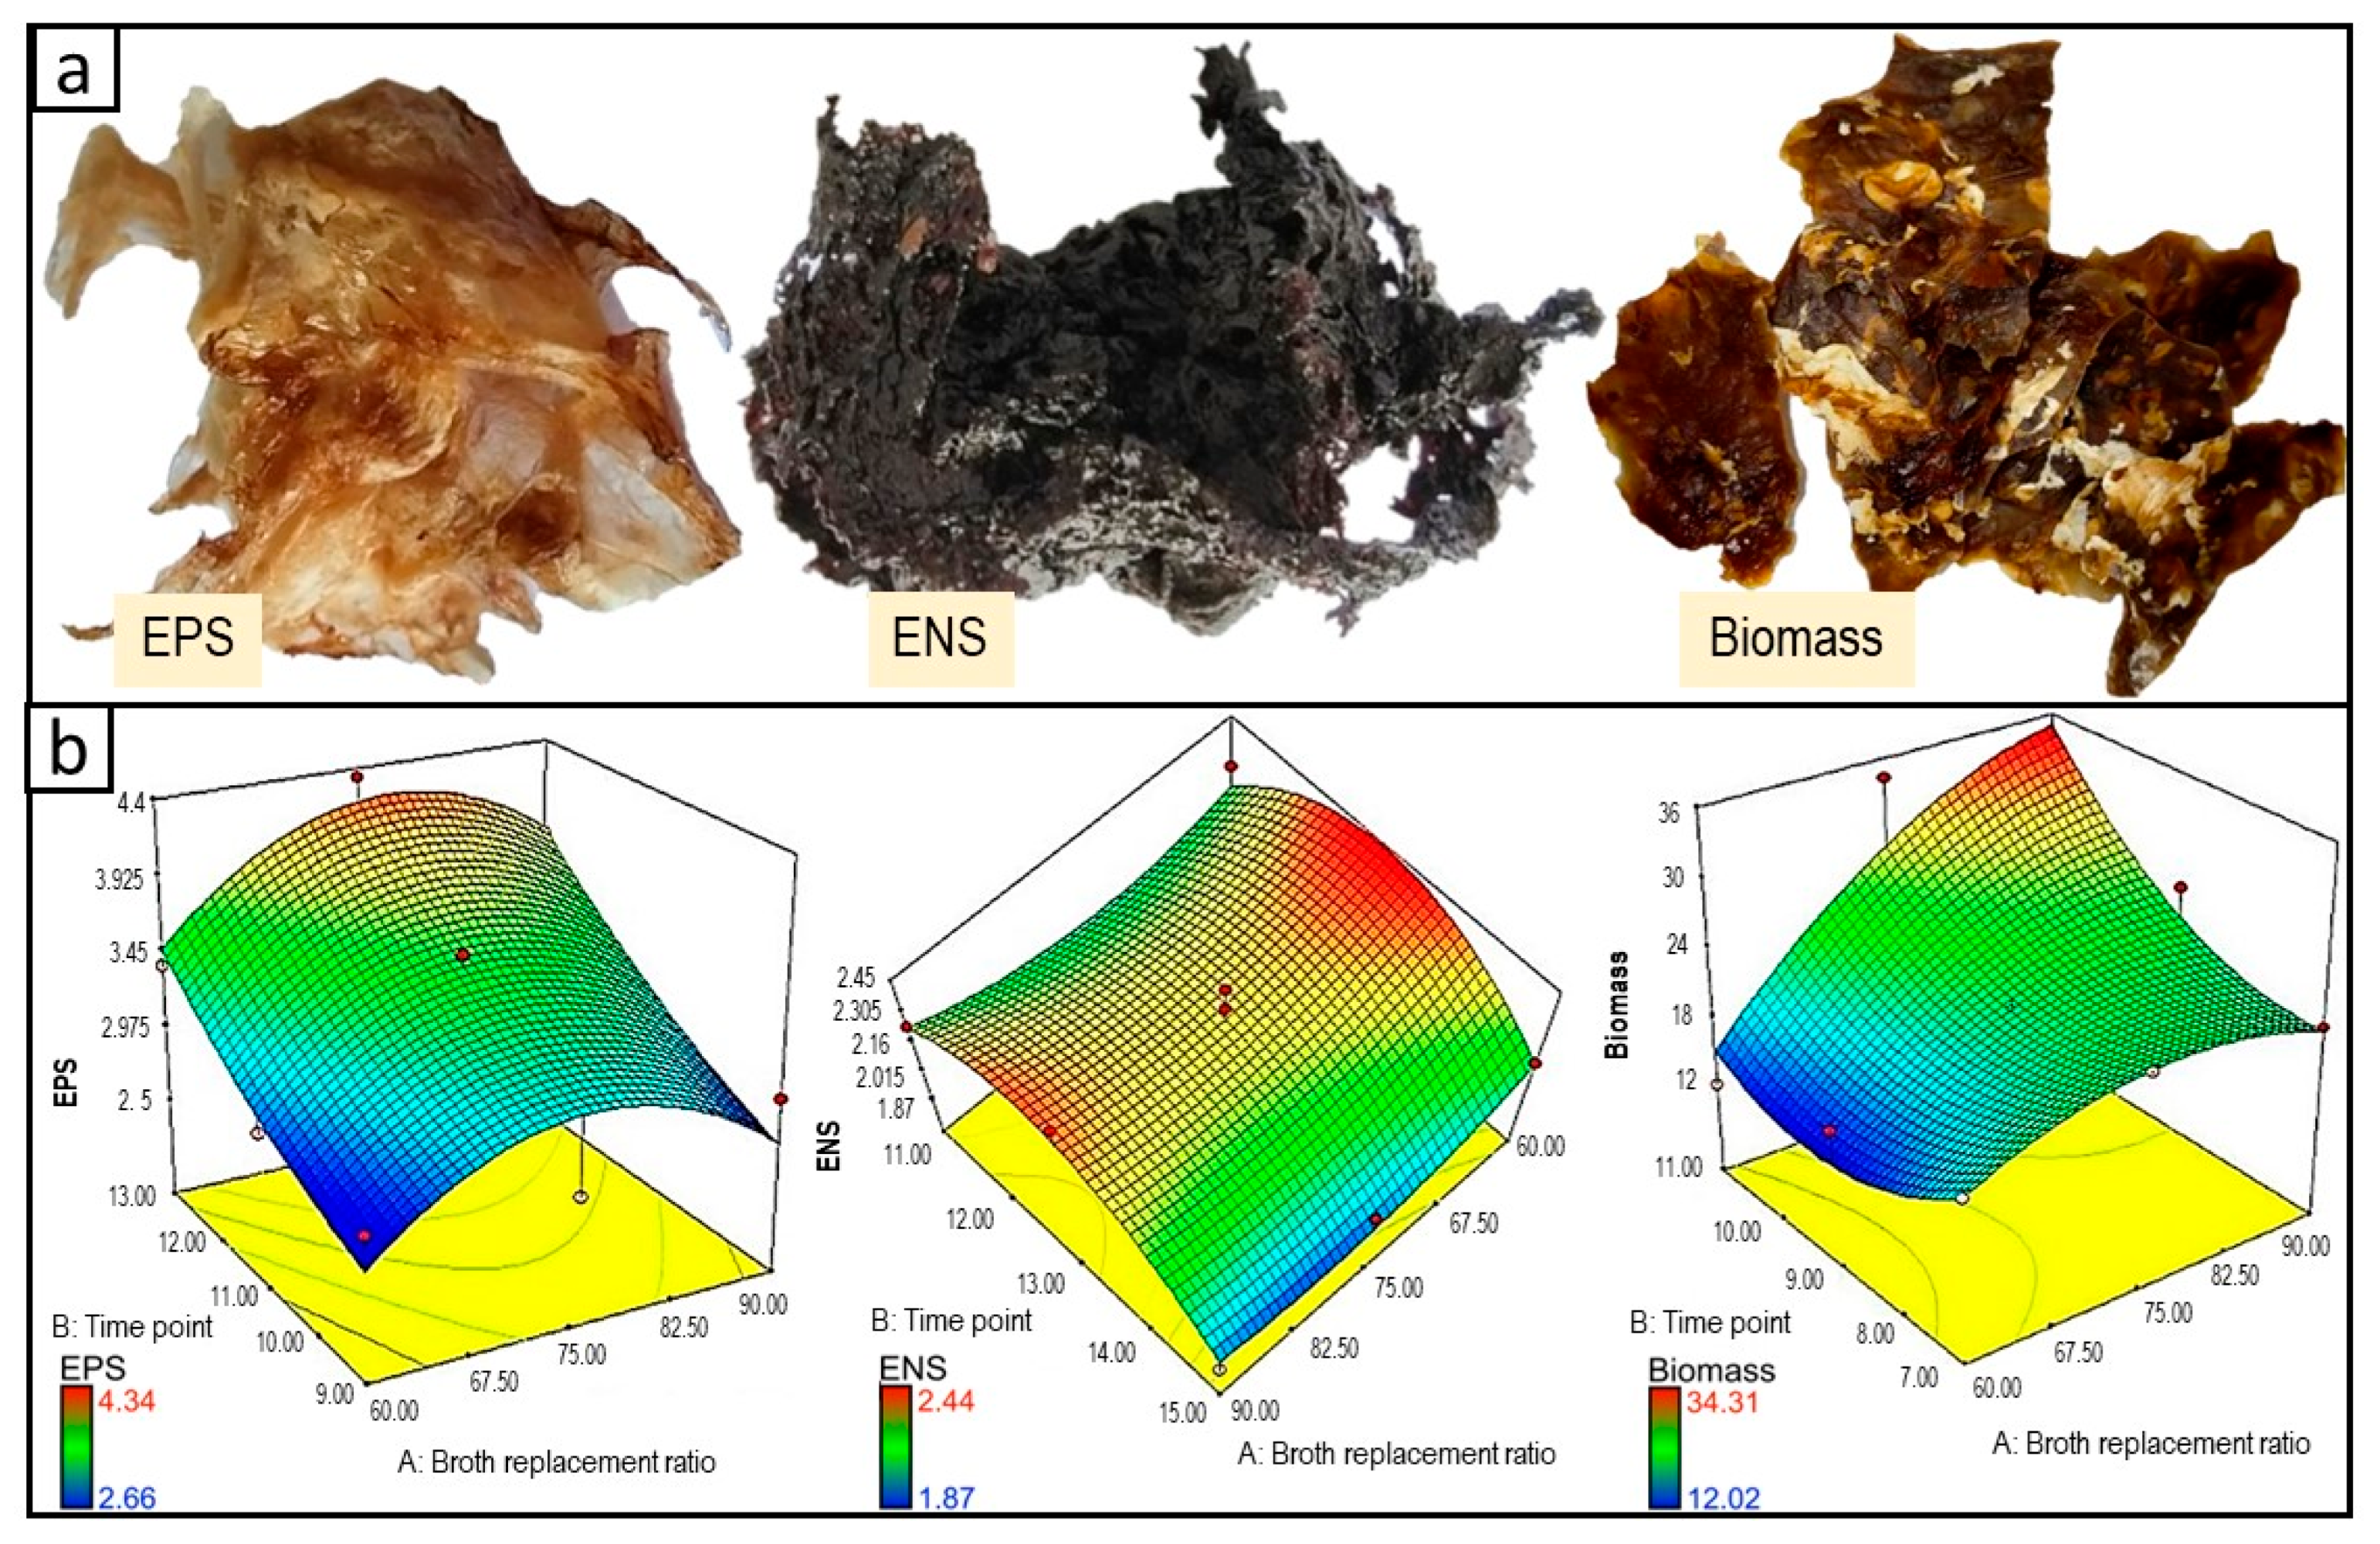
3.1. Optimization
3.1.1. Optimization of EPS Production
3.1.2. Optimization of ENS Production
3.1.3. Optimization of Biomass Production
3.1.4. Verification of Optimised Conditions
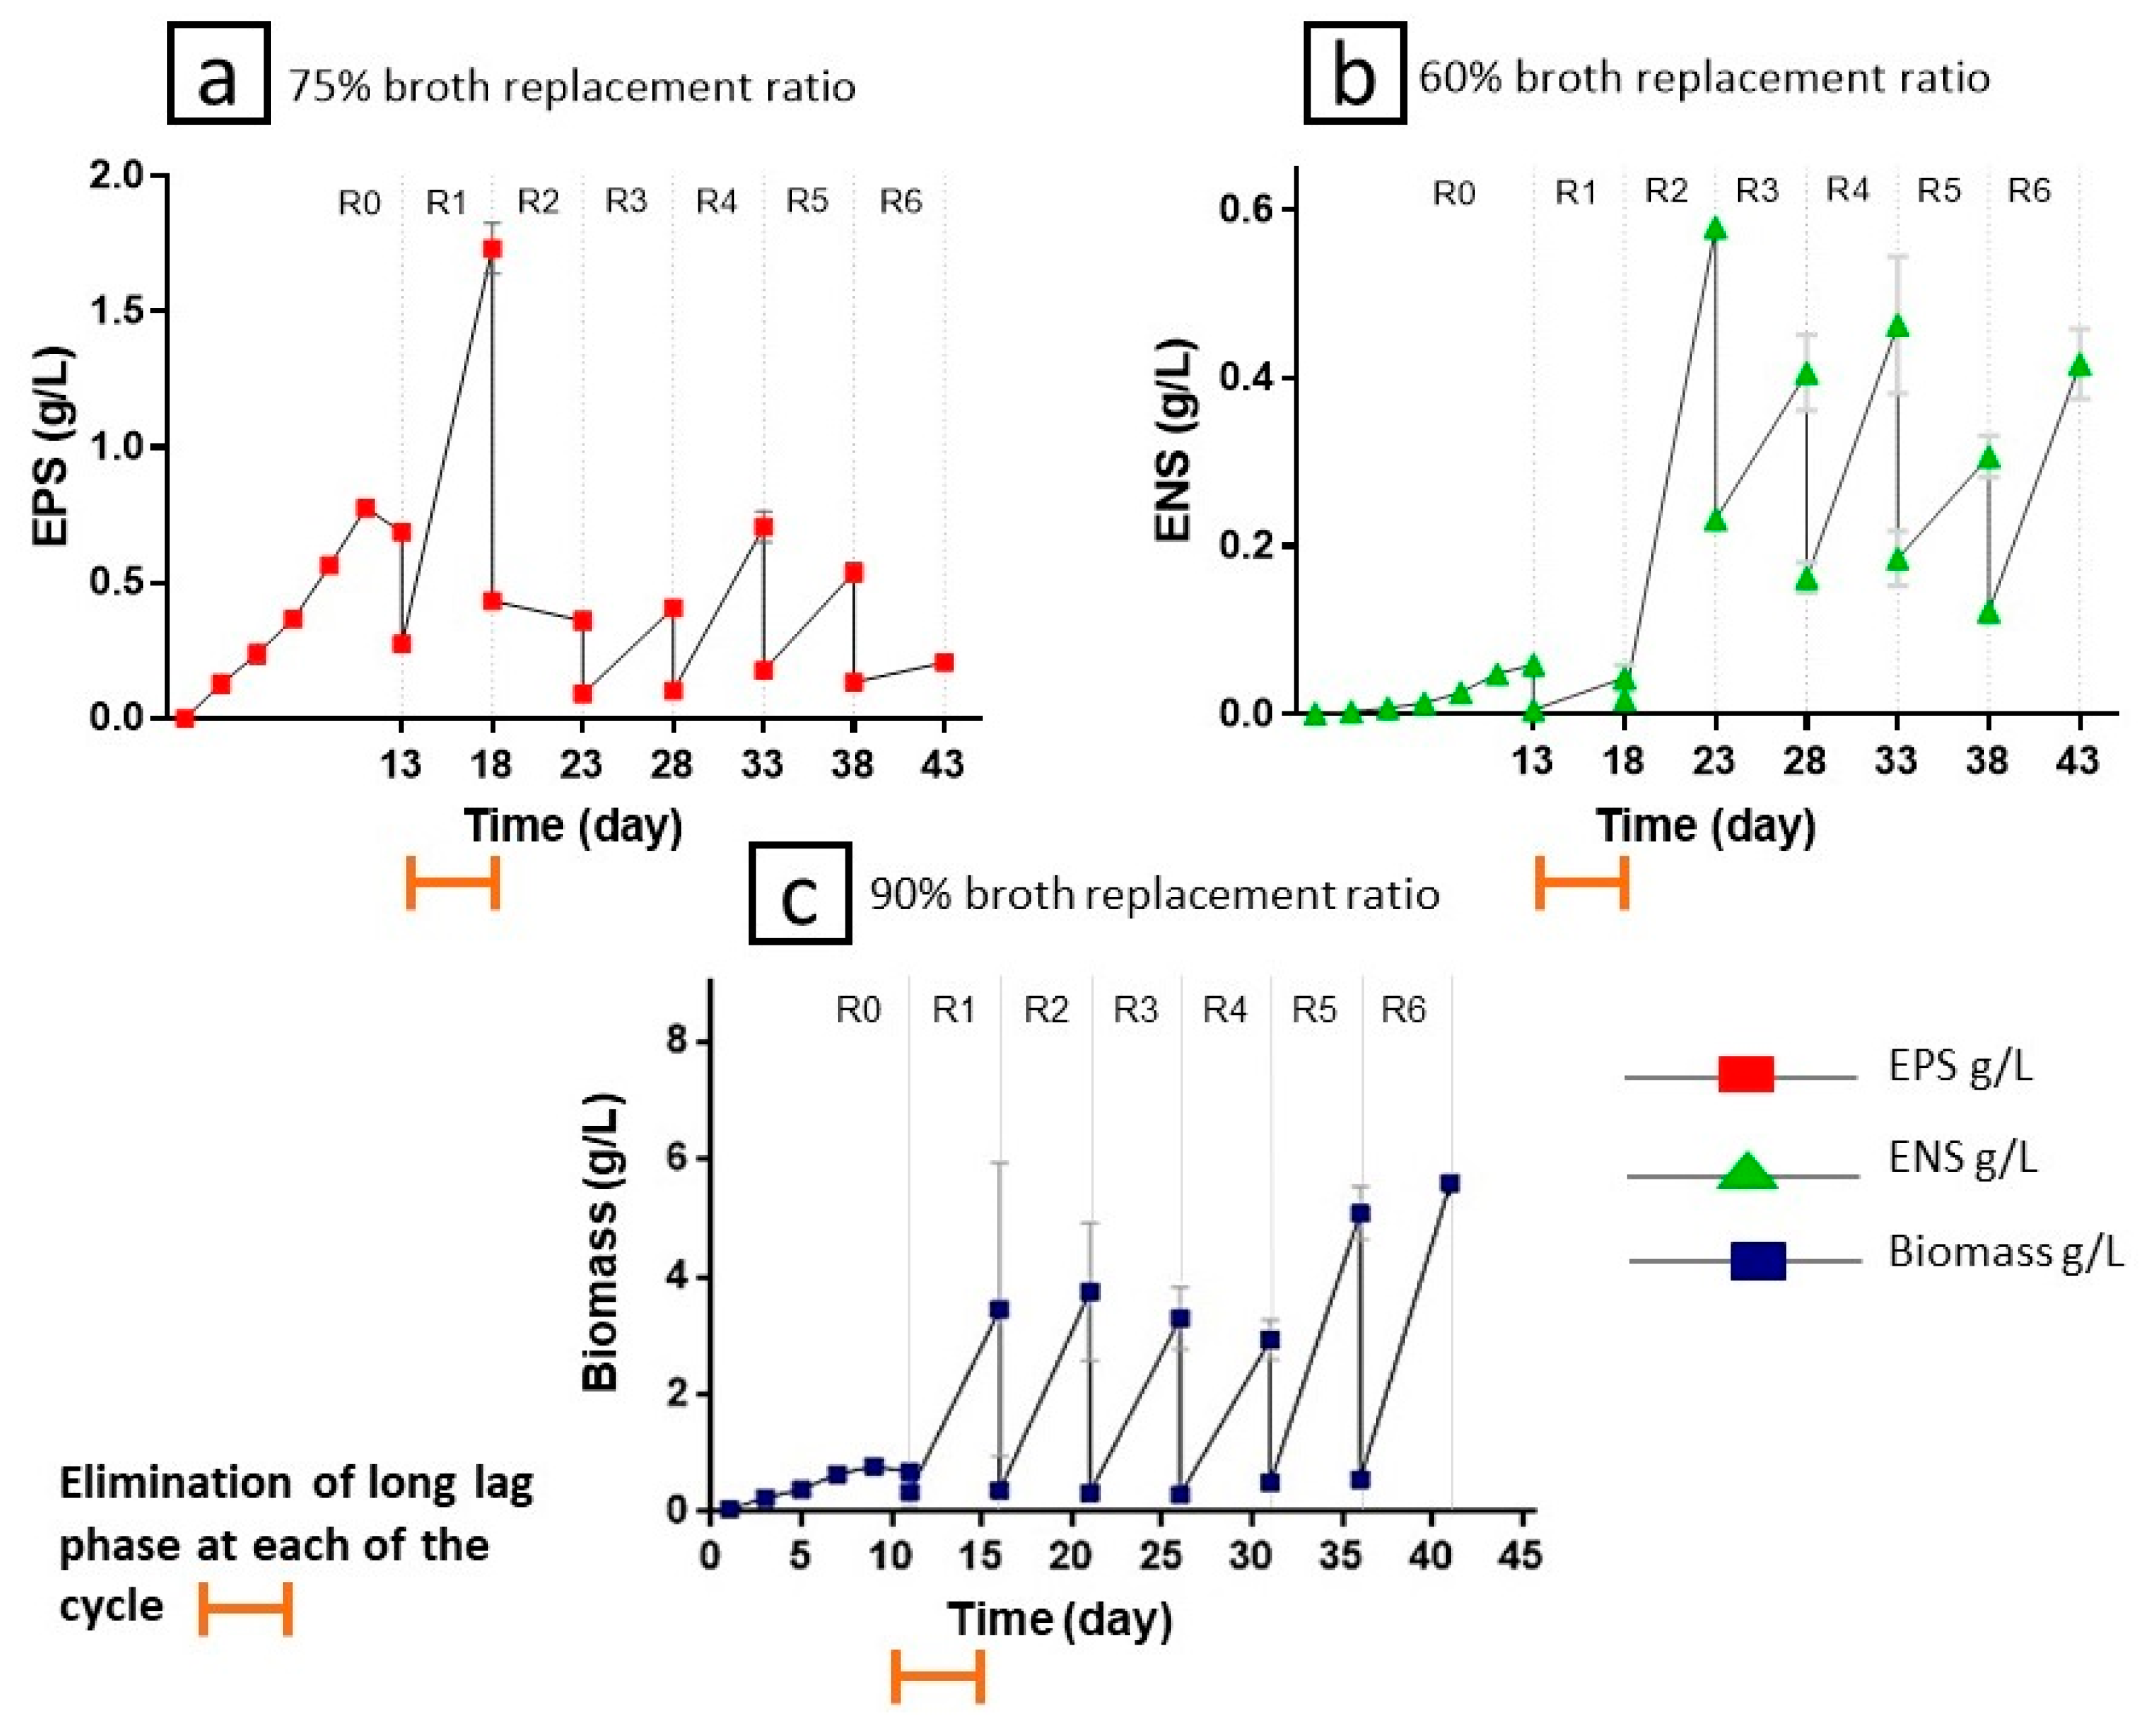
3.2. Repeated-Batch Fermentation Using Validated EPS–ENS–biomass Condition
3.2.1. Effect of BRR
3.2.2. Effect of BRTP
3.3. Evaluation of Lipid Yield
3.4. Effect of Solvent Volume and Extraction Time
4. Discussion
4.1. Optimization of EPS–ENS–biomass Production
4.2. Repeated-Batch Fermentation Using Validated EPS–ENS–biomass Condition
Effect of Broth Replacement Ratio and Broth Replacement Time Point
4.3. Evaluation of Lipid Yield

| Aspects | Extraction Techniques | ||
|---|---|---|---|
| SXE | SVE | UAE | |
| Procedure | An appropriate size of cellulose thimble was chosen for the sample before being placed in the Soxhlet extractor. The solvent in a round bottom flask heated with a mantle | Sample soaked in the solvent with a magnetic stirrer in a flat bottom flask and then heated by a hot plate | Sample soaked in solvent, and placed in an ultrasonic water bath equipment |
| Solvent | hexane | hexane | hexane |
| Sample size | 1–5 g | 1–5 g | 1–5 g |
| Temperature | 60 °C | 60 °C | 60 °C |
| Solvent volume | 50–150 mL | 100–200 mL | 100–300 mL |
| Extraction time | 3–9 h | 1–3 h | 1–5 h |
| Advantages | No filtration is needed, easy to use | Short extraction duration | Moderate extraction duration, easy to use |
| Disadvantages | Long extraction duration | Filtration needed | High solvent amount, filtration needed |
| Lipid yield | 9.44–18.80% | 14.57–20.36% | 4.30–7.50% |
| Quantity | Moderate | High | Low |
4.4. Effect of Solvent Volume and Extraction Time
4.5. Comparison of the Current Study with the Literature
4.5.1. Comparison of G. lucidum Optimization Using SmF
| Ganoderma lucidum Strains | Optimization Method | Cultivation Mode | Cultivation Method | Total Prep. Time (Days) | Initial pH | Glucose Concentration (g/L) | Agitation (rpm) | EPS (g/L) | ENS (g/L) | Biomass (g/L) | References |
|---|---|---|---|---|---|---|---|---|---|---|---|
| Ganoderma lucidum QRS 5120 | Response surface methodology | Shake Flask | Repeated-batch fermentation | 5 (up to 6 cycles) | 4 | 26.5 | 100 | 4.34 | 2.44 | 34.31 | Current study |
| Ganoderma lucidum QRS 5120 | Response surface methodology | Shake Flask | Batch fermentation | 10 | 4 | 26.5 | 100 | 2.64 | 1.52 | 5.19 | [21] |
| Ganoderma lucidum CCRC 36124 | Taguchi’s orthogonal array | Shake Flask | Batch fermentation | 7 | 6.5 | 12.1 | 160 | 0.420 | NA a | 18.70 | [43] |
| Ganoderma lucidum CAU 5501 | Orthogonal matrix | Shake Flask | Batch fermentation | 4 | - | 50 | 150 | 1.723 | NA a | 7.235 | [44] |
4.5.2. Comparison of Ganoderma Lipid Profile
4.6. Biodiesel Properties of Ganoderma lucidum FAME
5. Conclusions
Supplementary Materials
Author Contributions
Funding
Institutional Review Board Statement
Informed Consent Statement
Data Availability Statement
Acknowledgments
Conflicts of Interest
References
- Bamisile, O.; Huang, Q.; Dagbasi, M.; Taiwo, W.; Adebayo, V. Energy, exergy and environmental analyses of a biomass driven multi-generation system. Int. J. Exergy 2020, 31, 249–267. [Google Scholar] [CrossRef]
- Yang, M.; Yu, X. Energy Efficiency: Benefits for Environment and Society; Springer: London, UK, 2015. [Google Scholar]
- Rowan, N.J.; Galanakis, C.M. Unlocking challenges and opportunities presented by COVID-19 pandemic for cross-cutting disruption in agri-food and green deal innovations: Quo Vadis? Sci. Total Environ. 2020, 748, 141362. [Google Scholar] [CrossRef] [PubMed]
- Rowan, N.J.; Casey, O. Empower Eco multiactor HUB: A triple helix ‘academia-industry-authority’ approach to creating and sharing potentially disruptive tools for addressing novel and emerging new Green Deal opportunities under a United Nations Sustainable Development Goals framework. Curr. Opin. Environ. Sci. Health 2021, 21, 100254. [Google Scholar] [CrossRef]
- Masinda, M.M.; Sun, L.; Wang, G.; Hu, T. Moisture content thresholds for ignition and rate of fire spread for various dead fuels in northeast forest ecosystems of China. J. For. Res. 2020, 32, 1147–1155. [Google Scholar] [CrossRef]
- Goh, B.H.H.; Ong, H.C.; Cheah, M.Y.; Chen, W.-H.; Yu, K.L.; Mahlia, T.M.I. Sustainability of direct biodiesel synthesis from microalgae biomass: A critical review. Renew. Sustain. Energy Rev. 2019, 107, 59–74. [Google Scholar] [CrossRef]
- Aburto, J.; Amezcua-Allieri, M.A. Biodiesel and Green Diesel Fuels: A Techno-Economic Analysis. In Green Diesel: An Alternative to Biodiesel and Petrodiesel; Springer: Singapore, 2022; pp. 309–324. [Google Scholar]
- Quah, R.V.; Tan, Y.H.; Mubarak, N.; Khalid, M.; Abdullah, E.; Nolasco-Hipolito, C. An overview of biodiesel production using recyclable biomass and non-biomass derived magnetic catalysts. J. Environ. Chem. Eng. 2019, 7, 103219. [Google Scholar] [CrossRef]
- Sukhadiya, M.L.; Thakur, N.S.; Patel, V.R.; Gunaga, R.P.; Kharadi, V.B.; Tyagi, K.K.; Singh, S. Provenance variations in proximate principles, mineral matter, total phenols and phytochemicals of Melia dubia drupes: An unexplored alternate livestock feed stock. J. For. Res. 2020, 32, 119–131. [Google Scholar] [CrossRef]
- Nurul Amirah, H. Optimisation of Biomass and Exopolysaccharide Production in Wild Serbian Ganoderma Lucidum Strain BGF4A1 Using Response Surface Methodology/Nurul Amirah Hassan. Ph.D. Thesis, University of Malaya, Kuala Lumpur, Malaysia, 2019. [Google Scholar]
- Supramani, S.; Jailani, N.; Ramarao, K.; Zain, N.A.M.; Klaus, A.; Ahmad, R.; Wan-Mohtar, W.A.A.Q.I. Pellet diameter and morphology of European Ganoderma pfeifferi in a repeated-batch fermentation for exopolysaccharide production. Biocatal. Agric. Biotechnol. 2019, 19, 101118. [Google Scholar] [CrossRef]
- Du, Z.; Dong, C.-H.; Wang, K.; Yao, Y.-J. Classification, Biological Characteristics and Cultivations of Ganoderma. Ganoderma Health 2019, 1181, 15–58. [Google Scholar] [CrossRef]
- Wu, D.-T.; Deng, Y.; Chen, L.-X.; Zhao, J.; Bzhelyansky, A.; Li, S.-P. Evaluation on quality consistency of Ganoderma lucidum dietary supplements collected in the United States. Sci. Rep. 2017, 7, 1–10. [Google Scholar] [CrossRef] [Green Version]
- Chen, S. The Pharmacological Effects of Triterpenoids from Ganoderma lucidum and the Regulation of Its Biosynthesis. Adv. Biol. Chem. 2020, 10, 55–65. [Google Scholar] [CrossRef]
- Smith, J.E.; Rowan, N.; Sullivan, R. Medicinal mushrooms: A rapidly developing area of biotechnology for cancer therapy and other bioactivities. Biotechnol. Lett. 2002, 24, 1839–1845. [Google Scholar] [CrossRef]
- Sullivan, R.; Smith, J.E.; Rowan, N.J. Medicinal Mushrooms and Cancer Therapy: Translating a traditional practice into Western medicine. Perspect. Biol. Med. 2006, 49, 159–170. [Google Scholar] [CrossRef]
- Feng, J.; Zhang, J.-S.; Feng, N.; Yan, M.-Q.; Yang, Y.; Jia, W.; Lin, C.-C. A novel Ganoderma lucidum G0119 fermentation strategy for enhanced triterpenes production by statistical process optimization and addition of oleic acid. Eng. Life Sci. 2016, 17, 430–439. [Google Scholar] [CrossRef]
- Domingos, M.; de Souza-Cruz, P.B.; Ferraz, A.; Prata, A.M.R. A new bioreactor design for culturing basidiomycetes: Mycelial biomass production in submerged cultures of Ceriporiopsis subvermispora. Chem. Eng. Sci. 2017, 170, 670–676. [Google Scholar] [CrossRef]
- Esmaeilzadeh, M.; Kianirad, M.; Sheykhinejad, A.; Khosravi, A.; Sharifzadeh, A. Ganoderic Acid and Exopolysaccharide Production by Ganoderma Lucidum from Semi-Solid-State and Submerged Fermentation. Biol. J. Microorg. 2018, 7, 63–75. [Google Scholar]
- Hassan, N.A.; Supramani, S.; Sohedein, M.N.A.; Usuldin, S.R.A.; Klaus, A.; Ilham, Z.; Chen, W.-H.; Wan-Mohtar, W.A.A.Q.I. Efficient biomass-exopolysaccharide production from an identified wild-Serbian Ganoderma lucidum strain BGF4A1 mycelium in a controlled submerged fermentation. Biocatal. Agric. Biotechnol. 2019, 21, 101305. [Google Scholar] [CrossRef]
- Supramani, S.; Ahmad, R.; Ilham, Z.; Annuar, M.S.M.; Klaus, A.; Wan-Mohtar, W.A.A.Q.I. Optimisation of biomass, exopolysaccharide and intracellular polysaccharide production from the mycelium of an identified Ganoderma lucidum strain QRS 5120 using response surface methodology. AIMS Microbiol. 2019, 5, 19–38. [Google Scholar] [CrossRef]
- Birhanli, E.; Yesilada, O. Enhanced production of laccase in repeated-batch cultures of Funalia trogii and Trametes versicolor. Biochem. Eng. J. 2010, 52, 33–37. [Google Scholar] [CrossRef]
- Wan-Mohtar, W.A.A.Q.I.; Ab Kadir, S.; Saari, N. The morphology of Ganoderma lucidum mycelium in a repeated-batch fermentation for exopolysaccharide production. Biotechnol. Rep. 2016, 11, 2–11. [Google Scholar] [CrossRef]
- Fan, C.; Qi, K.; Xia, X.-X.; Zhong, J.-J. Efficient ethanol production from corncob residues by repeated fermentation of an adapted yeast. Bioresour. Technol. 2013, 136, 309–315. [Google Scholar] [CrossRef]
- Ji, X.-J.; Zhang, A.-H.; Nie, Z.-K.; Wu, W.-J.; Ren, L.-J.; Huang, H. Efficient arachidonic acid-rich oil production by Mortierella alpina through a repeated fed-batch fermentation strategy. Bioresour. Technol. 2014, 170, 356–360. [Google Scholar] [CrossRef]
- Naritomi, T.; Kouda, T.; Yano, H.; Yoshinaga, F.; Shigematsu, T.; Morimura, S.; Kida, K. Influence of broth exchange ratio on bacterial cellulose production by repeated-batch culture. Process Biochem. 2002, 38, 41–47. [Google Scholar] [CrossRef]
- Hakimi, M.I.; Ilham, Z.; Kohar, R.A.A. Enhancement of Agro-Industrial Copra Residue Oil Yield Using Microwave-Assisted Extraction. Waste Biomass- Valorization 2018, 10, 2681–2688. [Google Scholar] [CrossRef]
- Redzwan, G.; Amin, M.M.; Zulkarnain, N.N.; Abu Mansor, M.R.; Annuar, M.S.M.; Ilham, Z. Extrication of biodiesel feedstock from early stage of food waste liquefaction. J. Mater. Cycles Waste Manag. 2015, 19, 676–681. [Google Scholar] [CrossRef]
- Perrier, A.; Delsart, C.; Boussetta, N.; Grimi, N.; Citeau, M.; Vorobiev, E. Effect of ultrasound and green solvents addition on the oil extraction efficiency from rapeseed flakes. Ultrason. Sonochemistry 2017, 39, 58–65. [Google Scholar] [CrossRef]
- Tonato, D.; Luft, L.; Confortin, T.C.; Zabot, G.L.; Mazutti, M.A. Enhancement of fatty acids in the oil extracted from the fungus Nigrospora sp. by supercritical CO2 with ethanol as a cosolvent. J. Supercrit. Fluids 2019, 146, 180–188. [Google Scholar] [CrossRef]
- Stanbury, P.F.; Whitaker, A.; Hall, S.J. Principles of Fermentation Technology; Elsevier: Amsterdam, The Netherlands, 2013. [Google Scholar]
- BS EN 14214:2012+A2:2019; Fatty acid methyl esters (FAME) for use in diesel engines and heating applications: Requirements and test methods. Liquid Petroleum Products, British Standards Institutions (BSI): London, UK, 2019.
- ASTM D. D6751-08; Standard Specification for Biodiesel Fuel Blend Stock (B100) for Middle Distillate Fuels. ASTM International: West Conshohocken, PA, USA, 2018. [CrossRef]
- Asl, P.J.; Niazmand, R.; Yahyavi, F. Extraction of phytosterols and tocopherols from rapeseed oil waste by supercritical CO2 plus co-solvent: A comparison with conventional solvent extraction. Heliyon 2020, 6, e03592. [Google Scholar] [CrossRef]
- Ma, Y.; Wu, X.; Zhao, L.; Wang, Y.; Liao, X. Comparison of the compounds and characteristics of pepper seed oil by pressure-assisted, ultrasound-assisted and conventional solvent extraction. Innov. Food Sci. Emerg. Technol. 2019, 54, 78–86. [Google Scholar] [CrossRef]
- Oukebdane, K.; Portet-Koltalo, F.; Machour, N.; Dionnet, F.; Desbène, P. Comparison of hot Soxhlet and accelerated solvent extractions with microwave and supercritical fluid extractions for the determination of polycyclic aromatic hydrocarbons and nitrated derivatives strongly adsorbed on soot collected inside a diesel particulate filter. Talanta 2010, 82, 227–236. [Google Scholar] [CrossRef]
- Rao, P.; Rathod, V. Phytochemicals: An Insight to Modern Extraction Technologies and Their Applications; Academic Press: Cambridge, MA, USA, 2017; pp. 495–521. [Google Scholar] [CrossRef]
- Mohammadpour, H.; Sadrameli, S.M.; Eslami, F.; Asoodeh, A. Optimization of ultrasound-assisted extraction of Moringa peregrina oil with response surface methodology and comparison with Soxhlet method. Ind. Crop. Prod. 2019, 131, 106–116. [Google Scholar] [CrossRef]
- Ibrahim, N.A.; Zaini, M.A.A. Microwave-assisted solvent extraction of castor oil from castor seeds. Chin. J. Chem. Eng. 2018, 26, 2516–2522. [Google Scholar] [CrossRef]
- Efthymiopoulos, I.; Hellier, P.; Ladommatos, N.; Russo-Profili, A.; Eveleigh, A.; Aliev, A.; Kay, A.; Mills-Lamptey, B. Influence of solvent selection and extraction temperature on yield and composition of lipids extracted from spent coffee grounds. Ind. Crop. Prod. 2018, 119, 49–56. [Google Scholar] [CrossRef]
- Kumar, S.P.J.; Prasad, S.R.; Banerjee, R.; Agarwal, D.K.; Kulkarni, K.S.; Ramesh, K.V. Green solvents and technologies for oil extraction from oilseeds. Chem. Central J. 2017, 11, 1–7. [Google Scholar] [CrossRef]
- Menegazzo, M.L.; Fonseca, G.G. Biomass recovery and lipid extraction processes for microalgae biofuels production: A review. Renew. Sustain. Energy Rev. 2019, 107, 87–107. [Google Scholar] [CrossRef]
- Chang, M.-Y.; Tsai, G.-J.; Houng, J.-Y. Optimization of the medium composition for the submerged culture of Ganoderma lucidum by Taguchi array design and steepest ascent method. Enzym. Microb. Technol. 2006, 38, 407–414. [Google Scholar] [CrossRef]
- Yuan, B.; Chi, X.; Zhang, R. Optimization of exopolysaccharides production from a novel strain of Ganoderma lucidum CAU5501 in submerged culture. Braz. J. Microbiol. 2012, 43, 490–497. [Google Scholar] [CrossRef]
- Bin Zakaria, M.; Vijayasekaran; Ilham, Z.; Muhamad, N.A. Anti-inflammatory Activity of Calophyllum Inophyllum Fruits Extracts. Procedia Chem. 2014, 13, 218–220. [Google Scholar] [CrossRef]
- Sohedein, M.N.A.; Wan-Mohtar, W.A.A.Q.I.; Hui-Yin, Y.; Ilham, Z.; Chang, J.-S.; Supramani, S.; Siew-Moi, P. Optimisation of biomass and lipid production of a tropical thraustochytrid Aurantiochytrium sp. UMACC-T023 in submerged-liquid fermentation for large-scale biodiesel production. Biocatal. Agric. Biotechnol. 2020, 23, 101496. [Google Scholar] [CrossRef]
- Papaspyridi, L.; Sinanoglou, V.; Strati, I.; Katapodis, P.; Christakopoulos, P. Fatty acid profile of Pleurotus ostreatus and Ganoderma australe grown naturally and in a batch bioreactor. Acta Aliment. 2013, 42, 328–337. [Google Scholar] [CrossRef]
- Sande, D.; de Oliveira, G.P.; Moura, M.A.F.E.; Martins, B.D.A.; Lima, M.T.N.S.; Takahashi, J.A. Edible mushrooms as a ubiquitous source of essential fatty acids. Food Res. Int. 2019, 125, 108524. [Google Scholar] [CrossRef]
- Lin, C.-Y.; Chiu, C.-C. Burning characteristics of palm-oil biodiesel under long-term storage conditions. Energy Convers. Manag. 2010, 51, 1464–1467. [Google Scholar] [CrossRef]

| Run No. | EPS (g/L) | ENS (g/L) | ||||||
|---|---|---|---|---|---|---|---|---|
| Variables | Responses | Variables | Responses | |||||
| BRR (%) | BRTP (Day) | Actual | Predicted | BRR (%) | BRTP (Day) | Actual | Predicted | |
| 1 | 75 | 11 | 3.63 | 3.56 | 75 | 11 | 2.02 | 2.10 |
| 2 | 75 | 11 | 3.63 | 3.56 | 60 | 13 | 2.36 | 2.44 |
| 3 | 75 | 11 | 3.63 | 3.56 | 75 | 13 | 2.29 | 2.30 |
| 4 | 90 | 11 | 2.91 | 3.15 | 75 | 13 | 2.25 | 2.30 |
| 5 | 75 | 13 | 4.34 | 4.19 | 60 | 11 | 2.26 | 2.18 |
| 6 | 60 | 11 | 2.80 | 2.9 | 75 | 15 | 1.98 | 1.92 |
| 7 | 75 | 9 | 2.66 | 3.15 | 75 | 13 | 2.35 | 2.30 |
| 8 | 90 | 9 | 2.96 | 2.68 | 90 | 15 | 1.87 | 1.94 |
| 9 | 60 | 9 | 2.75 | 2.54 | 75 | 13 | 2.43 | 2.30 |
| 10 | 75 | 11 | 3.63 | 3.56 | 90 | 11 | 2.24 | 2.23 |
| 11 | 90 | 13 | 3.79 | 3.83 | 90 | 13 | 2.44 | 2.38 |
| 12 | 60 | 13 | 3.37 | 3.48 | 60 | 15 | 2.11 | 2.11 |
| 13 | 75 | 11 | 3.63 | 3.56 | 75 | 13 | 2.21 | 2.30 |
| Run No. | Biomass (g/L) | |||
|---|---|---|---|---|
| Variables | Responses | |||
| BRR (%) | BRTP (Day) | Actual | Predicted | |
| 1 | 60 | 11 | 12.02 | 14.70 |
| 2 | 75 | 9 | 20.39 | 21.82 |
| 3 | 60 | 7 | 18.05 | 17.71 |
| 4 | 75 | 9 | 20.39 | 18.91 |
| 5 | 75 | 7 | 22.44 | 21.82 |
| 6 | 75 | 9 | 20.39 | 21.82 |
| 7 | 90 | 9 | 26.26 | 27.45 |
| 8 | 60 | 9 | 15.57 | 16.20 |
| 9 | 75 | 9 | 20.39 | 21.82 |
| 10 | 90 | 11 | 32.38 | 34.78 |
| 11 | 90 | 7 | 20.73 | 20.11 |
| 12 | 75 | 11 | 34.31 | 24.74 |
| 13 | 75 | 9 | 20.39 | 21.82 |
| Source | Sum of Squares | DF | Mean Square | F Value | Prob > F | |
|---|---|---|---|---|---|---|
| Model | 2.560 | 5 | 0.510 | 7.39 | 0.0103 * | significant |
| A: BRR | 0.091 | 1 | 0.091 | 1.32 | 0.2889 | |
| B: BRTP | 1.630 | 1 | 1.630 | 23.55 | 0.0018 * | significant |
| AB | 0.011 | 1 | 0.011 | 0.16 | 0.7019 | |
| A2 | 0.800 | 1 | 0.800 | 11.50 | 0.0116 * | significant |
| B2 | 0.032 | 1 | 0.032 | 0.46 | 0.5183 | |
| Residual | 0.490 | 7 | 0.069 | |||
| Lack of Fit | 0.490 | 3 | 0.160 | not significant | ||
| Pure Error | 0 | 4 | 0 | |||
| Cor Total | 3.05 | 12 | ||||
| Std. Dev. = 0.26 | R2 = 0.8408 | Adeq Precision = 9.232 | ||||
| Mean = 3.36 | Adjusted R2 = 0.727 | |||||
| Source | Sum of Squares | DF | Mean Square | F Value | Prob > F | |
|---|---|---|---|---|---|---|
| Model | 0.310 | 5 | 0.062 | 7.04 | 0.0117 * | significant |
| A: BRR | 5.40 × 10⁻³ | 1 | 5.40 × 10⁻³ | 0.62 | 0.4578 | |
| B: BRTP | 0.052 | 1 | 0.052 | 5.98 | 0.0445 * | significant |
| AB | 0.012 | 1 | 0.012 | 1.38 | 0.2779 | |
| A2 | 0.031 | 1 | 0.031 | 3.59 | 0.1002 | |
| B2 | 0.240 | 1 | 0.240 | 27.19 | 0.0012 * | significant |
| Residual | 0.061 | 7 | 8.75 × 10⁻³ | |||
| Lack of Fit | 0.031 | 3 | 0.010 | 1.39 | 0.3664 | not significant |
| Pure Error | 0.03 | 4 | 7.48 × 10⁻³ | |||
| Cor Total | 0.37 | 12 | ||||
| Std. Dev. = 0.094 | R2 = 0.8341 | Adeq Precision = 8.237 | ||||
| Mean = 2.22 | Adjusted R2 = 0.7155 | |||||
| Source | Sum of Squares | DF | Mean Square | F Value | Prob > F | |
|---|---|---|---|---|---|---|
| Model | 375.44 | 5 | 75.09 | 7.21 | 0.0110 * | significant |
| A: BRR | 189.62 | 1 | 189.62 | 18.21 | 0.0037 * | significant |
| B: BRTP | 50.98 | 1 | 50.98 | 4.90 | 0.0626 | |
| AB | 78.15 | 1 | 78.15 | 7.50 | 0.0289 * | significant |
| A2 | 31.70 | 1 | 31.70 | 3.04 | 0.1246 | |
| B2 | 45.80 | 1 | 45.80 | 4.40 | 0.0742 | |
| Residual | 72.89 | 7 | 10.41 | |||
| Lack of Fit | 72.89 | 3 | 24.30 | not significant | ||
| Pure Error | 0 | 4 | 0 | |||
| Cor Total | 448.34 | 12 | ||||
| Std. Dev. = 3.23 | R2 = 0.8374 | Adeq Precision = 10.332 | ||||
| Mean = 21.82 | Adjusted R2 = 0.7213 | |||||
| Run | Variables | Responses | |||
|---|---|---|---|---|---|
| BRR | BRTP | EPS (g/L) | ENS (g/L) | Biomass (DCW g/L) | |
| EPS | 77.46 | 13.00 | 4.21 | − | − |
| ENS | 60.00 | 12.85 | − | 2.44 | − |
| Biomass | 89.52 | 10.96 | − | − | 34.32 |
| BRTP (Day) | BRR (%) | Kinetics a | RBF Cycles b | Sum (R1–R6) | |||||
|---|---|---|---|---|---|---|---|---|---|
| R1 | R2 | R3 | R4 | R5 | R6 | ||||
| 13 | 75 | PEPS (g/L day−1) | 0.3467 | 0.0720 | 0.0813 | 0.1413 | 0.1080 | 0.0413 | 0.7906 |
| 13 | 60 | PENS (g/L day−1) | 0.0087 | 0.1160 | 0.0813 | 0.0927 | 0.0613 | 0.0833 | 0.4433 |
| 11 | 90 | PX (g/L day−1) | 0.6880 | 0.7480 | 0.6600 | 0.5860 | 1.0160 | 1.1200 | 4.8180 |
| Extraction Techniques a | Source | DF | Sum of sq | Mean sq | F-Value | p-Value |
|---|---|---|---|---|---|---|
| Solvent volume | 2 | 14.560 | 7.2800 | 67.55 | 0.000 |
| Extraction time | 2 | 139.253 | 69.6267 | 646.02 | 0.000 | |
| Solvent volume Extraction time | 4 | 22.897 | 5.7242 | 53.11 | 0.000 | |
| Error | 9 | 0.970 | 0.1078 | |||
| Mean = 12.12 | R2 = 0.9945 | |||||
| Variance = 10.45 | Adjusted R2 = 0.987 | |||||
| Std. Dev. = 3.03 | Predicted R2 = 0.9782 | |||||
| Solvent volume | 2 | 9.906 | 4.9532 | 31.60 | 0.000 |
| Extraction time | 2 | 137.224 | 68.6118 | 437.73 | 0.000 | |
| Solvent volume Extraction time | 4 | 43.766 | 10.9415 | 69.80 | 0.000 | |
| Error | 9 | 1.411 | 0.1567 | |||
| Mean = 13.44 | R2 = 0.9927 | |||||
| Variance = 11.31 | Adjusted R2 = 0.9261 | |||||
| Std. Dev. = 3.36 | Predicted R2 = 0.9707 | |||||
| Solvent volume | 2 | 1.0844 | 0.54222 | 9.76 | 0.006 |
| Extraction time | 2 | 19.1878 | 9.59389 | 172.69 | 0.000 | |
| Solvent volume Extraction time | 4 | 1.4056 | 0.35139 | 6.33 | 0.010 | |
| Error | 9 | 0.5000 | 0.05556 | |||
| Mean = 9.24 | R2 = 0.9775 | |||||
| Variance = 5.34 | Adjusted R2 = 0.9574 | |||||
| Std. Dev. = 2.31 | Predicted R2 = 0.9098 | |||||
| Fatty Acid | Structure | Ganoderma lucidum (wt%) | Ganoderma austral (wt%) | Ganoderma applanatum (wt%) |
|---|---|---|---|---|
| Palmitic | 16:0 | 16.2 | 10.7 | 10.2 |
| Palmitoleic | 16:1 | 2.2 | 1.9 | 2.0 |
| Stearic | 18:0 | 2.3 | 2.7 | 2.5 |
| Oleic | 18:1 | 66.1 | 30 | 15.5 |
| Linoleic | 18:2 | 13.2 | 49.5 | 58.2 |
| References | This study | [47] | [48] | |
| Properties | Method | Unit | GLME (Biodiesel) | US (ASTM D6751-08) | EU (EN 14214) |
|---|---|---|---|---|---|
| Kinematic viscosity (40 °C) | ASTM D445 | mm2/s | 3.8 | 1.9–6.0 | 3.5–5.0 |
| Carbon residue | ASTM D4530 | wt% | 0.10 | ≤0.05 | <0.30 |
| Pour point | ASTM D2500 | °C | −3.0 | - | - |
| Cold filter plugging point | ASTM D6371 | °C | −2.0 | - | - |
| Ignition point | ASTM D93 | °C | 153.5 | ≥130 | >101 |
| Cloud point | ASTM D6749 | °C | −1.0 | - | - |
| Oxidation stability | EN 14112 | h | 6 | - | 8 |
| Ester content | EN 14103 | wt% | 97.5 | - | >96.5 |
| Monoglyceride | EN 14105 | wt% | 0.05 | - | <0.80 |
| Diglyceride | EN 14105 | wt% | 0.03 | - | <0.20 |
| Triglyceride | EN 14105 | wt% | n.d. b | - | <0.20 |
| Total glycerol content | EN 14105 | wt% | 0.15 | <0.24 | <0.25 |
| Water content | EN ISO12937 | mg/kg | 345 | <500 | <500 |
| Acid number | EN 14104 | mg(KOH)/g | 0.38 | <0.50 | <0.50 |
| Iodine value | EN 14111 | g(I2)/100 g | 112 | - | <120 |
Publisher’s Note: MDPI stays neutral with regard to jurisdictional claims in published maps and institutional affiliations. |
© 2022 by the authors. Licensee MDPI, Basel, Switzerland. This article is an open access article distributed under the terms and conditions of the Creative Commons Attribution (CC BY) license (https://creativecommons.org/licenses/by/4.0/).
Share and Cite
Mohamad Jahis, B.M.; Ilham, Z.; Supramani, S.; Sohedein, M.N.A.; Ibrahim, M.F.; Abd-Aziz, S.; Rowan, N.; Wan-Mohtar, W.A.A.Q.I. Ganodiesel: A New Biodiesel Feedstock from Biomass of the Mushroom Ganoderma lucidum. Sustainability 2022, 14, 10764. https://doi.org/10.3390/su141710764
Mohamad Jahis BM, Ilham Z, Supramani S, Sohedein MNA, Ibrahim MF, Abd-Aziz S, Rowan N, Wan-Mohtar WAAQI. Ganodiesel: A New Biodiesel Feedstock from Biomass of the Mushroom Ganoderma lucidum. Sustainability. 2022; 14(17):10764. https://doi.org/10.3390/su141710764
Chicago/Turabian StyleMohamad Jahis, Besek Mariam, Zul Ilham, Sugenendran Supramani, Mohamad Nor Azzimi Sohedein, Mohamad Faizal Ibrahim, Suraini Abd-Aziz, Neil Rowan, and Wan Abd Al Qadr Imad Wan-Mohtar. 2022. "Ganodiesel: A New Biodiesel Feedstock from Biomass of the Mushroom Ganoderma lucidum" Sustainability 14, no. 17: 10764. https://doi.org/10.3390/su141710764
APA StyleMohamad Jahis, B. M., Ilham, Z., Supramani, S., Sohedein, M. N. A., Ibrahim, M. F., Abd-Aziz, S., Rowan, N., & Wan-Mohtar, W. A. A. Q. I. (2022). Ganodiesel: A New Biodiesel Feedstock from Biomass of the Mushroom Ganoderma lucidum. Sustainability, 14(17), 10764. https://doi.org/10.3390/su141710764