
Computational Fluid Dynamic Applications for Solar Stills Efficiency Assessment: A Review

 , ,
, ,  ,
,  , ,
, ,
Abstract
:1. Introduction
2. Methodology
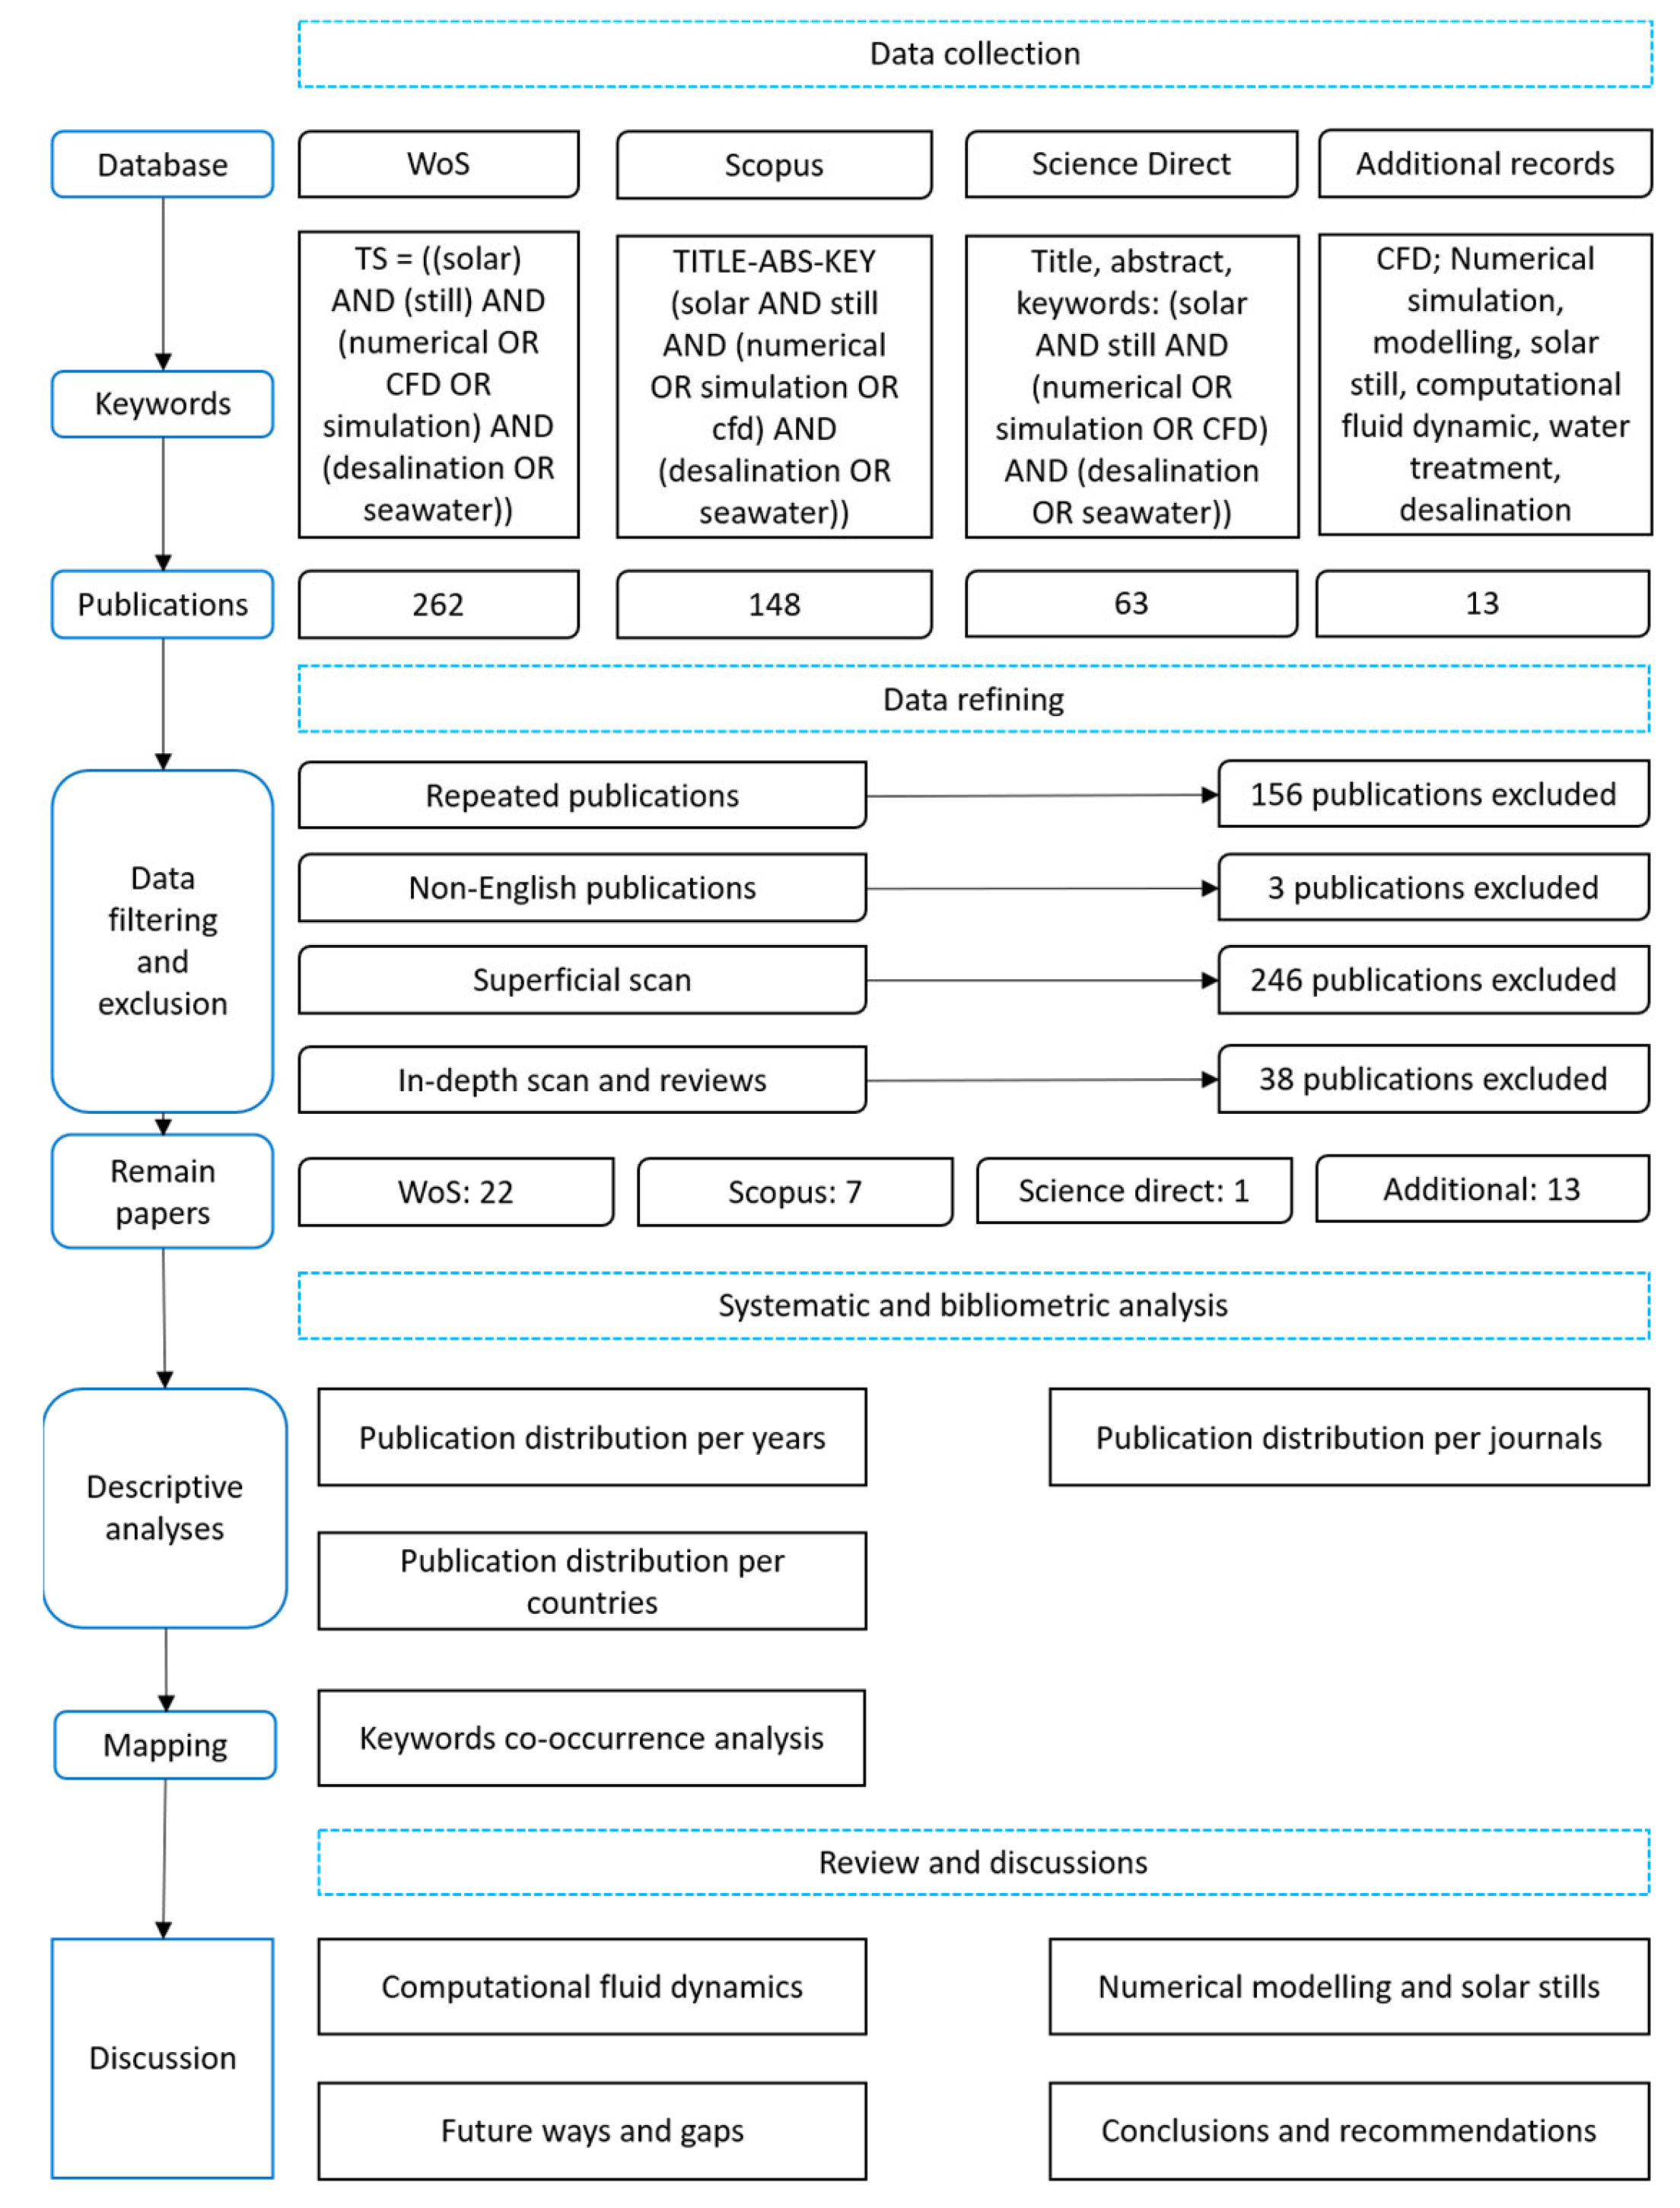
2.1. Data Collection
2.2. Data Refining
3. Data Analysis
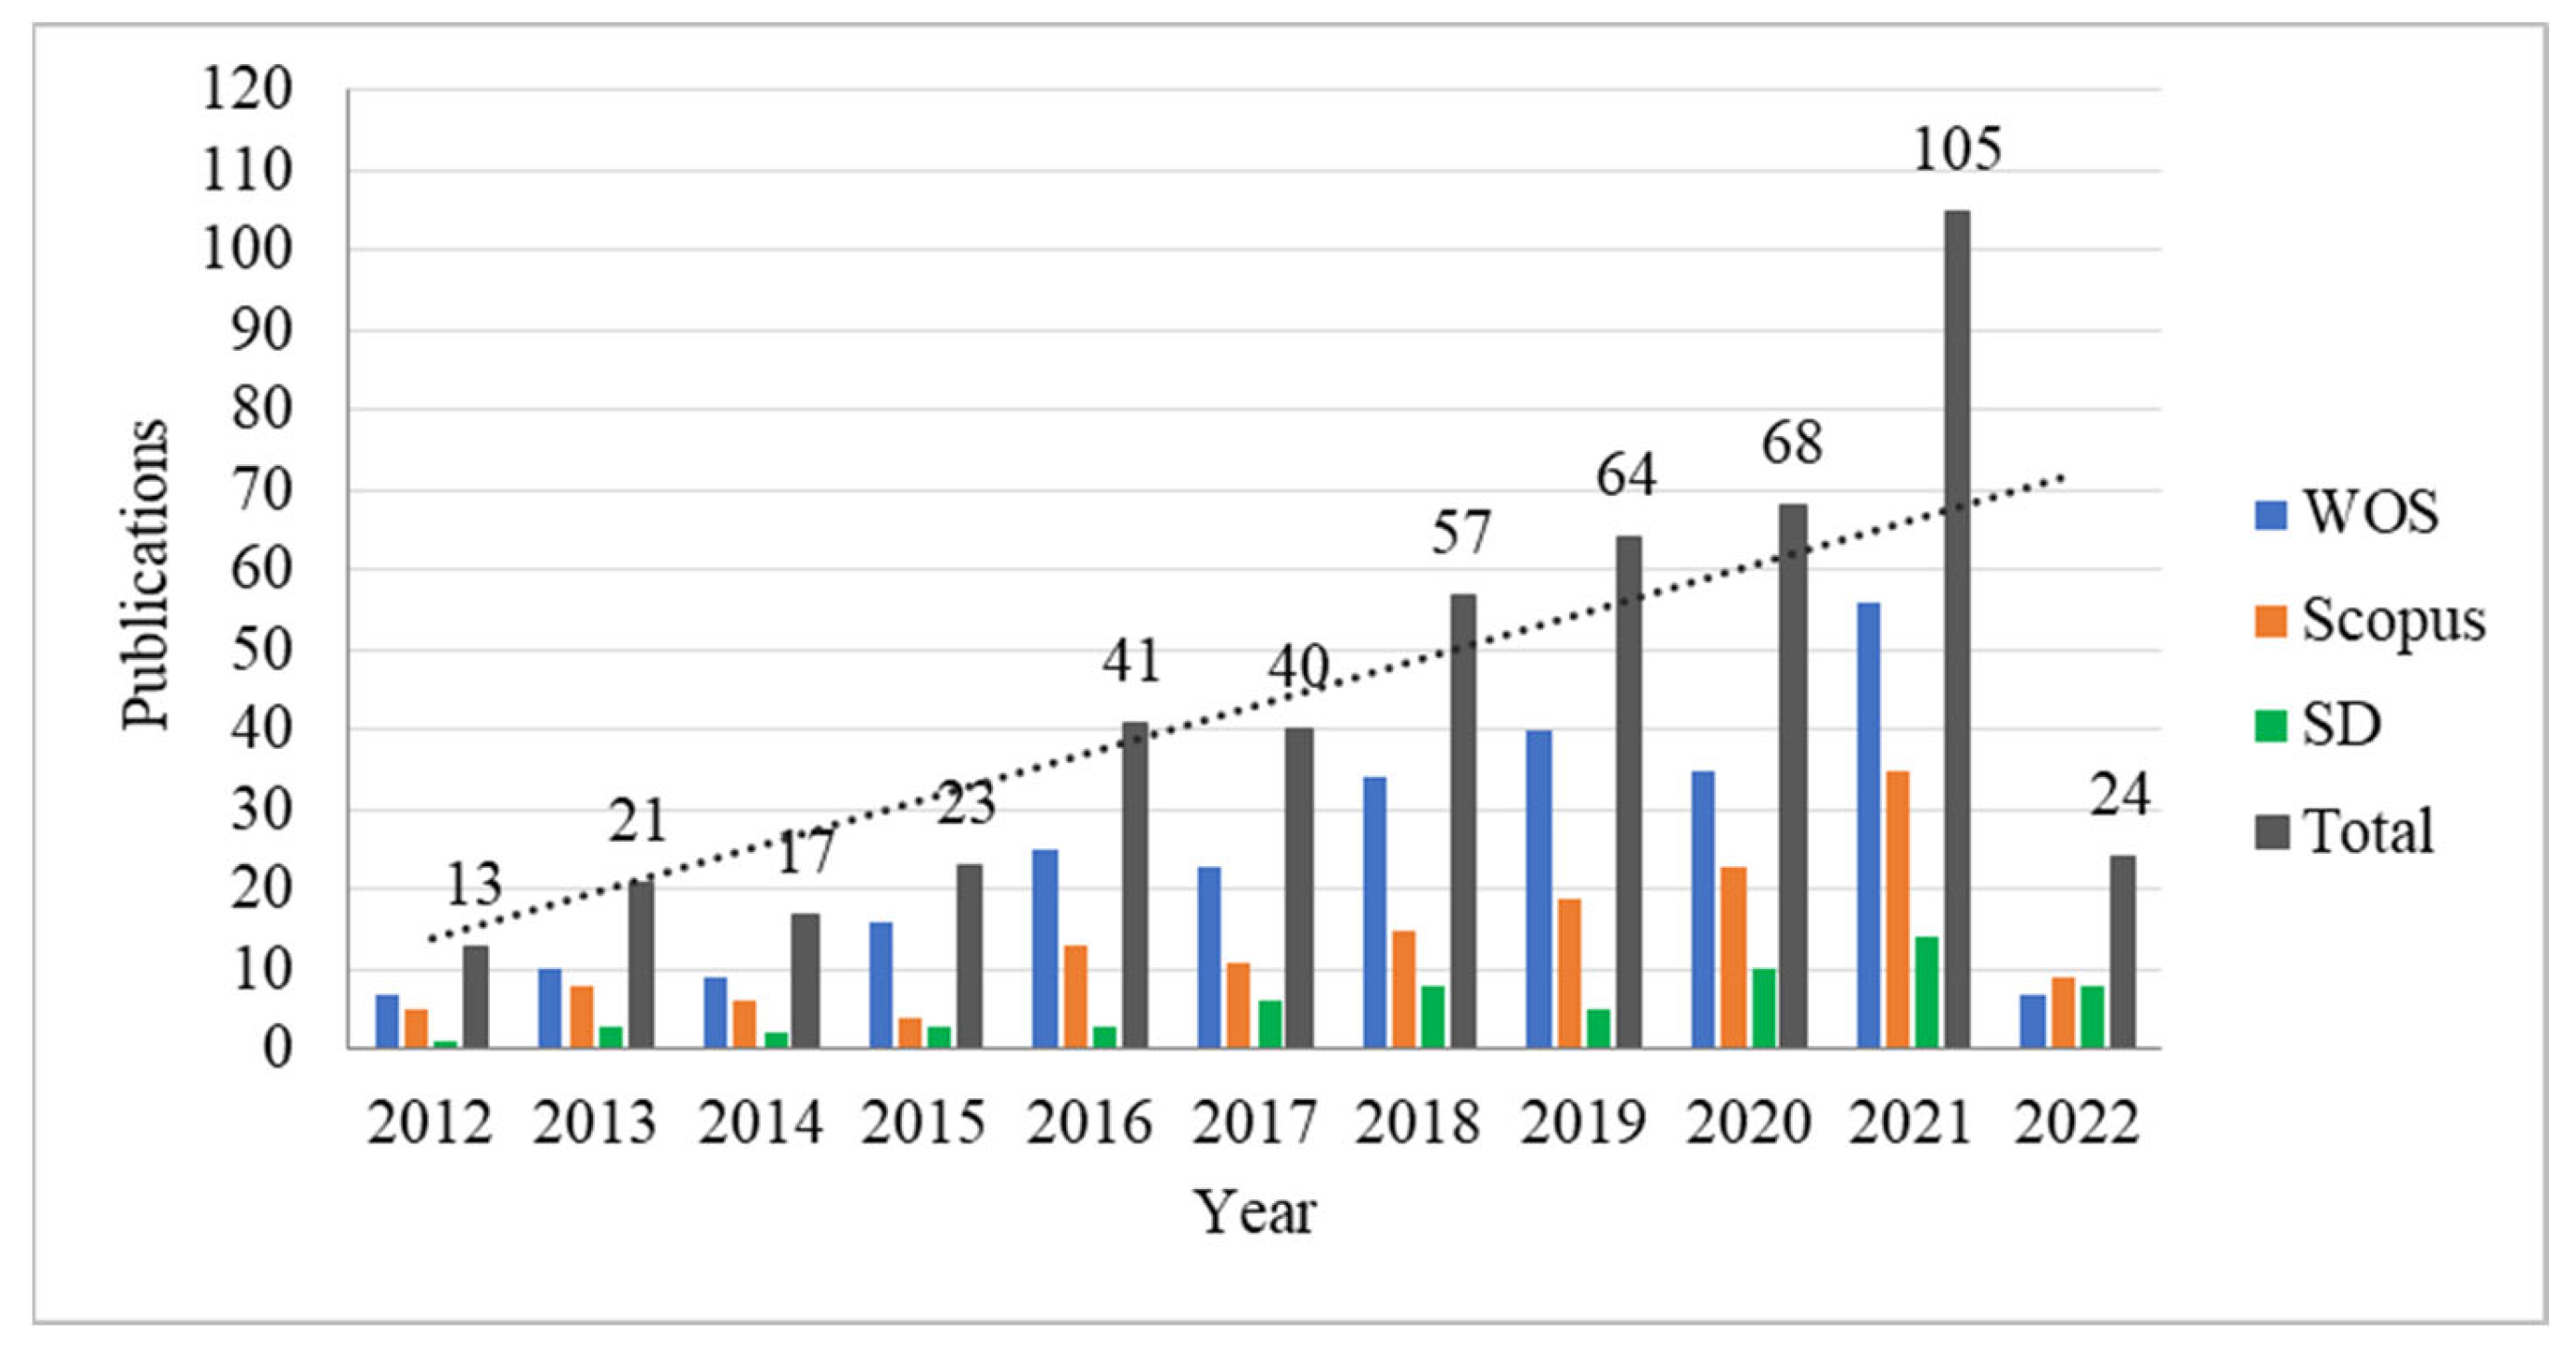
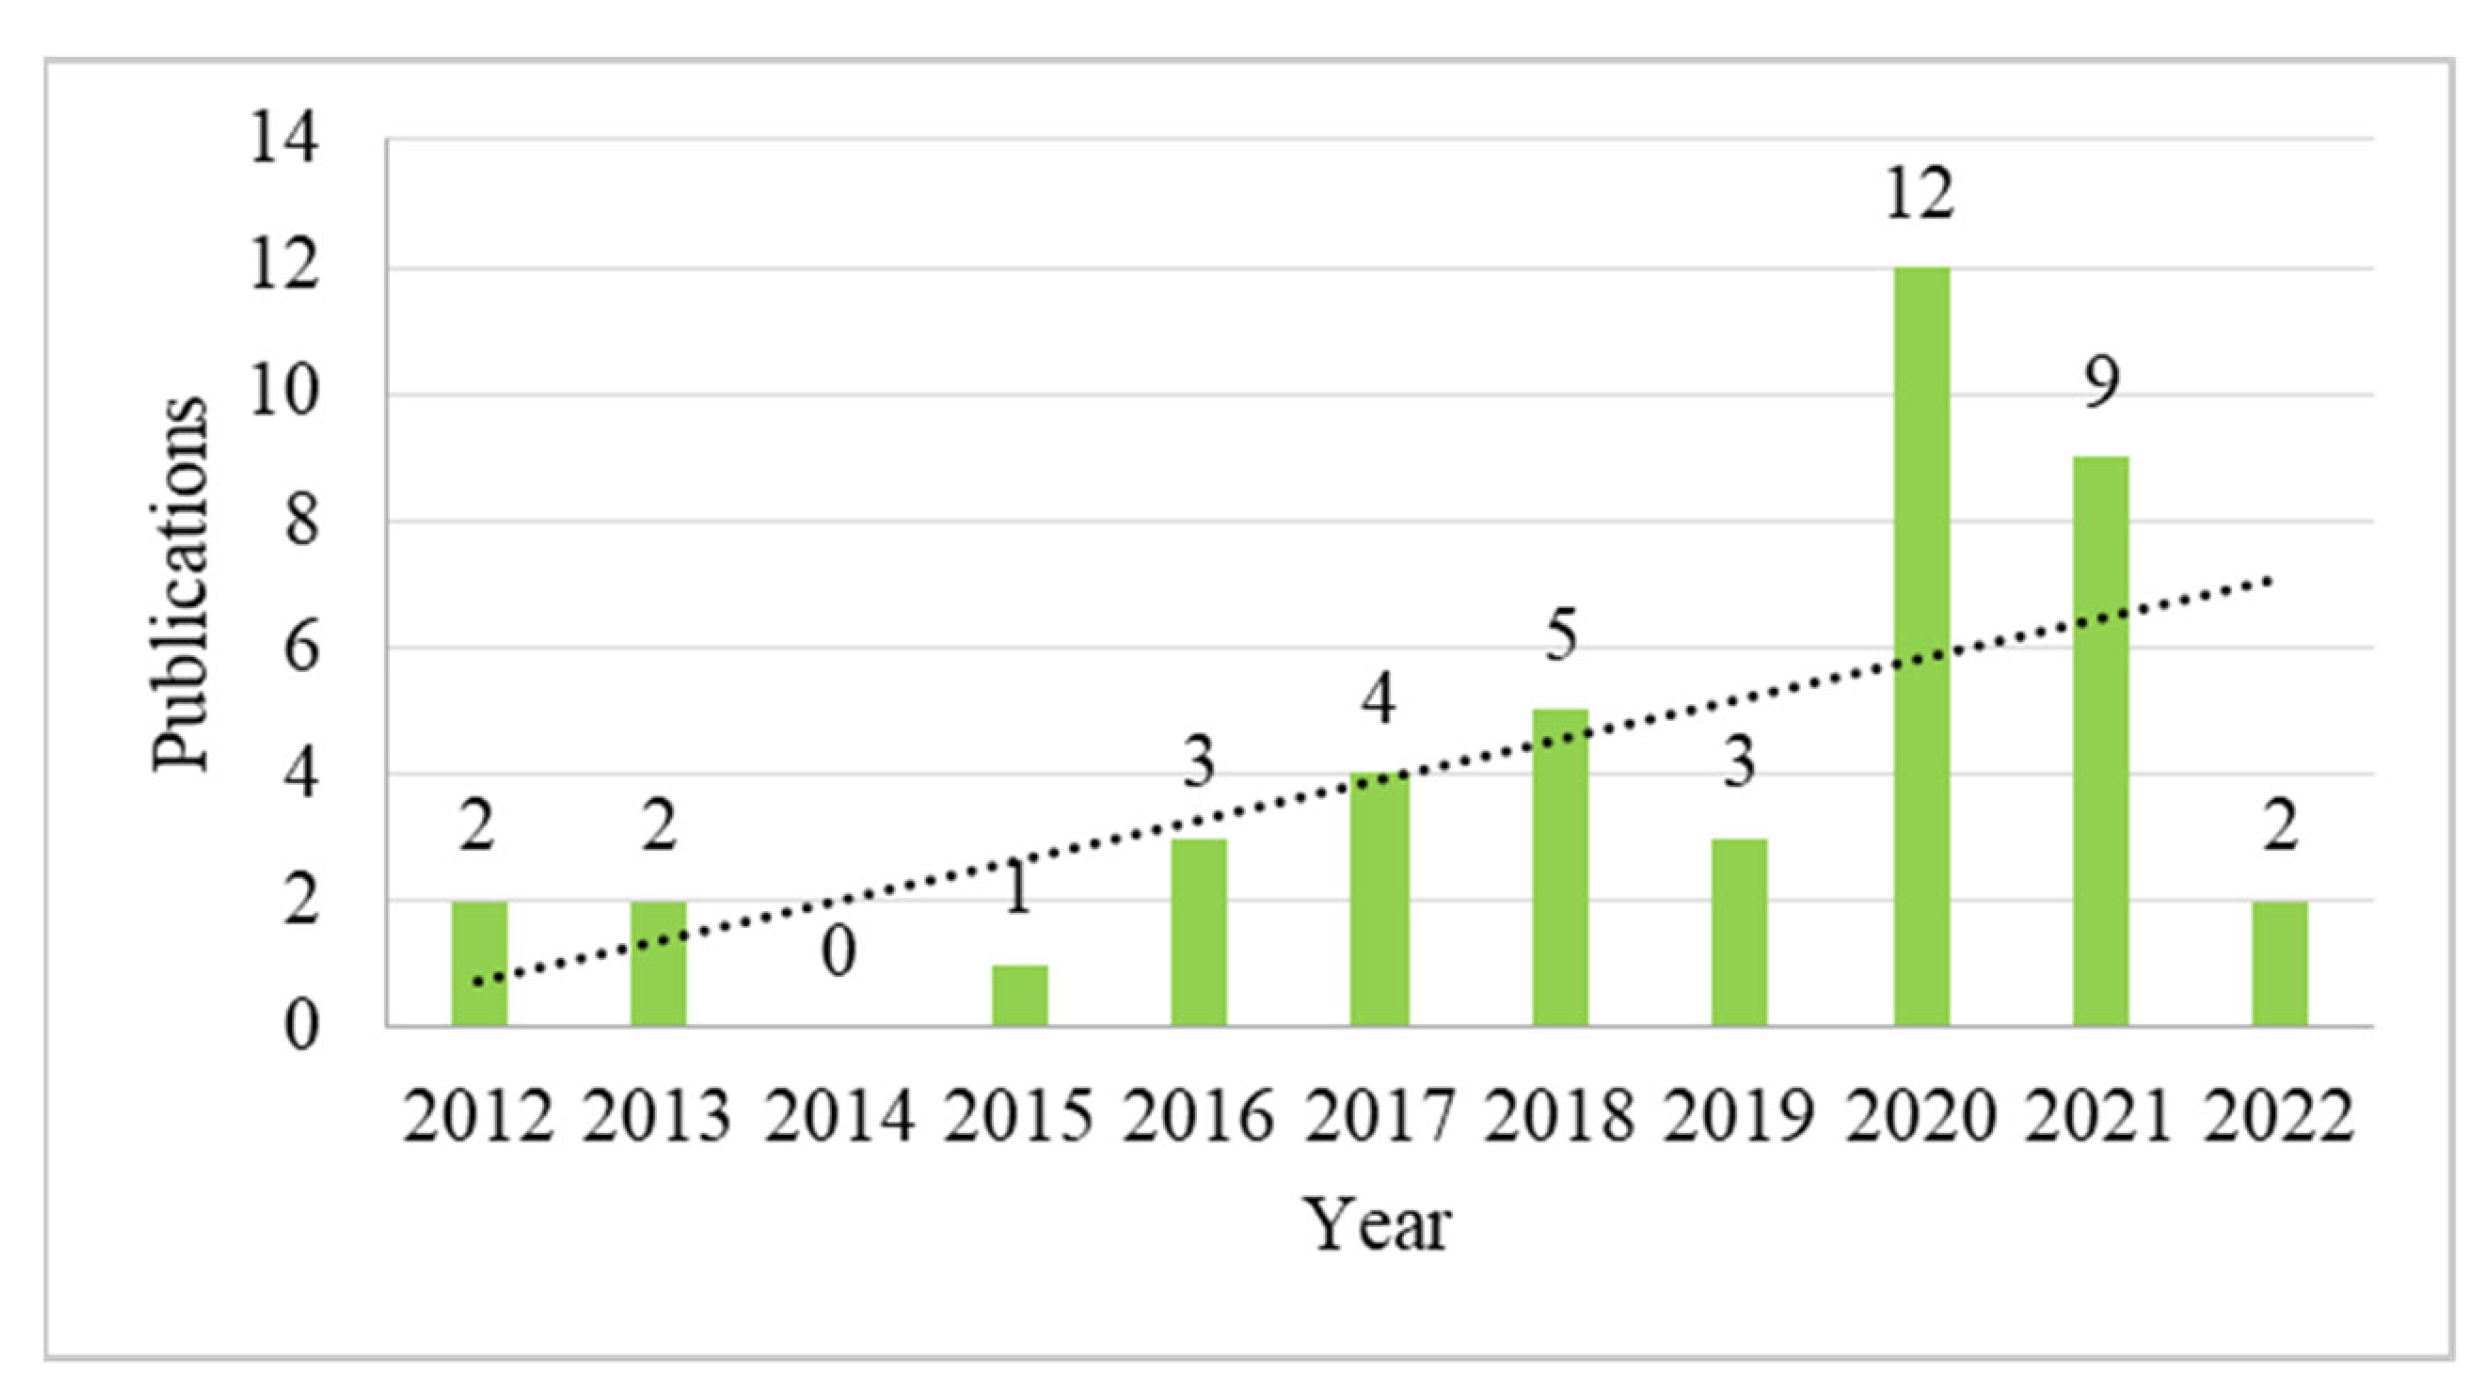
3.1. Yearly Publication Distribution
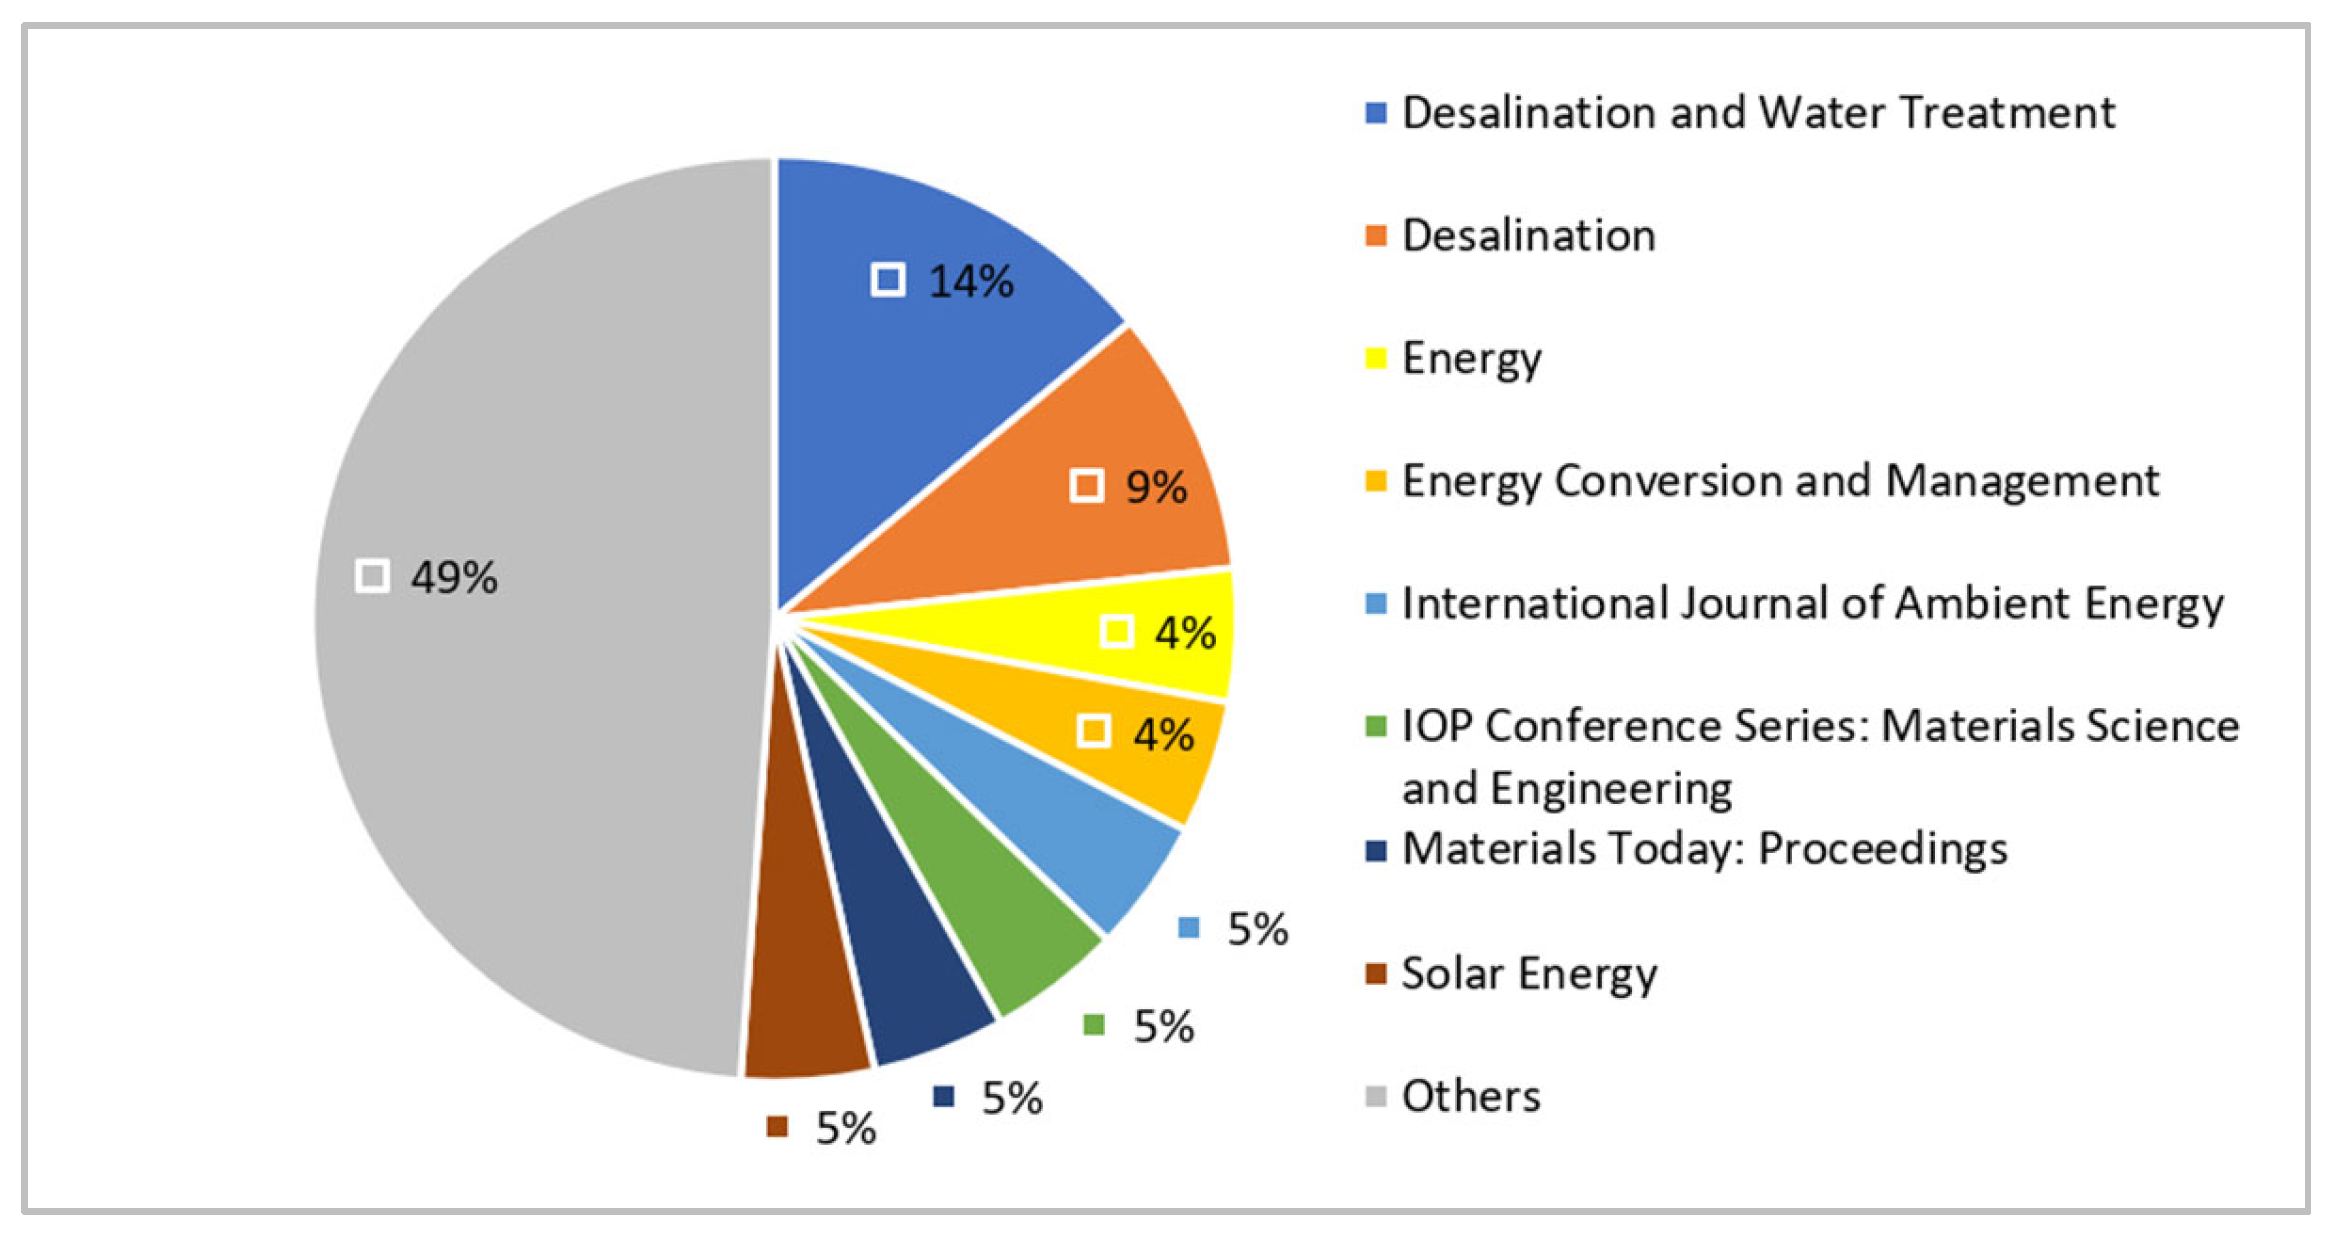
3.2. Publication Distribution per Journals
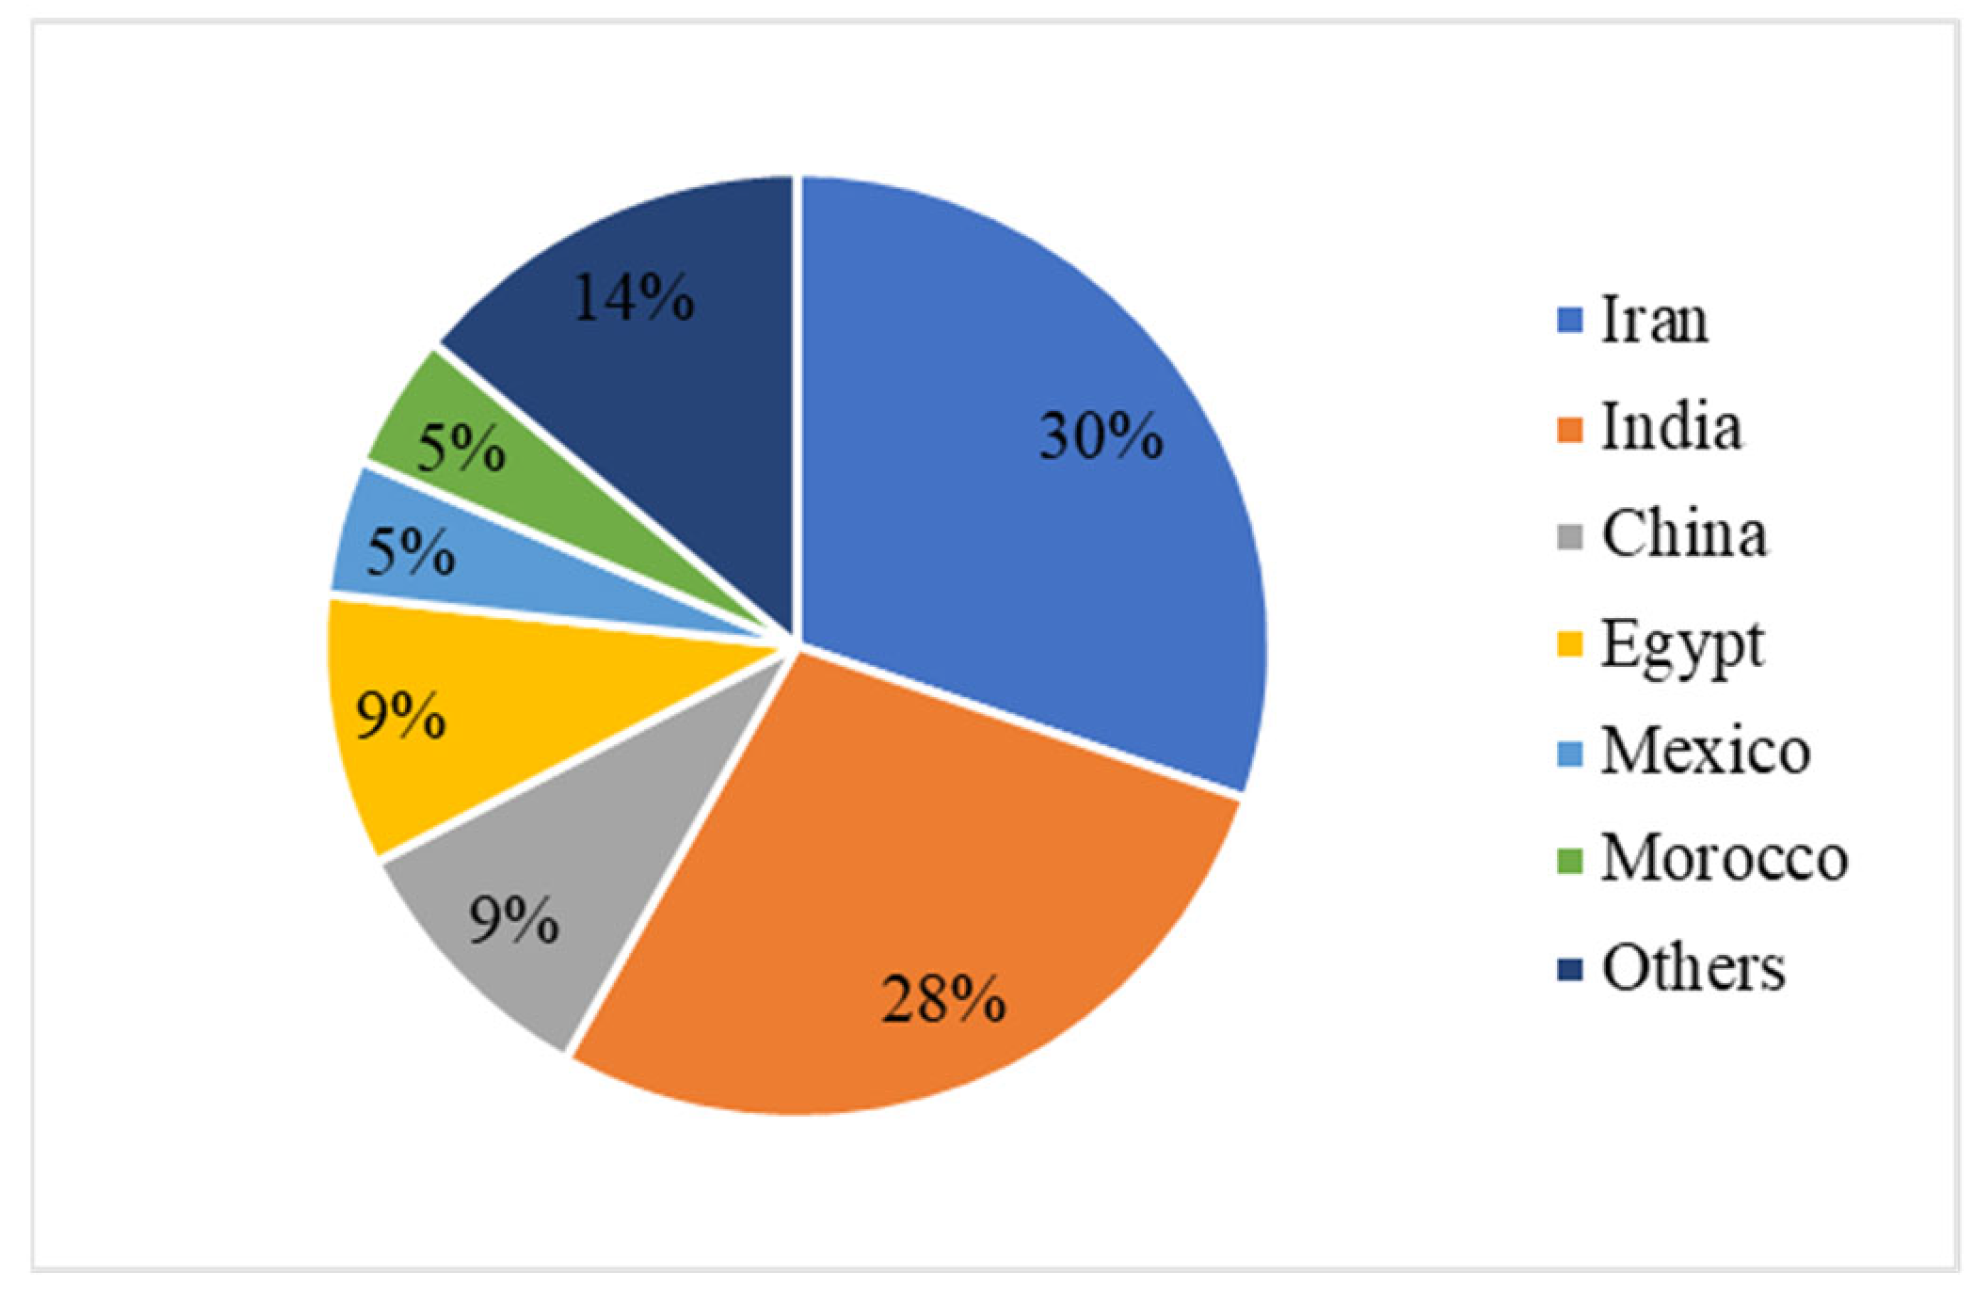
3.3. Publication Distribution by Locations
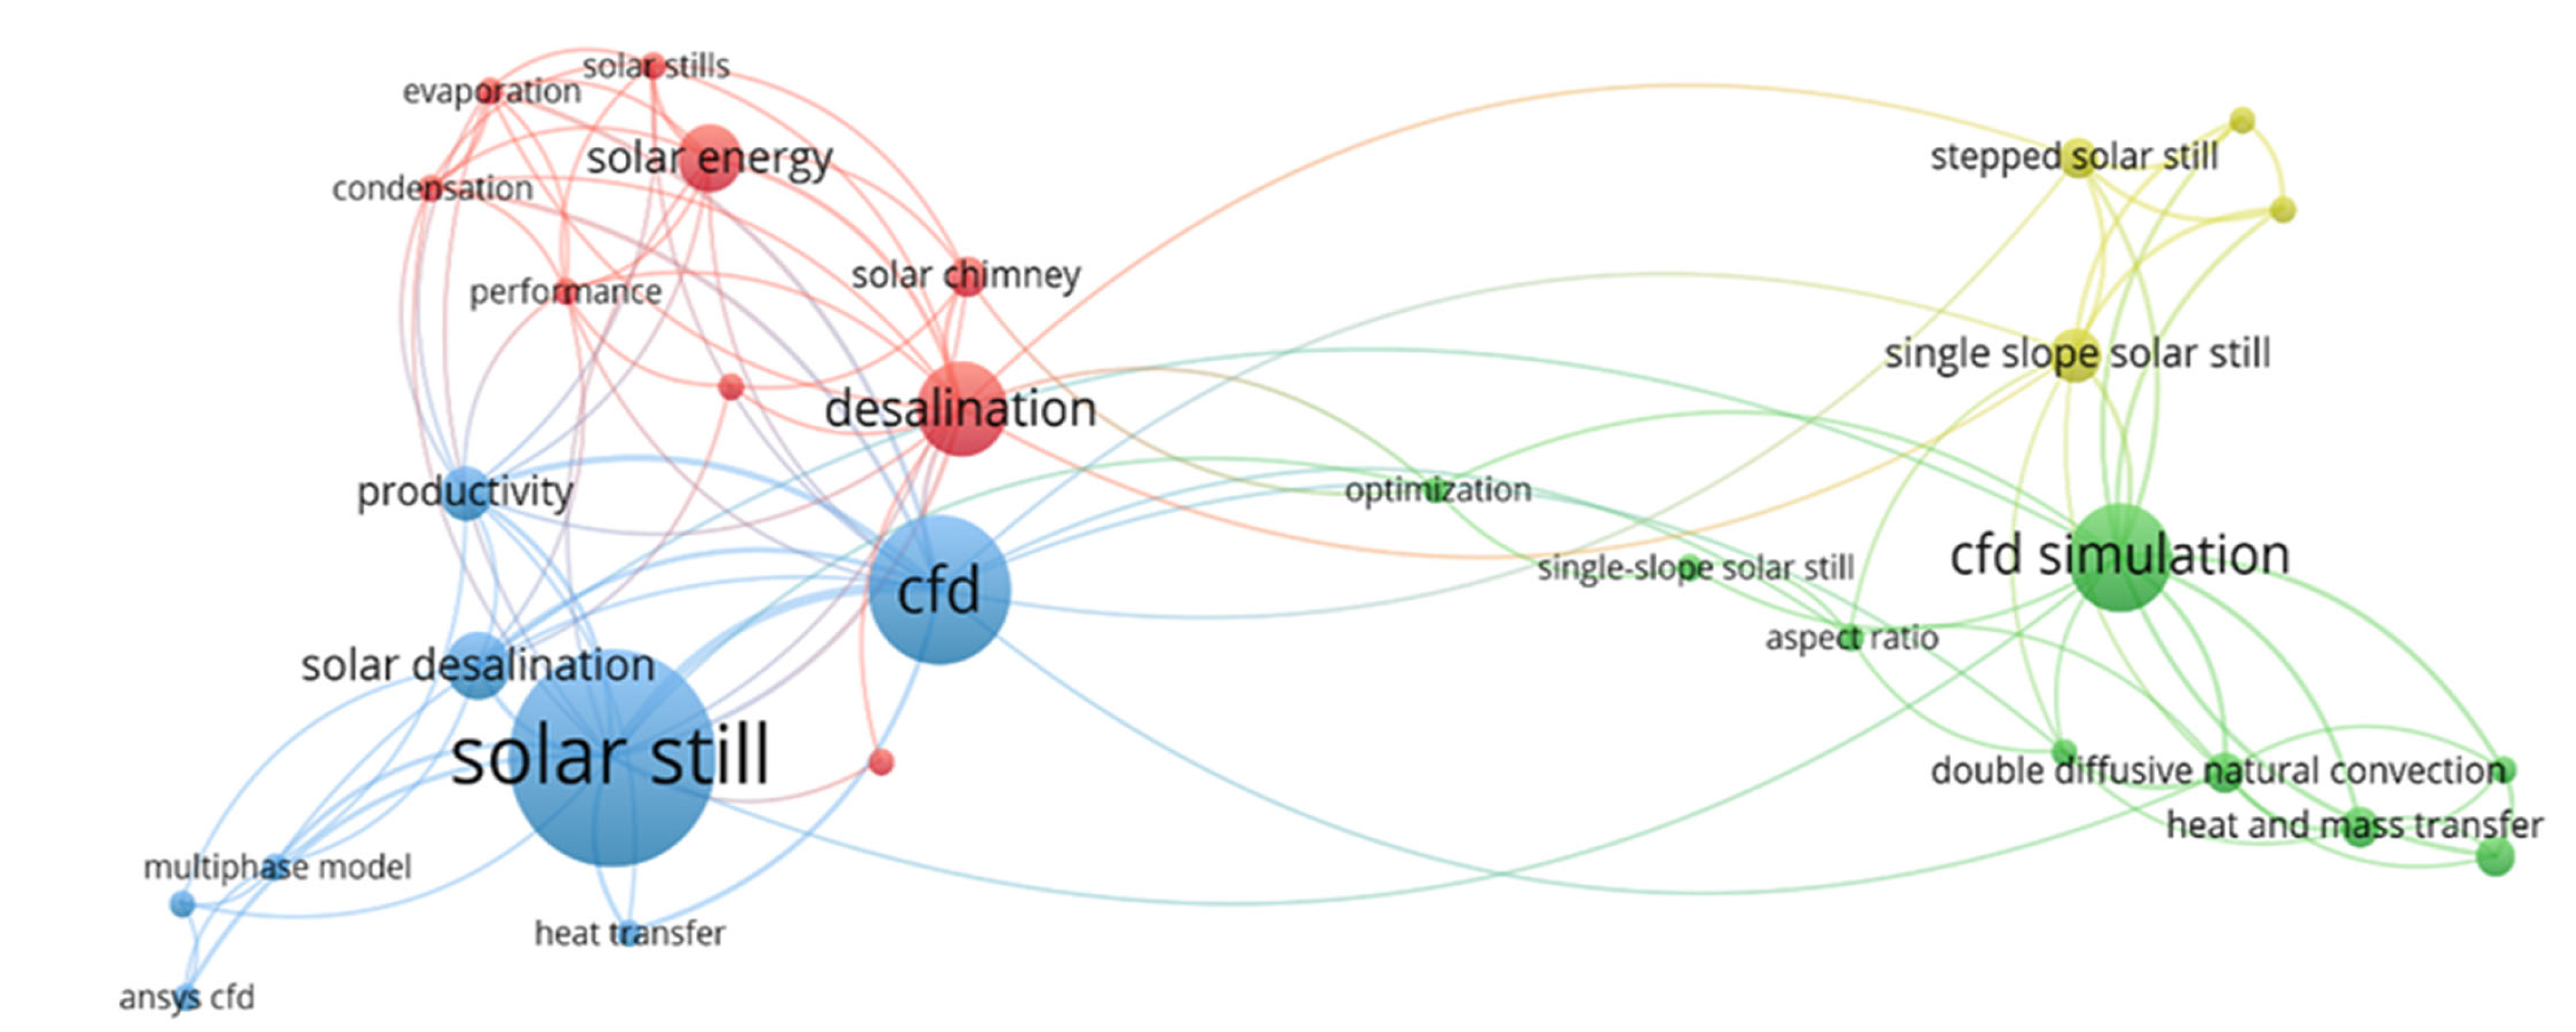
3.4. Keywords Bibliometric Mapping and Analyses
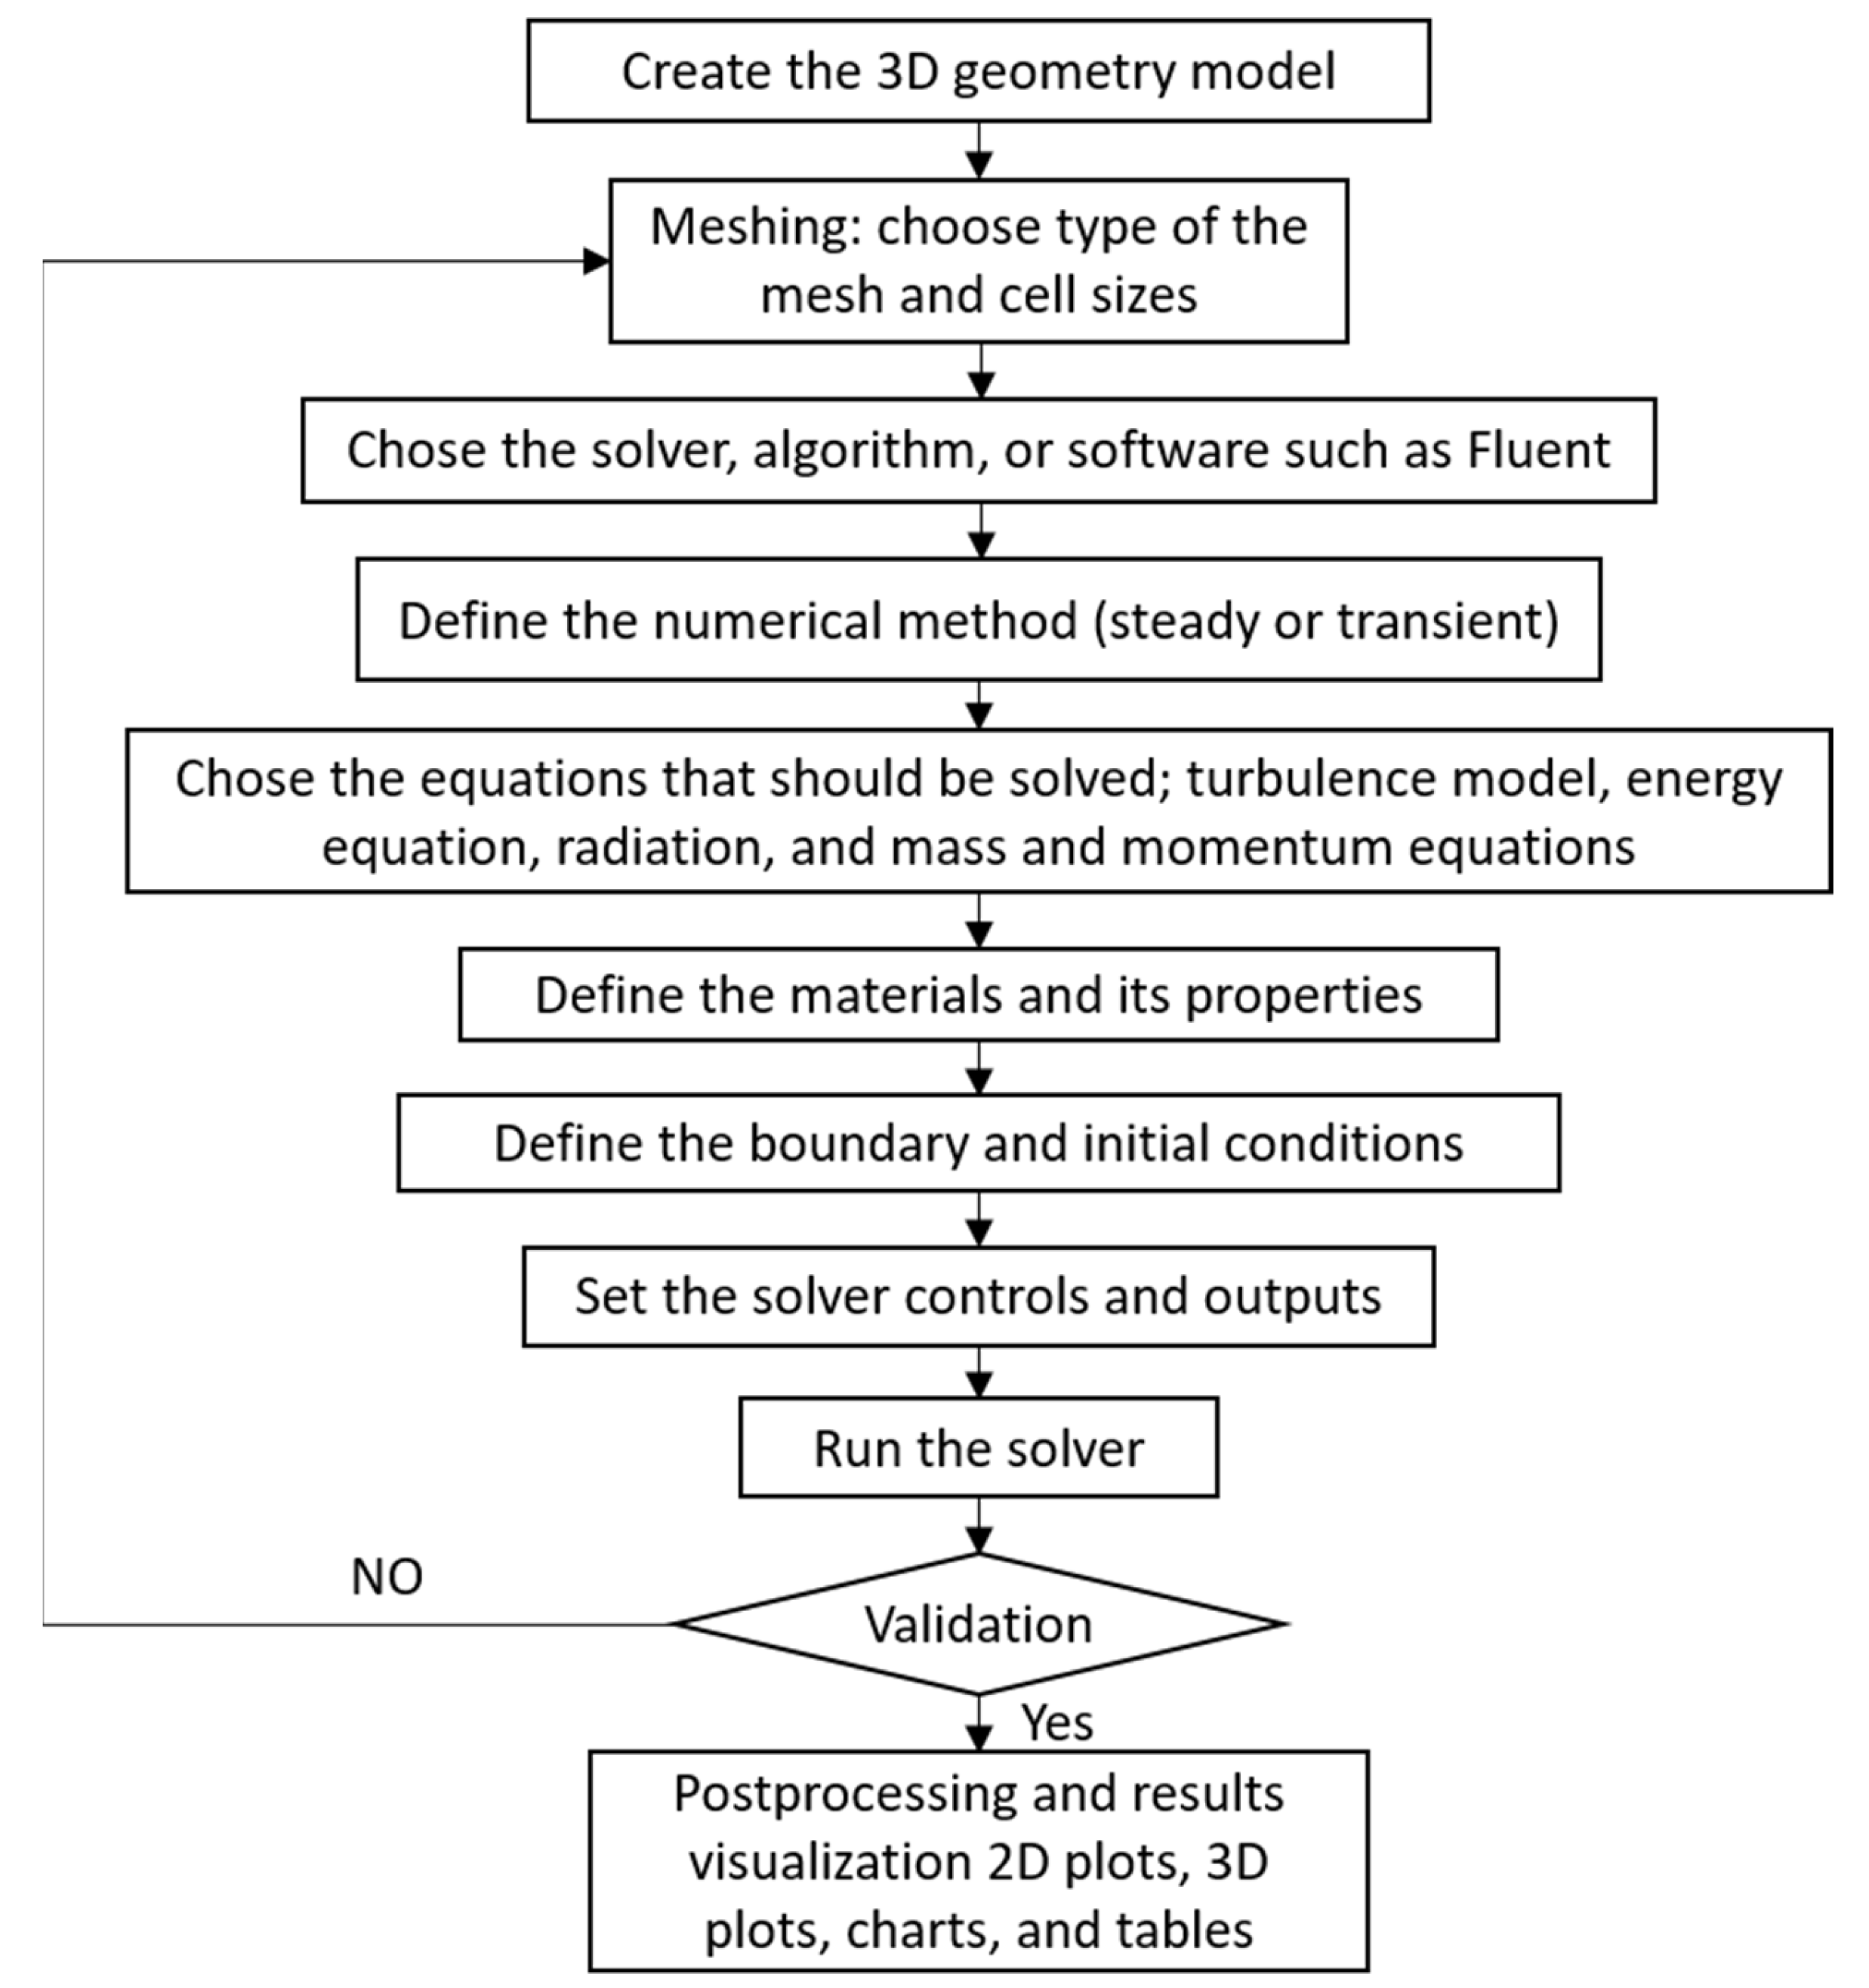
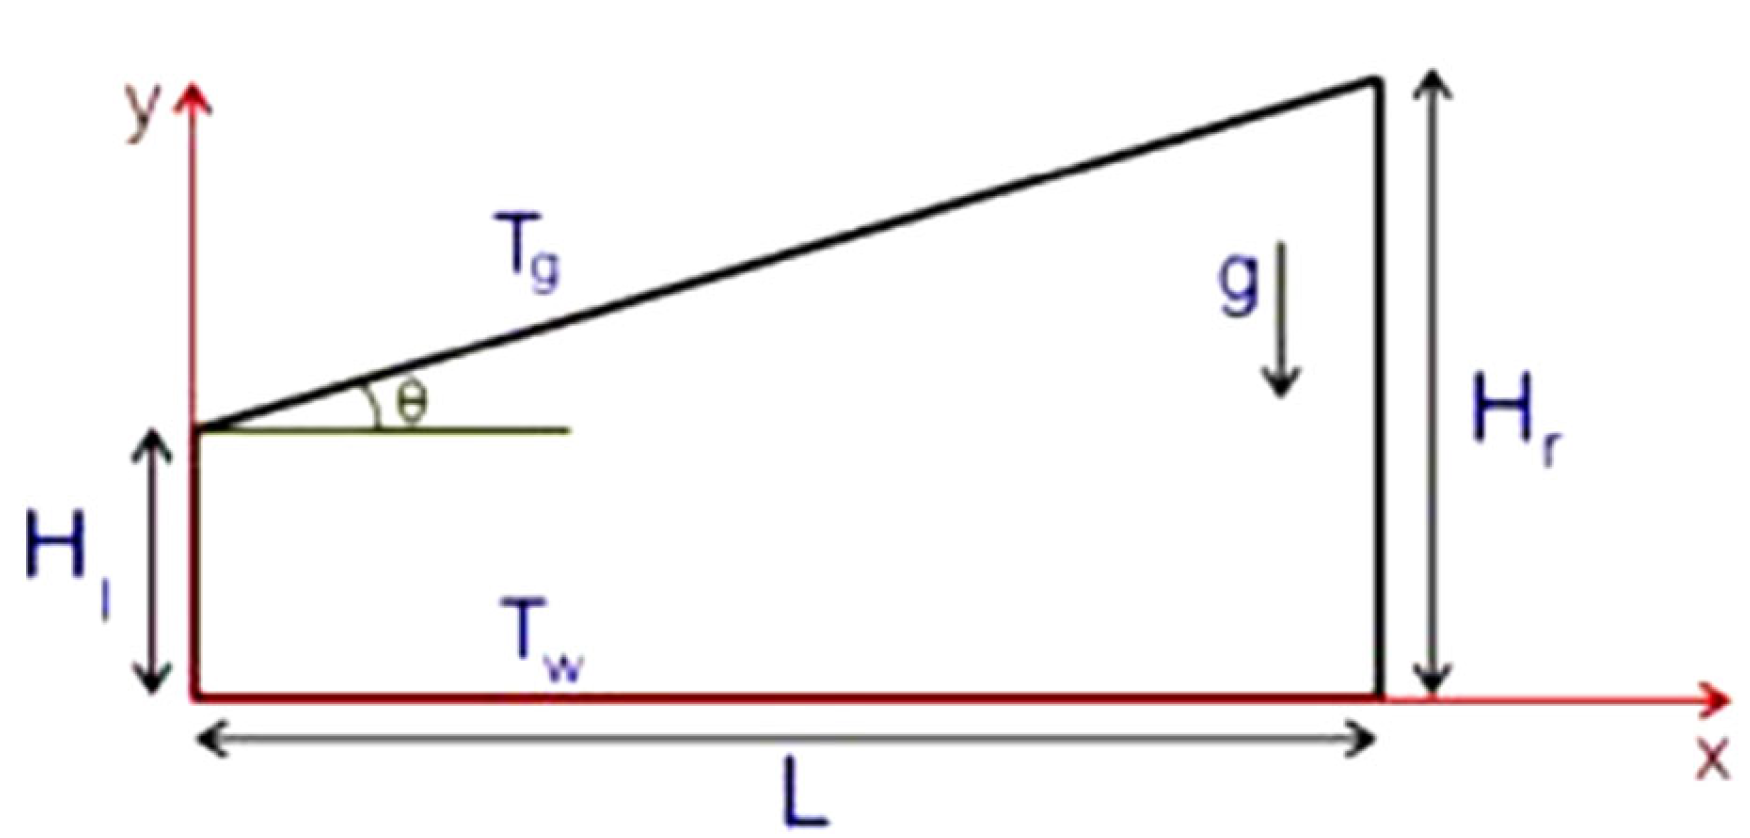
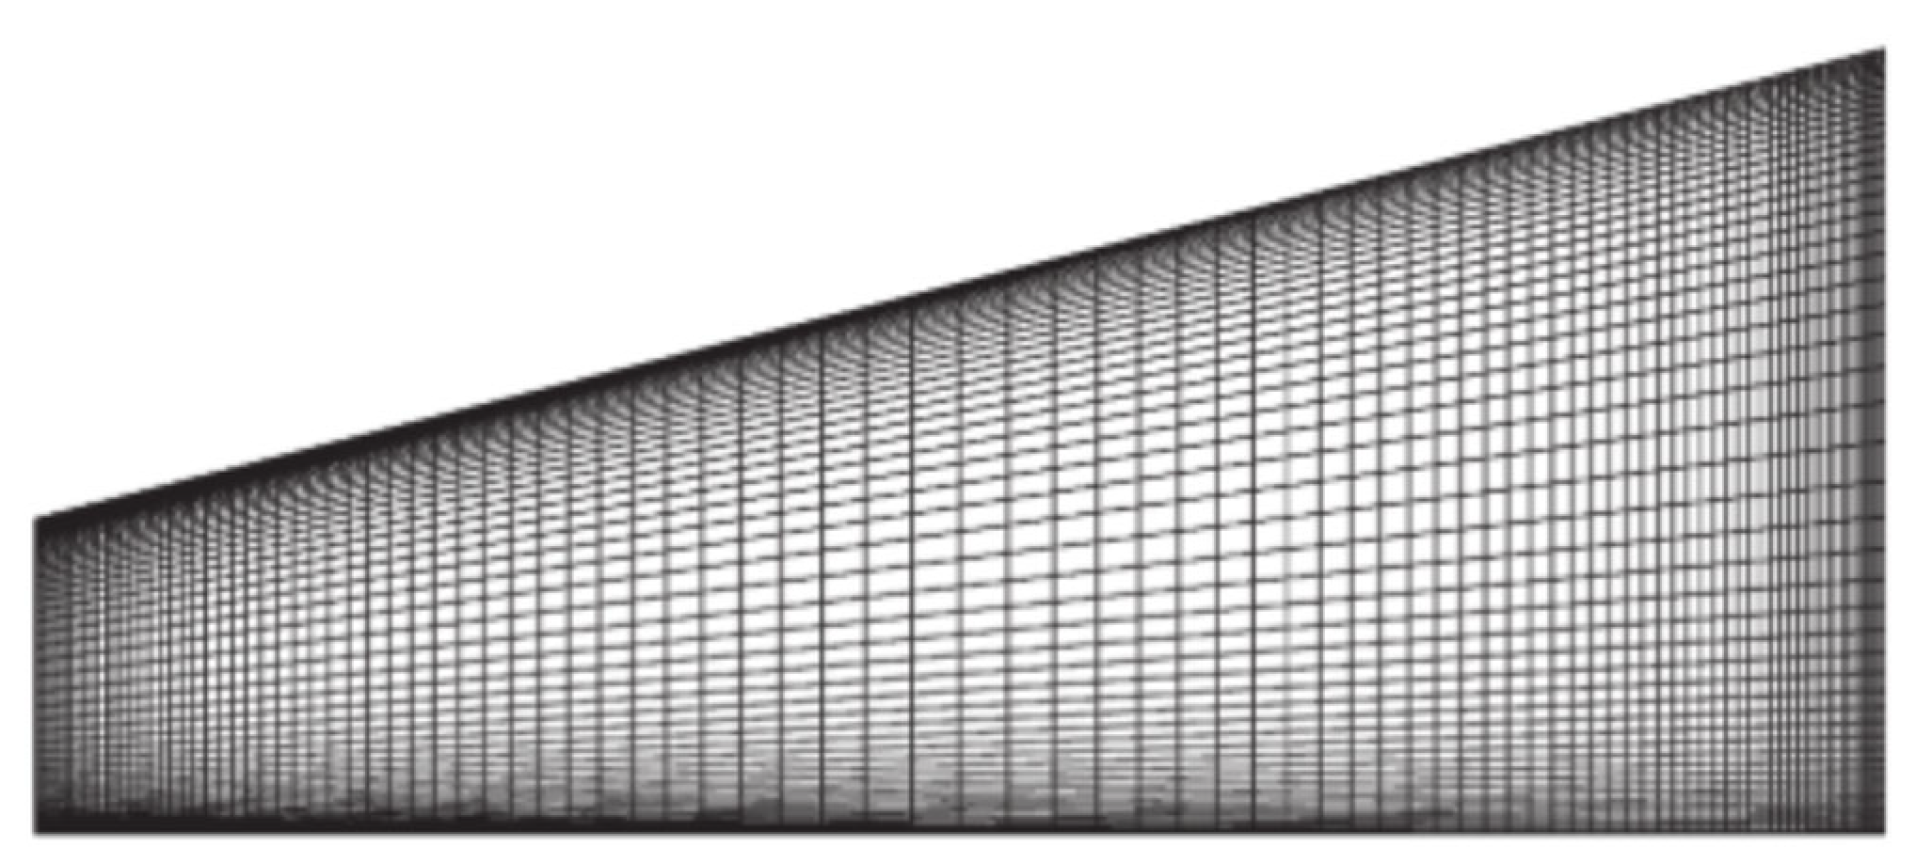
4. Computational Fluid Dynamics; Basics and Principles
5. Solar Stills and CFD
6. Future Ways and Research Gapes
- The impact of the most common parameters that affect solar still productivity can be investigated and studied using CFD such as cover material, its angle, and its thickness, raw water type (lake, seawater), basin material and its absorptivity, and isolation materials between the system and the surrounding environment.
- Active solar still that is integrated with a solar system or internal heater can be simulated and investigated using the CFD tool.
- Solar still geometry optimization can be conducted by employing the CFD tool.
- Complicated solar still systems such as solar still with separate condensers or those with external heater systems can be investigated by utilizing the CFD tool.
- The impact of phase change materials (PCM) on solar still systems efficiency can be evaluated by using CFD.
7. Conclusions
Author Contributions
Funding
Institutional Review Board Statement
Informed Consent Statement
Data Availability Statement
Acknowledgments
Conflicts of Interest
References
- Al-Qadami, E.H.H.; Abdurrasheed, A.S.; Mustaffa, Z.; Mugahed, A.Y.; Yusof, K.W.; Ahsan, A. Productivity Enhancement of a Double Slope Solar Still Coupled with a Solar System. J. Ecol. Eng. 2020, 21, 255–263. [Google Scholar] [CrossRef]
- Van Vliet, M.T.; Jones, E.R.; Flörke, M.; Franssen, W.H.; Hanasaki, N.; Wada, Y.; Yearsley, J.R. Global water scarcity including surface water quality and expansions of clean water technologies. Environ. Res. Lett. 2021, 16, 24020. [Google Scholar] [CrossRef]
- Al-Qadami, E.H.H.; Ahsan, A.; Abdurrasheed, A.S.I.; Mustaffa, Z.; Yusof, K.W.; Takaijudin, H.; Malek, M.A. Yield efficiency evaluation of double slope solar stills connected with external spiral copper for potable water production. J. Ecol. Eng. 2019, 20, 176–186. [Google Scholar] [CrossRef]
- Shamseddini, A. Reducing the Risk of Water Scarcity by Optimizing Water Allocation: A Review. International Con-ference on Disaster Management: From Polar Region to the Local Communities Social and Environmental Development National Institute of Development Administration (NIDA), India, 2016. Available online: http://ssed.nida.ac.th/images/PDF/inter_conf_2016/No.6.pdf (accessed on 29 July 2022).
- Kubiak-Wójcicka, K.; Machula, S. Influence of climate changes on the state of water resources in Poland and their usage. Geosciences 2020, 10, 312. [Google Scholar] [CrossRef]
- Iaccarino, M. Why there is water scarcity. AIMS Geosci. 2021, 7, 529–541. [Google Scholar] [CrossRef]
- Mehrazar, A.; Bavani, A.R.M.; Gohari, A.; Mashal, M.; Rahimikhoob, H. Adaptation of water resources system to water scarcity and climate change in the suburb area of megacities. Water Resour. Manag. 2020, 34, 3855–3877. [Google Scholar] [CrossRef]
- Wu, Z.; Zhang, Y.; Hua, Y.; Ye, Q.; Xu, L.; Wang, S. An Improved System Dynamics Model to Evaluate Regional Water Scarcity from a Virtual Water Perspective: A Case Study of Henan Province, China. Sustainability 2020, 12, 7517. [Google Scholar] [CrossRef]
- United Nations (UN). Revision of World Urbanization Prospects; UN: New York, NY, USA, 2018; Available online: https://population.un.org/wup (accessed on 14 August 2022).
- He, C.; Liu, Z.; Wu, J.; Pan, X.; Fang, Z.; Li, J.; Bryan, B.A. Future global urban water scarcity and potential solutions. Nat. Commun. 2021, 12, 4667. [Google Scholar] [CrossRef]
- Greve, P.; Kahil, T.; Mochizuki, J.; Schinko, T.; Satoh, Y.; Burek, P.; Fischer, G.; Tramberend, S.; Burtscher, R.; Langan, S.; et al. Global assessment of water challenges under uncertainty in water scarcity projections. Nat. Sustain. 2018, 1, 486–494. [Google Scholar] [CrossRef]
- Schewe, J.; Heinke, J.; Gerten, D.; Haddeland, I.; Arnell, N.W.; Clark, D.B.; Dankers, R.; Eisner, S.; Fekete, B.M.; Colón-González, F.J.; et al. Multimodel assessment of water scarcity under climate change. Proc. Natl. Acad. Sci. USA 2014, 111, 3245–3250. [Google Scholar] [CrossRef] [Green Version]
- El-Sebaey, M.S.; Ellman, A.; Hegazy, A.; Ghonim, T. Experimental analysis and CFD modeling for conventional basin-type solar still. Energies 2020, 13, 5734. [Google Scholar] [CrossRef]
- Catrini, P.; Cipollina, A.; Giacalone, F.; Micale, G.; Piacentino, A.; Tamburini, A. Thermodynamic, exergy, and thermoeconomic analysis of multiple effect distillation processes. In Renewable Energy Powered Desalination Handbook; Elsevier: Amsterdam, The Netherlands, 2018; pp. 445–489. [Google Scholar] [CrossRef]
- Tiwari, G.; Sahota, L. Review on the energy and economic efficiencies of passive and active solar distillation systems. Desalination 2017, 401, 151–179. [Google Scholar] [CrossRef]
- Wang, Y.-N.; Wang, R. Reverse osmosis membrane separation technology. In Membrane Separation Principles and Applications; Elsevier: Amsterdam, The Netherlands, 2019; pp. 1–45. [Google Scholar]
- Abimbola, T.O.; Yusof, K.W.; Takaijudin, H.; Abdurrasheed, A.S.; Al-Qadami, E.H.H.; Ishola, S.A.; Owoseni, T.A.; Akilu, S. A Concise Review of Major Desalination Techniques: Features and Limitations. In Proceedings of the International Conference on Civil, Offshore and Environmental Engineering, Kuching, Malaysia, 13–15 July 2021; pp. 154–162. [Google Scholar]
- Xu, Z.; Zhang, L.; Zhao, L.; Li, B.; Bhatia, B.; Wang, C.; Wilke, K.L.; Song, Y.; Labban, O.; Lienhard, J.H.; et al. Ultrahigh-efficiency desalination via a thermally-localized multistage solar still. Energy Environ. Sci. 2020, 13, 830–839. [Google Scholar] [CrossRef]
- Ayoub, G.M.; Malaeb, L. Developments in solar still desalination systems: A critical review. Crit. Rev. Environ. Sci. Technol. 2012, 42, 2078–2112. [Google Scholar] [CrossRef]
- Kabeel, A.E.; Harby, K.; Abdelgaied, M.; Eisa, A. A comprehensive review of tubular solar still designs, performance, and economic analysis. J. Clean. Prod. 2020, 246, 119030. [Google Scholar] [CrossRef]
- Ayoub, G.M.; Malaeb, L. Economic feasibility of a solar still desalination system with enhanced productivity. Desalination 2014, 335, 27–32. [Google Scholar] [CrossRef]
- Manchanda, H.; Kumar, M. A comprehensive decade review and analysis on designs and performance parameters of passive solar still. Renew. Wind. Water Sol. 2015, 2, 17. [Google Scholar] [CrossRef]
- Asadi, R.Z.; Suja, F.; Ruslan, M.H.; Jalil, N.A. The application of a solar still in domestic and industrial wastewater treatment. Sol. Energy 2013, 93, 63–71. [Google Scholar] [CrossRef]
- Sathyamurthy, R.; El-Agouz, S.; Dharmaraj, V. Experimental analysis of a portable solar still with evaporation and condensation chambers. Desalination 2015, 367, 180–185. [Google Scholar] [CrossRef]
- Kwatra, H.S. Performance of a solar still: Predicted effect of enhanced evaporation area on yield and evaporation temperature. Sol. Energy 1996, 56, 261–266. [Google Scholar] [CrossRef]
- Kumar, K.V.; Bai, R.K. Performance study on solar still with enhanced condensation. Desalination 2008, 230, 51–61. [Google Scholar] [CrossRef]
- Kalogirou, S. Seawater desalination using renewable energy sources. Prog. Energy Combust. Sci. 2005, 31, 242–281. [Google Scholar] [CrossRef]
- Mevada, D.; Panchal, H.; Sadasivuni, K.K.; Israr, M.; Suresh, M.; Dharaskar, S.; Thakkar, H. Effect of fin configuration parameters on performance of solar still: A review. Groundw. Sustain. Dev. 2020, 10, 100289. [Google Scholar] [CrossRef]
- Sharshir, S.W.; Elsheikh, A.H.; Ellakany, Y.M.; Kandeal, A.W.; Edreis, E.M.A.; Sathyamurthy, R.; Thakur, A.K.; Eltawil, M.A.; Hamed, M.H.; Kabeel, A.E. Improving the performance of solar still using different heat localization materials. Environ. Sci. Pollut. Res. 2020, 27, 12332–12344. [Google Scholar] [CrossRef]
- Ayoub, G.M.; Malaeb, L.; Saikaly, P.E. Critical variables in the performance of a productivity-enhanced solar still. Sol. Energy 2013, 98, 472–484. [Google Scholar] [CrossRef]
- Kumar, P.V.; Kumar, A.; Prakash, O.; Kaviti, A.K. Solar stills system design: A review. Renew. Sustain. Energy Rev. 2015, 51, 153–181. [Google Scholar] [CrossRef]
- Manokar, A.M.; Winston, D.P.; Kabeel, A.; El-Agouz, S.; Sathyamurthy, R.; Arunkumar, T.; Madhu, B.; Ahsan, A. Integrated PV/T solar still- A mini-review. Desalination 2018, 435, 259–267. [Google Scholar] [CrossRef]
- Abimbola, T.O.; Takaijudin, H.; Singh, B.S.M.; Yusof, K.W.; Abdurrasheed, A.S.; Al-Qadami, E.H.H.; Isah, A.S.; Wong, K.X.; Nadzri, N.F.A.; Ishola, S.A.; et al. Comprehensive passive-mode performance analysis on a new multiple-mode solar still for sustainable clean water processing. J. Clean. Prod. 2021, 334, 130214. [Google Scholar] [CrossRef]
- Sharshir, S.; Kandeal, A.; Ismail, M.; Abdelaziz, G.; Kabeel, A.; Yang, N. Augmentation of a pyramid solar still performance using evacuated tubes and nanofluid: Experimental approach. Appl. Therm. Eng. 2019, 160, 113997. [Google Scholar] [CrossRef]
- Kabeel, A.; El-Said, E.M.; Abdulaziz, M. Computational fluid dynamic as a tool for solar still performance analysis and design development: A review. Desalination Water Treat. 2019, 159, 200–213. [Google Scholar] [CrossRef]
- Briner, R.B.; Denyer, D. Systematic review and evidence synthesis as a practice and scholarship tool. In Oxford Handbook of Evidence-Based Management; Oxford University Press: Oxford, UK, 2012; pp. 112–129. [Google Scholar]
- De Oliveira, O.J.; Da Silva, F.F.; Juliani, F.; Barbosa, L.C.F.M.; Nunhes, T.V. Bibliometric method for mapping the state-of-the-art and identifying research gaps and trends in literature: An essential instrument to support the development of scientific projects. In Scientometrics Recent Advances; IntechOpen: London, UK, 2019. [Google Scholar]
- Al-Qadami, E.H.H.; Mustaffa, Z.; Al-Atroush, M.E. Evaluation of the Pavement Geothermal Energy Harvesting Technologies towards Sustainability and Renewable Energy. Energies 2022, 15, 1201. [Google Scholar] [CrossRef]
- Alaloul, W.S.; Qureshi, A.H.; Musarat, M.A.; Saad, S. Evolution of close-range detection and data acquisition technologies towards automation in construction progress monitoring. J. Build. Eng. 2021, 43, 102877. [Google Scholar] [CrossRef]
- Baarimah, A.O.; Alaloul, W.S.; Liew, M.S.; Kartika, W.; Al-Sharafi, M.A.; Musarat, M.A.; Alawag, A.M.; Qureshi, A.H. A Bibliometric analysis and review of building information modelling for post-disaster reconstruction. Sustainability 2021, 14, 393. [Google Scholar] [CrossRef]
- Johnson, R.B.; Onwuegbuzie, A.J. Mixed methods research: A research paradigm whose time has come. Educ. Res. 2004, 33, 14–26. [Google Scholar] [CrossRef]
- Su, H.-N.; Lee, P.-C. Mapping knowledge structure by keyword co-occurrence: A first look at journal papers in Technology Foresight. Scientometrics 2010, 85, 65–79. [Google Scholar] [CrossRef]
- He, Q.; Wang, G.; Luo, L.; Shi, Q.; Xie, J.; Meng, X. Mapping the managerial areas of Building Information Modeling (BIM) using scientometric analysis. Int. J. Proj. Manag. 2017, 35, 670–685. [Google Scholar] [CrossRef]
- Van Eck, N.J.; Waltman, L. Visualizing bibliometric networks. In Measuring Scholarly Impact; Springer: Cham, Switzerland, 2014; pp. 285–320. [Google Scholar]
- Van Eck, N.J.; Waltman, L. Software survey: VOSviewer, a computer program for bibliometric mapping. Scientometrics 2009, 84, 523–538. [Google Scholar] [CrossRef]
- Rahbar, N.; Esfahani, J. Productivity estimation of a single-slope solar still: Theoretical and numerical analysis. Energy 2013, 49, 289–297. [Google Scholar] [CrossRef]
- Abdurrasheed, A.S.; Yusof, K.W.; Takaijudin, H.; Al-Qadami, E.H.H.; A Ghani, A.; Muhammad, M.M.; Sholagberu, A.T.; Kumar, V.; Patel, S.M. An integrated technique for assessing flow parameters through subsurface drainage module systems. IOP Conf. Ser. Earth Environ. Sci. 2020, 476, 12112. [Google Scholar] [CrossRef]
- Sa’id Abdurrasheed, A.; Wan Yusof, K.; Hamid Hussein Alqadami, E.; Takaijudin, H.; Ab Ghani, A.; Muhammad, M.M.; Sholagberu, A.T.; Zainalfikry, M.K.; Osman, M.; Shihab Patel, M. Modelling of flow parameters through subsurface drainage modules for application in BIOECODS. Water 2019, 11, 1823. [Google Scholar] [CrossRef]
- Al-Qadami, E.H.H.; Mustaffa, Z.; Abdurrasheed, A.S.; Khamaruzaman, W.Y.; Shah, S.M.H.; Malek, M. Numerical assessment on floating stability limits for static vehicle under partial submergence. J. Eng. Sci. Technol. 2020, 15, 1384–1398. [Google Scholar]
- Al-Qadami, E.H.H.; Abdurrasheed, A.S.; Mustaffa, Z.; Yusof, K.W.; Malek, M.; Ab Ghani, A. Numerical modelling of flow characteristics over sharp crested triangular hump. Results Eng. 2019, 4, 100052. [Google Scholar] [CrossRef]
- Al-Qadami, E.H.H.; Mustaffa, Z.; Martínez-Gomariz, E.; Yusof, K.W.; Abdurrasheed, A.S.; Shah, S.M.H. Numerical Simulation to Assess Floating Instability of Small Passenger Vehicle Under Sub-Critical Flow. In Proceedings of the International Conference on Civil, Offshore and Environmental Engineering, Kuching, Malaysia, 13–15 July 2021; pp. 258–265. [Google Scholar]
- Rahbar, N.; Esfahani, J.A. Estimation of convective heat transfer coefficient in a single-slope solar still: A numerical study. Desalination Water Treat. 2012, 50, 387–396. [Google Scholar] [CrossRef]
- Alvarado-Juárez, R.; Álvarez, G.; Xamán, J.; Hernández-López, I. Numerical study of conjugate heat and mass transfer in a solar still device. Desalination 2013, 325, 84–94. [Google Scholar] [CrossRef]
- Rahbar, N.; Esfahani, J.A.; Fotouhi-Bafghi, E. Estimation of convective heat transfer coefficient and water-productivity in a tubular solar still–CFD simulation and theoretical analysis. Sol. Energy 2015, 113, 313–323. [Google Scholar] [CrossRef]
- Rashidi, S.; Bovand, M.; Esfahani, J.A. Optimization of partitioning inside a single slope solar still for performance improvement. Desalination 2016, 395, 79–91. [Google Scholar] [CrossRef]
- Malaiyappan, P.; Elumalai, N. Numerical investigations: Basin materials of a single-basin and single-slope solar still. Desalination Water Treat. 2015, 57, 21211–21233. [Google Scholar] [CrossRef]
- Taamneh, Y. Influence of Jordanian zeolite on the performance of a solar still: Experiments and CFD simulation studies. Water Supply 2016, 16, 1700–1709. [Google Scholar] [CrossRef]
- Bait, O.; Si–Ameur, M. Numerical investigation of a multi-stage solar still under Batna climatic conditions: Effect of radiation term on mass and heat energy balances. Energy 2016, 98, 308–323. [Google Scholar] [CrossRef]
- Rashidi, S.; Bovand, M.; Rahbar, N.; Esfahani, J.A. Steps optimization and productivity enhancement in a nanofluid cascade solar still. Renew. Energy 2018, 118, 536–545. [Google Scholar] [CrossRef]
- Panchal, H.N.; Patel, N. ANSYS CFD and experimental comparison of various parameters of a solar still. Int. J. Ambient Energy 2017, 39, 551–557. [Google Scholar] [CrossRef]
- Arunkumar, T.; Kabeel, A.; Raj, K.; Denkenberger, D.; Sathyamurthy, R.; Ragupathy, P.; Velraj, R. Productivity enhancement of solar still by using porous absorber with bubble-wrap insulation. J. Clean. Prod. 2018, 195, 1149–1161. [Google Scholar] [CrossRef]
- Rahbar, N.; Asadi, A.; Fotouhi-Bafghi, E. Performance evaluation of two solar stills of different geometries: Tubular versus triangular: Experimental study, numerical simulation, and second law analysis. Desalination 2018, 443, 44–55. [Google Scholar] [CrossRef]
- Maheswari, C.U.; Reddy, R.M. CFD Analysis of different types of single basin solar stills. IOP Conf. Ser. Mater. Sci. Eng. 2018, 330, 012097. [Google Scholar] [CrossRef]
- Yan, T.; Xie, G.; Liu, H.; Wu, Z.; Sun, L. CFD investigation of vapor transportation in a tubular solar still operating under vacuum. Int. J. Heat Mass Transf. 2020, 156, 119917. [Google Scholar] [CrossRef]
- Mouhsin, N.; Bouzaid, M.; Taha-Janan, M.; Oubrek, M. Modeling and experimental study of cascade solar still. SN Appl. Sci. 2020, 2, 708. [Google Scholar] [CrossRef]
- Khare, V.R.; Singh, A.P.; Kumar, H.; Khatri, R. Modelling and Performance Enhancement of Single Slope Solar Still Using CFD. Energy Procedia 2017, 109, 447–455. [Google Scholar] [CrossRef]
- García-Chávez, R.; De México, U.N.A.; Chávez-Ramirez, A.; Villafán-Vidales, H.; Velázquez-Fernández, J.B.; Rosales, I.H. Thermal study of a solar distiller using computational fluid dynamics (CFD). Rev. Mex. Ing. Quim. 2019, 19, 677–689. [Google Scholar] [CrossRef]
- Hussain, M.; Shoukat, B.; A Wahid, A.; Shukrullah, S.; Anwar, M.; Ashraf, M.Z.; Naz, M.Y. Computational fluid dynamics study of a single stage solar still for water treatment. IOP Conf. Ser. Mater. Sci. Eng. 2020, 863, 012018. [Google Scholar] [CrossRef]
- Subhani, S.; Kumar, R.S. Numerical performance evaluation of tubular solar still with different geometries of water basin. Desalination Water Treat. 2020, 196, 360–369. [Google Scholar] [CrossRef]
- Keshtkar, M.; Eslami, M.; Jafarpur, K. Effect of design parameters on performance of passive basin solar stills considering instantaneous ambient conditions: A transient CFD modeling. Sol. Energy 2020, 201, 884–907. [Google Scholar] [CrossRef]
- Sankaran, N.V.S.; Sridharan, M. Experimental research and performance study of double slope single basin solar distillation still using CFD techniques. Int. J. Ambient Energy 2020, 41, 1–17. [Google Scholar] [CrossRef]
- Zuo, L.; Li, Z.; Liu, W.; Yuan, Y. Numerical analysis of flow heat transfer characteristics in solar chimneys integrated with seawater desalination. In Proceedings of the International Conference on Sustainable Power Generation and Supply, Hangzhou, China, 8–9 September 2012. [Google Scholar] [CrossRef]
- Esfe, M.H.; Toghraie, D. Numerical study on the effect of solar radiation intensity on the fresh water productivity of solar still equipped with Thermoelectric Cooling System (TEC) for hot and dry areas of Semnan. Case Stud. Therm. Eng. 2022, 32, 101848. [Google Scholar] [CrossRef]


| Database | Keywords | Timespan | No. of Publications |
|---|---|---|---|
| Scopus | TITLE-ABS-KEY (solar AND still AND (numerical OR simulation OR CFD) AND (desalination OR seawater)) | 2012–2022 | 148 |
| WoS | TS = ((solar) AND (still) AND (numerical OR CFD OR simulation) AND (desalination OR seawater)) | 2012–2022 | 262 |
| SD | Title, abstract, keywords: (solar AND still AND (numerical OR simulation OR CFD) AND (desalination OR seawater)) | 2012–2022 | 63 |
| Other sources | CFD; Numerical simulation, modeling, solar still, computational fluid dynamic, water treatment, desalination | 2012–2022 | 13 |
| Databases | Collected Data | Exclusions | ||||
|---|---|---|---|---|---|---|
| Common Papers | Other Languages | Initial Screening | Review Papers | Deep Screening | ||
| WOS | 262 | 0 | 2 | 206 | 10 | 22 |
| Scopus | 148 | 98 | 1 | 36 | 5 | 1 |
| SD | 63 | 58 | 0 | 4 | 0 | 0 |
| Extra papers | 13 | 0 | 0 | 0 | 0 | 0 |
| Total Removed | 0 | 156 | 3 | 246 | 15 | 23 |
| Remain | 486 | 330 | 327 | 81 | 66 | 43 |
| Keyword | Total Link Strength | Occurrences | Avg. Pub. Year |
|---|---|---|---|
| Solar still | 27 | 16 | 2019 |
| CFD | 29 | 11 | 2019 |
| CFD simulation | 21 | 8 | 2017 |
| Desalination | 18 | 7 | 2018 |
| Solar desalination | 10 | 5 | 2019 |
| Solar energy | 11 | 5 | 2018 |
| Single slope solar still | 13 | 4 | 2018 |
| Productivity | 14 | 4 | 2019 |
| Stepped solar still | 10 | 3 | 2019 |
| Double diffusive natural convection | 11 | 3 | 2017 |
| Heat and mass transfer | 7 | 3 | 2015 |
| Tubular solar still | 6 | 3 | 2018 |
| Solar chimney | 7 | 3 | 2018 |
| Parametric study | 8 | 2 | 2019 |
| Transient model | 8 | 2 | 2019 |
| Ansys CFD | 4 | 2 | 2019 |
| Heat transfer | 5 | 2 | 2021 |
| Multiphase model | 7 | 2 | 2019 |
| Simulation | 4 | 2 | 2020 |
| Aspect ratio | 5 | 2 | 2015 |
| Entropy generation | 7 | 2 | 2018 |
| Optimization | 5 | 2 | 2013 |
| Single-slope solar still | 3 | 2 | 2013 |
| Water productivity | 6 | 2 | 2017 |
| Computational fluid dynamics | 4 | 2 | 2021 |
| Condensation | 10 | 2 | 2018 |
| Evaporation | 10 | 2 | 2018 |
| Numerical study | 2 | 2 | 2022 |
| Performance | 9 | 2 | 2019 |
| Approaches | Still Type | Software | Discretization Method | Water Depth | Multiphase Model | Validation | Studied Parameters | Productivity/Performance | Reference |
|---|---|---|---|---|---|---|---|---|---|
| Experimental and numerical | Single slope (SS) | Ansys Fluent | FVM | 2 cm | Volume of fluid (VOF); three phases | Yes. The error is 8.3%. | Temperature’s variation, fluid and vapor fraction, productivity, and mixture velocity contours | Daily simulated and experimental cumulative freshwater productivities were to be 1.982 and 1.785 L/m2 h, respectively. | [13] |
| Experimental and numerical | Cascade solar still | Ansys Fluent | FVM | NA | Volume of fluid (VOF); three phases | Yes | Absorber plate temperature, hourly productivity, and solar intensity variations | The absorber plate temperature and freshwater productivity can reach more than 60 °C and 1.66 kg/m2 h, respectively.When the absorber plate temperature is over 50 °C, the freshwater productivity may reach 0.6 kg/m2 h. | [65] |
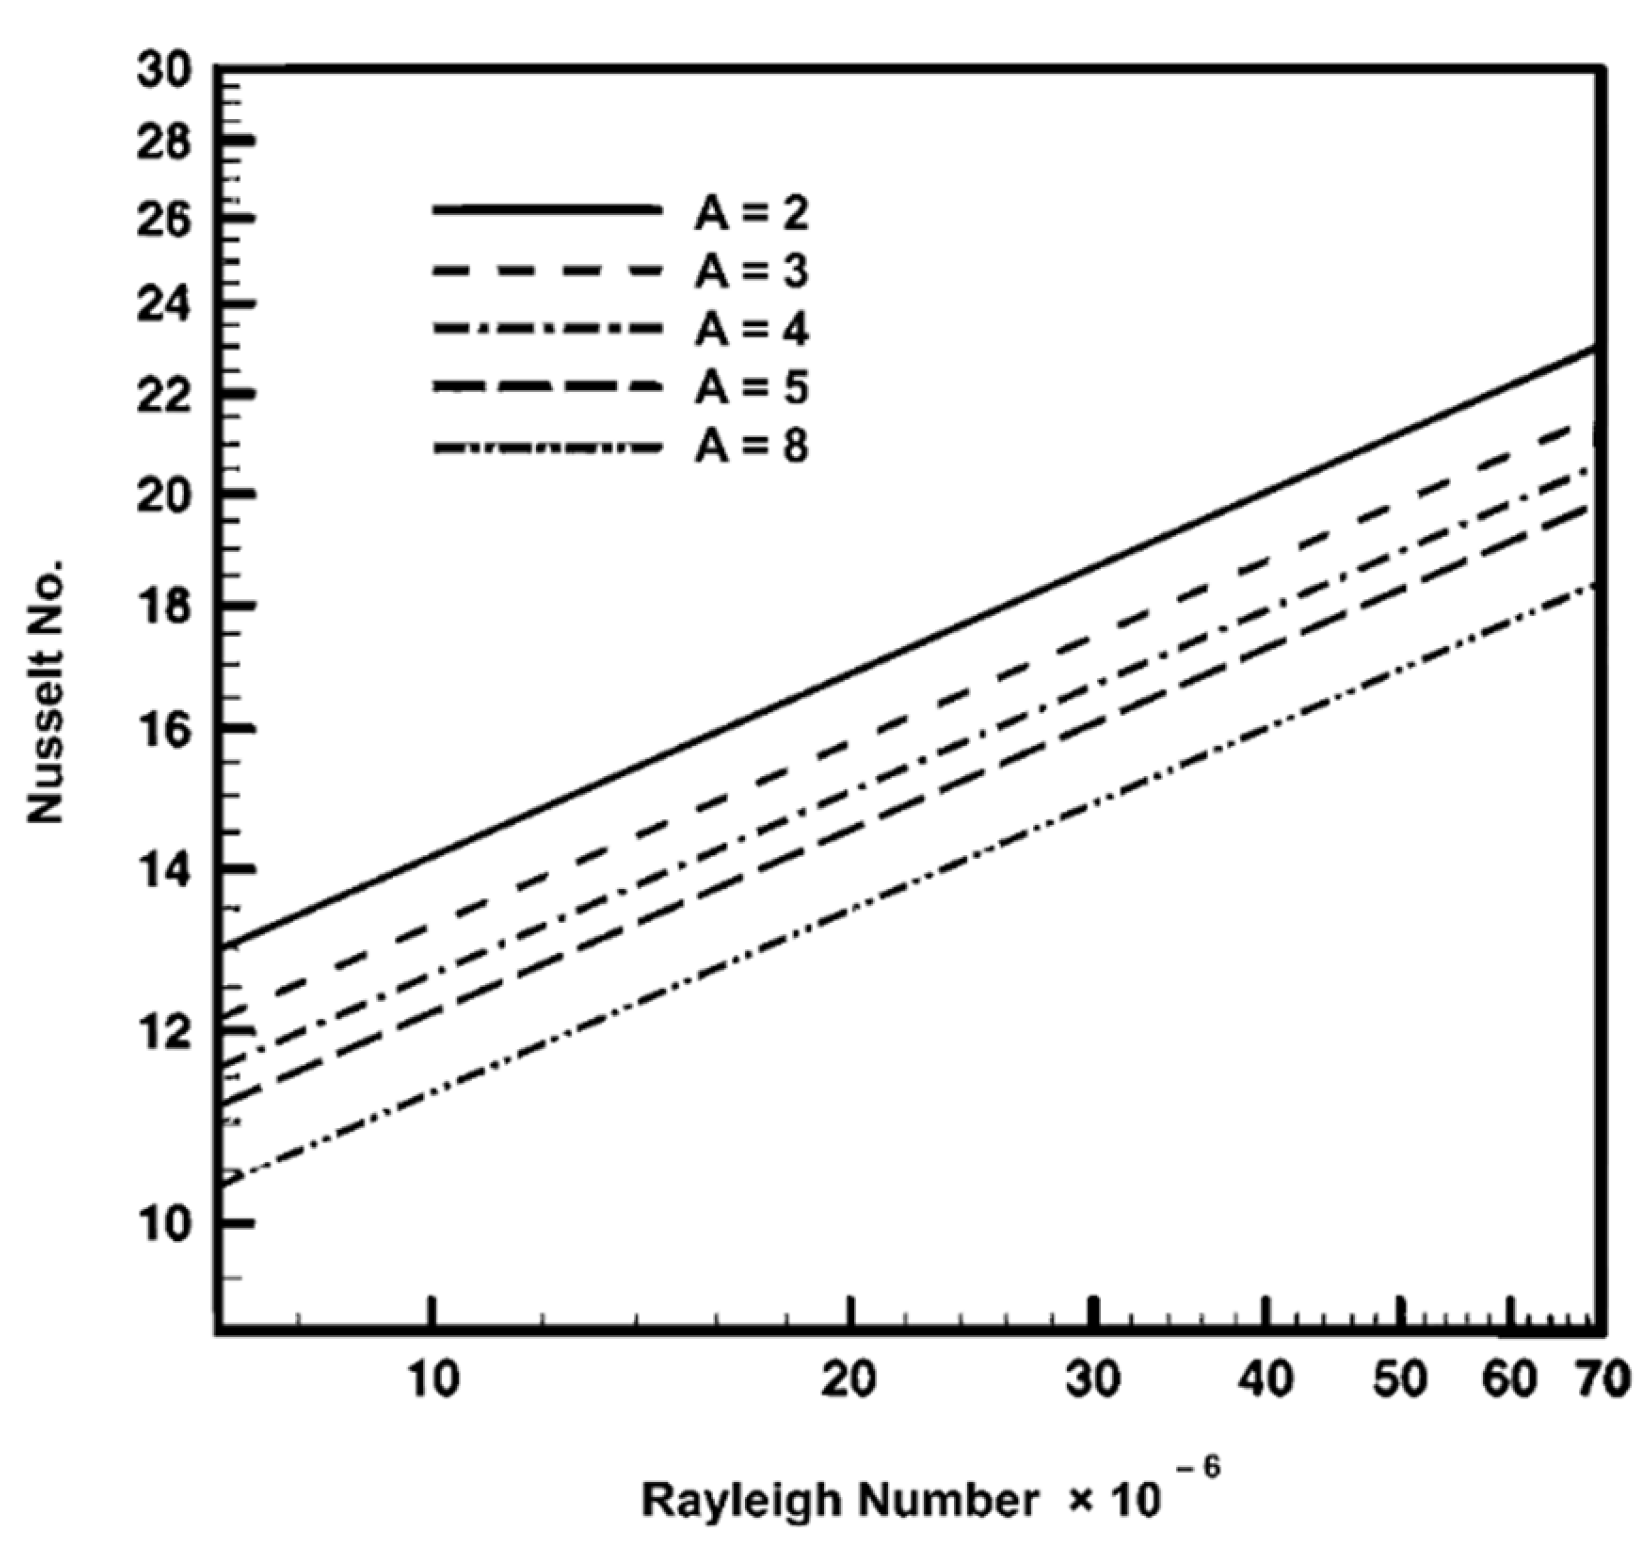
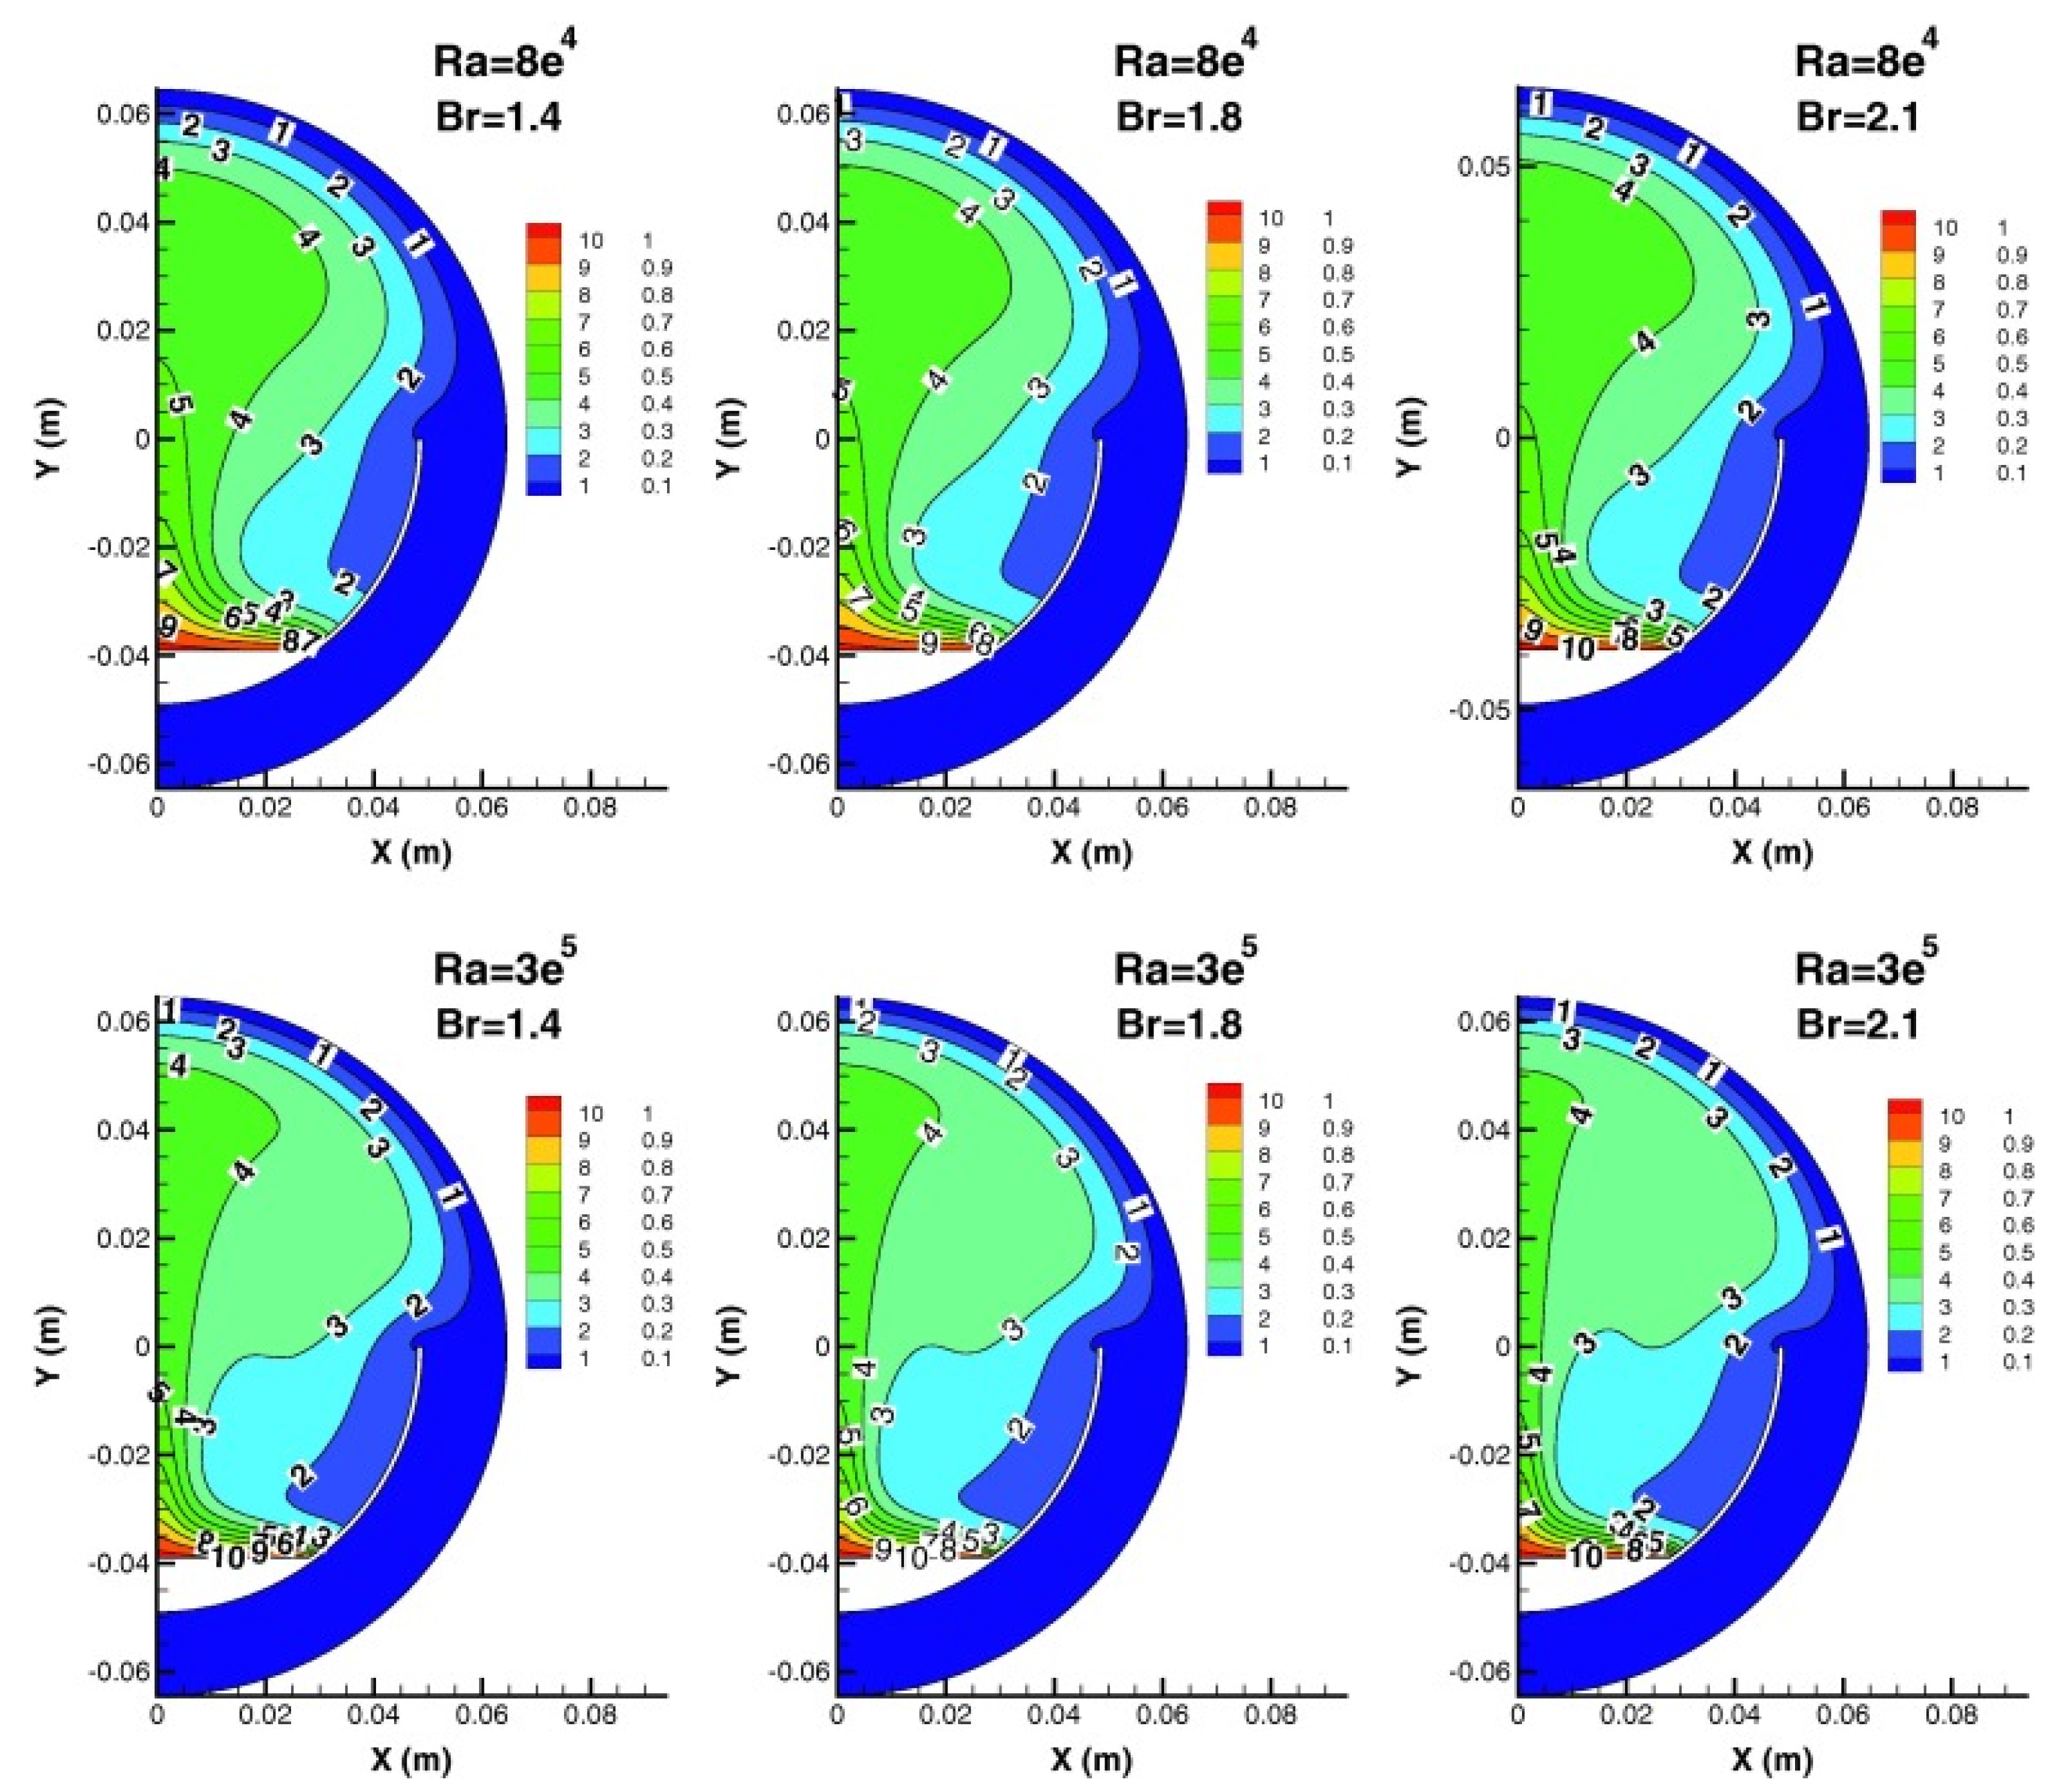
| Theoretical and numerical analysis | Single slope (SS) | Ansys Fluent | FVM | NA | Volume of fluid (VOF); three phases | The theoretical results have a maximum deviation of 12.5% from the numerical results. | The convective heat transfer coefficient, Rayleigh number, and still geometry (aspect ratio = length/height) | It was reported that the heat transfer coefficient rises as the Rayleigh number increases for a certain aspect ratio (A = L/H). | [52] |
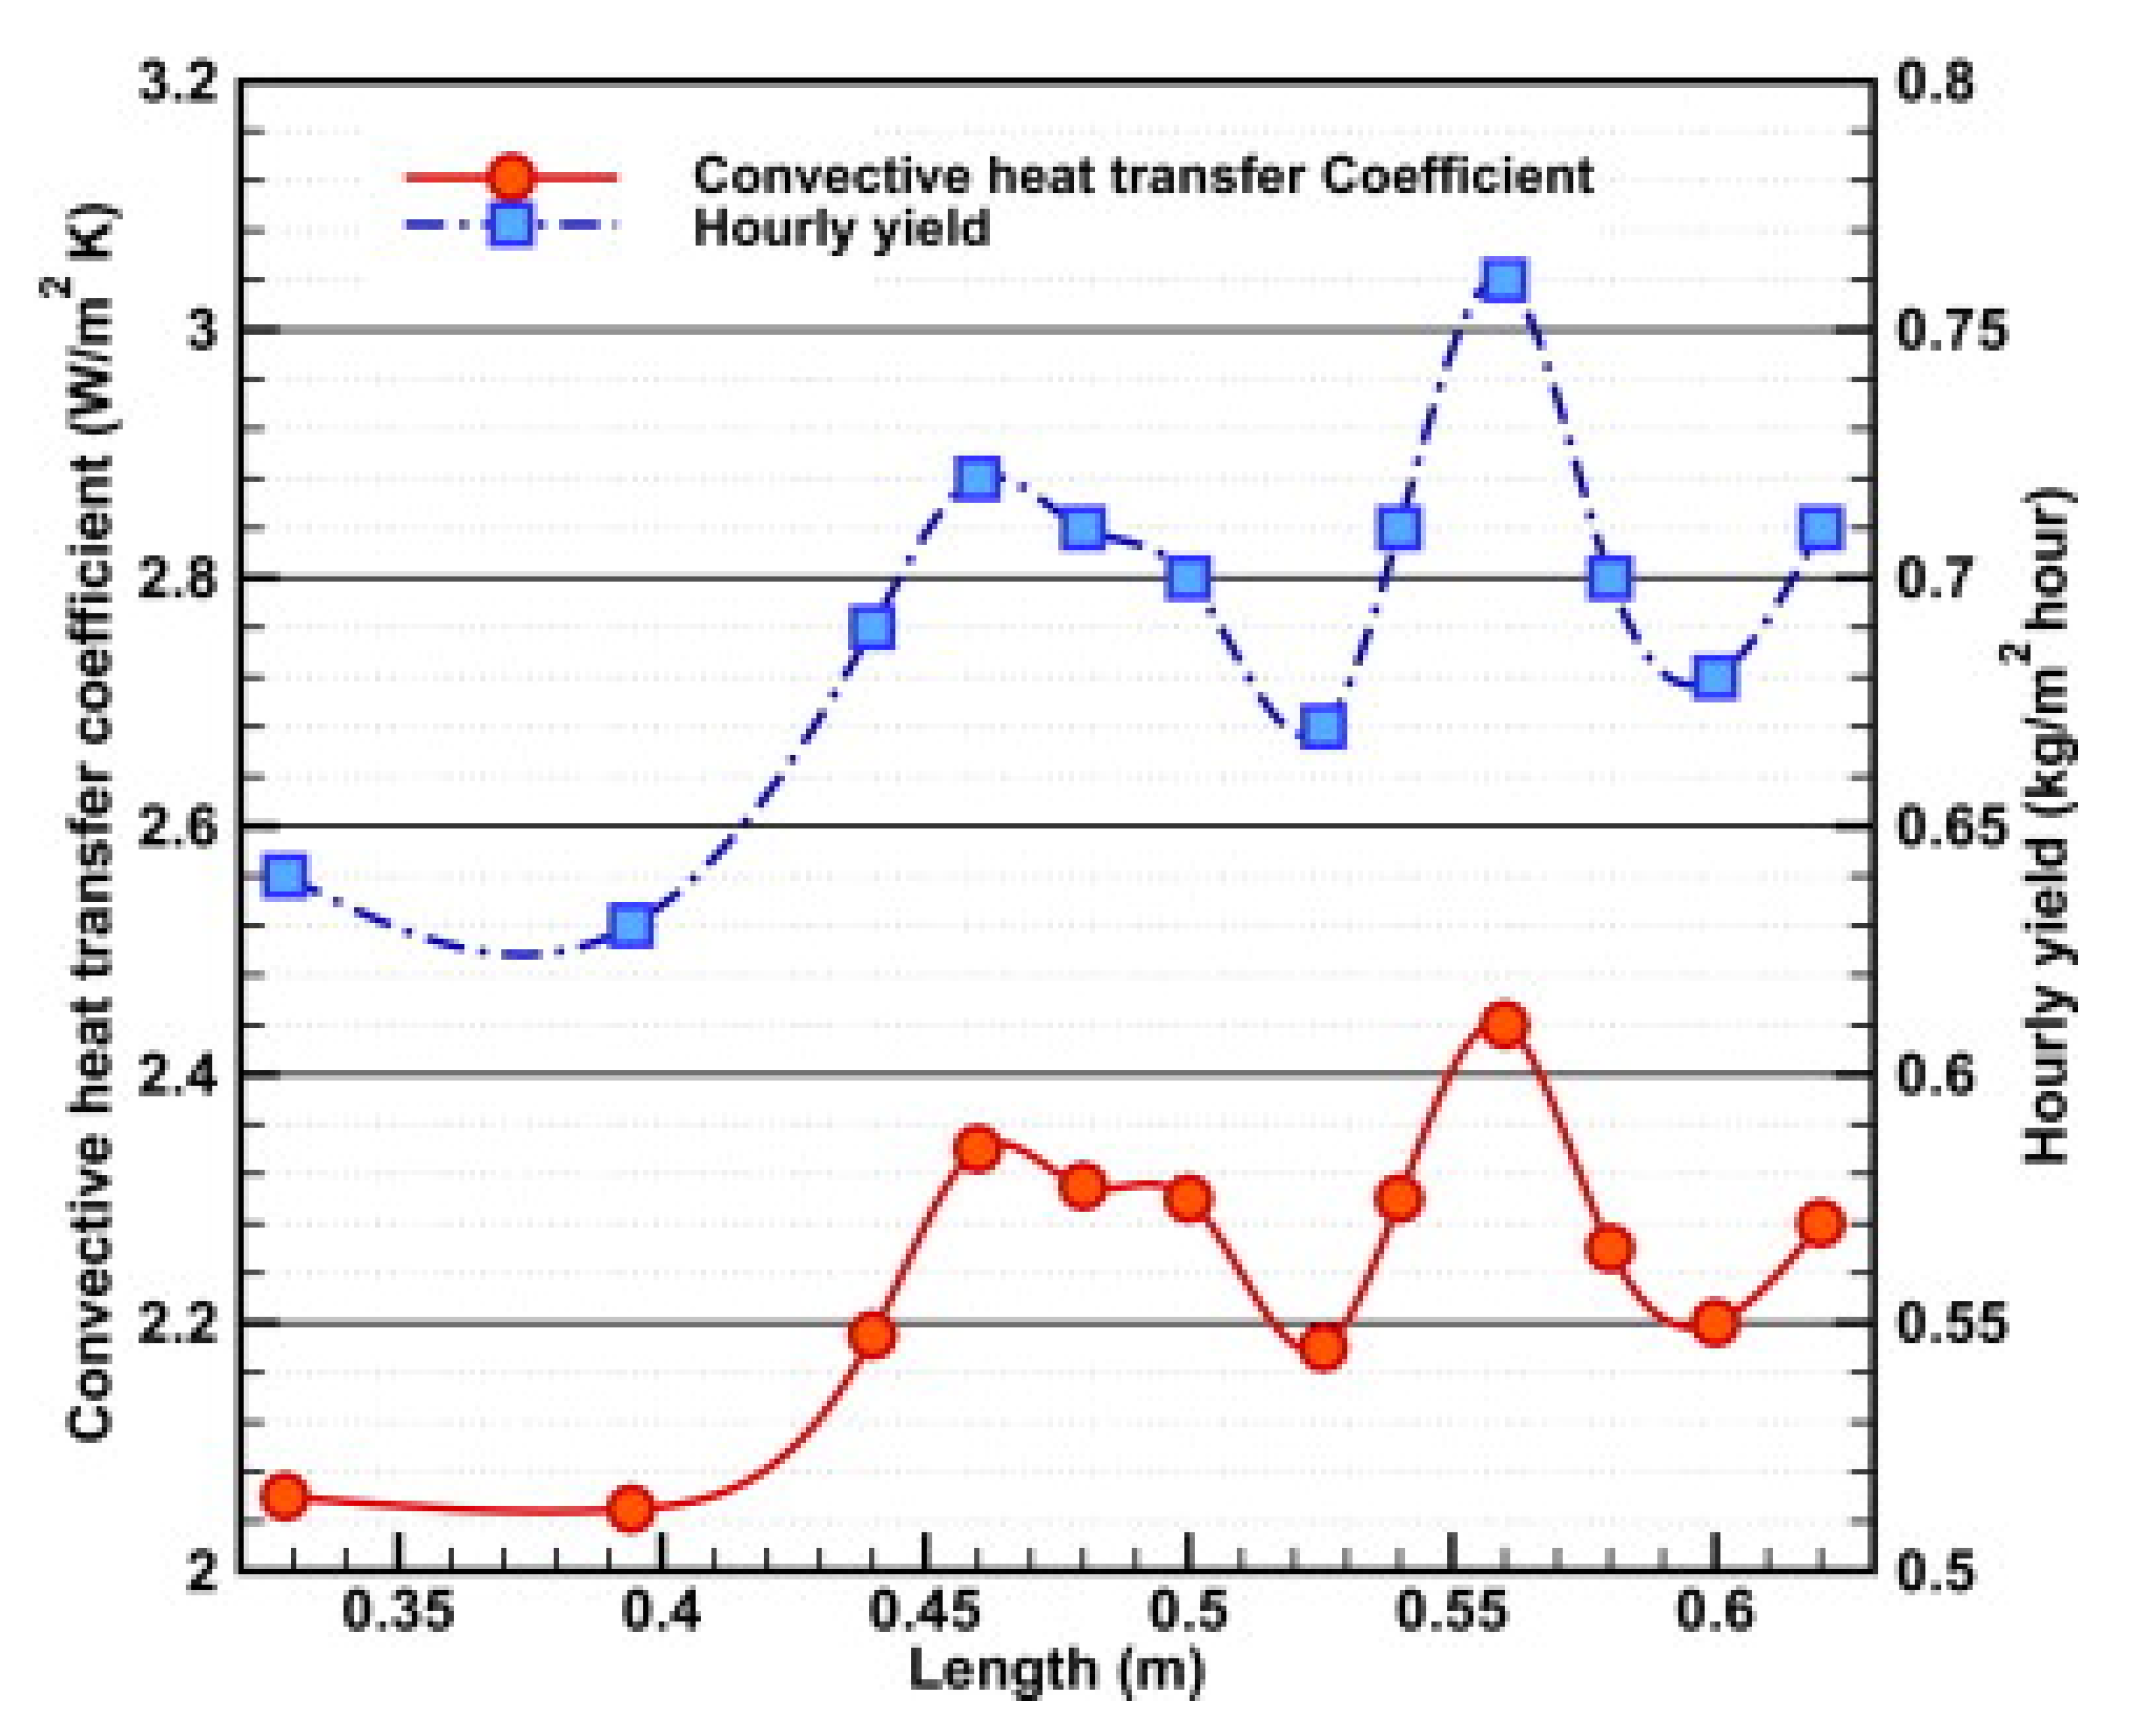
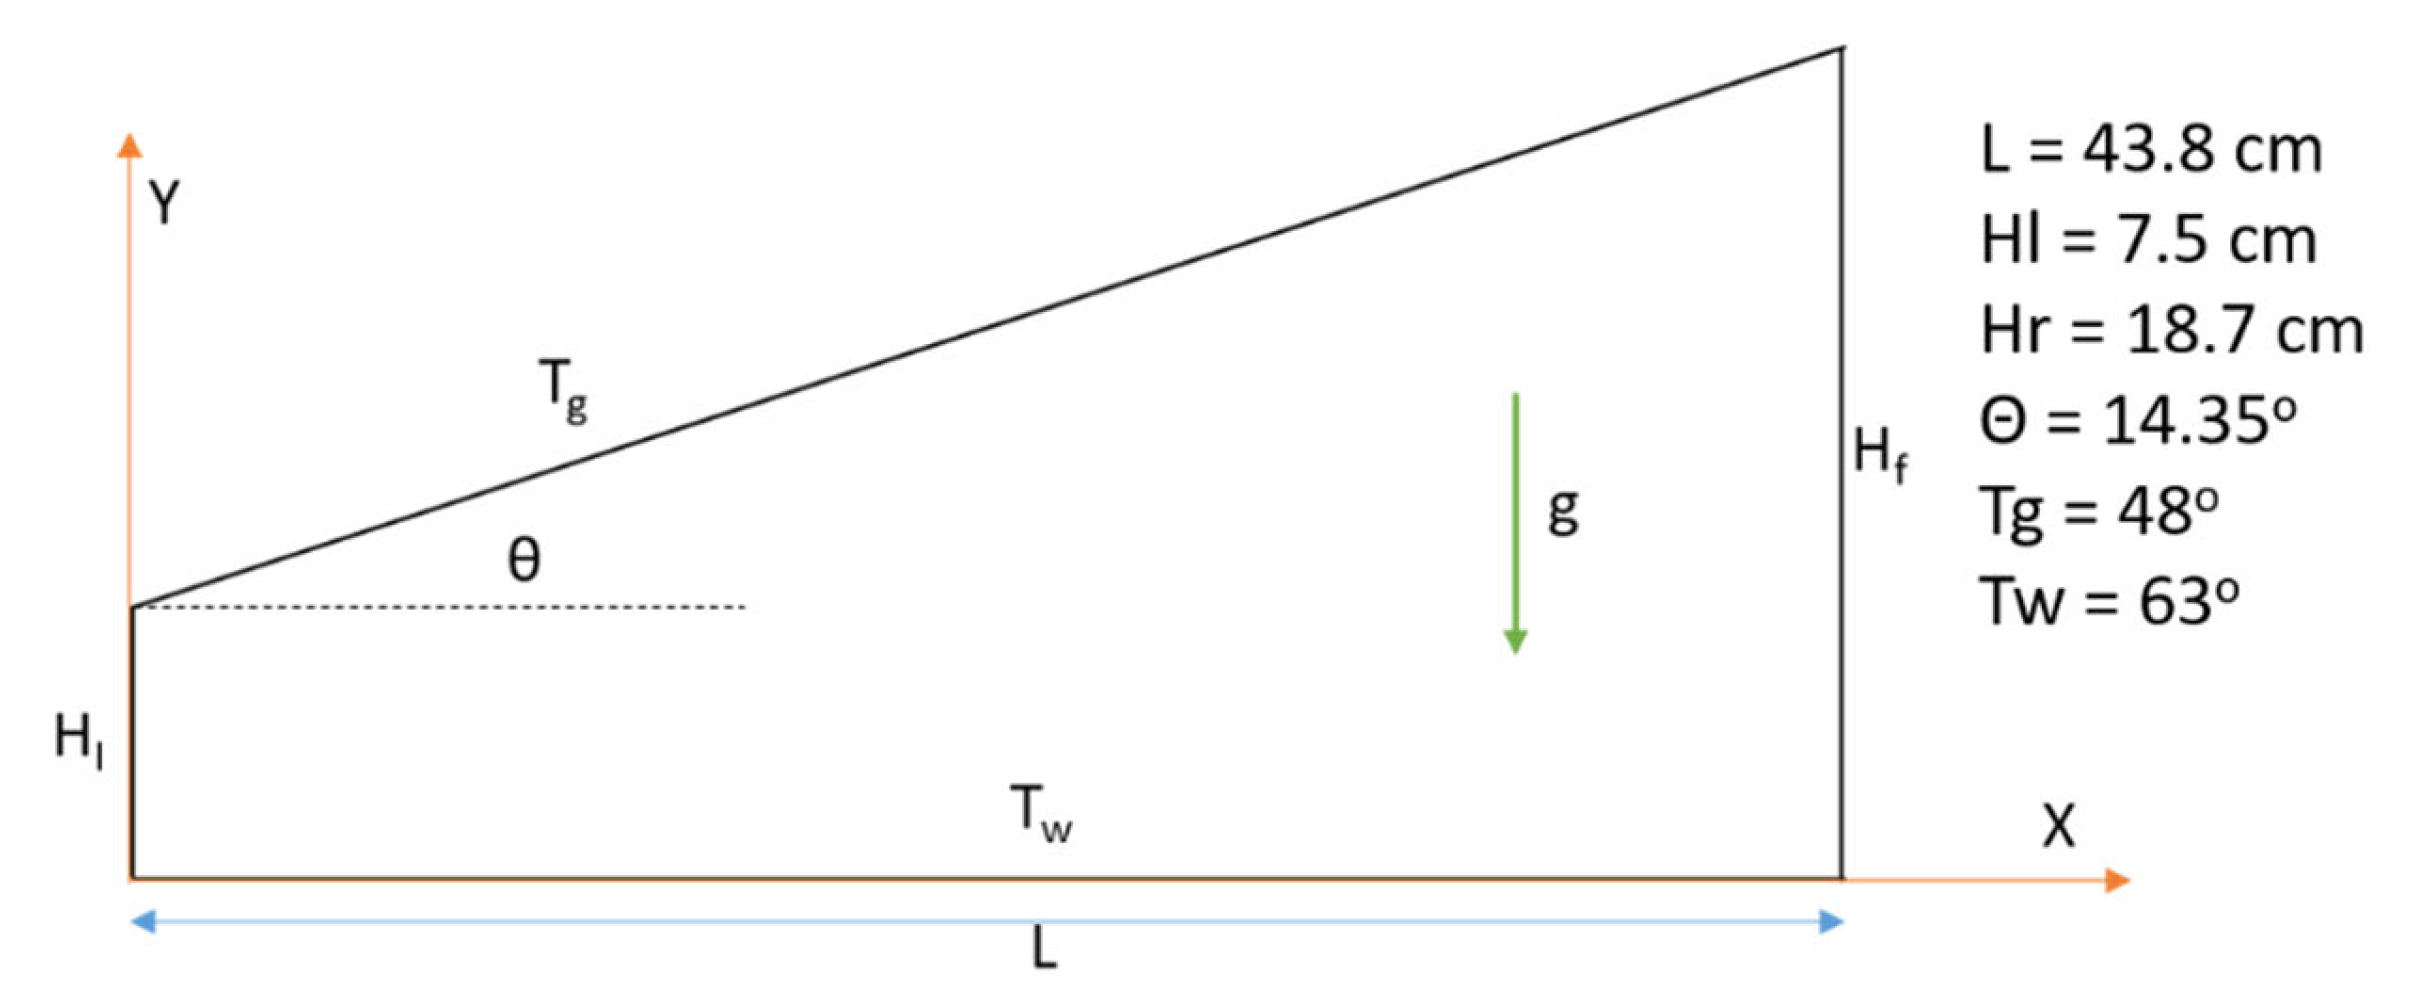
| Theoretical and numerical analysis | Single slope (SS) | Ansys Fluent 6.3 | FVM | NA | Volume of fluid (VOF); three phases | Yes. The maximum deviation of the CFD model from Chiltone Colburn for the hourly productivity is 15%. | Variation of thermal conditions (water and glass temperatures) and geometry parameters (height, length, and inclination angle) | The freshwater productivity is increasing with decreasing the specific height at fixed length of the solar still.There is an optimum length for the solar still to increase the freshwater productivity at fixed specific height. | [46] |
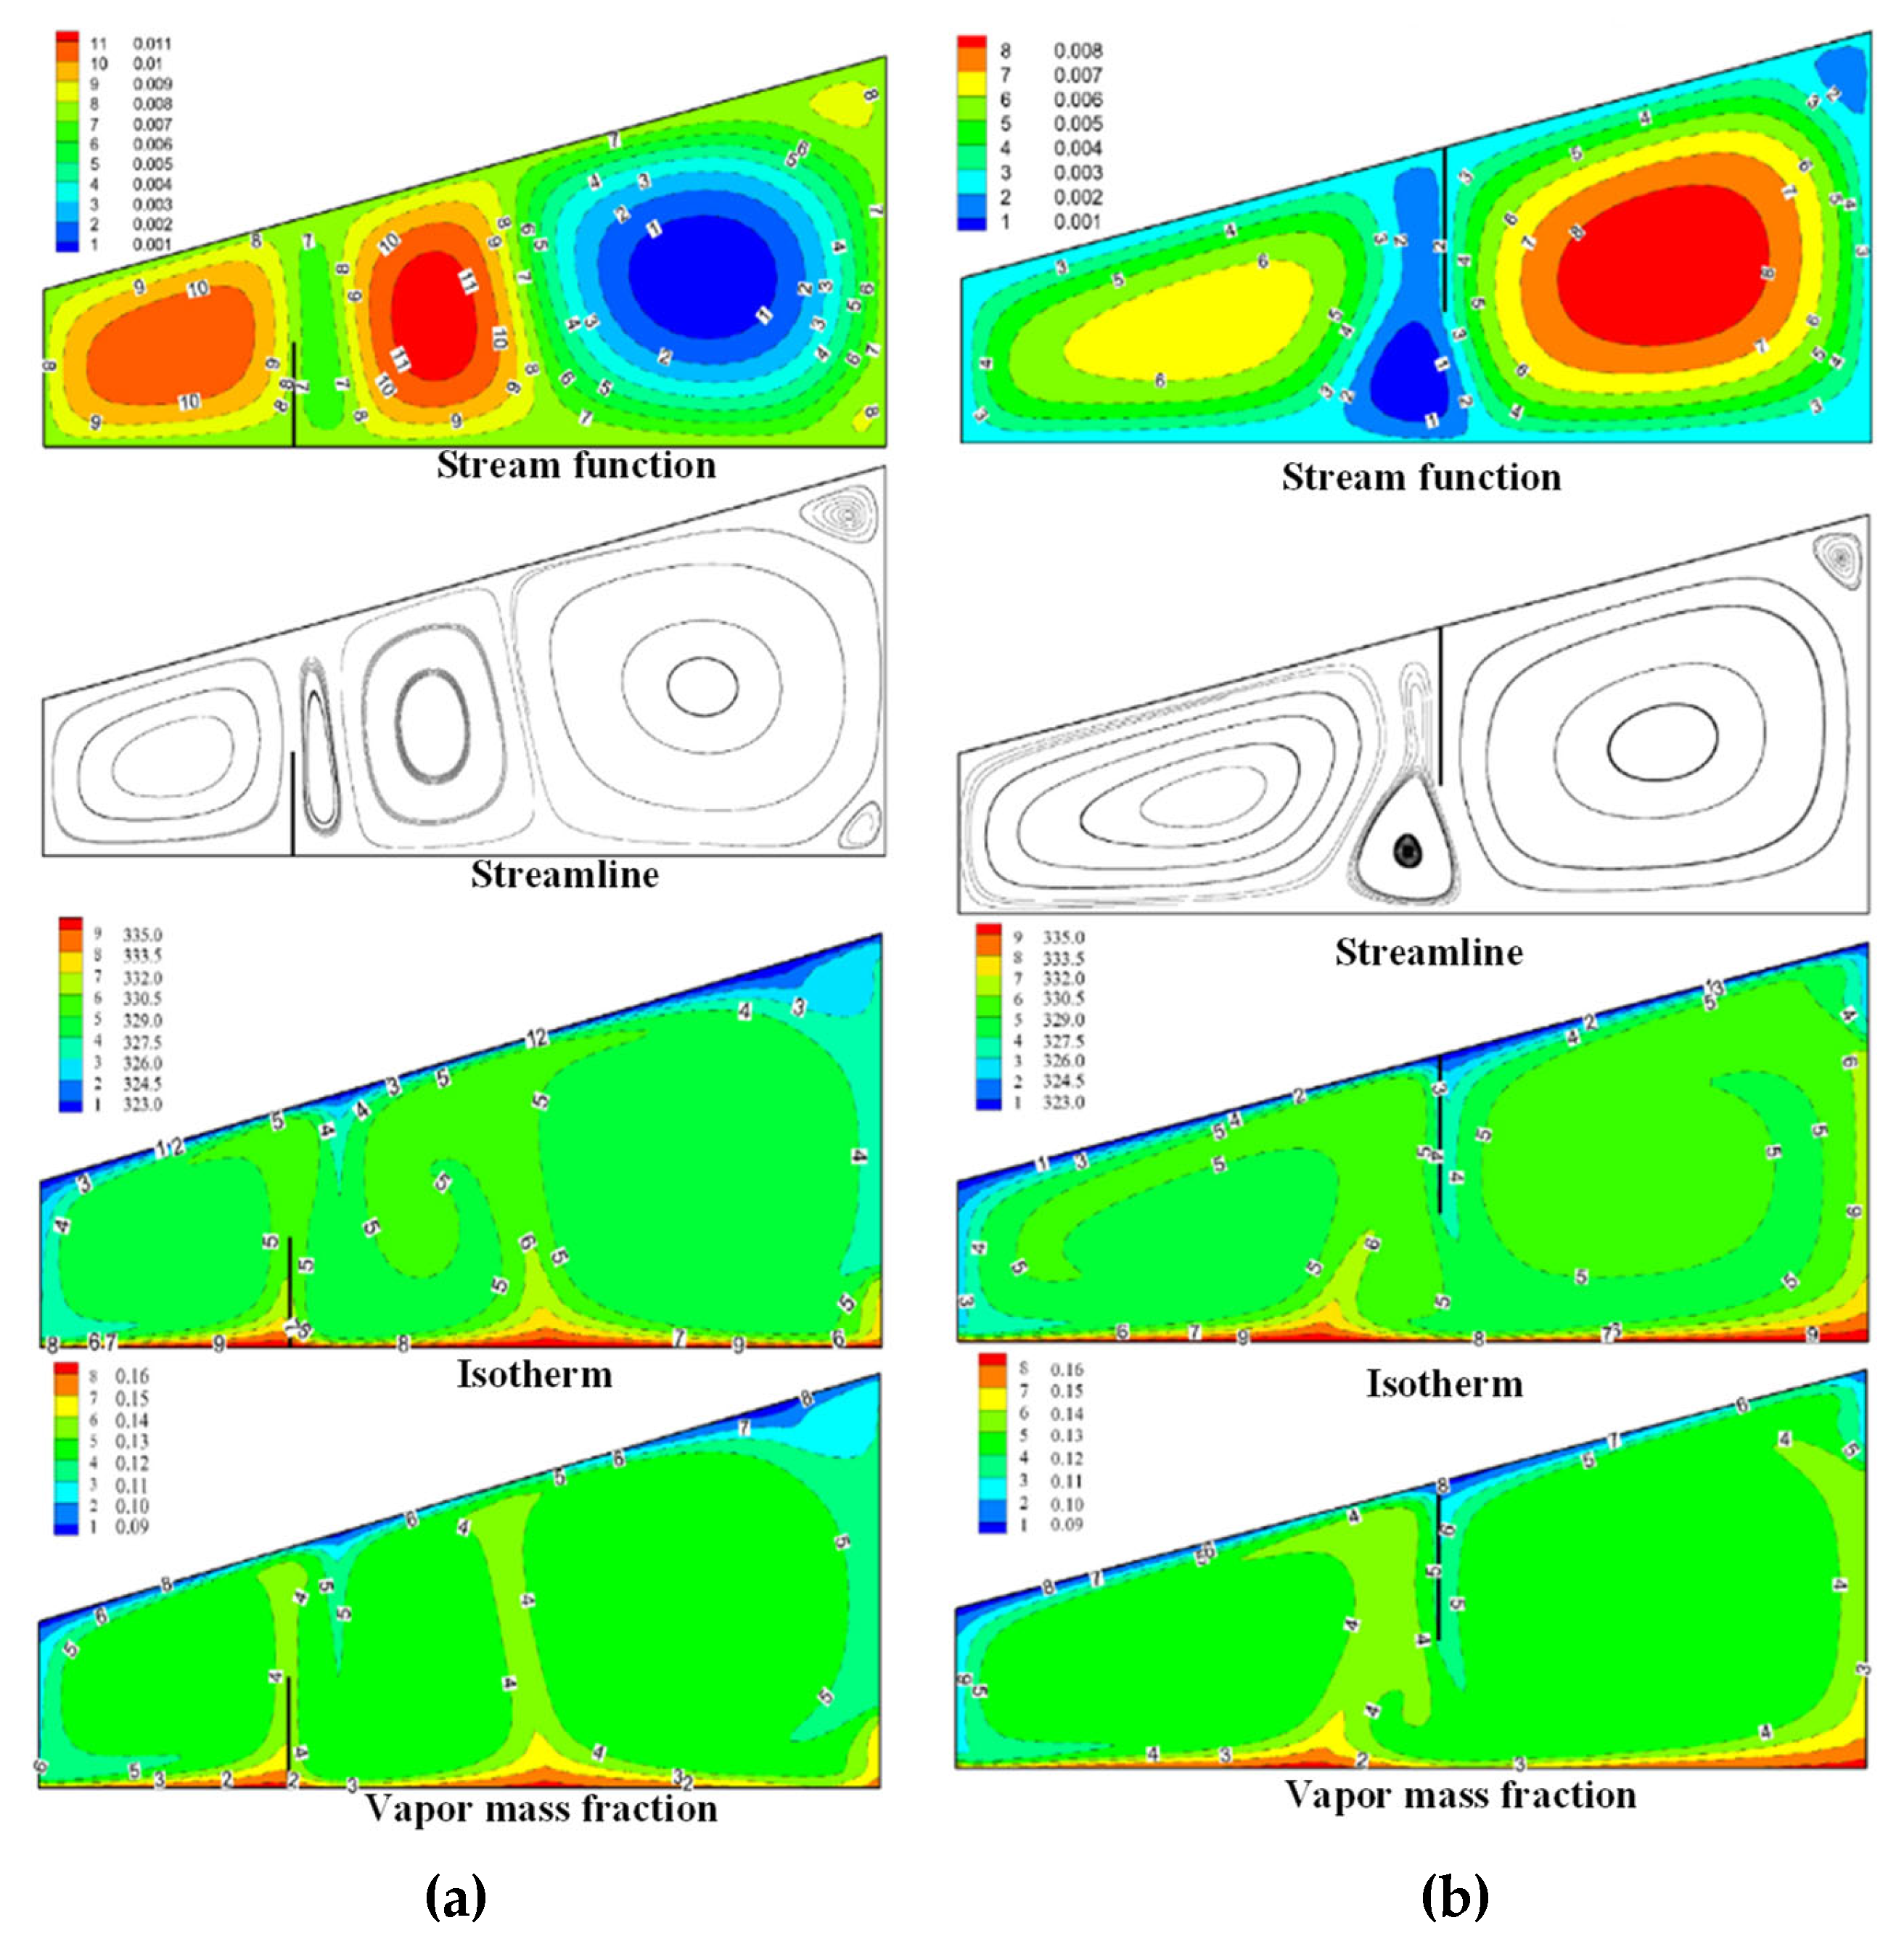
| Numerical analysis | Single slope (SS) | Ansys Fluent | FVM | NA | Volume of fluid (VOF); three phases | - In case of the buoyancy ratio (N), the maximum error is 2.1% for N = −0.9 compared with literature.- In case of the convective, radiative and total average Nusselt number, the maximum error is 2.8% compared with literature. | Streamlines, isotherms, and isolines of vapor and water mass flow rate, as well as average Nusselt (Nu) and Sherwood (Sh) numbers for different inclination angles | As the slope angle, Rayleigh number, or aspect ratio rises, the freshwater productivity rises as well. | [53] |
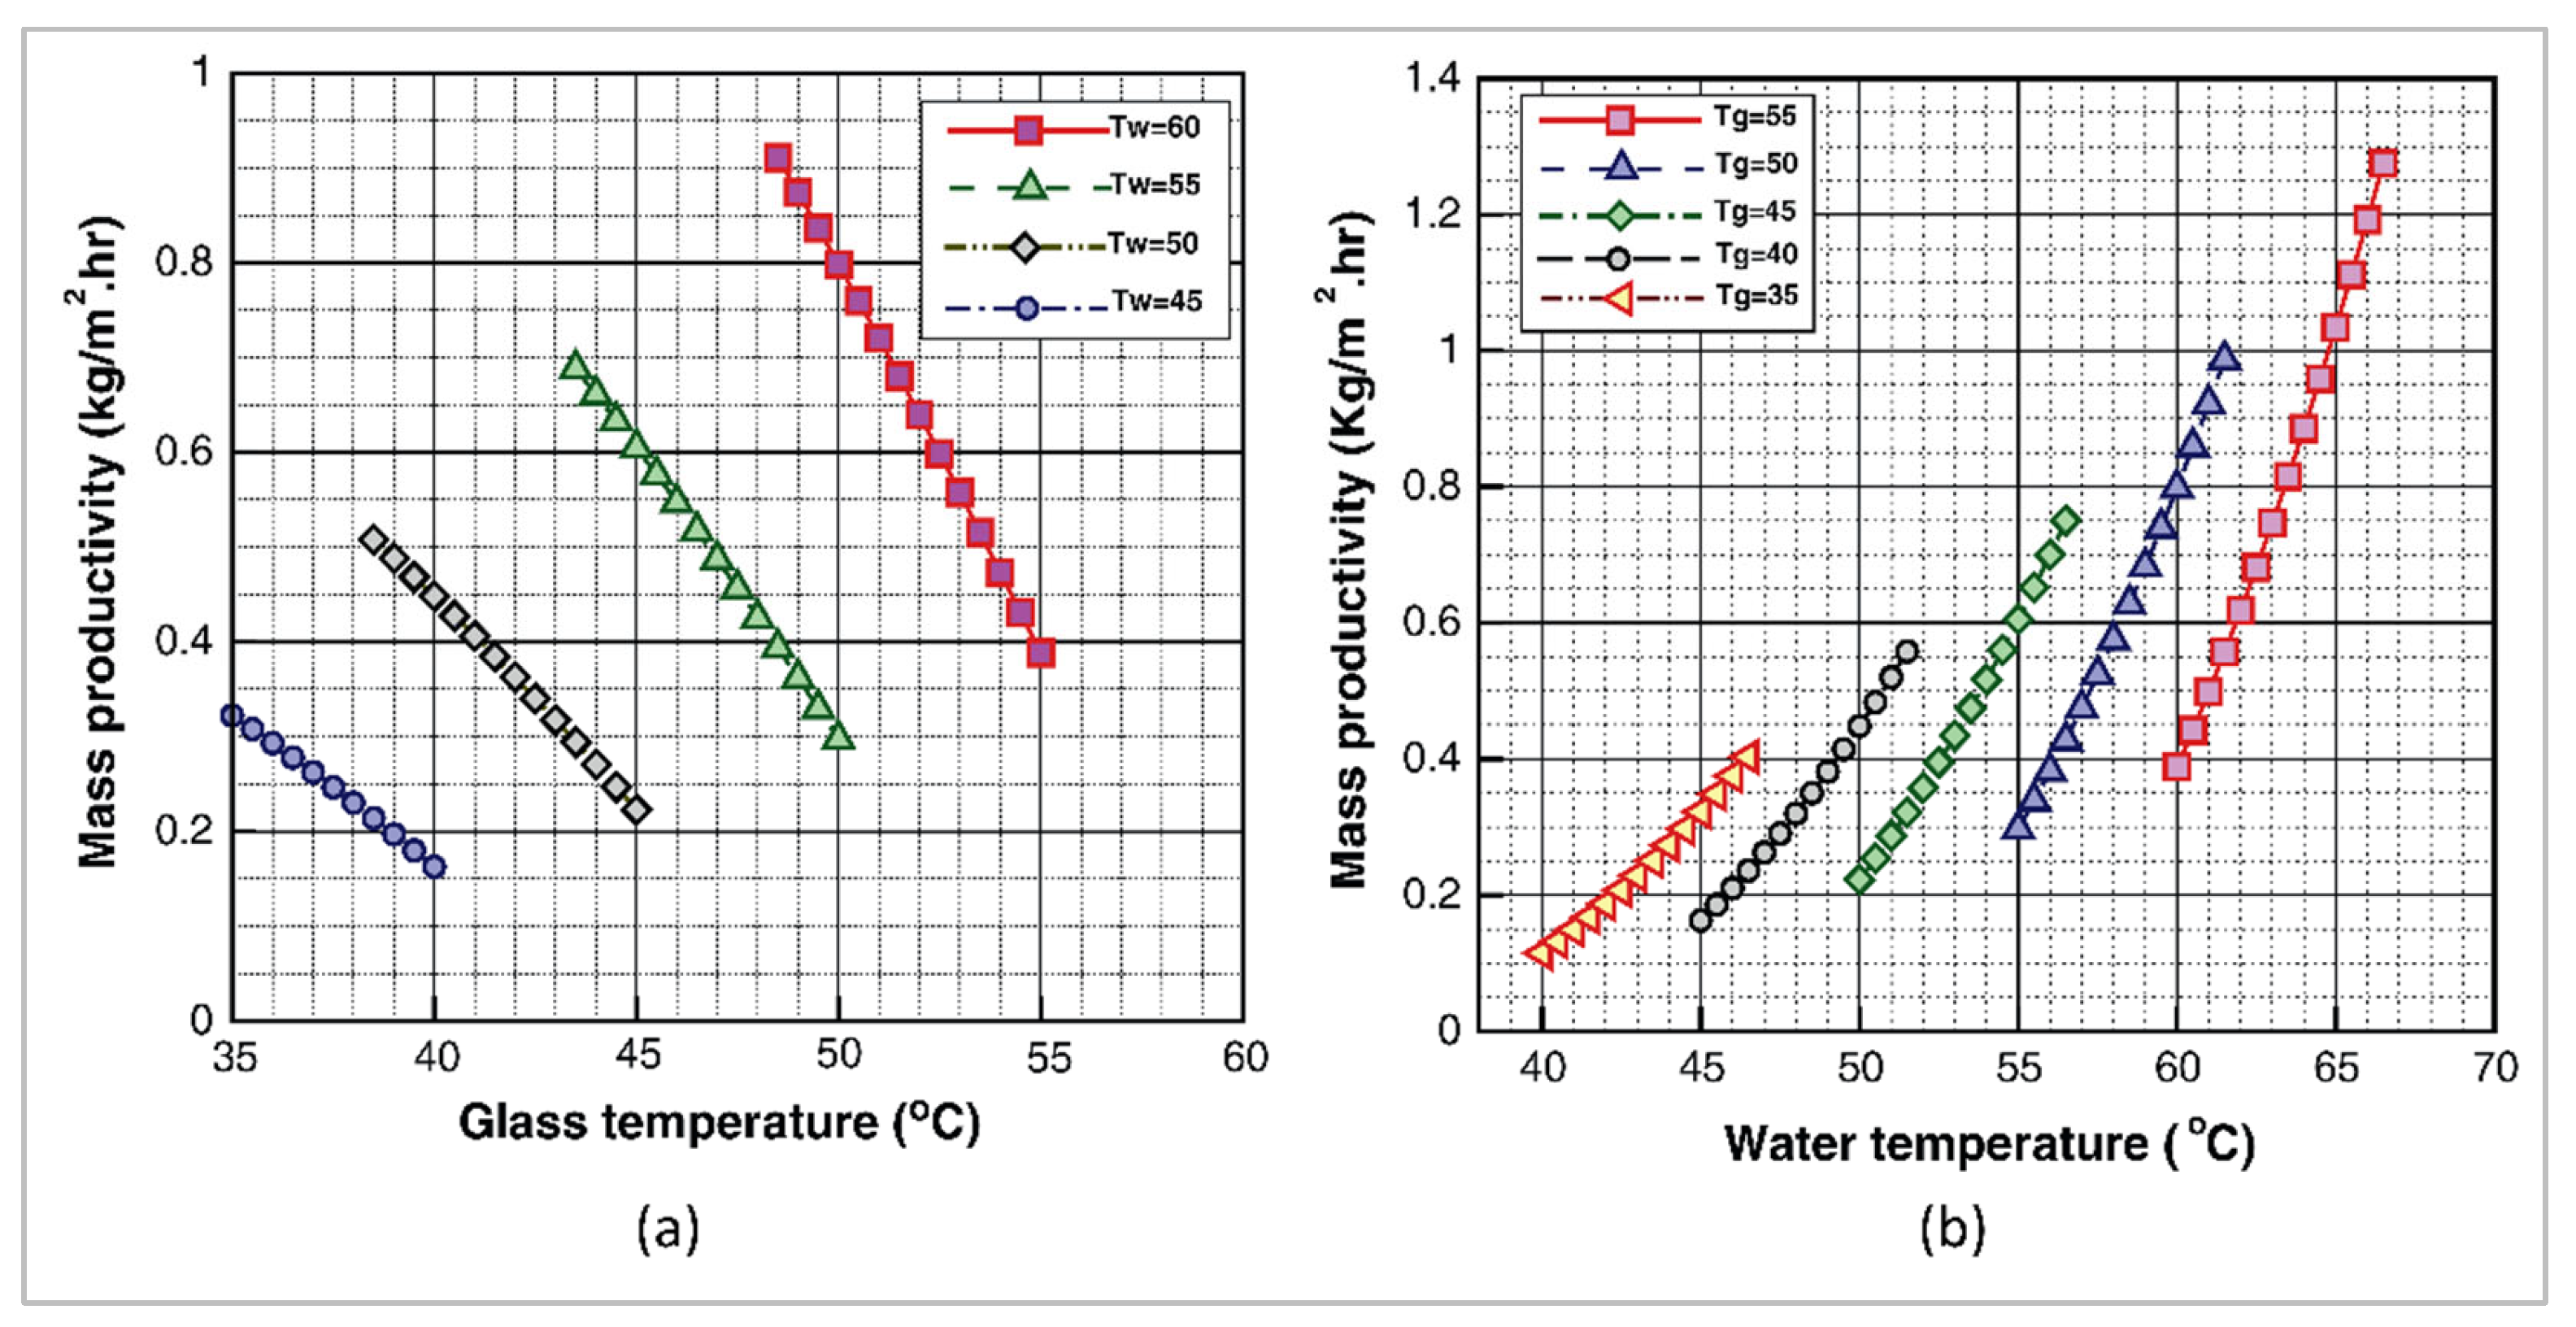
| Theoretical and numerical analysis | Tubular solar still | Ansys Fluent 14.0 | FVM | NA | Volume of fluid (VOF); three phases | At certain value of the convective heat transfer coefficient between water and glass cover, the estimation accuracy is 10% compared with experimental data reported in literature. | Water productivity, heat, and mass transfer coefficients at different water and glass temperatures | Productivity increases by more than 250% even with a 5 °C increase in water temperature.While the temperature of the glass just rises by 5 °C, productivity is reduced by almost 200%. | [54] |
| Numerical analysis | Single slope (SS) | Ansys Fluent | FVM | NA | Volume of fluid (VOF); two phases | There is a high level of agreement between the results of this study and the previously published data. | Position and height of the partition on heat transfer rate and productivity | It is found that the partition height has a greater impact on heat transfer rate and freshwater productivity rather than the partition position parameter. | [55] |
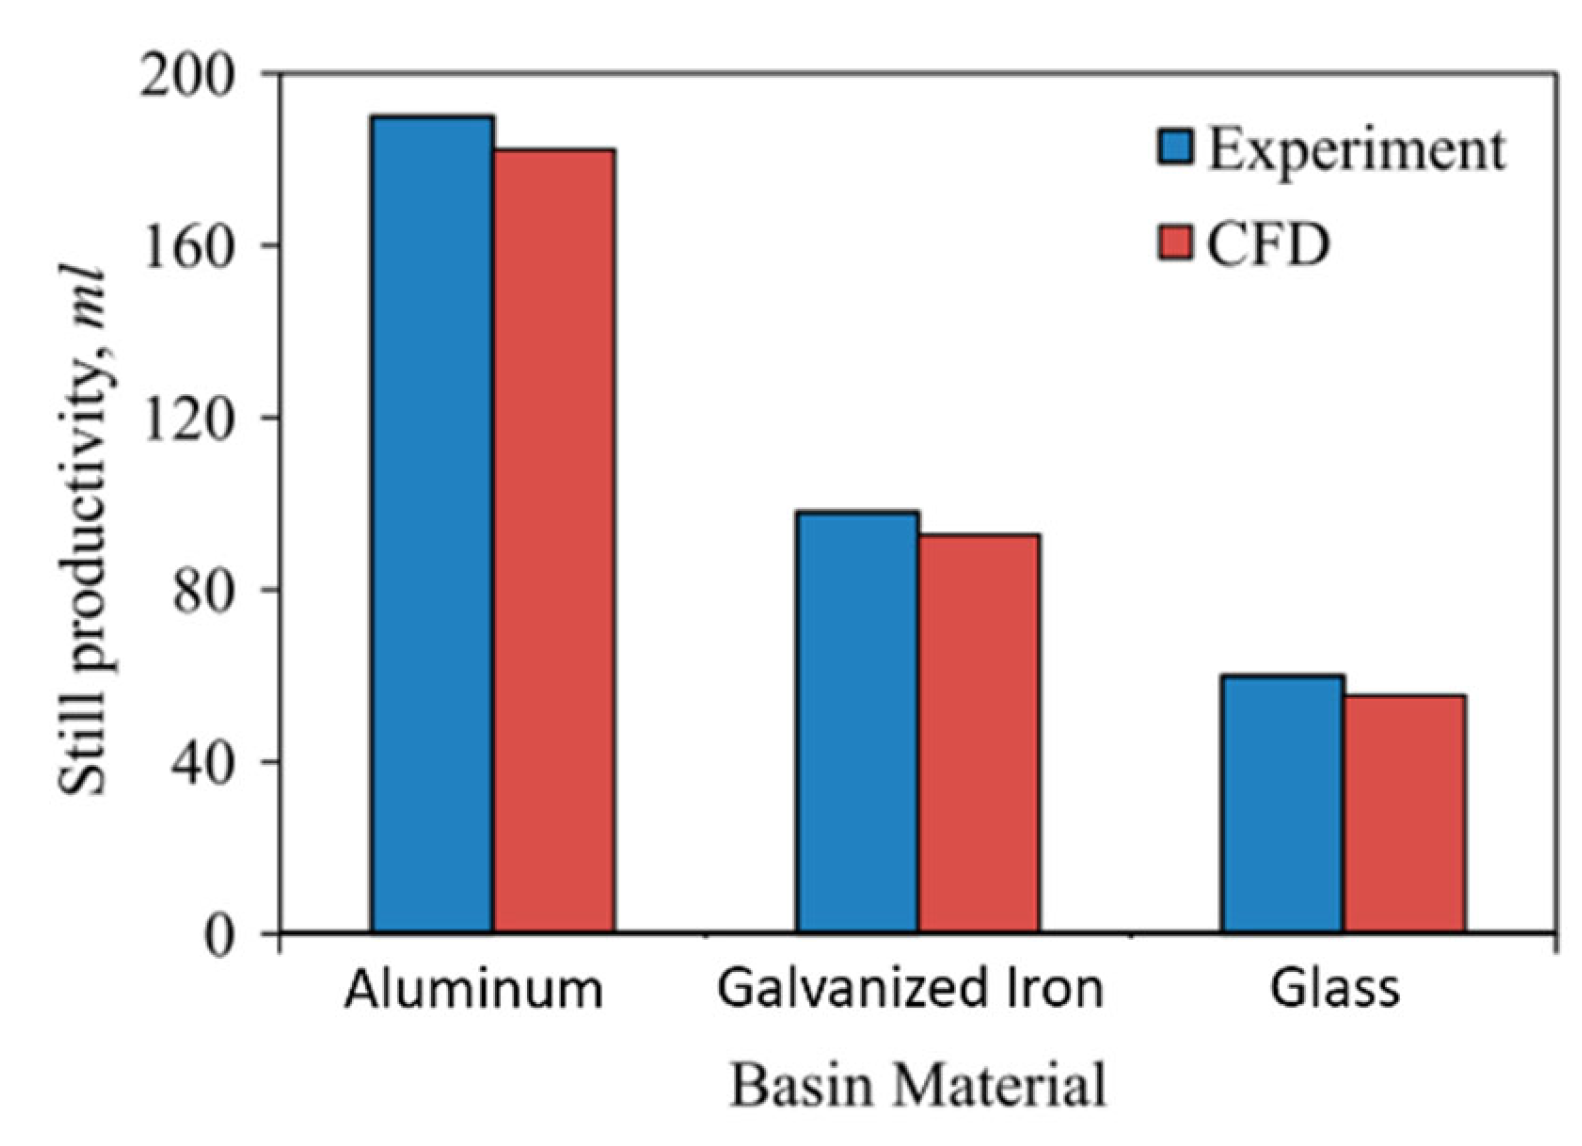
| Numerical and experimental analysis | Single slope (SS) | Ansys CFX solver | FVM | 2 cm | Volume of fluid (VOF); three phases | The average errors in CFD for the same boundary conditions as the experiment are 5.26%. | Production using three different basin materials (galvanized iron, glass, and aluminium) | It was found that the solar still with aluminum basin material achieves the highest freshwater productivity, followed by the galvanized iron basin material, and then the glass basin material, which is the least of them in productivity. | [56] |
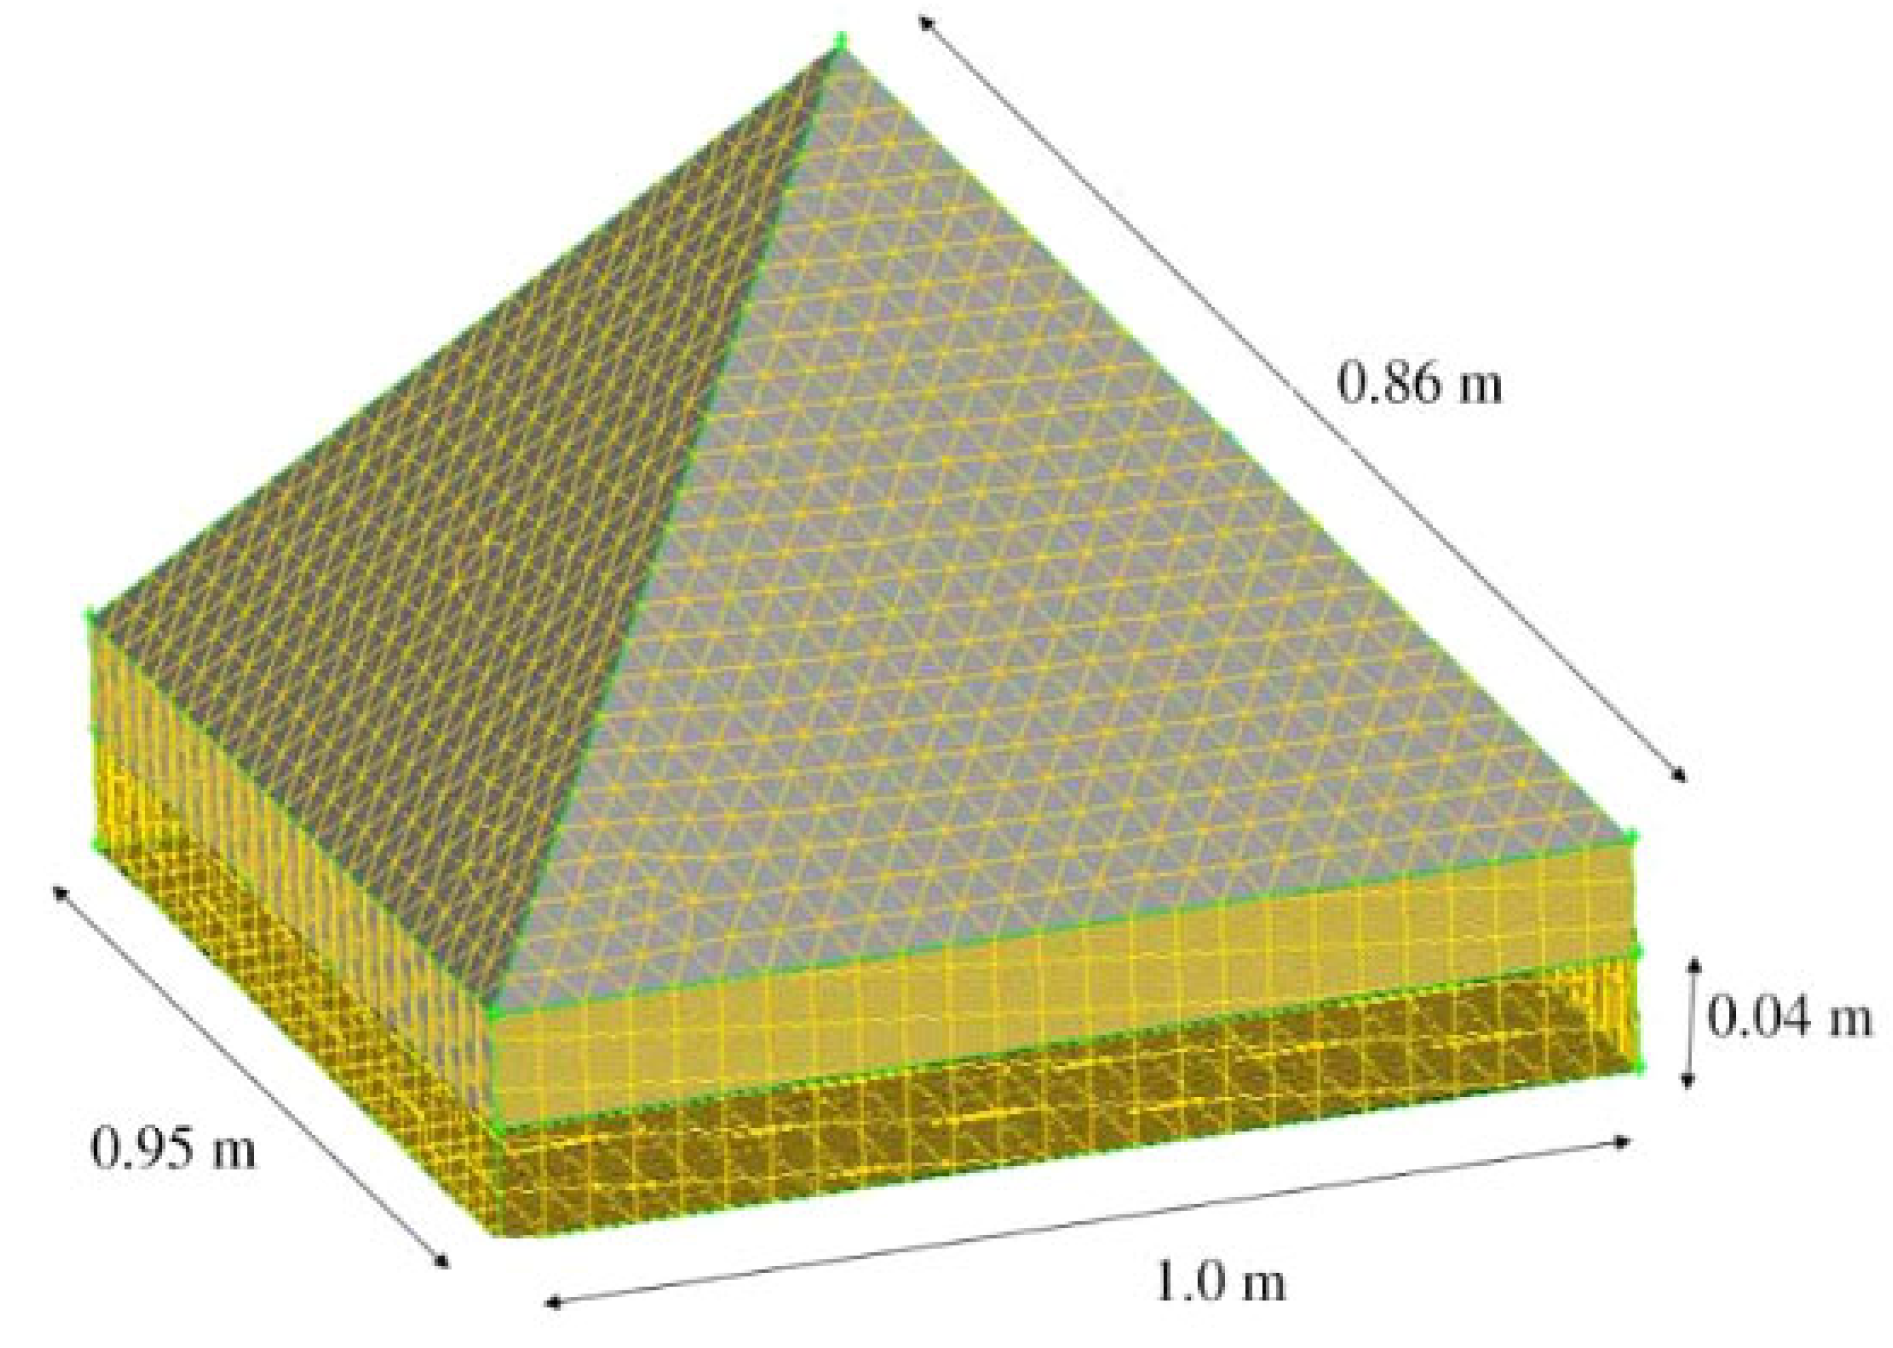
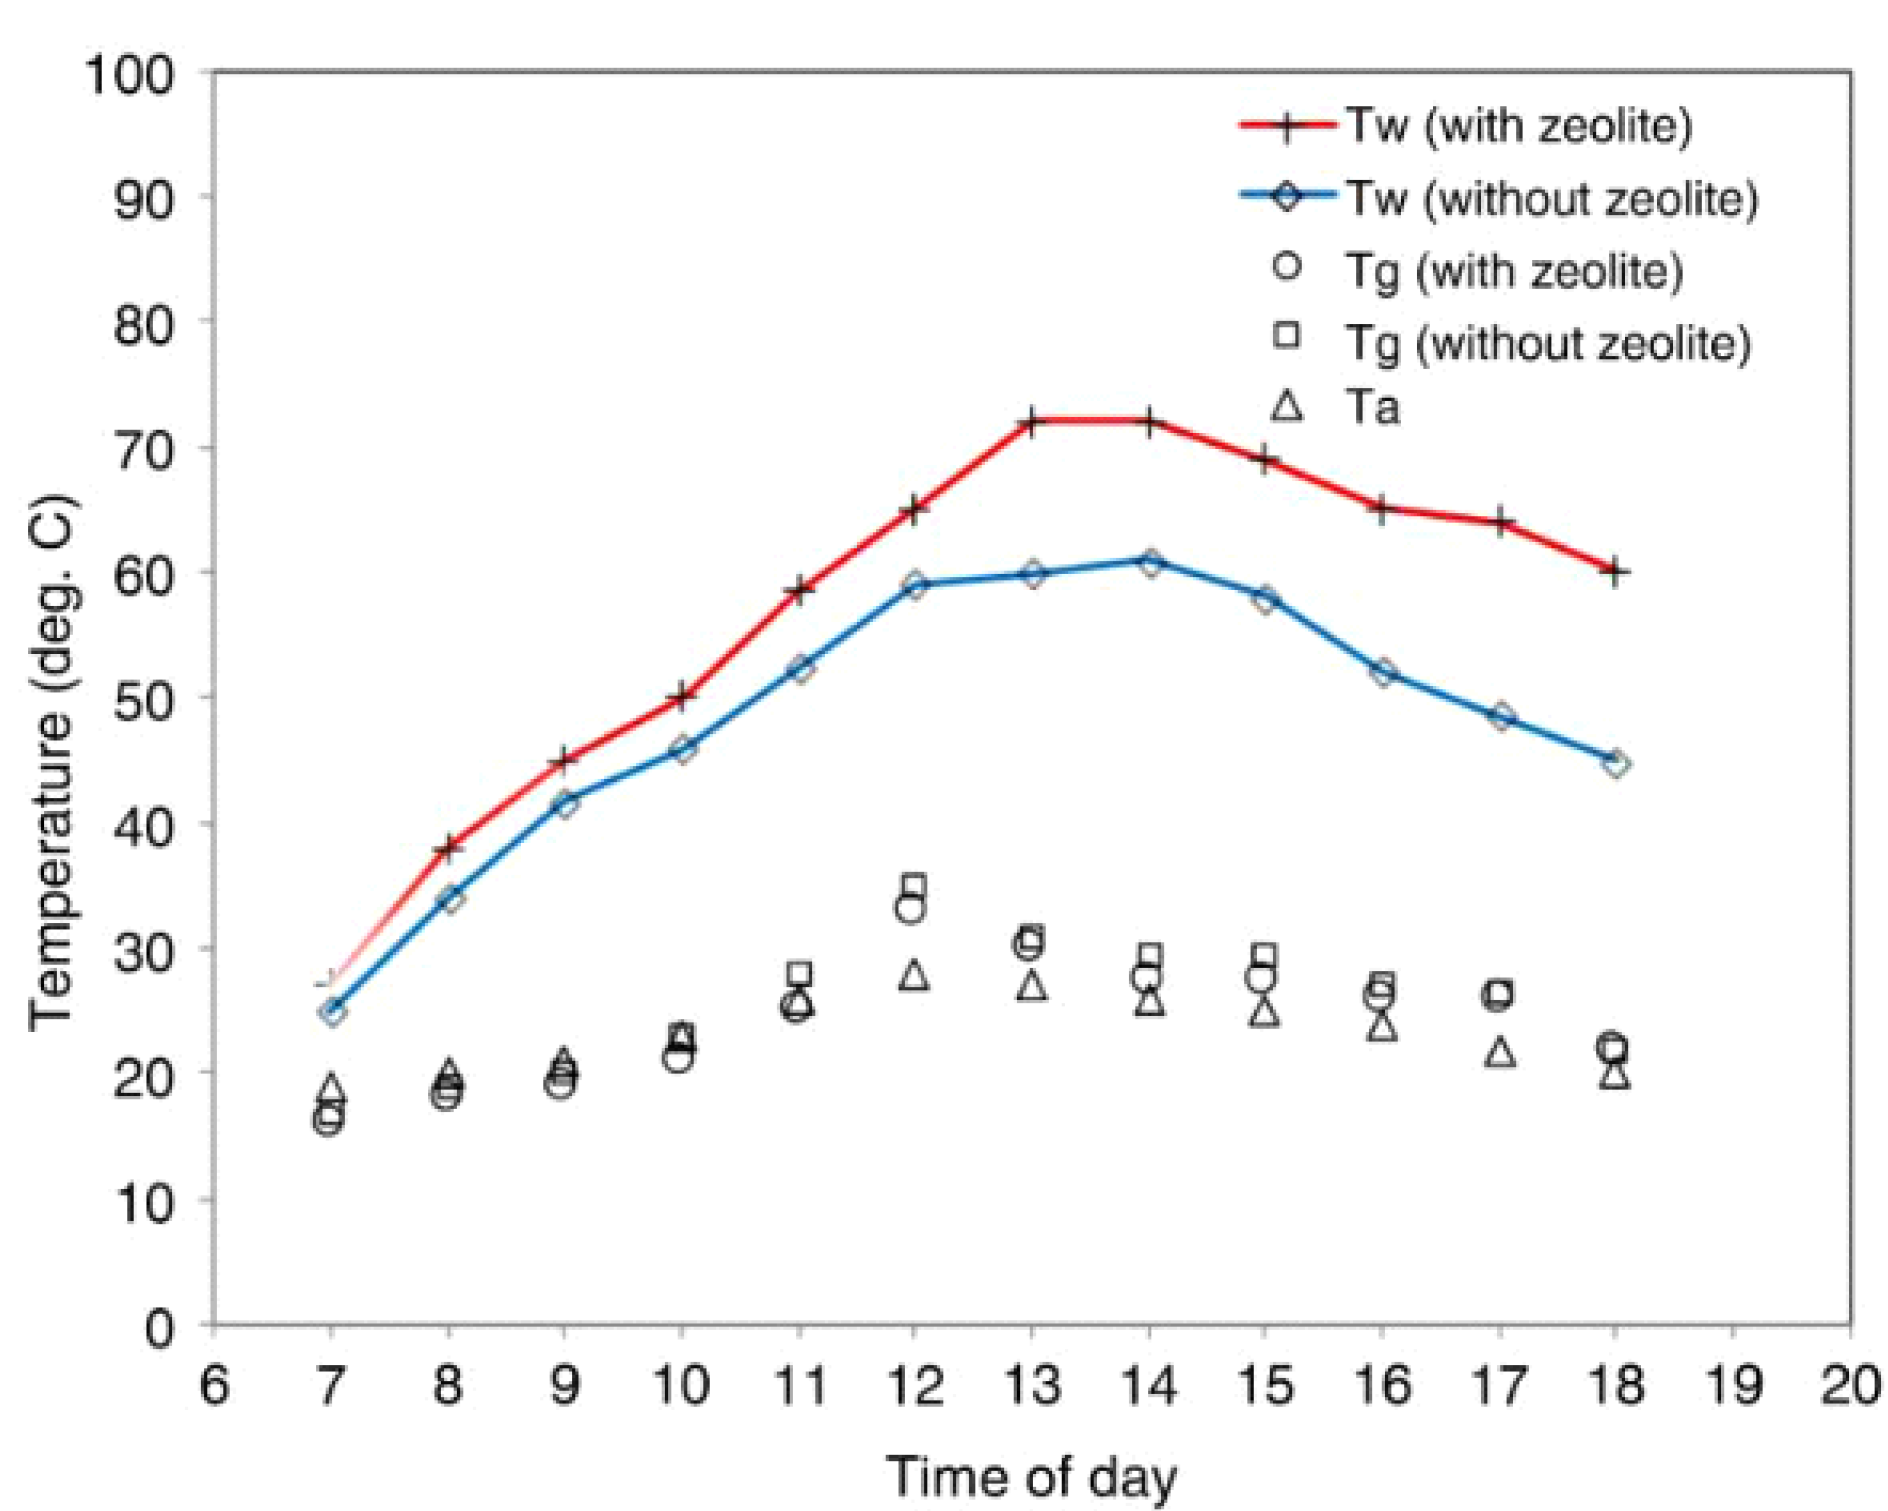
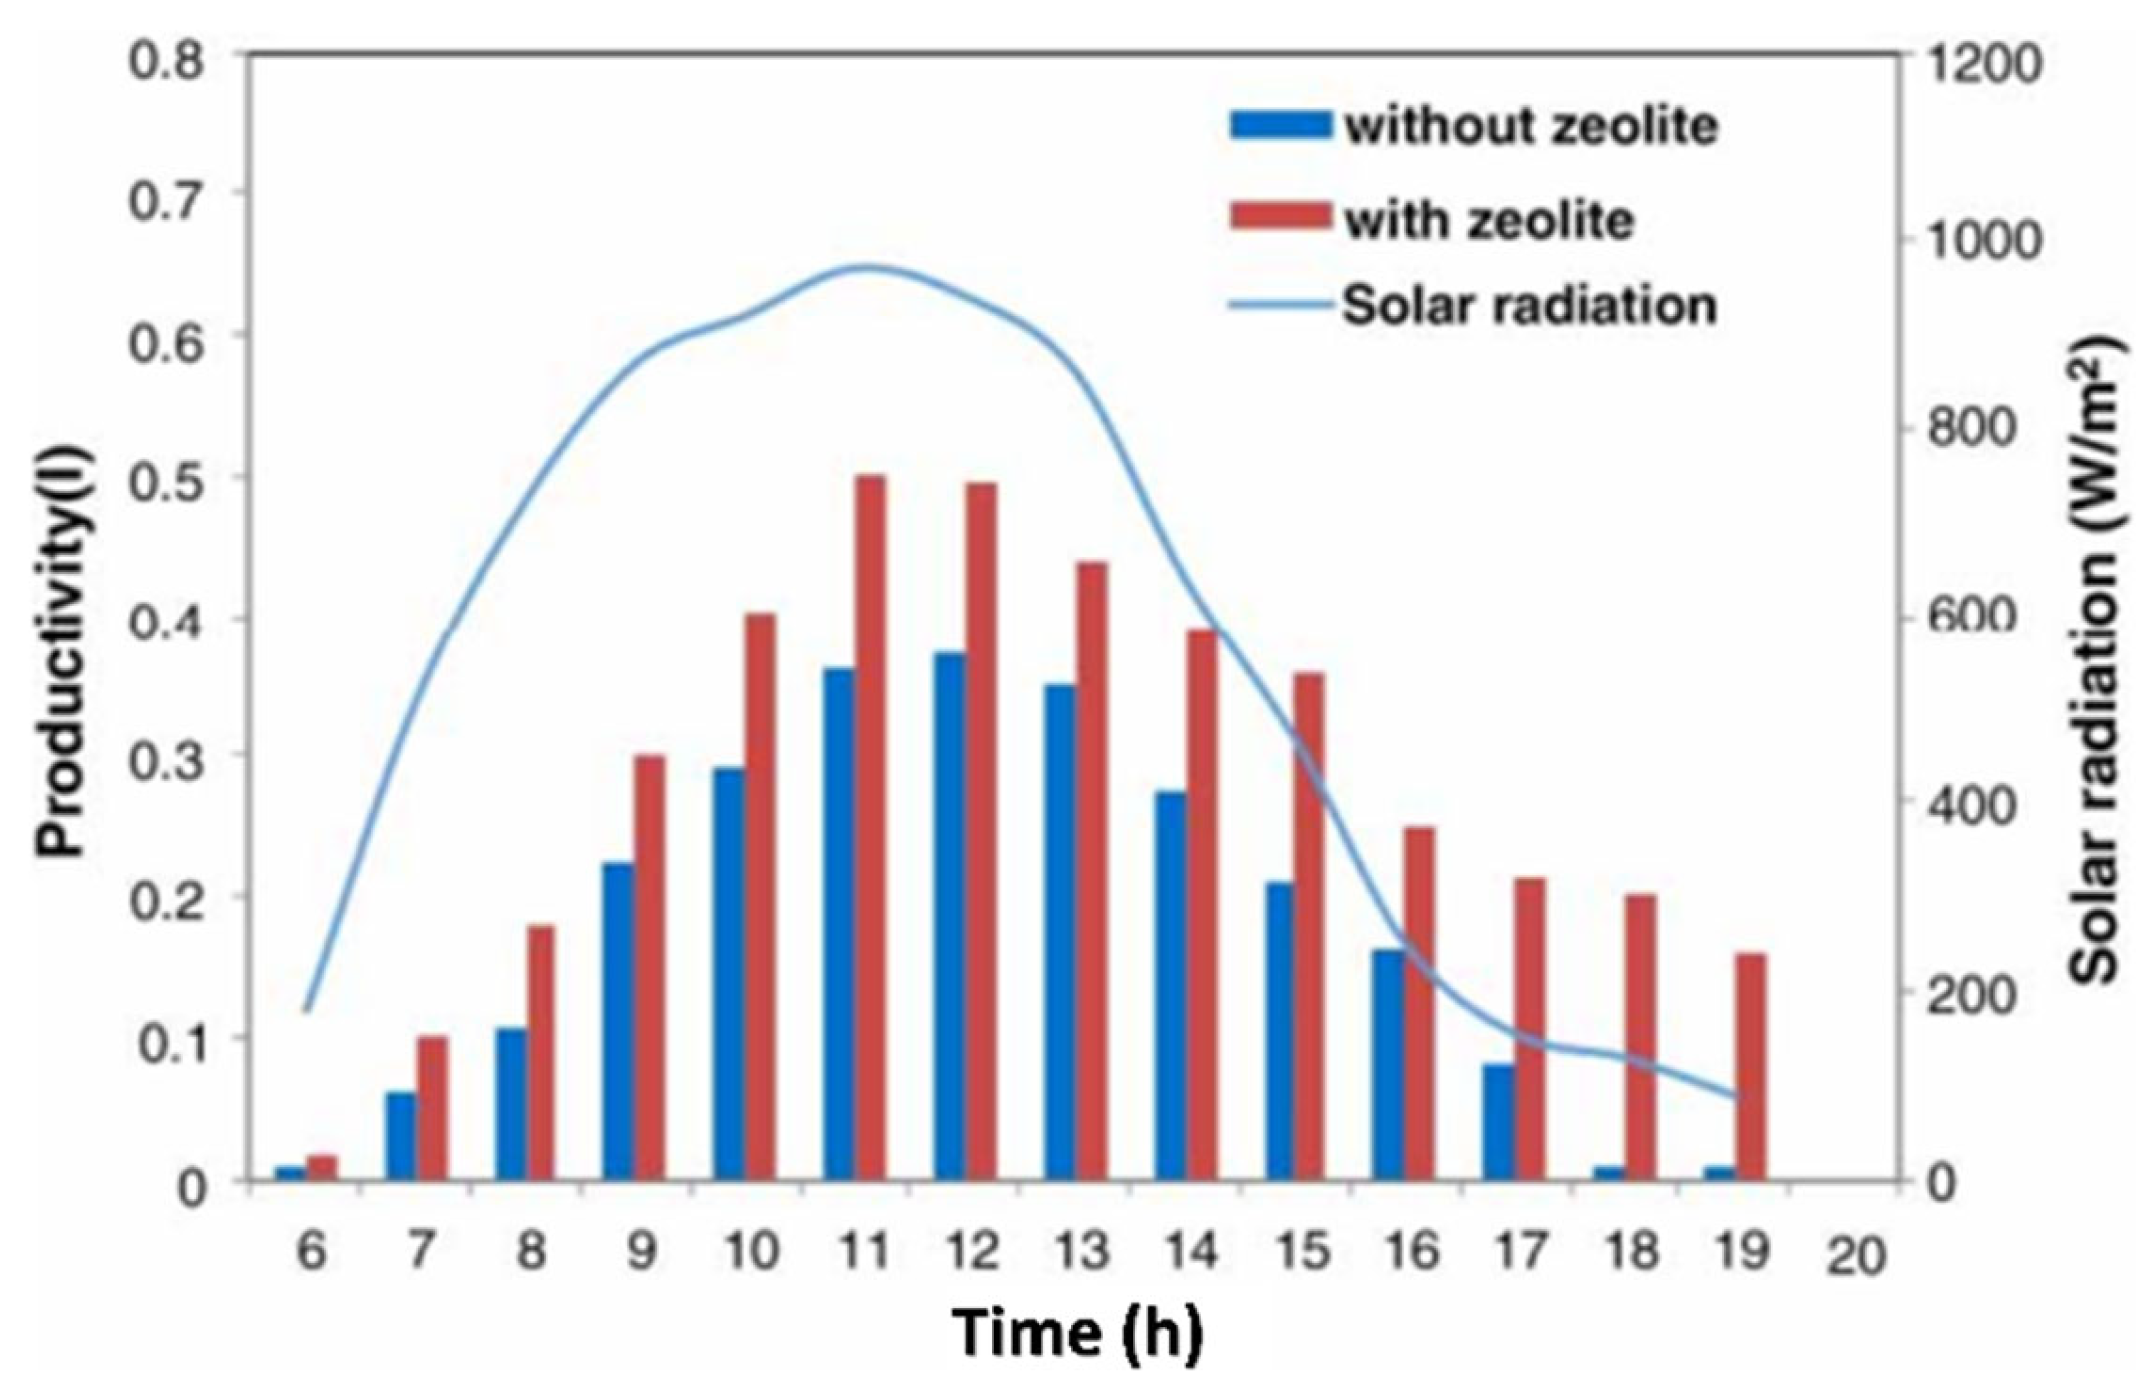
| Experimental and numerical | Pyramid shaped solar still | Ansys Fluent | FVM | 4 cm | Volume of fluid (VOF); two phases | With increasing zeolite particle volume fraction, the deviation of CFD model from experimental data rises (0.05% for φ = 0.0 and 12.3% for φ = 0.05). | Basin water temperature, freshwater productivity, water vapor fraction, and velocity counters | The freshwater productivity can be enhanced by adding zeolite particles. | [57] |
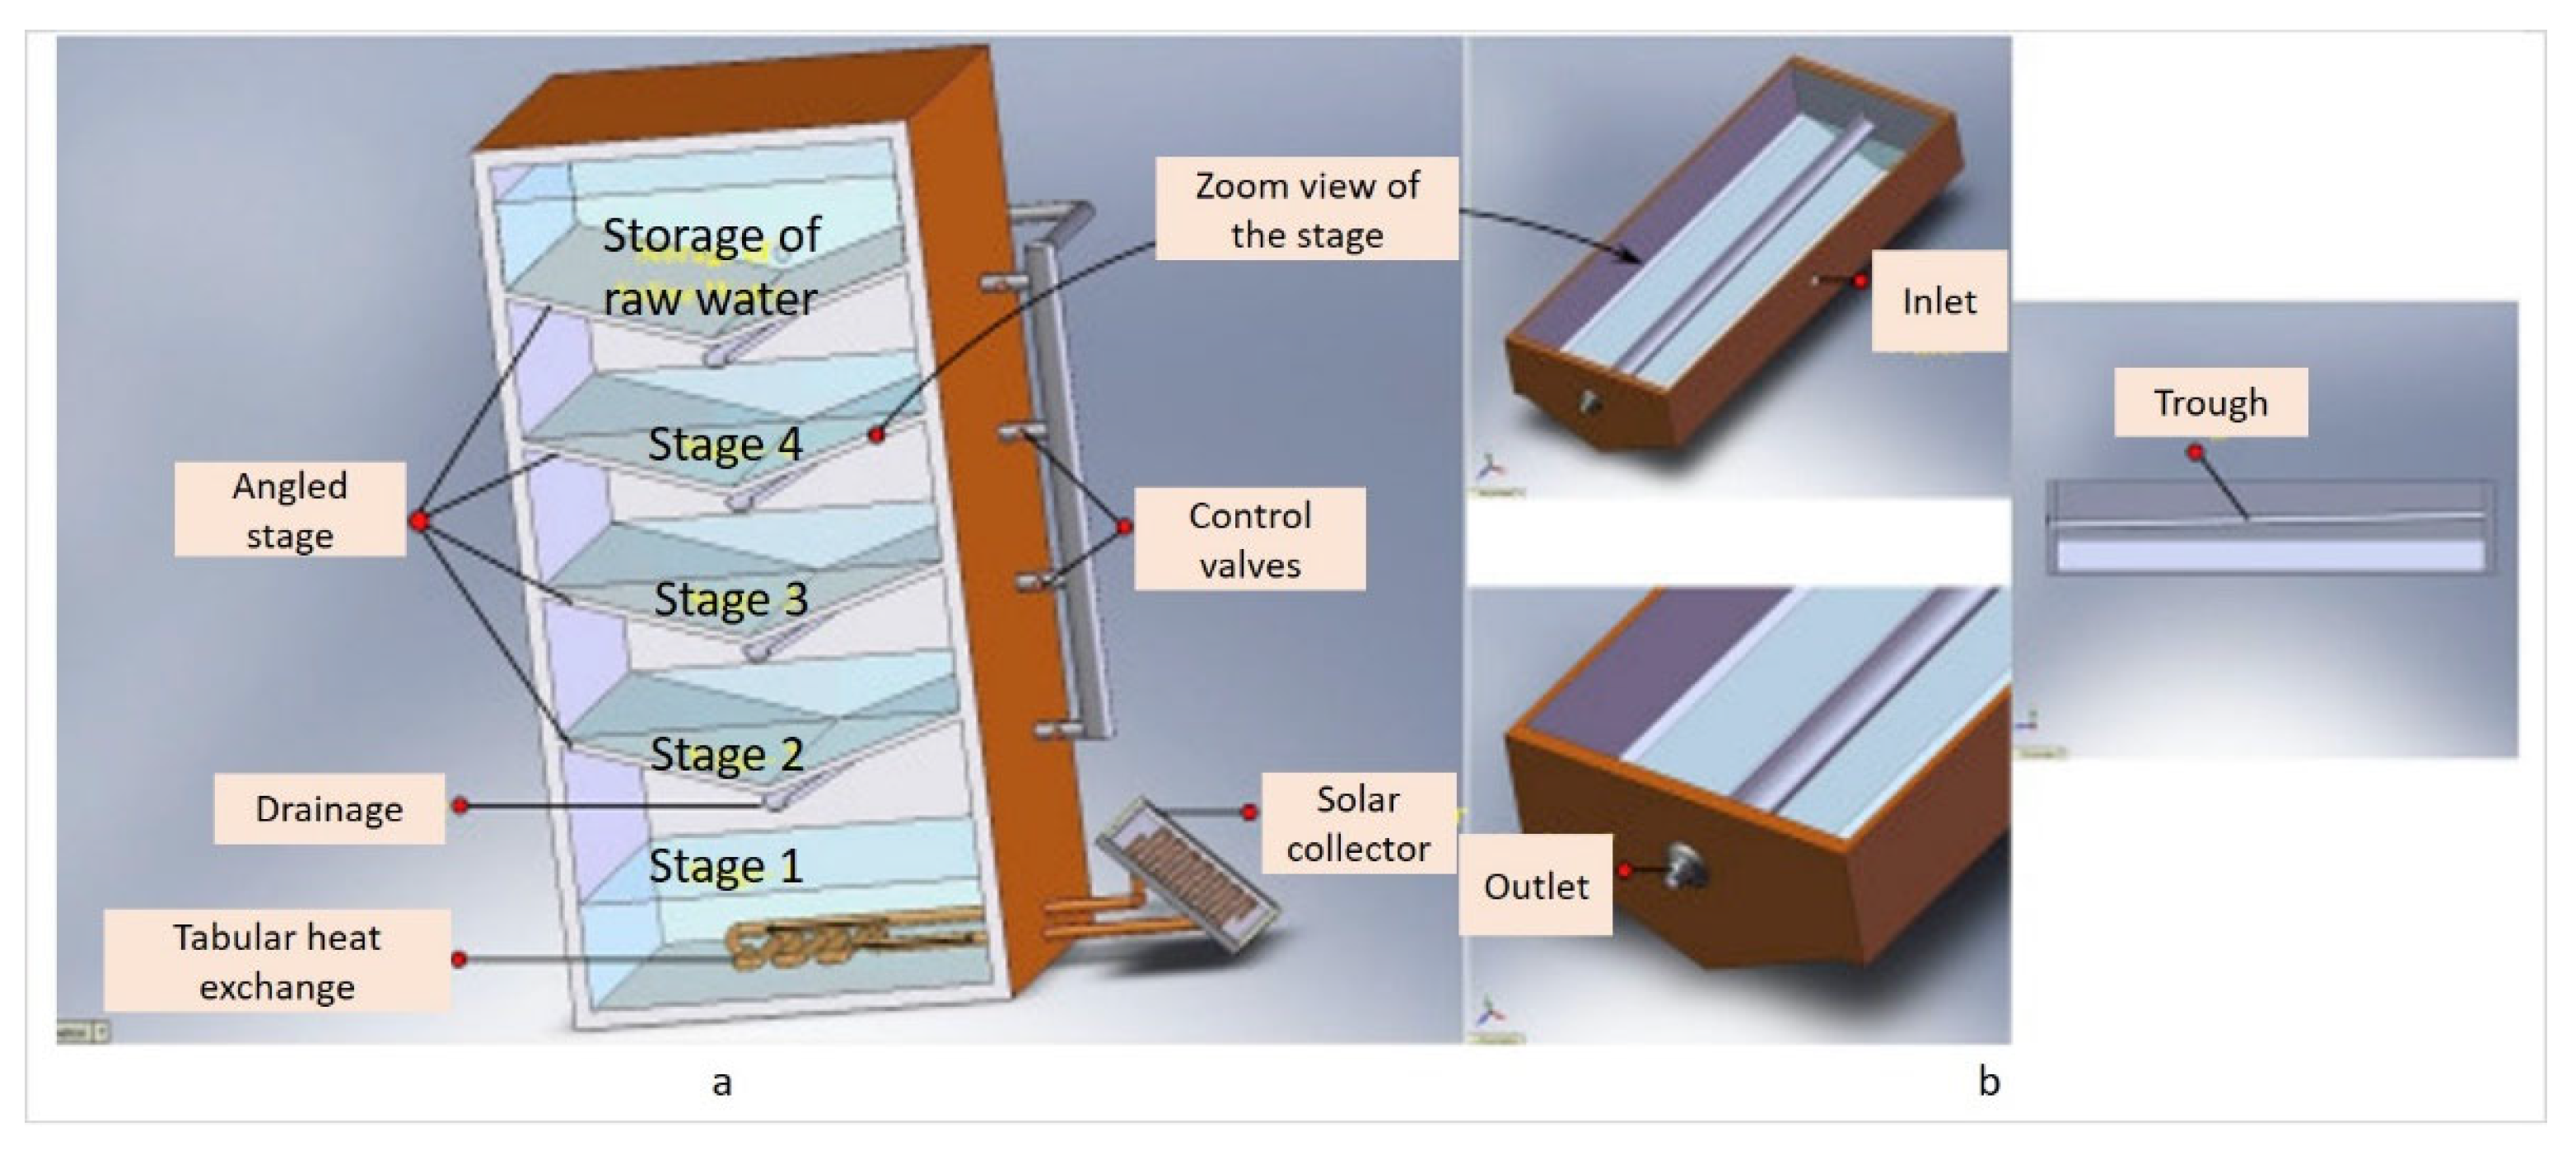
| Design and numerical analysis | Multi-stage solar still (four stages) | Solidworks and Ansys Fluent | FVM | NA | Volume of fluid (VOF); three phases | NA | Temperature and freshwater productivity as a result of thermal radiation term exchange | The four-stage distillation system can operate at high temperatures of roughly 80.96 °C and achieve high freshwater productivity (8.88 kg/day for all stacked stages). | [58] |
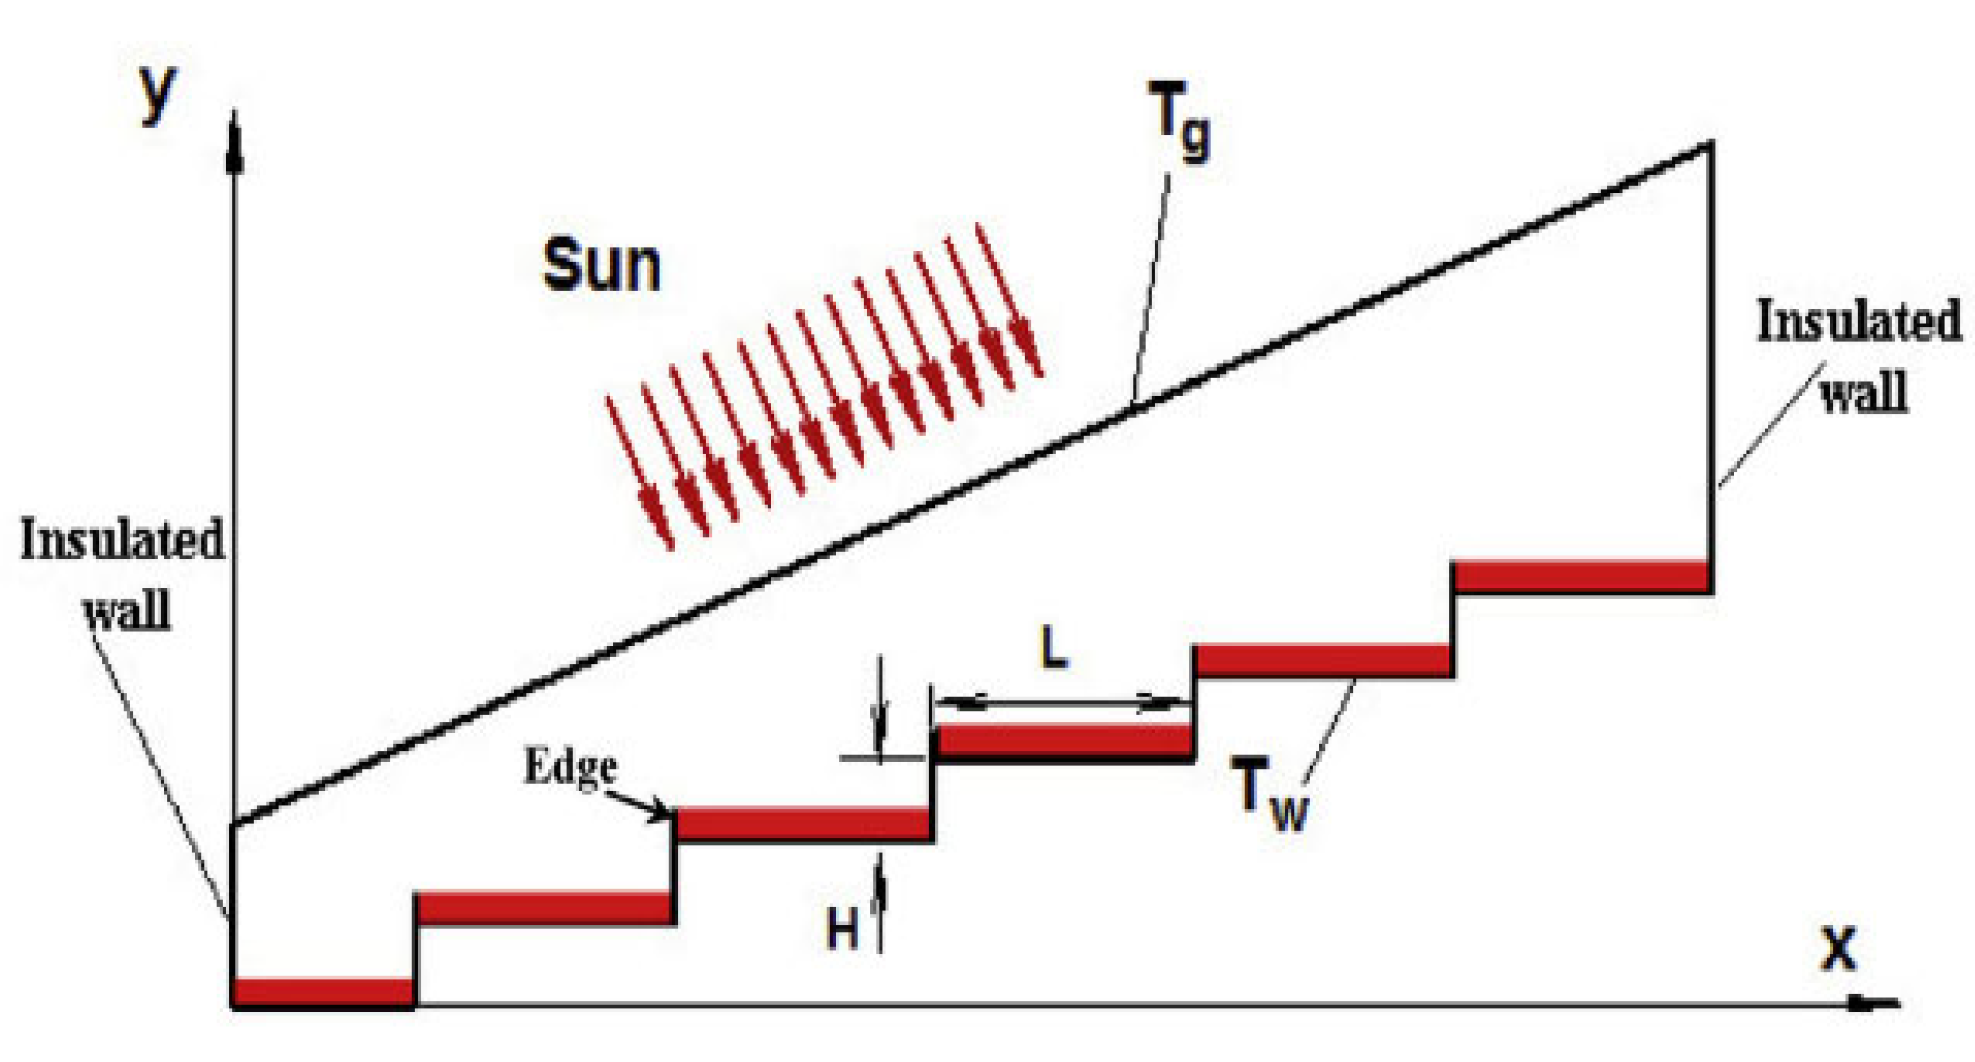
| Numerical analysis | Stepped solar still | Ansys Fluent | FVM | NA | Volume of fluid (VOF); two phases | In compared to the CFD simulation, RSM accurately predicts freshwater hourly productivities with a maximum error of 2.4%. | Percentage of nanoparticles, stepped solar still geometry (length and height), and freshwater hourly productivity | It is shown that raising nanoparticle concentration from 0% to 5% leads to a 22% increase in hourly productivity.When the stair length is increased for medium and high values of the stair height, the sensitivity of the hourly productivity to the stair height improves, but when the stair length is increased for small values of the stair height, it decreases. | [59] |
| Numerical and experimental analysis | Single slope (SS) | Ansys Fluent 11 | FVM | 3 cm | Volume of fluid (VOF); two phases | The simulation and experimental results are quite close. | Freshwater productivity, temperature of the inner glass, outside glass cover temperature, basin water temperature, and vapor temperature | It is found that the freshwater productivity is affected by the temperature of the inner glass, outside glass cover temperature, basin water temperature, and vapor temperature. | [60] |
| Numerical and experimental analysis | Single slope (SS) | Ansys Fluent 15 | FVM | 3 cm | Volume of fluid (VOF); three phases | The simulation results of the CFD show a good agreement with the experimental results. | Water temperature, internal air temperature, inner core temperature, carbon impregnated foam temperature, and freshwater productivity | The freshwater productivity of the SSSS without insulation, SSSS with BW insulation, SSSS-CIF with BW insulation, and conventional solar still with sawdust insulation, respectively, was 1.9 L/m2/day, 2.3 L/m2/day, 3.1 L/m2/day, and 2.2 L/m2/day. | [61] |
| Numerical and experimental analysis | Triangular and tubular solar stills | Ansys Fluent | FVM | NA | Volume of fluid (VOF); three phases | The comparison of the CFD results revealed a maximum error of 6.1% from the experimental results. | Contours of streamlines, isotherms, mass fraction, and local entropy generation inside the solar stills | It is found that the tubular had a 20% advantage over the triangular in terms of performance. | [62] |
| Theoretical, numerical and experimental analysis | Single slope (SS), double slope (DS), stepped, finned and PCM solar stills | Ansys CFX | FVM | 5 cm | Volume of fluid (VOF); two phases | There is a high level of agreement between the simulation and experimental results. | Temperature distributions of water and vapor, and freshwater productivity at 15 and 20 inclination angles of solar stills | It is established that a single slope with a 20° angle and PCM equipment yielded the highest freshwater productivity when compared to other types. | [63] |
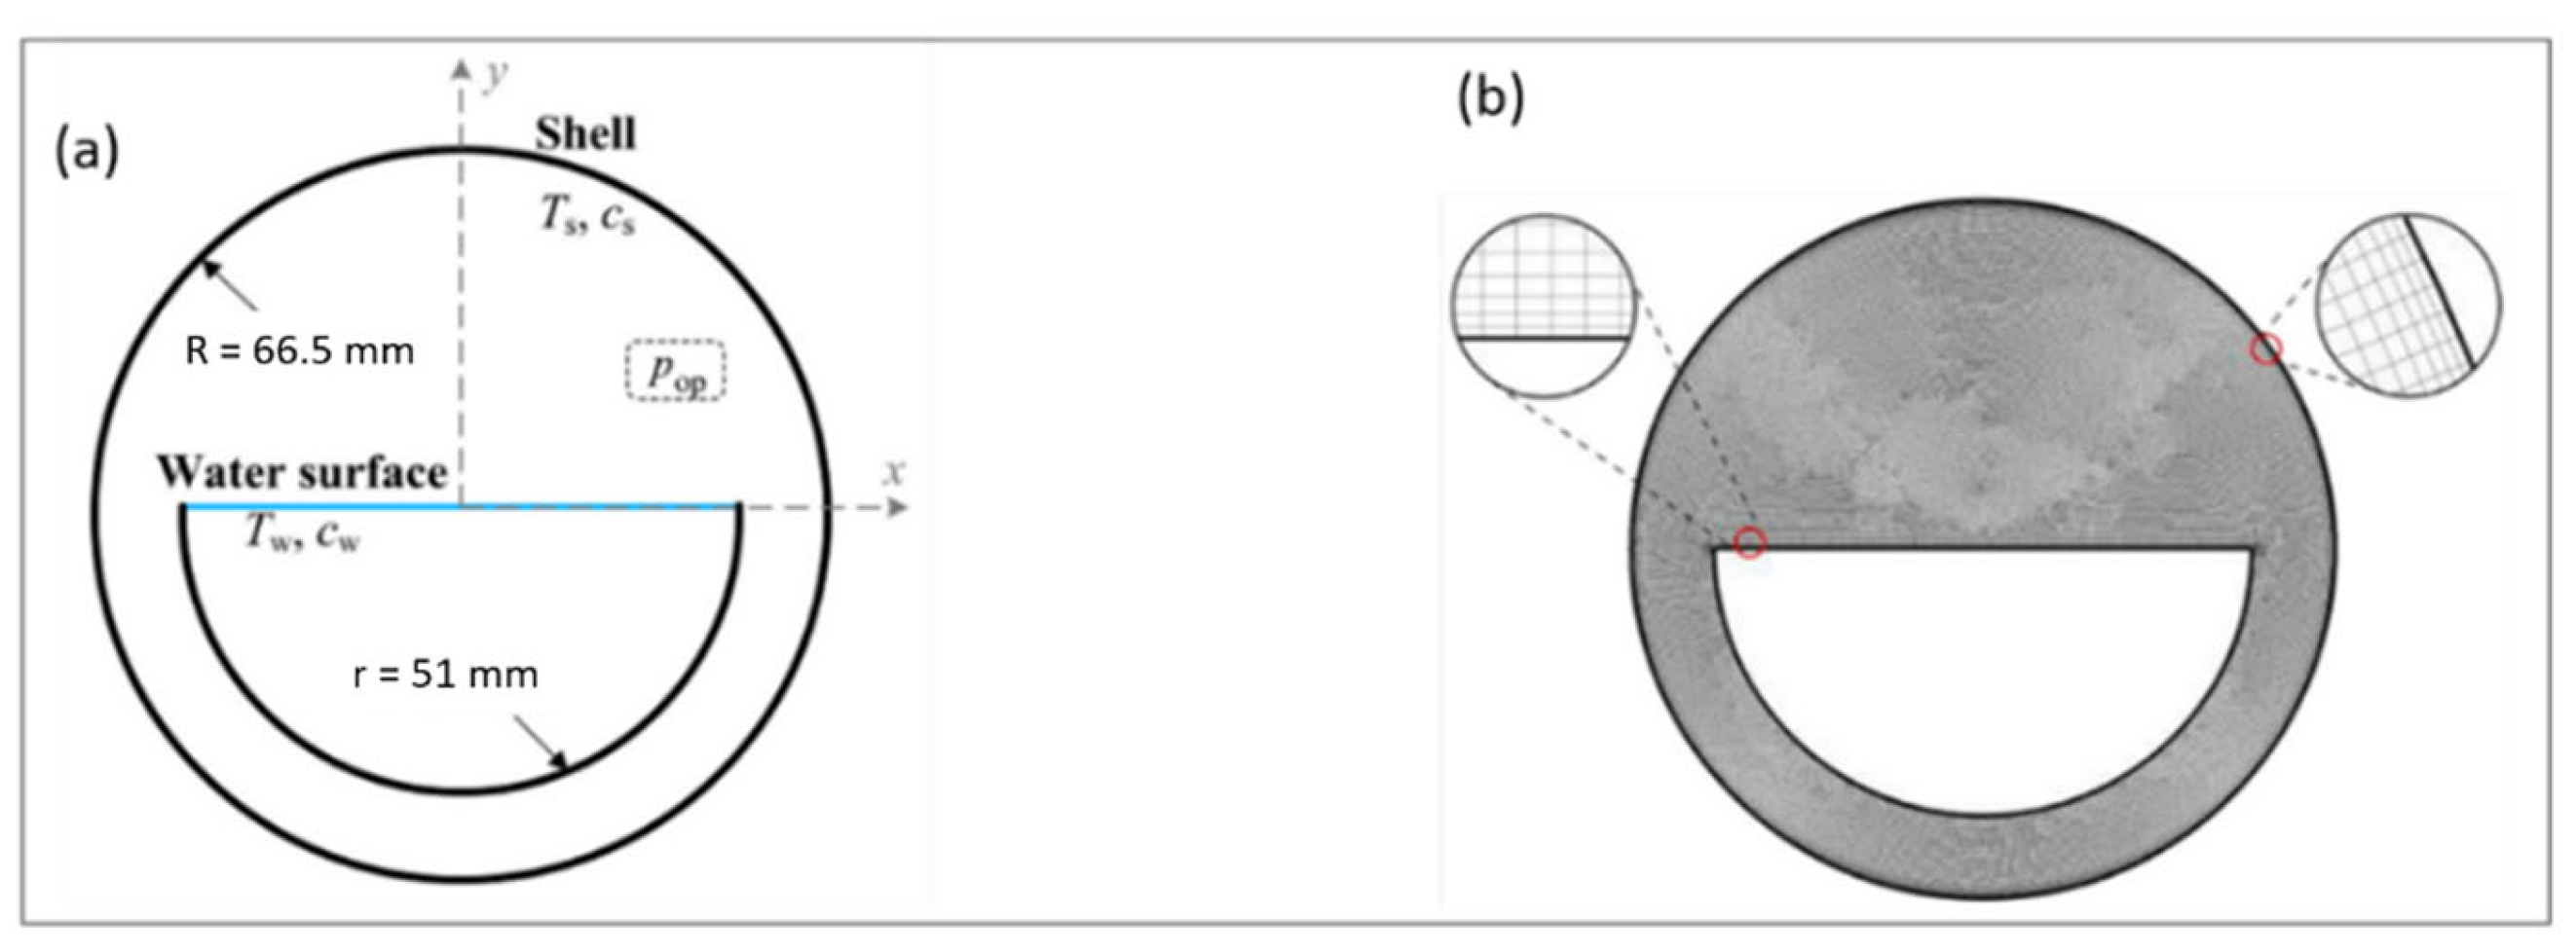
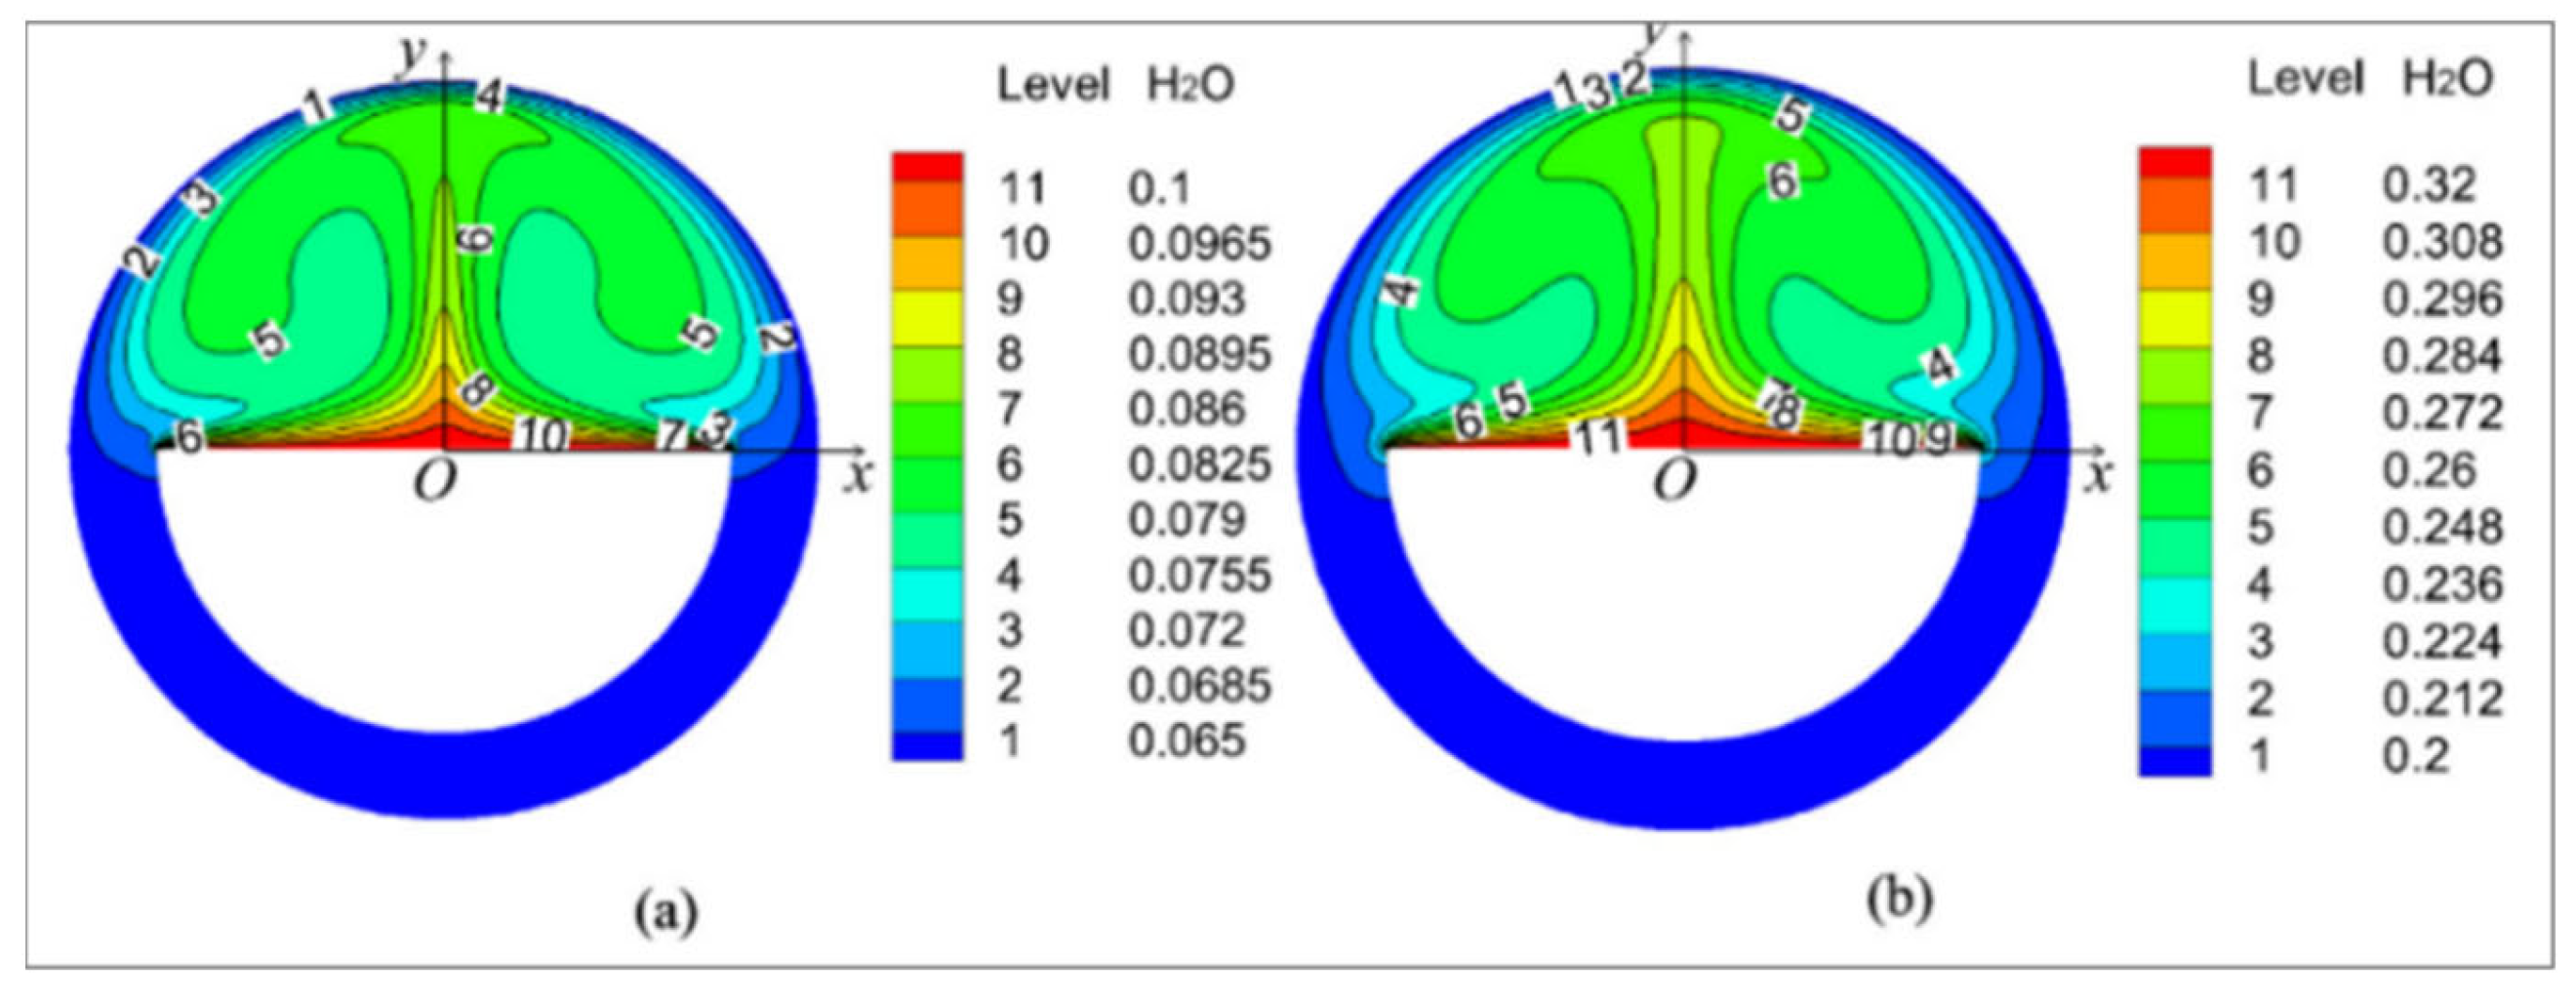
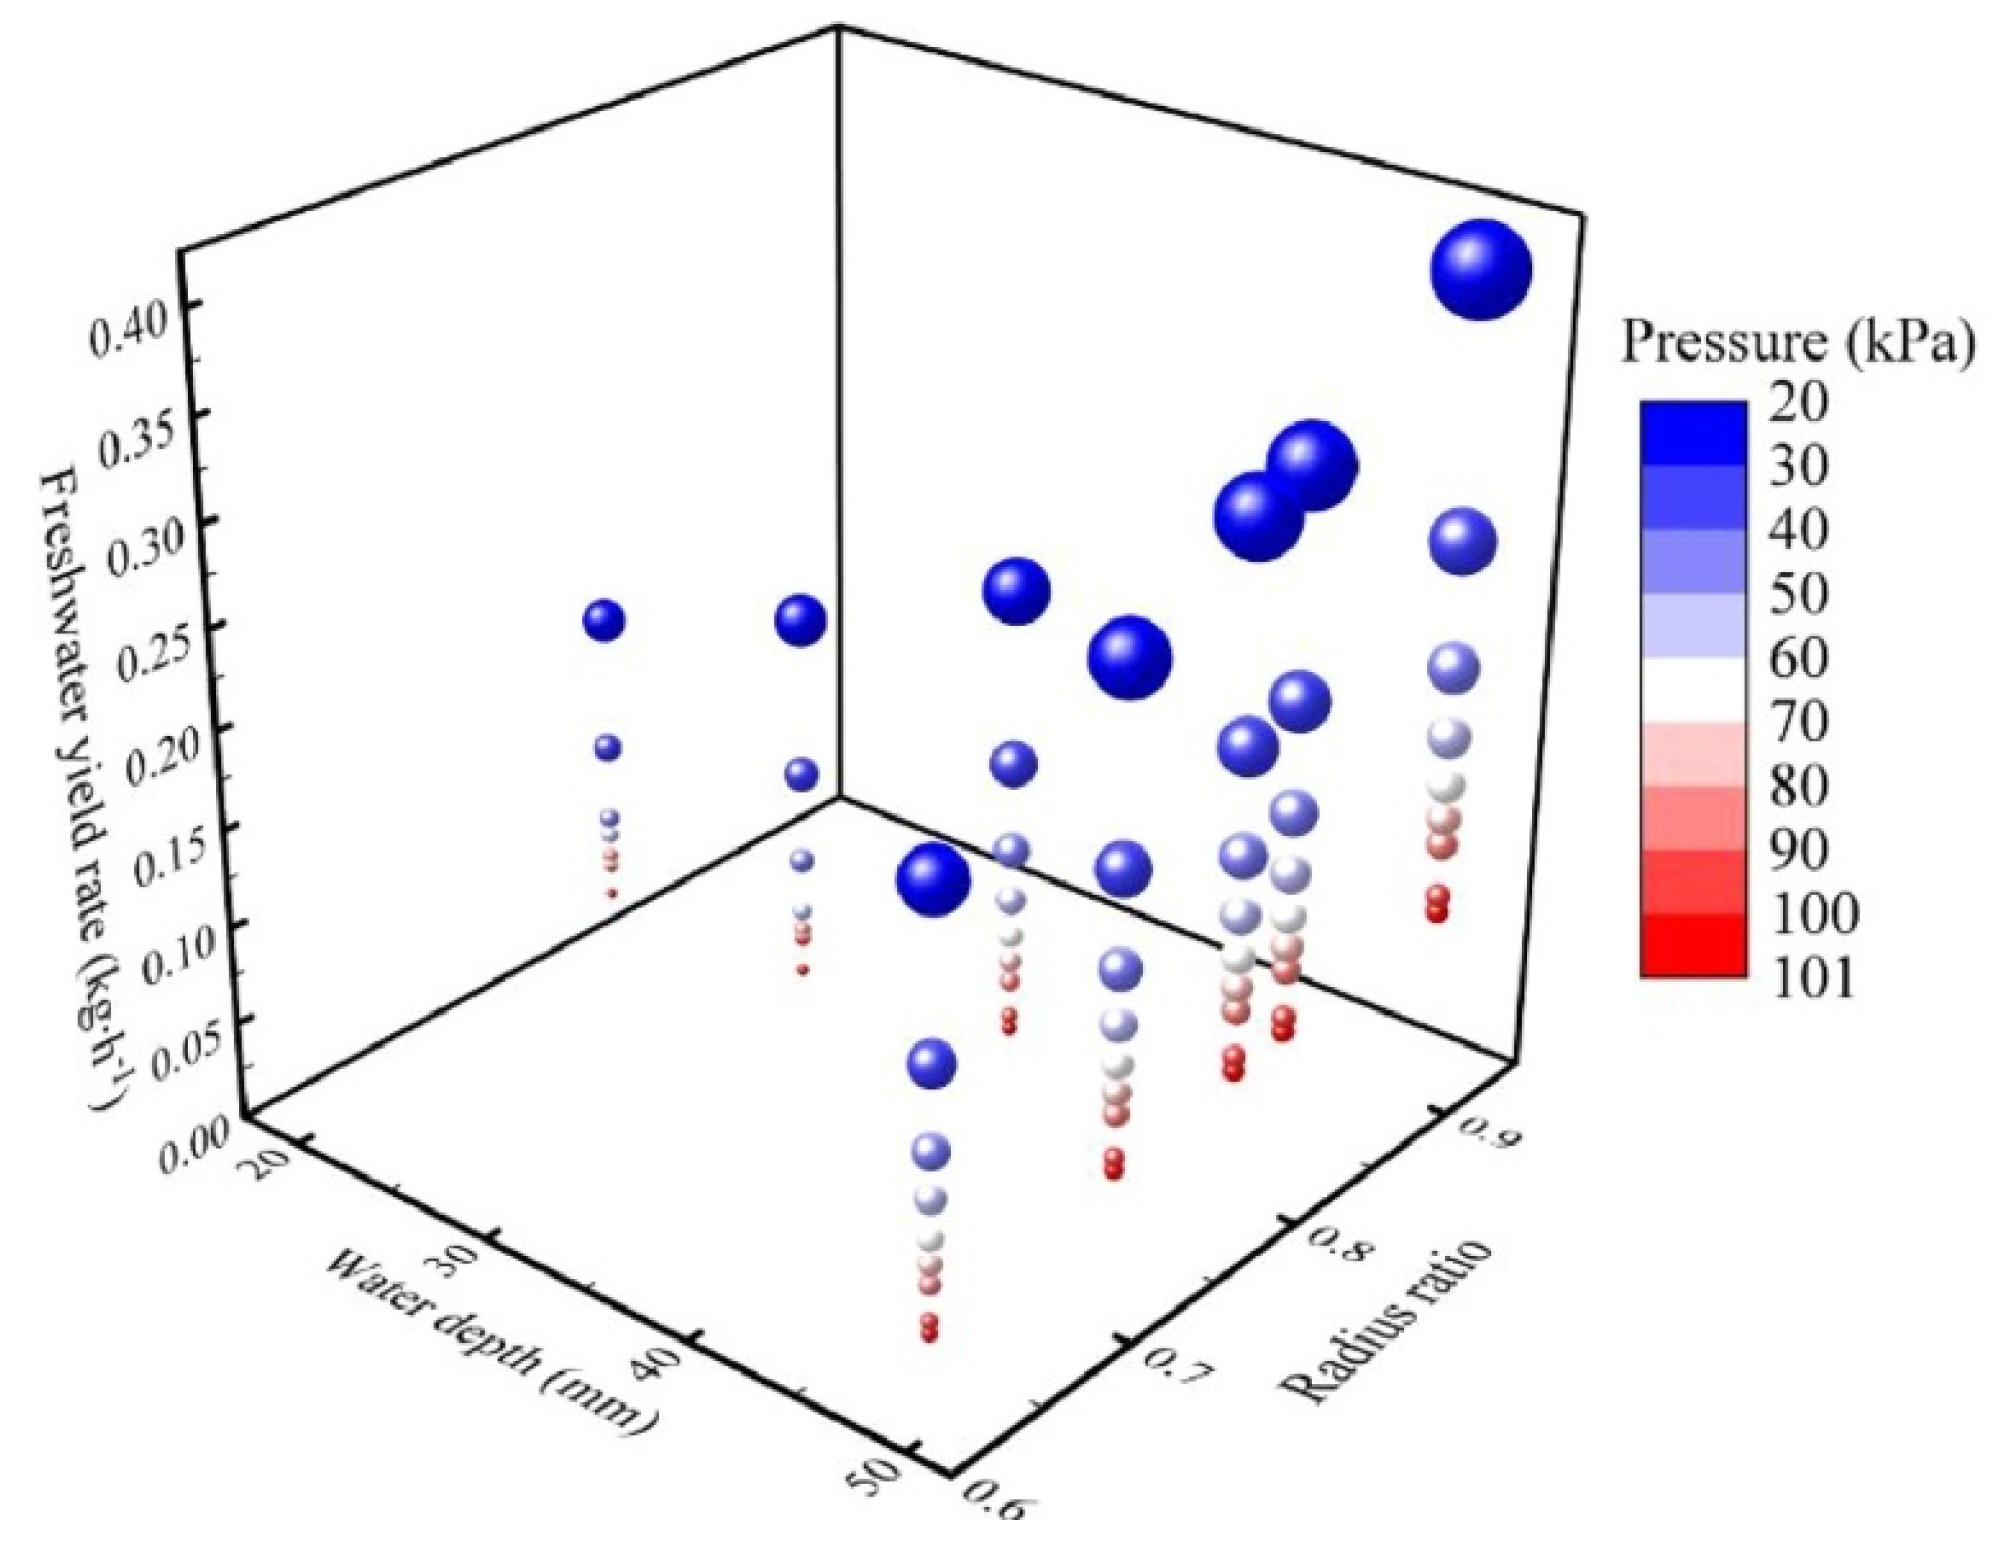
| Numerical and experimental analysis | Tubular Solar Still (TSS) | Ansys Fluent 16 | FVM | 2 cm | Volume of fluid (VOF); three phases | The average and maximum deviations between the experimental and simulated yield rates are 14.1% and 32.4%, respectively. | Operating pressure Pop and geometrical parameters (radius ratio and water depth) on freshwater productivity | At operating pressures less than 60 kPa, the freshwater yield rate was enhanced by more than 50%.The freshwater yield rate reduced by 30% when the water depth was reduced from r to 0.8 r, and by 38% when the radius ratio (r/R) was varied from 0.6 to 0.9 at operating pressure of 20 kPa. | [64] |
| Numerical and experimental analysis | Single slope solar still (SS) | Ansys Fluent | FVM | 5–15 L water | Three phases | In case of the convective, radiative, and total average Nusselt number, the maximum error is 2.8% compared with literature. | Water depth, materials of basin, and radiation intensities | With less water depth, freshwater productivity is increased.By adding a blackened baseliner to the basin and using reflecting glasses to maximize incident solar radiation, the still’s efficiency is further improved. | [66] |
| Numerical analysis | Single slope solar still (SS) | ANSYS 17.1, CFX | FVM | NA | NA | Yes, 0.6–14% difference is found between experiments and CFD model’s output. | Internal temperature, productivity, and transfer coefficient | The radiation is the main factor in high efficiency, although freshwater productivity can also be impacted by wind speed and ambient temperature. | [67] |
| Numerical and experimental analysis | Single slope solar still (SS) | Ansys Fluent | FVM | NA | Three phases approach | Yes. The difference between experimental and numerical approaches is 8.7% in terms of daily productivity. | Design parameters on performance of a solar still | The produced water volume found to be 1.03 L which was collected between 9 AM and 5 PM. | [68] |
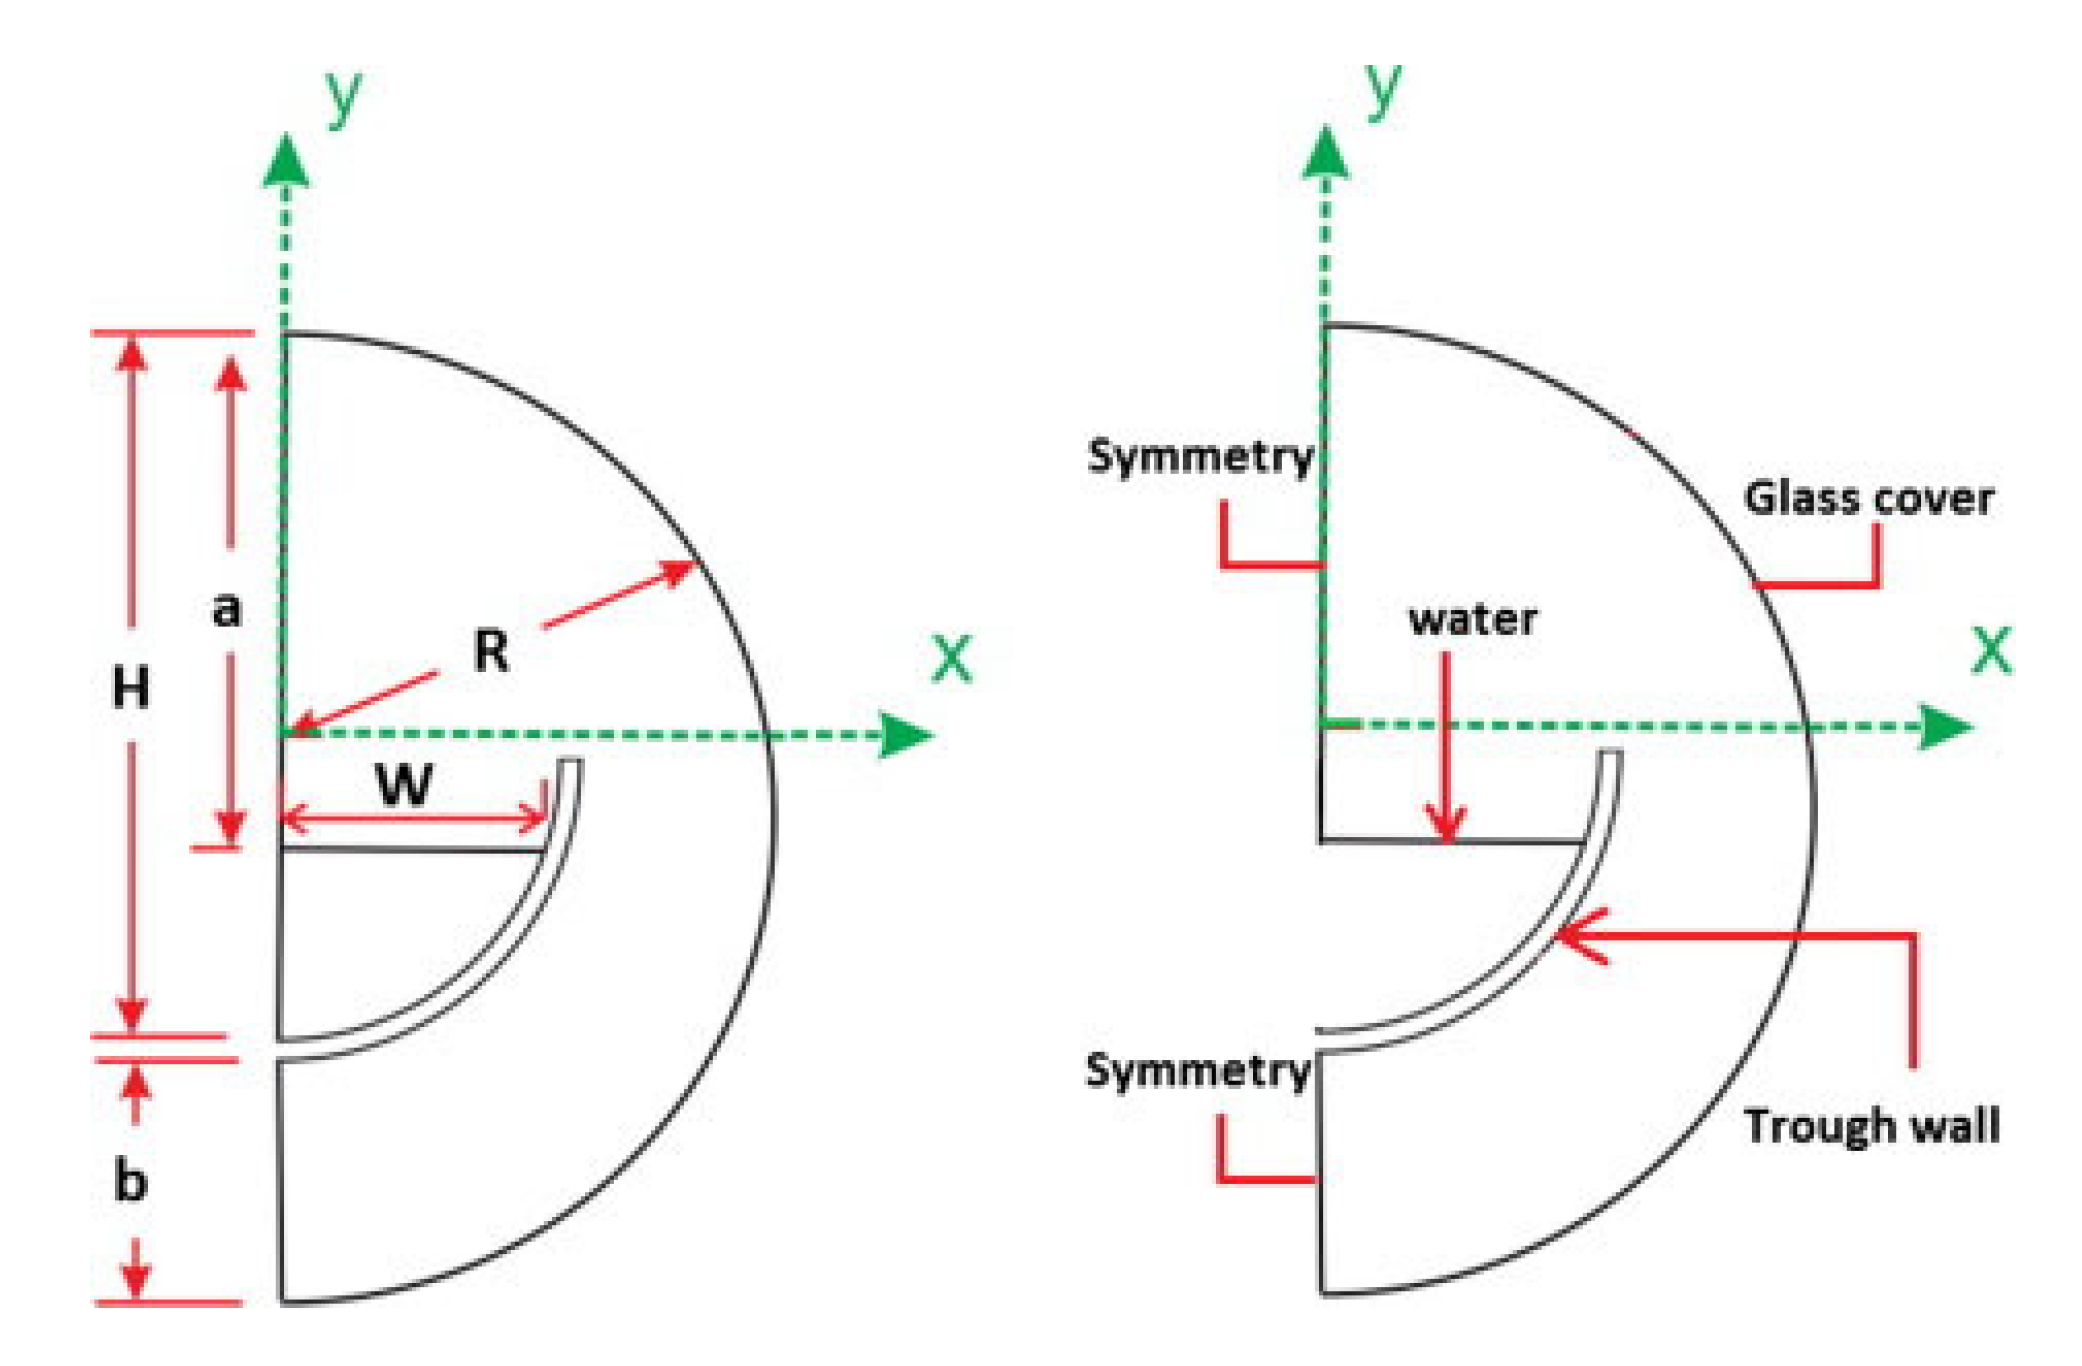
| Numerical analysis | Single slope solar still (SS) and tubular solar still | Ansys Workbench | FVM | 2 cm | VOF -two dimensional | The variation ranges from 2.8 to 0.95% between experimental and CFD studies. | Analyzing the effectiveness of each design and considering the impact of temperature variations caused on by modifications to the basin’s geometry. | The curved water basin should be at 1/2 of the still’s diameter for higher Rayleigh numbers for the solar still to function well. The tubular still with a linear basin at D/2 dissipates 31.4% more heat than conventional stills (SS). This results in a higher rate of solar still fresh water productivity at higher Rayleigh numbers. | [69] |
| Numerical and experimental analysis | Single stepped slope solar still | Ansys Fluent | FVM | 1–4 cm | VOF | Very good agreement between the numerical model and experimental data. | Wind speed, glass cover thickness, water depth, water to cover distance, and cover inclination. | When the wind speed is increased from 1 m/s to 6 m/s, productivity increases by 14.4%, and when the glass thickness is decreased from 4 mm to 2 mm, productivity improves by 3.5%. While the cover tilt is equal to the angle of the local latitude, the ideal values of water depth and water to cover distance are identified to be 2 and 8 cm, respectively. Moreover, freshwater productivity rises by roughly 17.4% when the basin solar still is changed to the suitable stepped solar still. | [70] |
| Numerical and experimental analysis | Double slope solar still (DSSS) | ANSYS Fluent | FVM | N/A | Three-dimensional | The simulation results deviate from 5 to 13%. | Glass cover temperature, surface water temperature, basin temperature, ambient temperature, and solar intensity | While a CFD modeling result shows 0.50 L/m2/day, experimental investigation indicates that the total amount of distilled water is around 0.46 L/m2/day. Therefore, there is good agreement between the simulated findings and the experimental distillate yield data. | [71] |
| Numerical analysis | Axisymmetric shape column solar still | FLUENT | PRESTO | N/A | Three-phase three-dimensional model | NA | Pressure, velocity, and temperature of the integrated system | After the geometric dimensions are optimized, the airflow characteristics in the collector minimally change, thus the freshwater productivity in the still is not much impacted. | [72] |
| Numerical analysis | Double slope solar still (DSSS) | CFD | SIMPLE | NA | Three dimensional | Yes. The difference in results for both models is less than 25%. The error of the results is 15.33% compared to the filed data. | Intensity and direction of solar radiation and temperature gradient | The rate of freshwater productivity rises as solar radiation increases in intensity, and vice versa.The freshwater productivity may be increased by 15% to 62% by installing a thermoelectric coolng system (TEC) over a portion of the glass, according to research. | [73] |
Publisher’s Note: MDPI stays neutral with regard to jurisdictional claims in published maps and institutional affiliations. |
© 2022 by the authors. Licensee MDPI, Basel, Switzerland. This article is an open access article distributed under the terms and conditions of the Creative Commons Attribution (CC BY) license (https://creativecommons.org/licenses/by/4.0/).
Share and Cite
AlSaleem, S.S.; Al-Qadami, E.; Korany, H.Z.; Shafiquzzaman, M.; Haider, H.; Ahsan, A.; Alresheedi, M.; AlGhafis, A.; AlHarbi, A. Computational Fluid Dynamic Applications for Solar Stills Efficiency Assessment: A Review. Sustainability 2022, 14, 10700. https://doi.org/10.3390/su141710700
AlSaleem SS, Al-Qadami E, Korany HZ, Shafiquzzaman M, Haider H, Ahsan A, Alresheedi M, AlGhafis A, AlHarbi A. Computational Fluid Dynamic Applications for Solar Stills Efficiency Assessment: A Review. Sustainability. 2022; 14(17):10700. https://doi.org/10.3390/su141710700
Chicago/Turabian StyleAlSaleem, Saleem S., Ebrahim Al-Qadami, Hussein Zein Korany, Md. Shafiquzzaman, Husnain Haider, Amimul Ahsan, Mohammad Alresheedi, Abdullah AlGhafis, and Abdulaziz AlHarbi. 2022. "Computational Fluid Dynamic Applications for Solar Stills Efficiency Assessment: A Review" Sustainability 14, no. 17: 10700. https://doi.org/10.3390/su141710700
APA StyleAlSaleem, S. S., Al-Qadami, E., Korany, H. Z., Shafiquzzaman, M., Haider, H., Ahsan, A., Alresheedi, M., AlGhafis, A., & AlHarbi, A. (2022). Computational Fluid Dynamic Applications for Solar Stills Efficiency Assessment: A Review. Sustainability, 14(17), 10700. https://doi.org/10.3390/su141710700