1. Introduction
The United Nations’ Member States approved the 17 Goals as part of the 2030 International Agenda for Sustainable Development, with the main objective of interrelating three basic elements: economic growth, social inclusion, and environmental protection. This research focuses on the protection of the environment, which is linked with the elements mentioned above. Over the years, we have seen how collaborative work between international entities generates actions to protect the environment, as some organizations have done, such as: FAOSTAT, UN Comtrade, and the International Energy Agency. These organizations have generated global data about many countries published by Footprint and Accounts [
1]. This paper will consider the data and concepts that include the Footprint Network for Biocapacity (BC) and Ecological Footprint (EF) in five continents.
Throughout history, there has been evidence of human sagacity to promote the use of renewable and non-renewable natural resources. Regarding these concepts, a contextualization is proposed drawing on relevant studies in recent years. In light of the literature, certain academic works stand out by going beyond mere understanding to comprehend, develop, and implement strategies to reduce EF and take advantage of BC awareness.
Based on the vast need to act on those opportunities, the main contribution of this work is to predict the behavior of BC and EF, using sophisticated techniques with artificial intelligence to forecast environmental changes. One of these tools is artificial neural networks (ANN), a method that has been gaining popularity for solving complex problems in different research areas. Its key advantages over traditional methods include ease of use, logical simplicity, the capability to solve complex non-linear relationships among variables, high speed, and easy feature extraction.
It allows us to identify trends to design new business models based and centered on environment and people, conducive to innovative and sustainable business, considering BC and EF worldwide and aligned with Sustainable Development Goals (SDGs). It emphasizes that sustainable development aims at greater opportunities for reduction of inequalities, improvements in basic living standards, promotion of equitable and inclusive social development, and the integrated and sustainable management of natural resources and ecosystems.
Thus, this work is structured as follows:
Section 2 provides the literature review.
Section 3 explains the paper’s methodology.
Section 4 discusses results.
Section 5 presents conclusions. With respect to the background presented above, in the next section, the concepts of EF and BC will be used to display and interpret the data, as well as the algorithms used to process them.
2. Literature Review
According to Wackernagel and Rees (1997), sustainable development emerges from the natural capital aligning with the term of production as an essential factor. They created a procedure that represents critical natural capital requirements of a defined economy or population in terms of the corresponding ecologically productive areas called ‘ecological footprint’ [
1], i.e., Wackernagel and Rees (1998) consider the fluxes of matter and energy into and out of any specified economy and converts them into the matching natural land and water areas needed to support those flows [
2]. Thus, ecological footprint (Rees, 2018) measures the area of biologically productive land and water that an individual, a population, or an activity needs to produce, all the resources they consume, and the generated waste they absorb using technology and management practices resources―i.e., it calculates the amount of biologically productive land and water required to produce renewable resources for a human population [
1,
2]. It is an aggregate indicator that translates various resource use types to a single spatial unit—a
gha—and focuses on the following territories: fishing grounds, grazing land, cropland, forest land (includes carbon footprint), and built land [
3]. Economic growth increases the EF, which contributes to environmental degradation [
4]. Contemporary socio-environmental issues such as reduced natural resource availability, biodiversity loss, soil degradation, pollution, unprecedented population growth, mass migration to cities, and urban sprawl may be linked to the consequences of an economic infinite growth paradigm on a finite planet. Despite international goals to improve spatial and environmental management, current and future developments are constantly planned without regard for biophysical growth limits [
5].
Secondly, biocapacity is understood as the capacity ecosystems must generate for what human beings demand from land surfaces as they identify new mechanisms that allow them to be recognized as a source of wealth and as they protect ecological assets. BC is measured in global hectares (hereinafter, gha), and focuses on the following territories: fishing grounds, grazing land, cropland, forest land, and built land.
Another relevant concept is ecological deficit. Ecological deficit is generated when the EF of a certain population exceeds the BC of an active area for that population―in other words, when a country is importing BC using the market, liquidating national ecological assets, or emitting carbon dioxide waste into the atmosphere [
3]. These concepts of environmental sustainability for survival in the world require biologically productive surfaces that allow the generation of all the resources consumed by the population and, at the same time, the ability to absorb the waste. In this regard, in Pakistan, they carried out a study that allows identifying the most important aspects that environmental economists and policymakers must address [
4].
Niccolucci et al. (2012) found that the capacities of natural resources were seriously affected, so they began to study the basic requirements of a society for the decrease of its polluting axes, which established the need for metrics that would highlight the sustainable tendencies of its territories. The fundamental problem of these controls was to measure the land without considering the urban and agricultural evolution, so that the decades of urbanization and the pace of population growth limited the axis of action to sustainable policies, which had a strong impact on the social and cultural needs of the people [
5].
Progressive scarcity forced countries to make use of their natural resources to generate profits more efficiently, which set an important trend in economic development. This behavior seemed to set a dependence between pollutant emissions and countries’ gross profits, which is theoretically described as the environmental Kuznets curve, an inverted u-shaped curve that established how pollutant emissions were dependent on gross domestic income.
Wang, et al. (2013) broke the myth of the Kuznets curve, however, if significant correlations were obtained between the ecological footprint and the profit acquired by countries, assuming that, in effect, both phenomena grew equivalently [
6,
7,
8].
Gao and Tian. (2016) described the ecological deficit of countries based on the quantification of biocapacity contrasted with the ecological footprint not only in forest lands, but also based on urbanization and the effect of the carbon footprint, generating an important alert to the institutions of the territories most affected by pollution when trying to generate an economic balance based on quantification [
9].
Cumming and Cramon (2018) affirm that all countries must assess their actual strategic territorial development plans with the purpose to avoid land eradication for agriculture, wildlife, and plant life. The constant construction of built areas indiscriminately reduces the EF [
10]. Therefore, policymakers through tax reforms for construction companies and environmental tax payments help to raise awareness from the government, while citizen actions such as reduction of high consumption and learning about environmental consequences of daily actions to reduce negative impact, all contribute to reduction.
For their part, Ahmad et al. (2020) demonstrate the critical implications in the relationship between the uncontrolled use of natural resources and Ecological Footprint [
11]. To meet the objectives of their research, scholars used the Environment Kuznets Curve. The results obtained for this year indicate how the pollution section has been controlled thanks to technological advances in developed countries, so that on this occasion, the theory could be applied to structure and highlight the importance of technological innovations to combat environmental degradation, the design of policies for the restoration of natural resources, and the application of regulations that control the use of natural and financial resources.
About the methodology using the artificial neural network, there were many studies that highlighted its importance many years ago. For example, Bandyopadhyay and Chattopadhyay (2007) created a predictive artificial neural network model for forecasting the monthly mean total ozone concentration over Arosa, Switzerland. Single hidden layer neural network models with variable number of nodes were developed and their performances were evaluated using the least squares method and error estimation. Their results were compared to those of a multiple linear regression model and, finally, showed that the best predictive model was determined to be a single-hidden-layer model with 8 hidden nodes [
12].
Recently, there have been some studies with data from BC and EF that make predictions through intelligent systems:
Liu and Lei (2018) predicted the EF of Beijing, first between 1996 and 2015, screening out the 6 dominant indicators of EF changes using partial least squares (PLS); and second, based on 2014 and 2015 EF data, they compared the prediction accuracy of the back propagation neural network (BPNN) with the SVM using the 6 indicators as inputs and EF as the output―allowing us to predict the year 2020 [
13].
Wu et al. (2019) analyzed the sustainable development in Tianjin, China, from 1994 to 2014 and provided novel predictions based on ANN with varying trends including EF, ecological capacity (EC), and ecological deficit (ED) [
14].
Jiang et al. (2019) analyzed per capita EF data from 2001 to 2015 and proposed a new urban ecological carrying capacity prediction model comprised of a radial basis function (RBF) neural network optimized by an improved artificial bee colony algorithm. The prediction results show that energy consumption is the most important factor influencing the urban ecosystem; additionally, the model precision of the training results is high [
15].
Jankovi et al. (2021) developed and compared machine learning models for EF prediction based on energy parameters based on a set of hyper-parameters predefined by the Bayesian optimization algorithm with K-nearest neighbor regression (KNNReg) and random forest regression (RFR) with 93 trees, with two artificial neural networks with two hidden layers developed and later compared in terms of their performance [
16].
Liu and Lei (2020) described the complex relationship between the environment and economic development and identified six dominant factors including population, per capita GDP, three major industrial added values, and energy consumption using a gray correlation model for the EF changes in the Beijing-Tianjin-Hebei (Jing-Jin-Ji) region from 1996 to 2015 and predicted the EF from 2016 to 2020 using a support vector machine model [
17].
Roumiani et al. (2022) studied human activities in terms of land grazing infrastructure, crops, forest products, and carbon impact and predicted ecological impact (EF)―one of the most important economic issues in the world. They applied regression (RR) approaches (including Ridge, Lasso, and Elastic Net) and artificial neural network (ANN) in two decades (1999–2018) in the G-20 countries. The results highlight ANN models with higher determination coefficients, suggesting that ANN could provide considerable and appropriate predictions for EF indicators in those countries [
18].
However, there is no research on the analysis of BC and EF at the global level. Hence, this paper aims to predict and analyze BC and EF behavior in five continents through neural networks until 2030. The period selected permits future and realistic comparisons with outcomes obtained from the Sustainable Development Agenda 2030.
3. Materials and Methods
As established in the previous section, sustainable development is a topic of interest that aims to generate benefits in the quality of life; however, it is still a complex topic that requires not only technological development but also the general adaptation of society to sustainable behavior patterns that limit the unnecessary use of natural resources and the optimal use of them.
For this reason, one of the main priorities of these continents for the generation of sustainable policies for efficient resources is to know the biological distributions of their territories and identify the main characteristics of the environment in each case to generate strategies that regulate the care and improvements that maximize the economic potential of the land without deteriorating the environmental quality of life.
Thus, to meet the objective of this work, this section will use the available BC and EF data to fit a deep neural network to predict the behavior of these metrics up to 2030.
3.1. About the Data
The data for the neural network adjustment were obtained from Footprintnetwork.org whose databases store the global hectares of BC and EF from 1961 to 2017. On the other hand, for each territory and generally each continent, the BC and EF measure the global hectares of the following territories:
Cropland: Produces food and fiber for human consumption, feed for livestock, oil crops, and rubber [
4]. In 1930, scientific investigations sought to understand the interaction of the crop with the environment [
19]. In the 1960s and 1970s, the knowledge about aboriginal agriculture was consolidated. It is from those years when the interaction between agriculture and considerations about social, political, and economic factors became better understood, with the aim of prioritizing agricultural knowledge and its impact in the communities that received it as a source of income. By the 1980s, a regulation of agroecological best practices was developed to be implemented by developed and developing countries. Likewise, a movement led by social activists emerged that opposes the industrial food system since it promotes unfair competition with small farmers. However, since 2000, a global network for production, marketing, and distribution of food has been discussed and promoted, and regulation has been promoted through a network of intergovernmental organizations to save the agricultural ecosystem.
Forest land: Divided into forest products, which are calculated from the amount of wood, pulp, wood products, and firewood that a country consumes annually, and carbon footprint, which represents the carbon dioxide emissions from the burning of fossil fuels and the area needed to mitigate carbon emissions [
4]. The role of forests within ecosystems is to provide renewable food and income, protect forest regeneration from degraded lands, and increase agricultural production by restoring the disposition of agricultural landscapes [
20]. The conversion of forests into agricultural land allows compensation for global food, rural income, and market exchange; however, it also addresses deficiencies in the ecosystems and increases the long-term quality of life [
21].
Grazing lands: These areas are defined as land used permanently, i.e., five years or more, for herbaceous forage crops, either cultivated or growing wild, as well as for raising livestock and production of meat, dairy products, hides, and wool. As the EF of this type is calculated by comparing the amount of feed for livestock available in a country with the amount of feed needed for all livestock per year, it is assumed that the rest of the demand for feed comes from grass. This definition excludes natural grazing lands used for non-permanent land, such as sporadic or intermittent grazing [
3,
22]. Grazing lands cover most of some continents: 77% Australia, 61% Africa, 49% Asia, and 18% Europe; and are especially prevalent in lands outside the tropics. Developing countries account for roughly two-thirds of all grazing lands, for example, rural people in Australia and their livestock, with pastures composed of wild species, from kangaroos to elephants to bison. Wildlife frequently grazes these lands alone, without livestock, in conservation areas around the world, and in much of the cold grazing land around the north pole (with some exceptions) [
23].
Fishing grounds: Calculated from estimates of maximum sustainable catches of various fish species [
4]. Over the years, they have become an economic sector that contributes to the nutritional, social, and economic wealth of the countries [
21]. The massive exploitation of fishing grounds after World War II and the growth of knowledge in this area through research and development (R&D) allow us to verify the importance of regulating the exploitation of aquatic fauna, leading to the designation of Exclusive Economic Zones (EEZ). In the mid-1970s, the United Nations developed a plan to regulate the distribution and benefit of marine resources. Therefore, in 1982, the seaside countries had a legal framework that regulated the exercise of fishing, clarifying duties and rights of each country within its EEZs. Later, they identified that regulations were no longer sufficient, since the jurisdiction did not contemplate the obligations that seaside countries had, the high seas fishery, and the migration of straddling fish species, which is why conservation of aquatic resources, and the environment became evident over the years. In 1991, through the Committee on Fisheries (COFI), a new regulation was carried out that promoted sustainable and responsible fishing, but it was not until 31 October 1995, at the FAO conference in Rome, when international principles and standards were formally established through the constitution of the Code of Conduct for Responsible Fisheries [
24].
Built land: Calculated from the land area covered by human infrastructure, such as transportation, housing, industrial structures, and reservoirs for hydroelectric power, occupying in some cases what was previously farmland [
4]. The Earth’s surface has been modified by human intervention to obtain products to supply its basic needs (water or food). However, the rapid growth of the population has promoted the expansion and migration of societies to different parts of the world, establishing houses and land in them, replacing biodiversity with artificial structures with small capacity for biological regeneration. In the long term, the degenerative cost of these practices has environmental impacts involving the death of thousands of living beings along with the resources they provided for the earth’s surface [
25].
The data used in this paper are from the Global Footprint Network of York University and FODAFO [
26]. The website collects and stores the records associated with ecological distributions in different countries of the world to monitor the evolution of territories and the impact of their policies on environmental development, which were used for the application of the algorithms. Each registry is annual and is compiled in CSV-type files which store the information by global hectares, BC, and EF of each of the 5 territories of interest, for each of the countries registered. Additionally, the EF presents a sixth territorial distribution attributed specifically to carbon consumption. The databases date between 1961 to 2017 and have 128 countries, as well as a general summary of the 5 continents, and at a global level.
3.2. AI Approach to Forecasting BC and EF
The annual interactions between countries with their natural resources are highly volatile. Dynamics dependent on factors such as economic growth, exports, rural or urban expansion, and exogenous factors resulting from an increasingly globalized society generate an expansion and prediction model that adjusts to the context of 128 countries, which in turn requires sophisticated analysis methods that allow knowing the trends that govern the behavior patterns of their territorial distributions.
Thus, the structures that best allow predicting this behavior from a minimum computational cost are neural networks, which have shown great effectiveness for the predictive analysis of time series [
27,
28], to identify trends for the design of management models based and centered on people―which facilitate an innovative and sustainable business fabric, sensitive to the BC and EF worldwide and aligned with the Sustainable Development Goals (SDGs) for 2030; thus meeting the objective of this research.
The neural network methodology [
29,
30] refers to a special type of specialized adaptive computational algorithm based on human information processing, since they learn and self-correct from the contexts where they are applied, as the brain does when thinking and learning. Thus, a positive aspect favoring the use of neural networks is that they are independent of the context, so they can adapt to different situations if the appropriate network is structured for the objective. To do so, the neurons are distributed, which as their name indicates, are analogous to their biological counterpart since they oversee processing and transmitting information. The use of neural networks in this study allows error to be minimized, which is measured from a loss function chosen by the researcher, which determines the learning patterns and self-correction of the model according to the evidence of the study phenomenon.
For this reason, to analyze the evolution of BC and the carbon footprint, a 4-layer sequential neural network was established, the first with 128 nodes, the second with 64, the third with 32, and the result layer with only 1 node. Between hidden layers, a dropout layer was applied to avoid overfitting the neural network. Neural networks work better with huge information flows and given that the current database does not have a sufficiently high density, we expect the lack of information from the data augmentation method [
31] to generate more information from what is currently possessed. The use of this methodology has been the subject of studies that corroborate its effectiveness both in theory [
32] and in practice [
33]. Time series of length 20 were established as input data, corresponding to the hectares registered in 20 years of the registry for each of the 5 territorial distributions both by carbon footprint and BC.
Thus, for each database that has only one time series of 57 data per country, 37 time series are obtained for each of the 20 elements, with the intention, after applying the prediction algorithm, to obtain the data for the following year, in such a way that the total amount of training data that will be implemented for the training of the neural network by category and territory is 4528. To validate the algorithm, 1133 test vectors were obtained.
In summary, 11 neural networks were trained, all with the same structure, each one adapted with 4528 training data and 1133 different testing data established by the 5 territorial distributions of BC and the 6 of EF. For the monitoring of convergence, the functions of mean absolute error (MAE) and mean square error (MSE) were applied, the latter being the chosen loss function. Once the neural network was trained, the prediction of the year 2018 was applied to each time series from the data between 1997 and 2017; once the estimated value for that year was obtained, it was implemented to predict the year 2019, which iteratively will apply the same process until obtaining the territorial distribution up to the year 2030. Based on the previous training and structuring strategies, the following section presents the results of the neural network and how the territorial contexts of some countries in the world were derived, along with the most relevant biological capacities of the continents.
4. Results
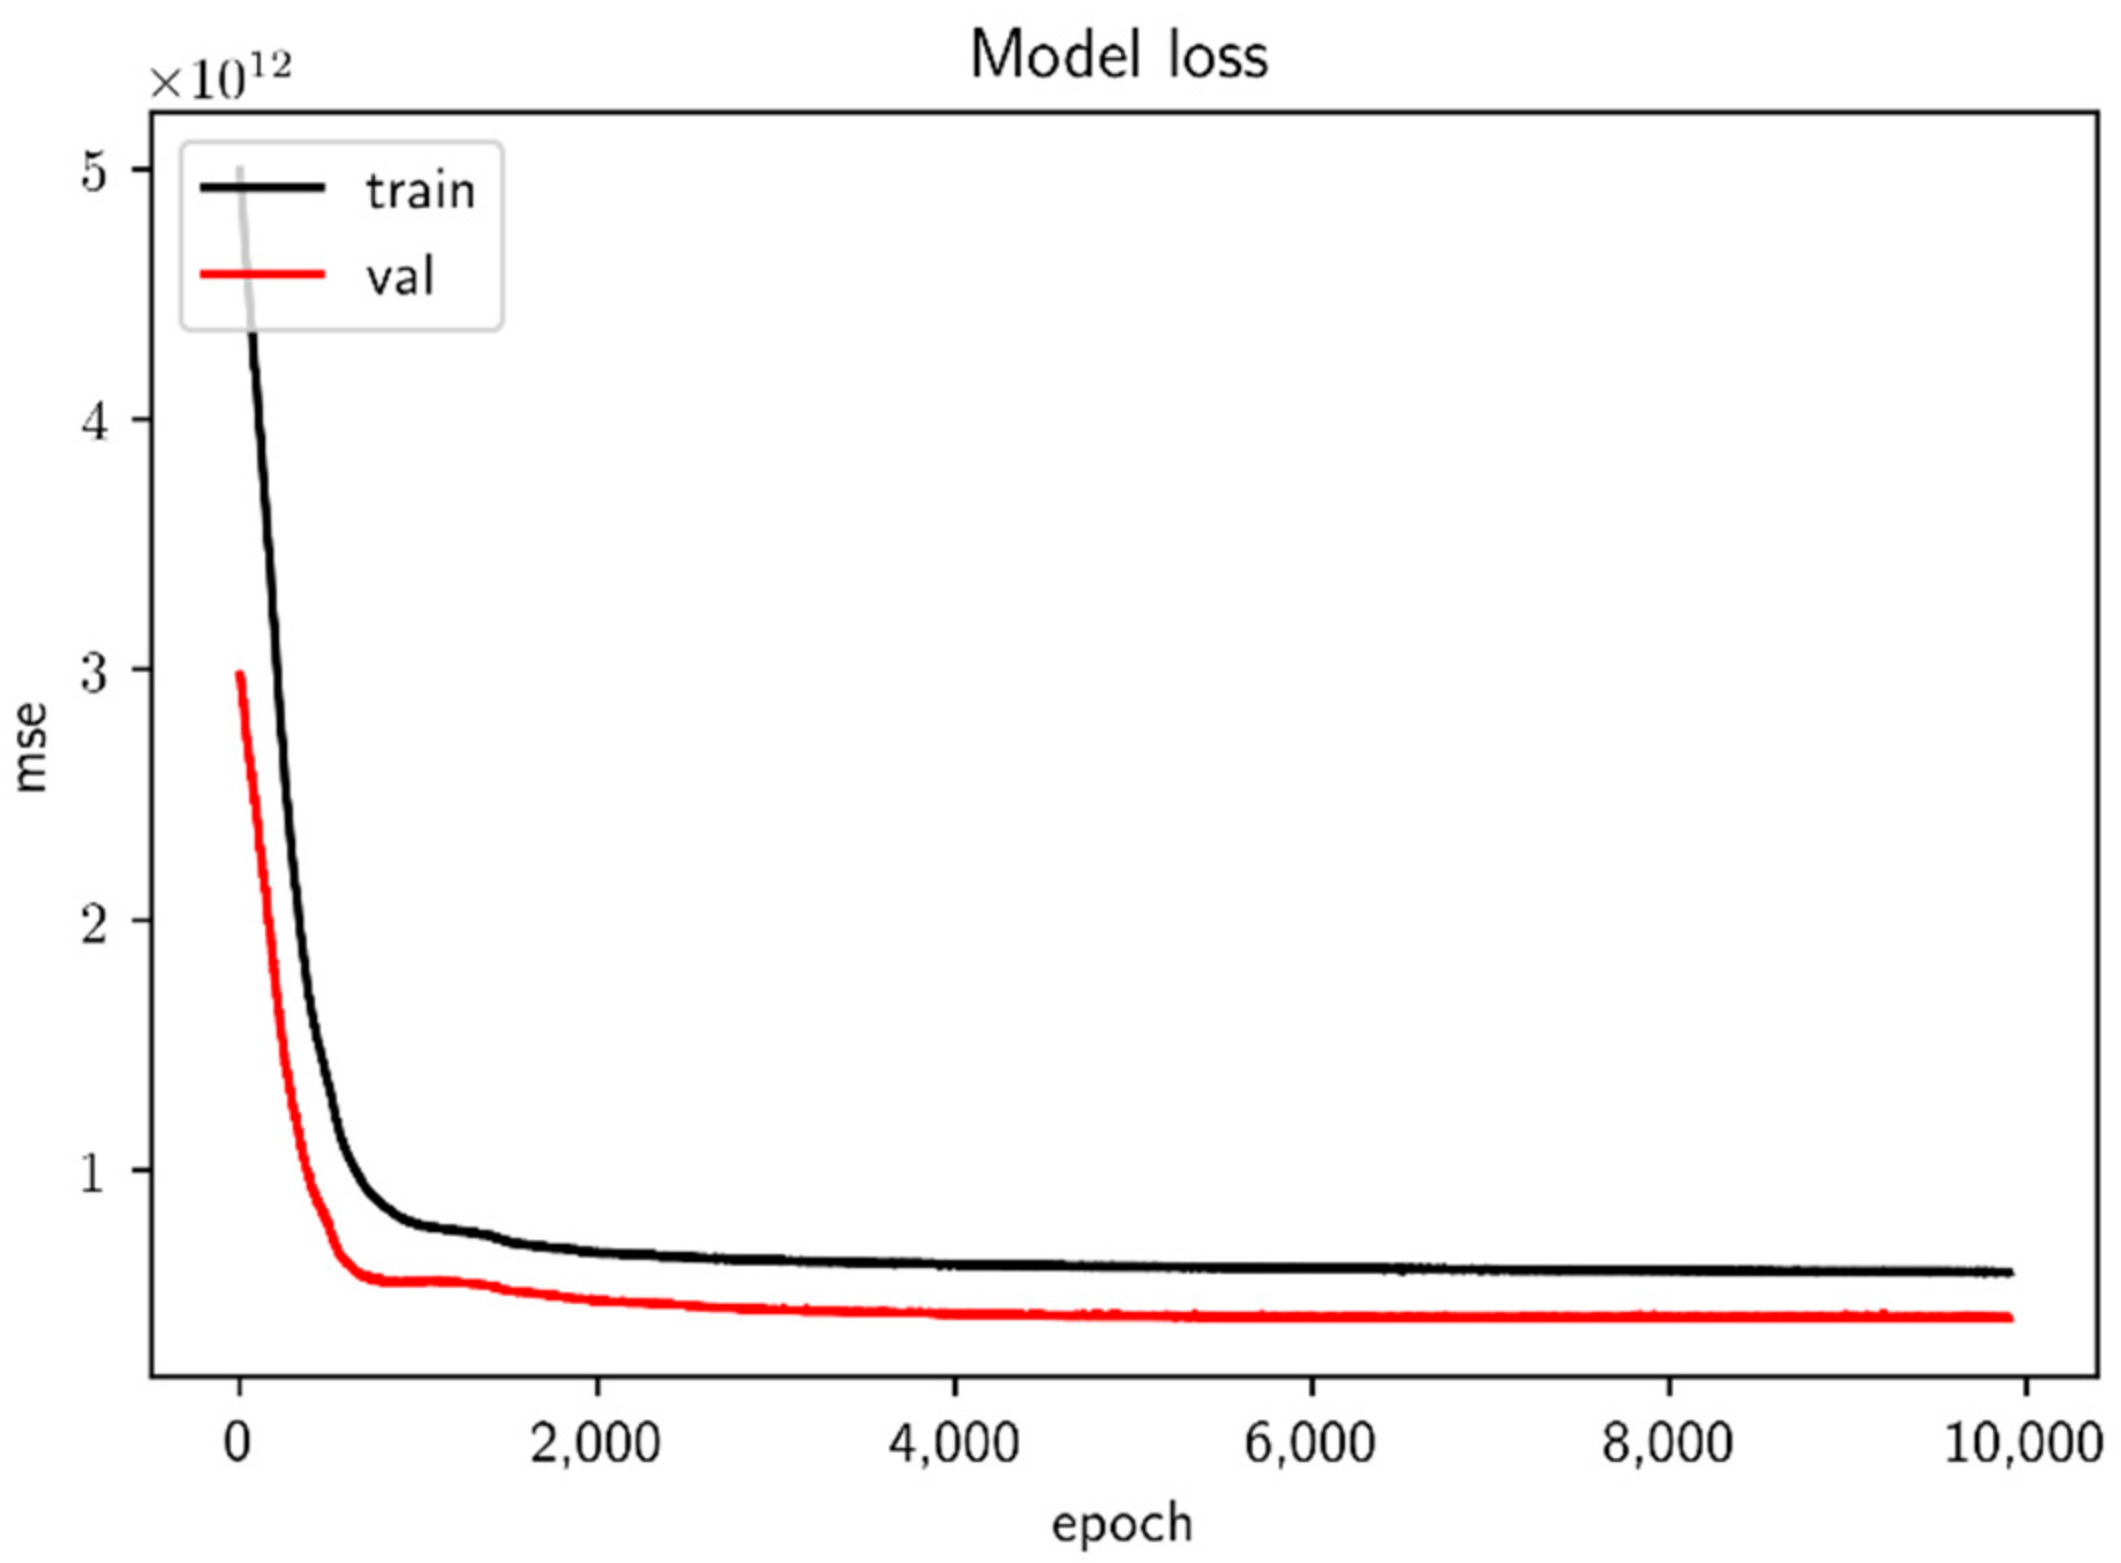
For the monitoring of the algorithms, graphs were generated which showed the evolution of the loss function while the iterations increased, as can be seen in
Figure 1 which represents the behavior of the loss function of one of the neural networks, while the error evolution presents a convergent behavior both in training and in validation.
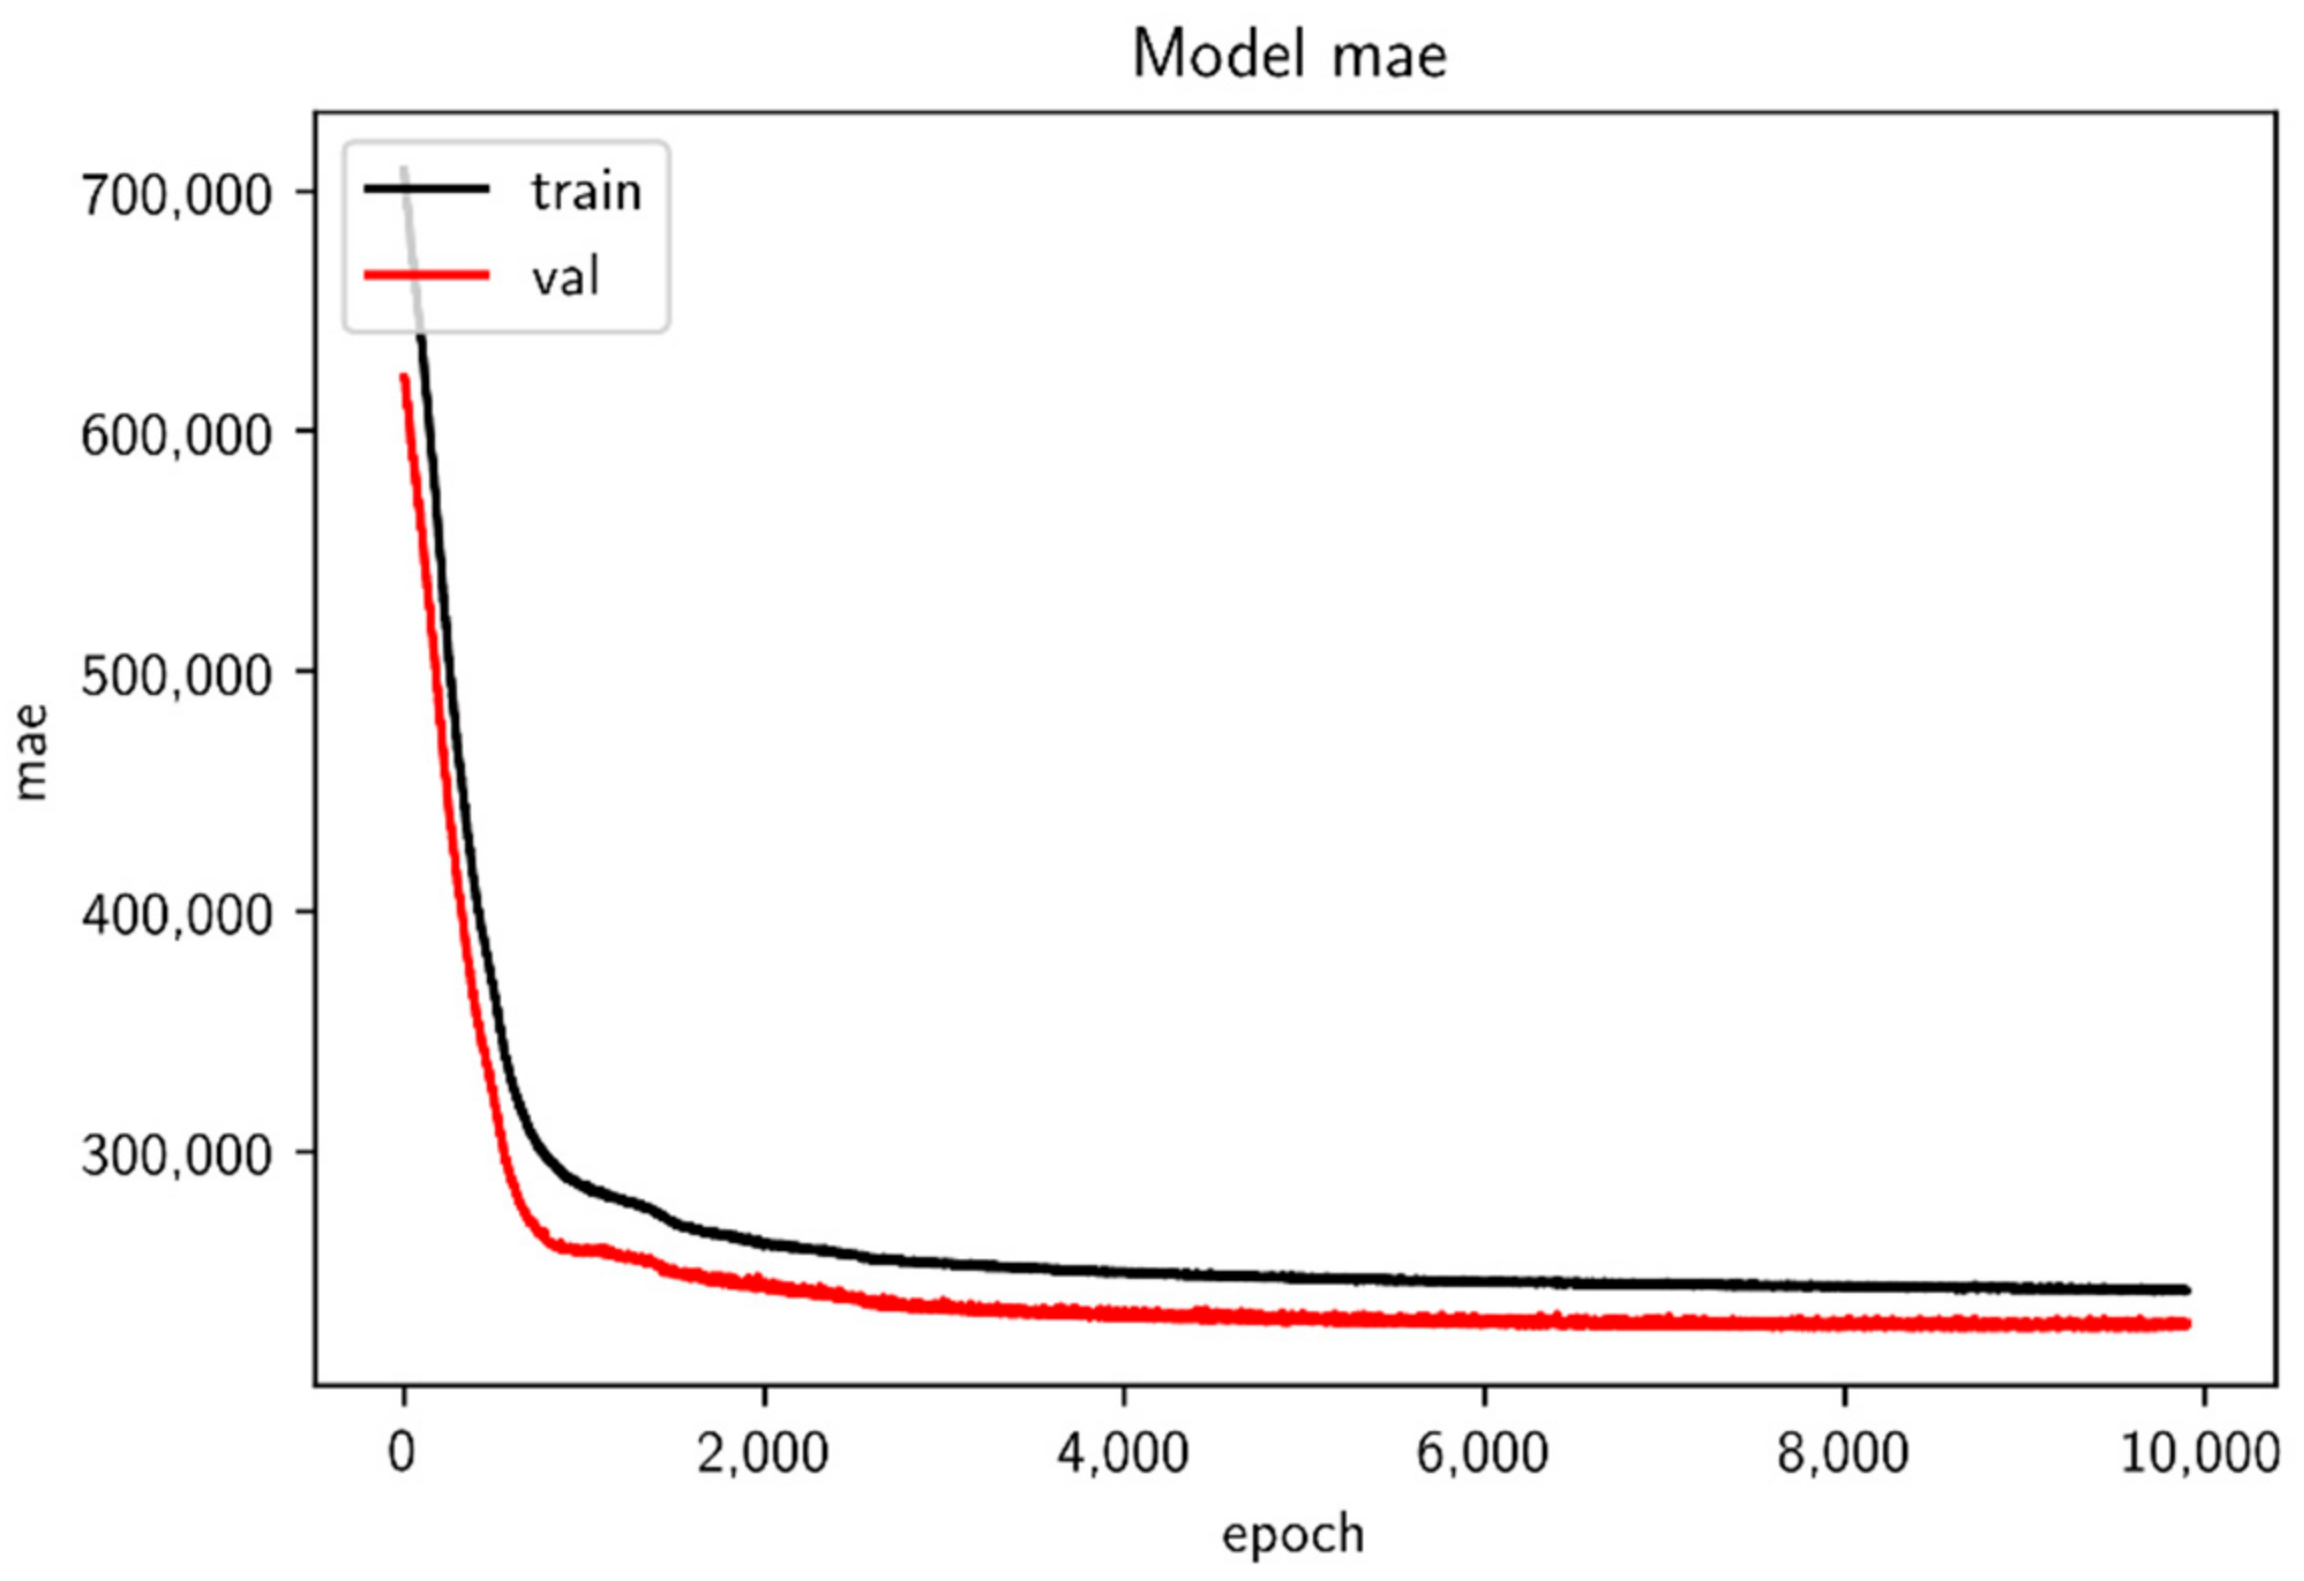
The quadratic error is still considerably high. The dispersion values of the predictions are better represented in the graph that monitors the mean absolute error (MAE) which is presented in
Figure 2. The convergence of the networks and the maximum value of the error for the training data are approximately 200 thousand hectares, whereas for the validation values, we have approximately 500 thousand hectares, which means a lower amount. The scale of millions usually works on a territorial scale. Although the existence of the error persists, it is ideal to generate a generous range enough to accommodate flexible predictions that are not supercharged and allow for controlled dispersion patterns to be established.
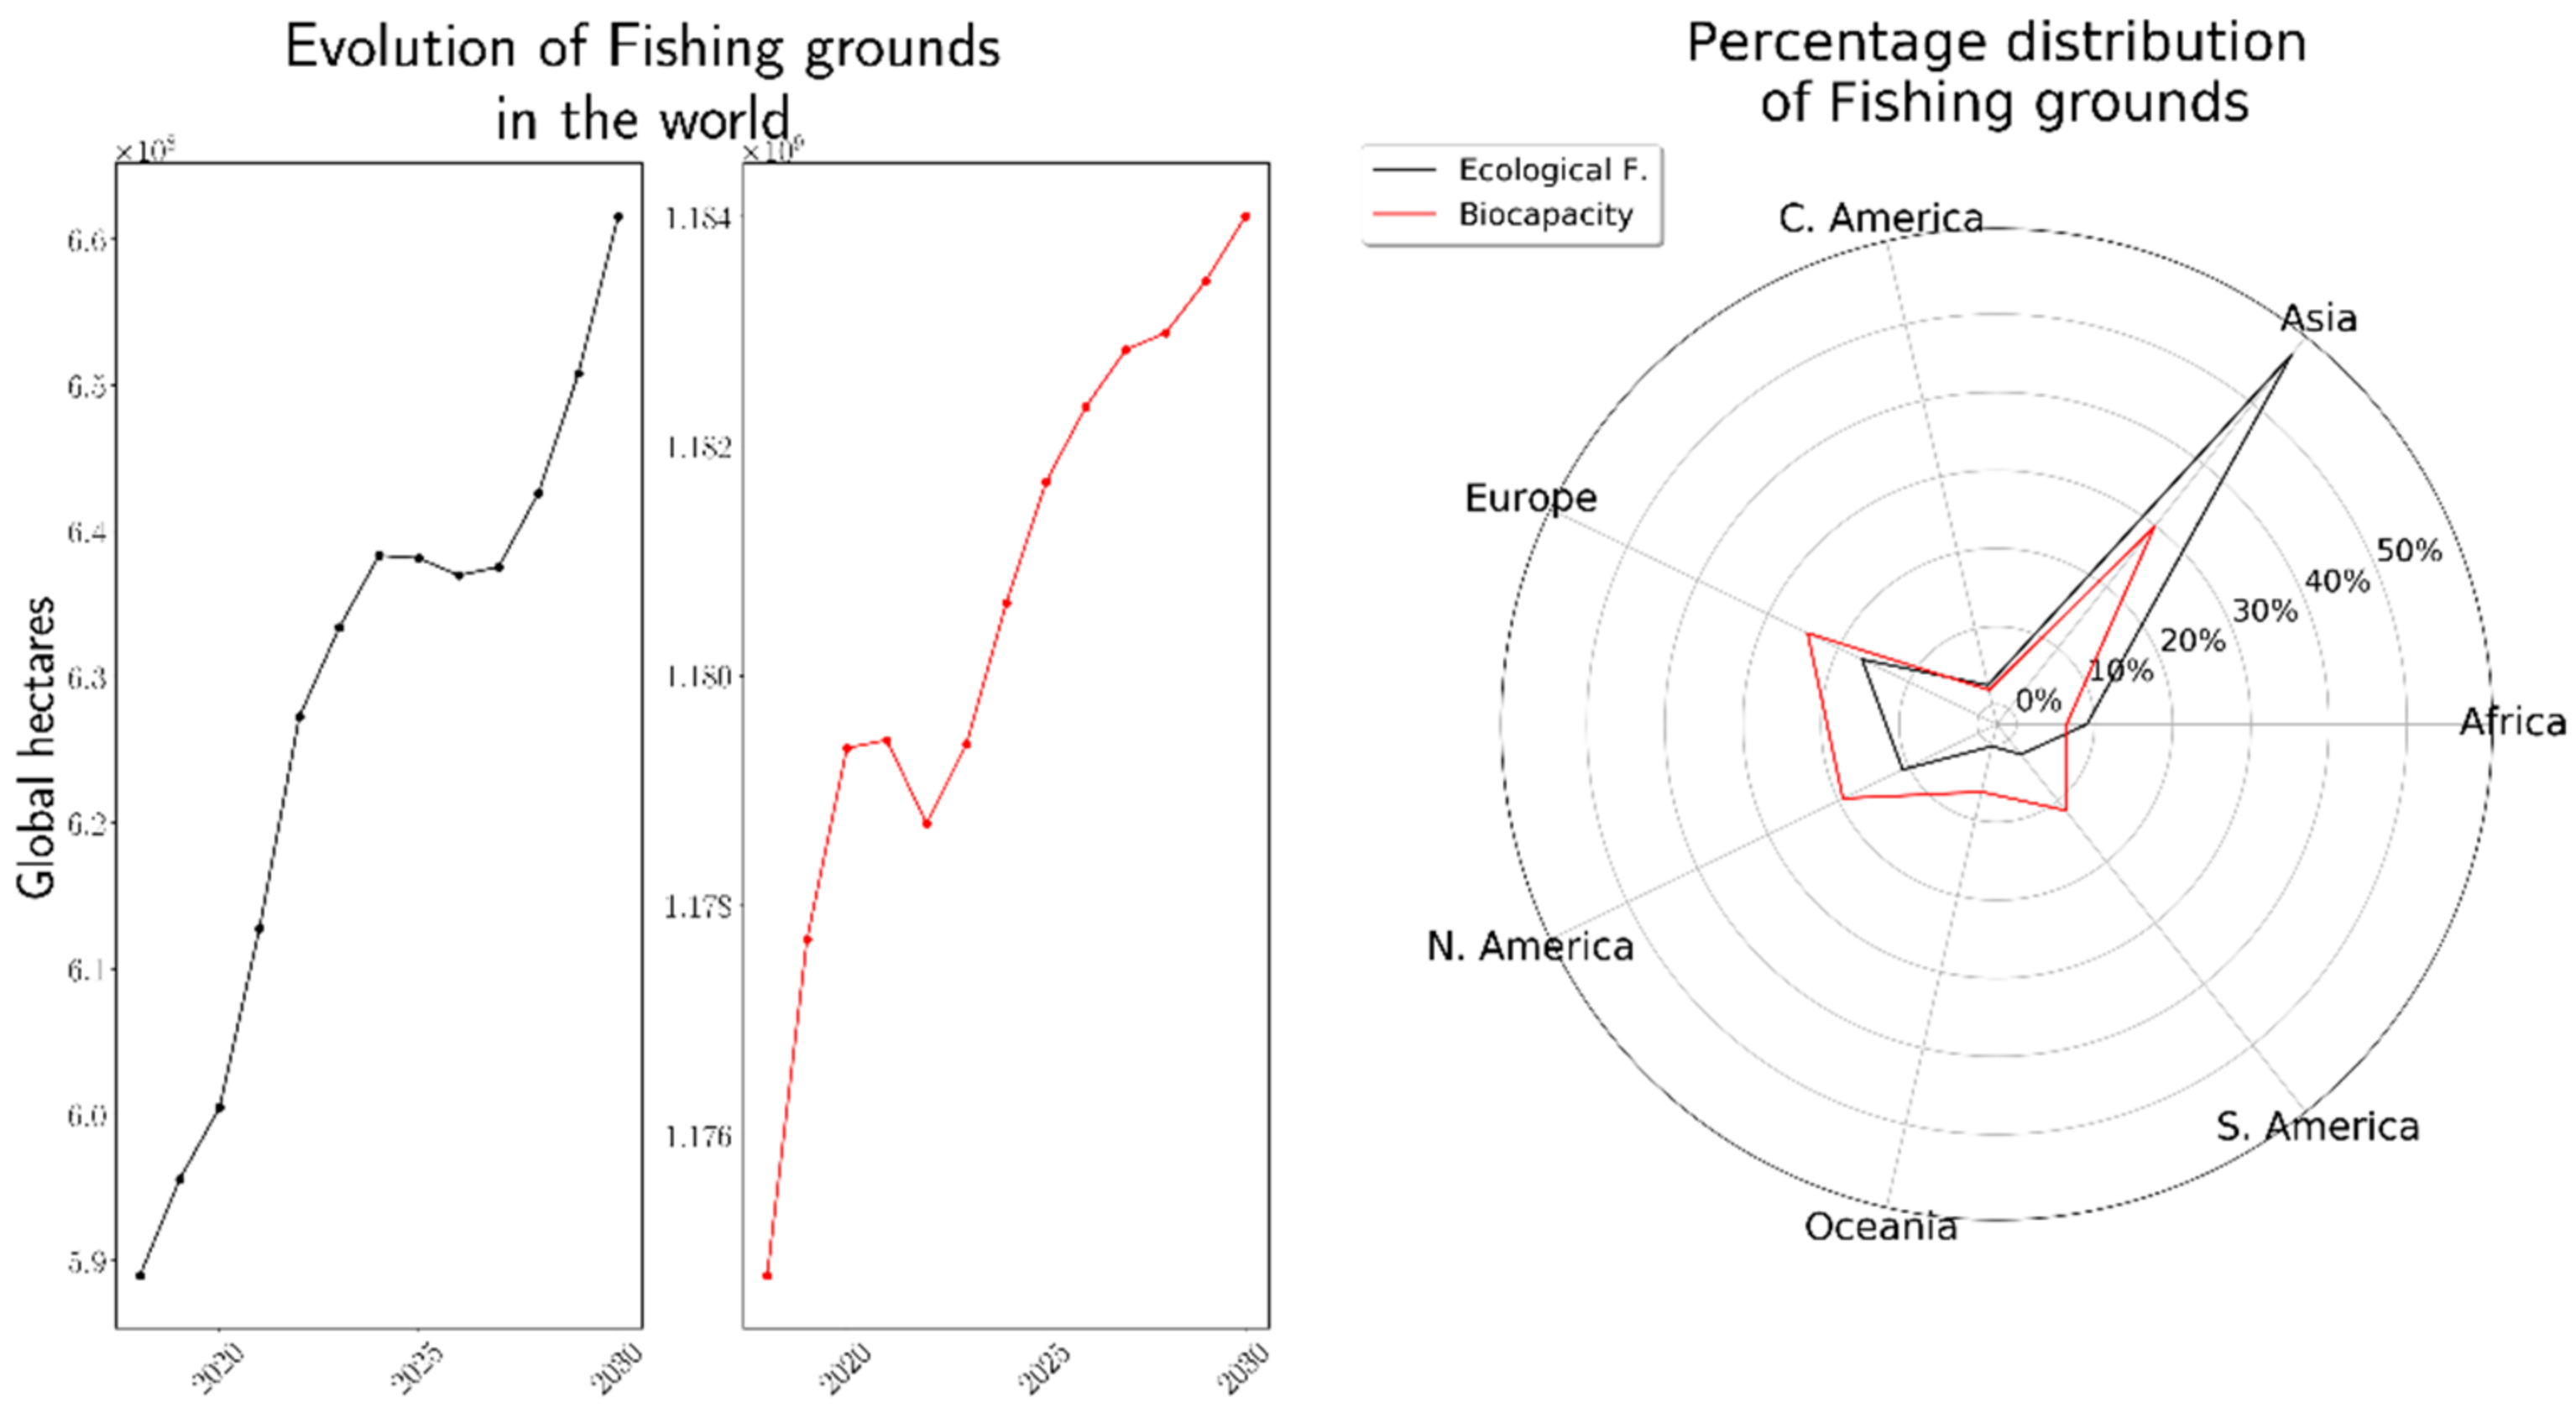
The neural networks allowed us to generate the continents’ global estimation on the BC distributions and EF in the five Global Footprint Network’s dimensions. As a result, the graph below shows two figures. The first one shows the timeline’s evolution of each type of ground worldwide, while the second illustrates from a network graph the average distributions of BC and EF in the 5 world regions between 2018 to 2030. An example of this can be seen in
Figure 3, which presents the evolution and distributions of fishing grounds from 2018 to 2030, measured by proportion of the world total.
As can be seen below, the growth characteristics of BC and EF are increasing, which indicates that the characteristics of consumption in fishing are increasing. The distribution of the world’s fishing lands is more focused on the Asian region, where approximately 55% of the world’s EF and 30% of the BC are generated.
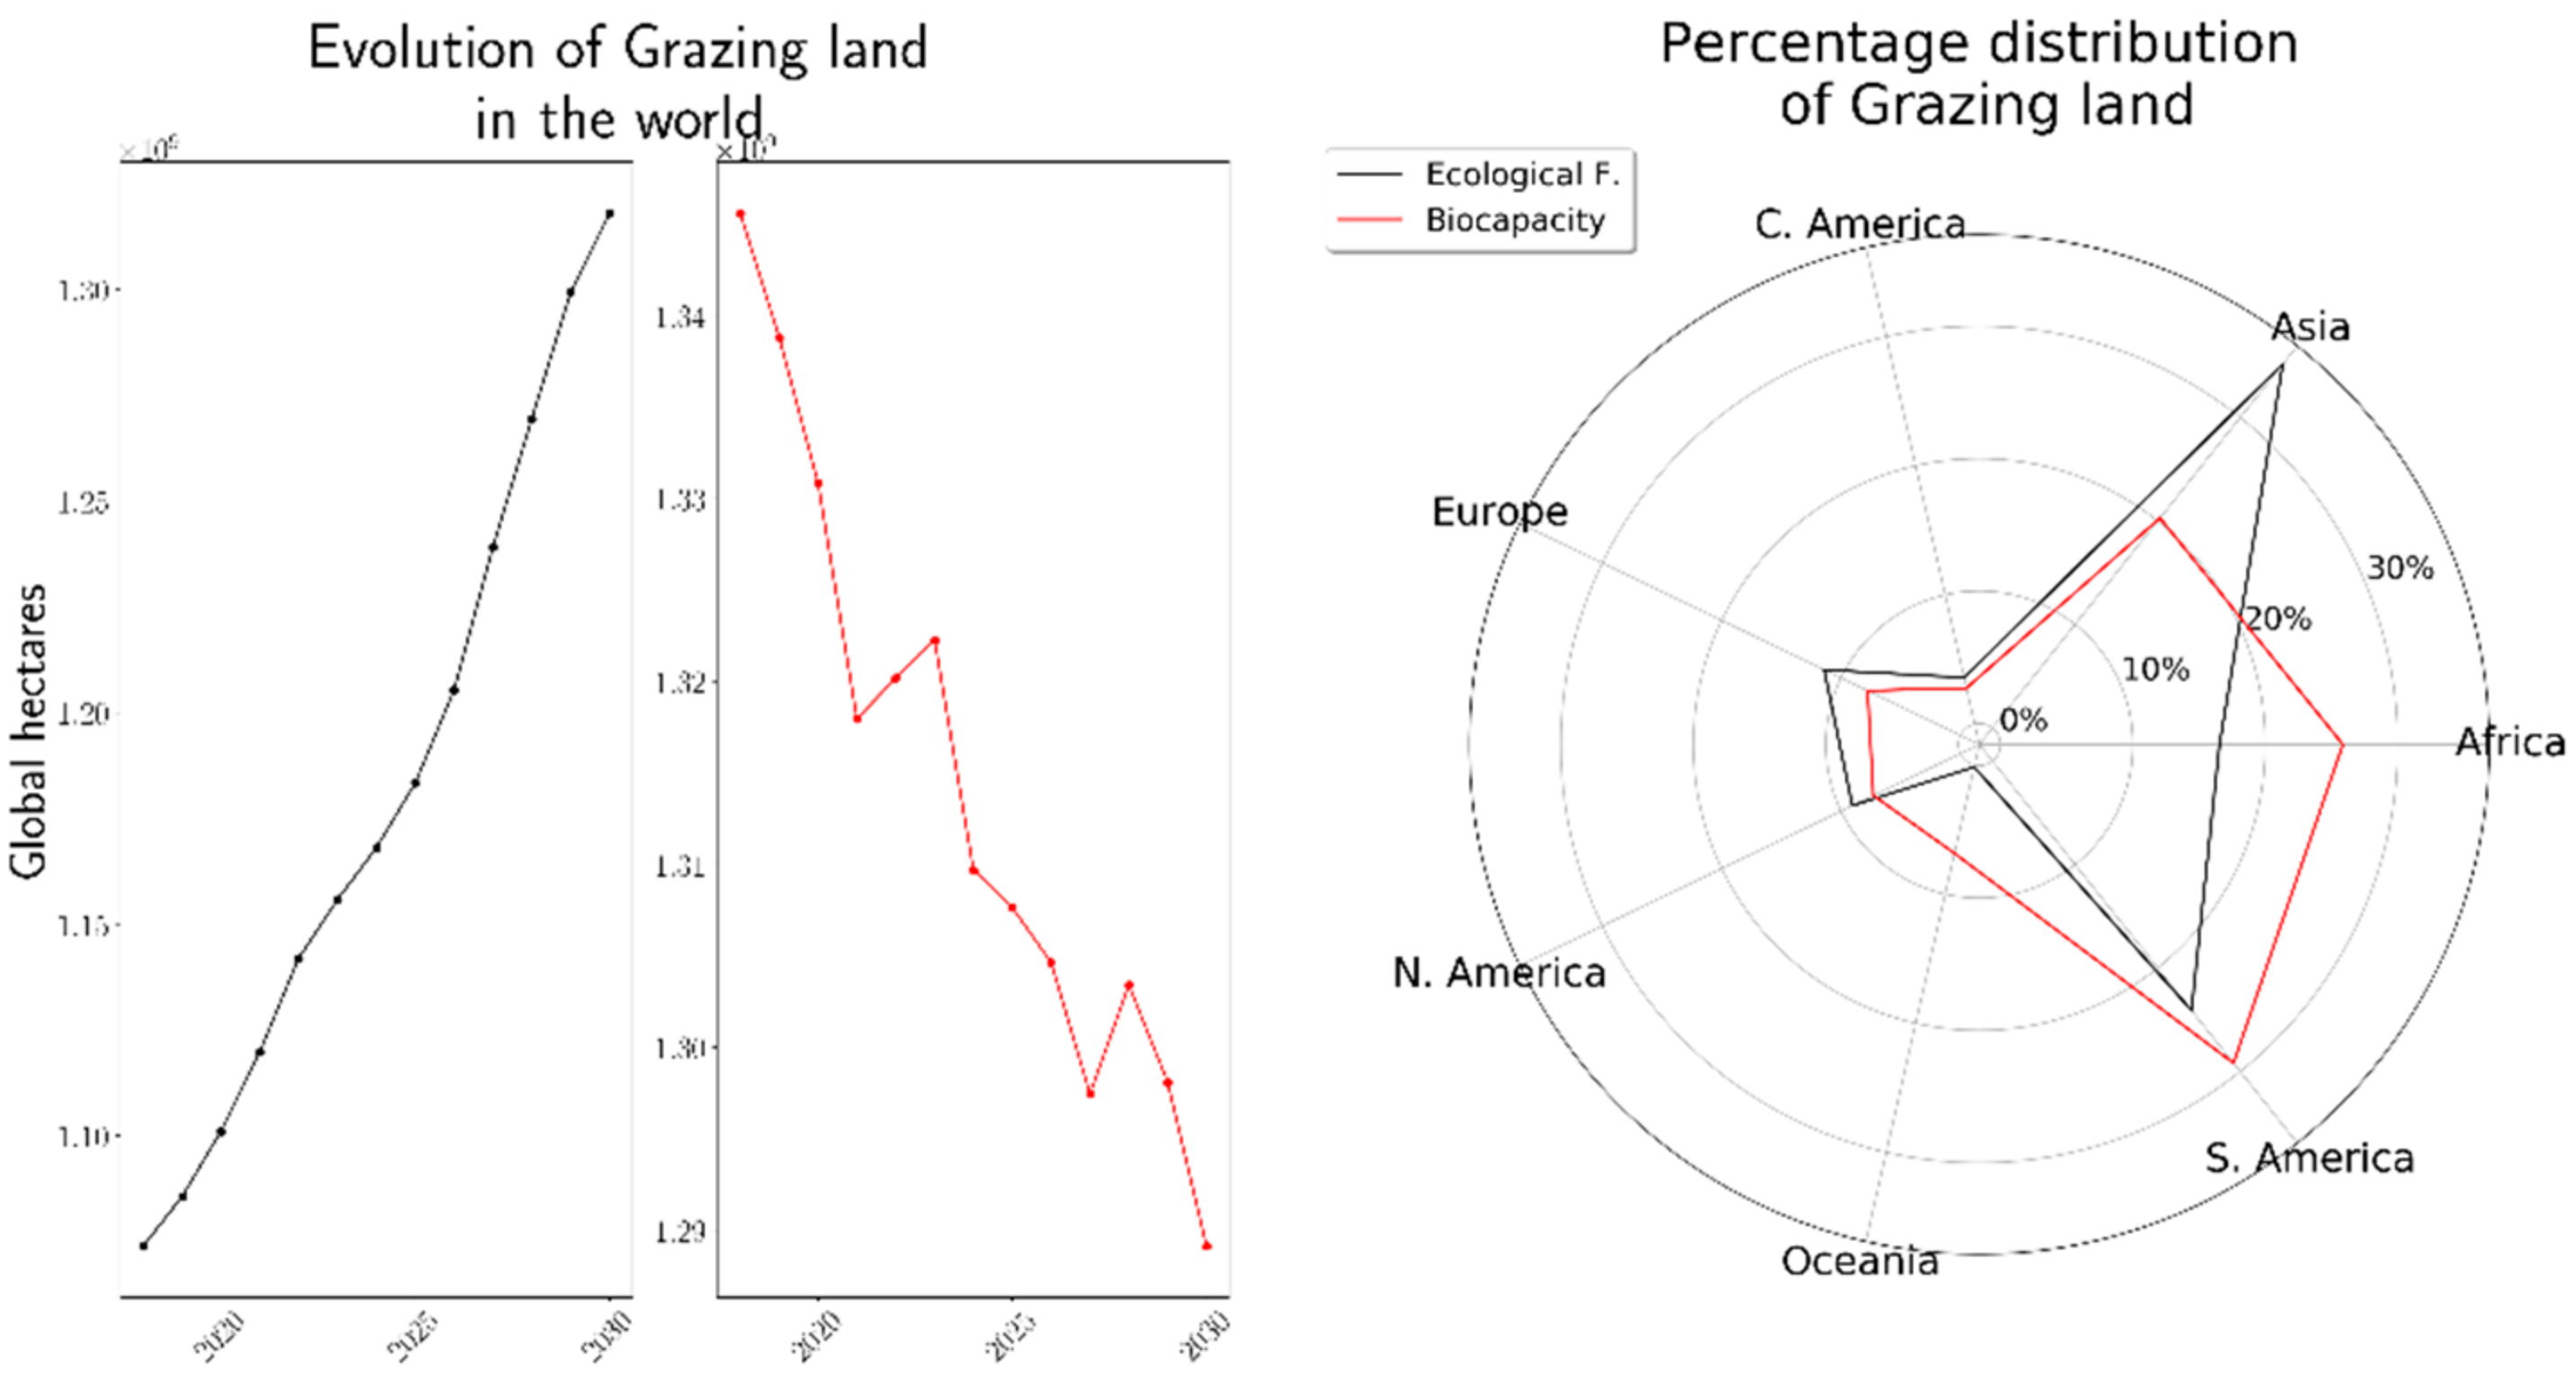
On the other hand, the evolution of grazing lands indicates an exponential growth in terms of EF, while a clear decline in BC with respect to time is evidenced, as can be seen in
Figure 4: South America and Africa have almost 55% of the distribution in the BC of the world, being great powers in the generation of agricultural products. However, the prospects of these regions are clearly deteriorating, due to the projected ecological deficit.
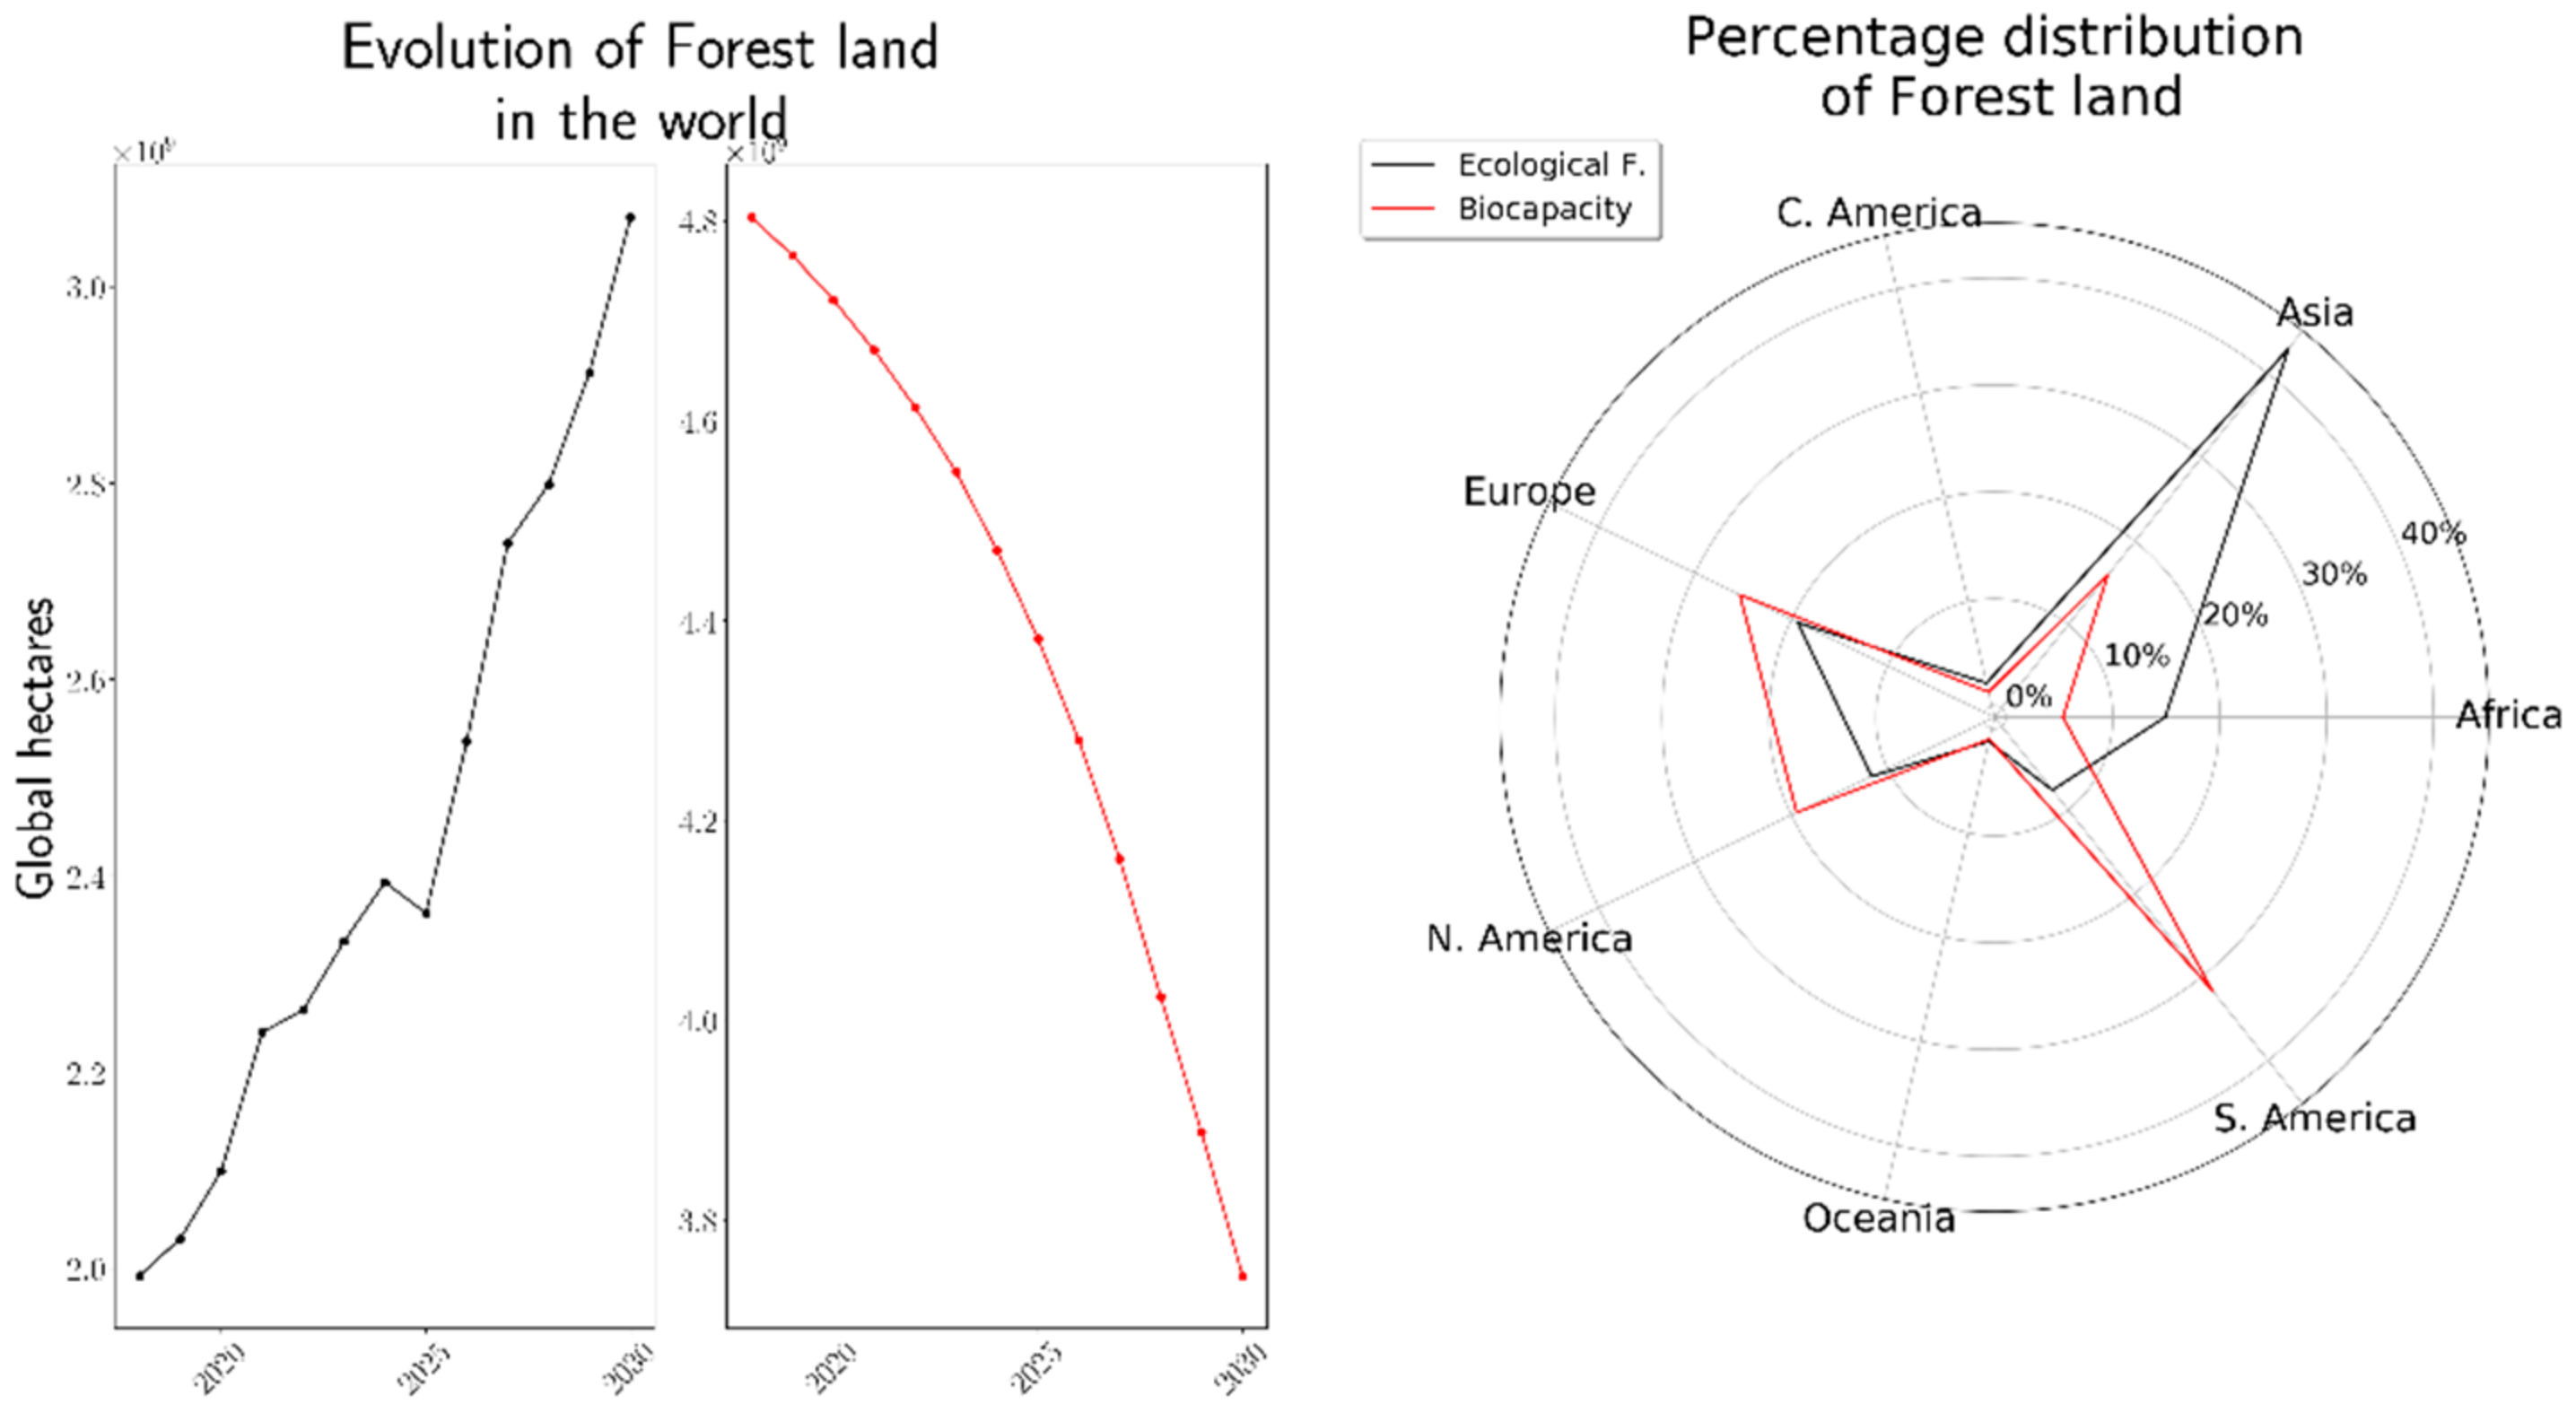
Forest lands show a decrease in BC, as can be seen in
Figure 5. The low-renewable policies in the world are generating a certain progressive and exponential deterioration of forest resources, while, in the same way, the human need for these inputs is increasing. Part of the deficit established in the world is generated in Asia. The EF in Asia represents 45% of world needs. On the other hand, Europe, South America, and North America provide more than 70% of the world’s BC. The land forest consumption in Europe and North America generates a much greater ecological deficit.
Regarding forest land, the measurement in gha projects a sustained growth in EF and a decrease in BC for 2030 (from 4.8 million gha in 2018 to 3.5 million gha in 2030). Hence, in Europe, North America, and Oceania, EF does not exceed the BC percentage. The case of South America stands out, where an EF is projected below 10% with a BC that exceeds 30%. The opposite situation is predicted in Asia and Africa.
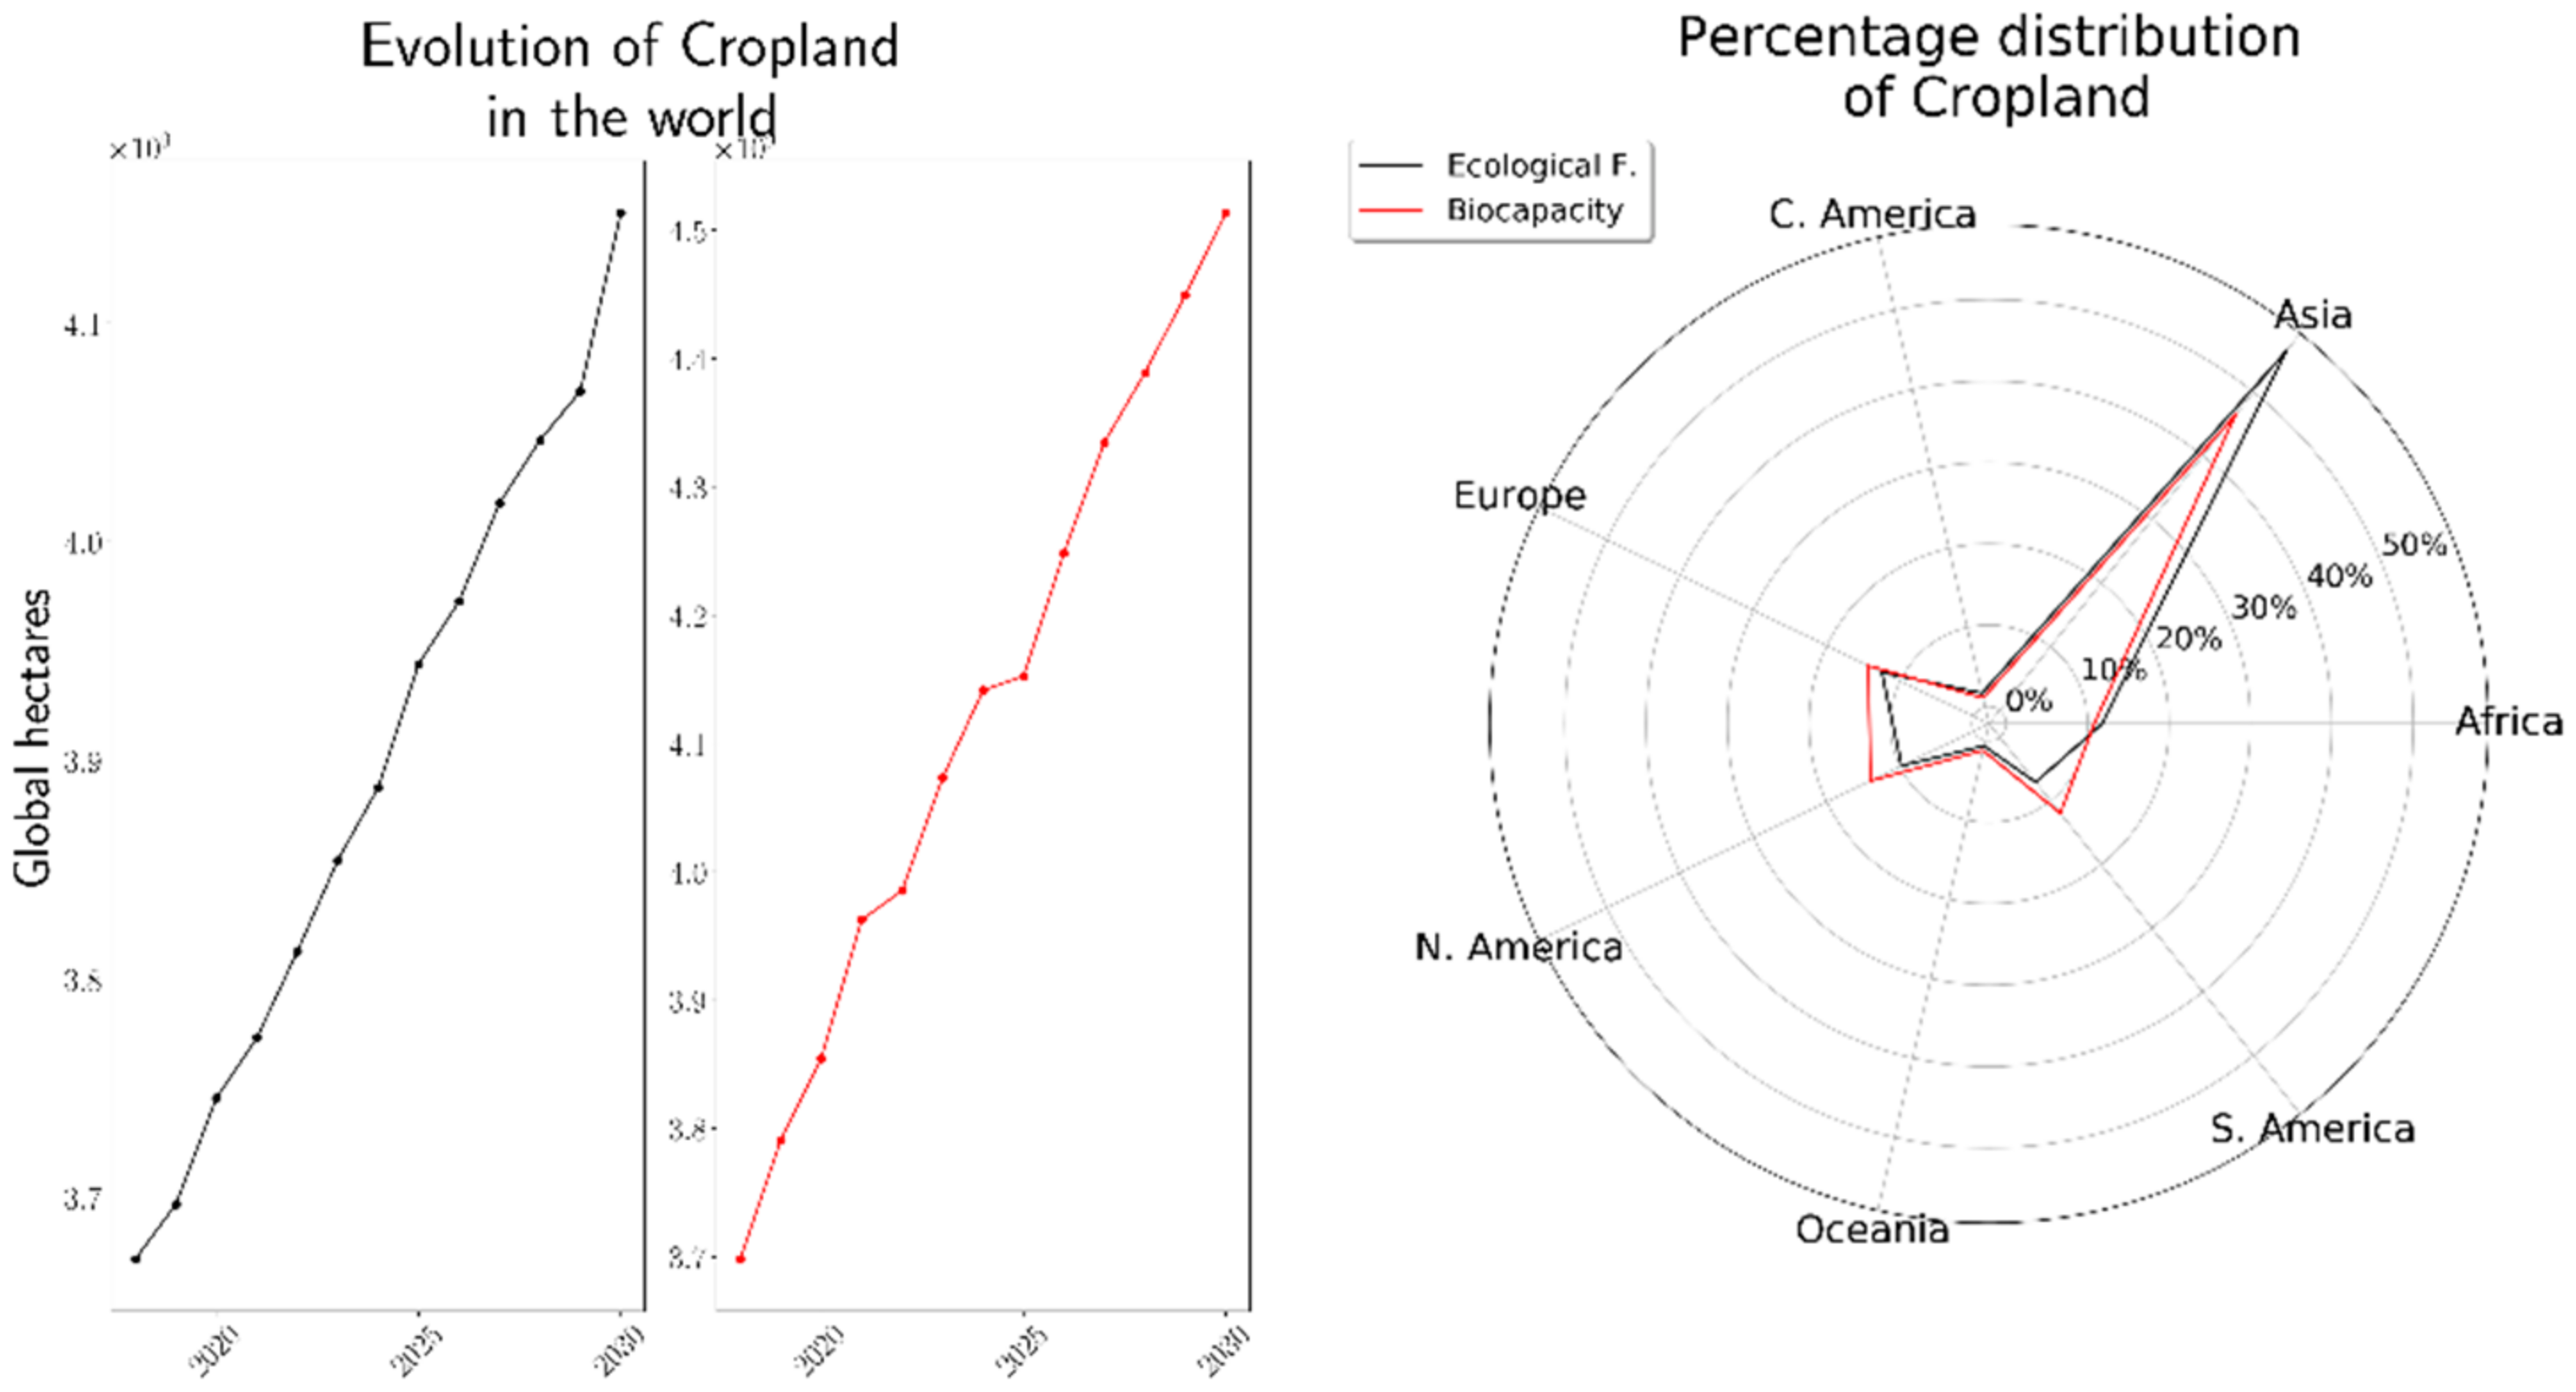
In contrast to the situations observed in forests and grazing lands, the cropland shows a deficit close to zero, favoring global regeneration. Although these characteristics are favorable, it is presumed that the expansion of these territories is generated because of the premeditated degradation of another terrain. In
Figure 6, the distributions of both BC and EF are approximate, which seems to indicate an environmental balance between what is consumed and what is regenerated. As is customary, the territorial extension of Asia encompasses a large part of the land, and its ecological deficit is offset by the management policies of the other regions.
The behavior of farmland in relation to BC and EF assumes that human food needs are covered by crops, which tells us that farmland is used less and less by all continents except Asia. This leads us to think that natural products that are not born from land are industrialized. Today, food is transgenic, and more and more resources are being generated that are substitutes for raw materials previously used (such as cotton).
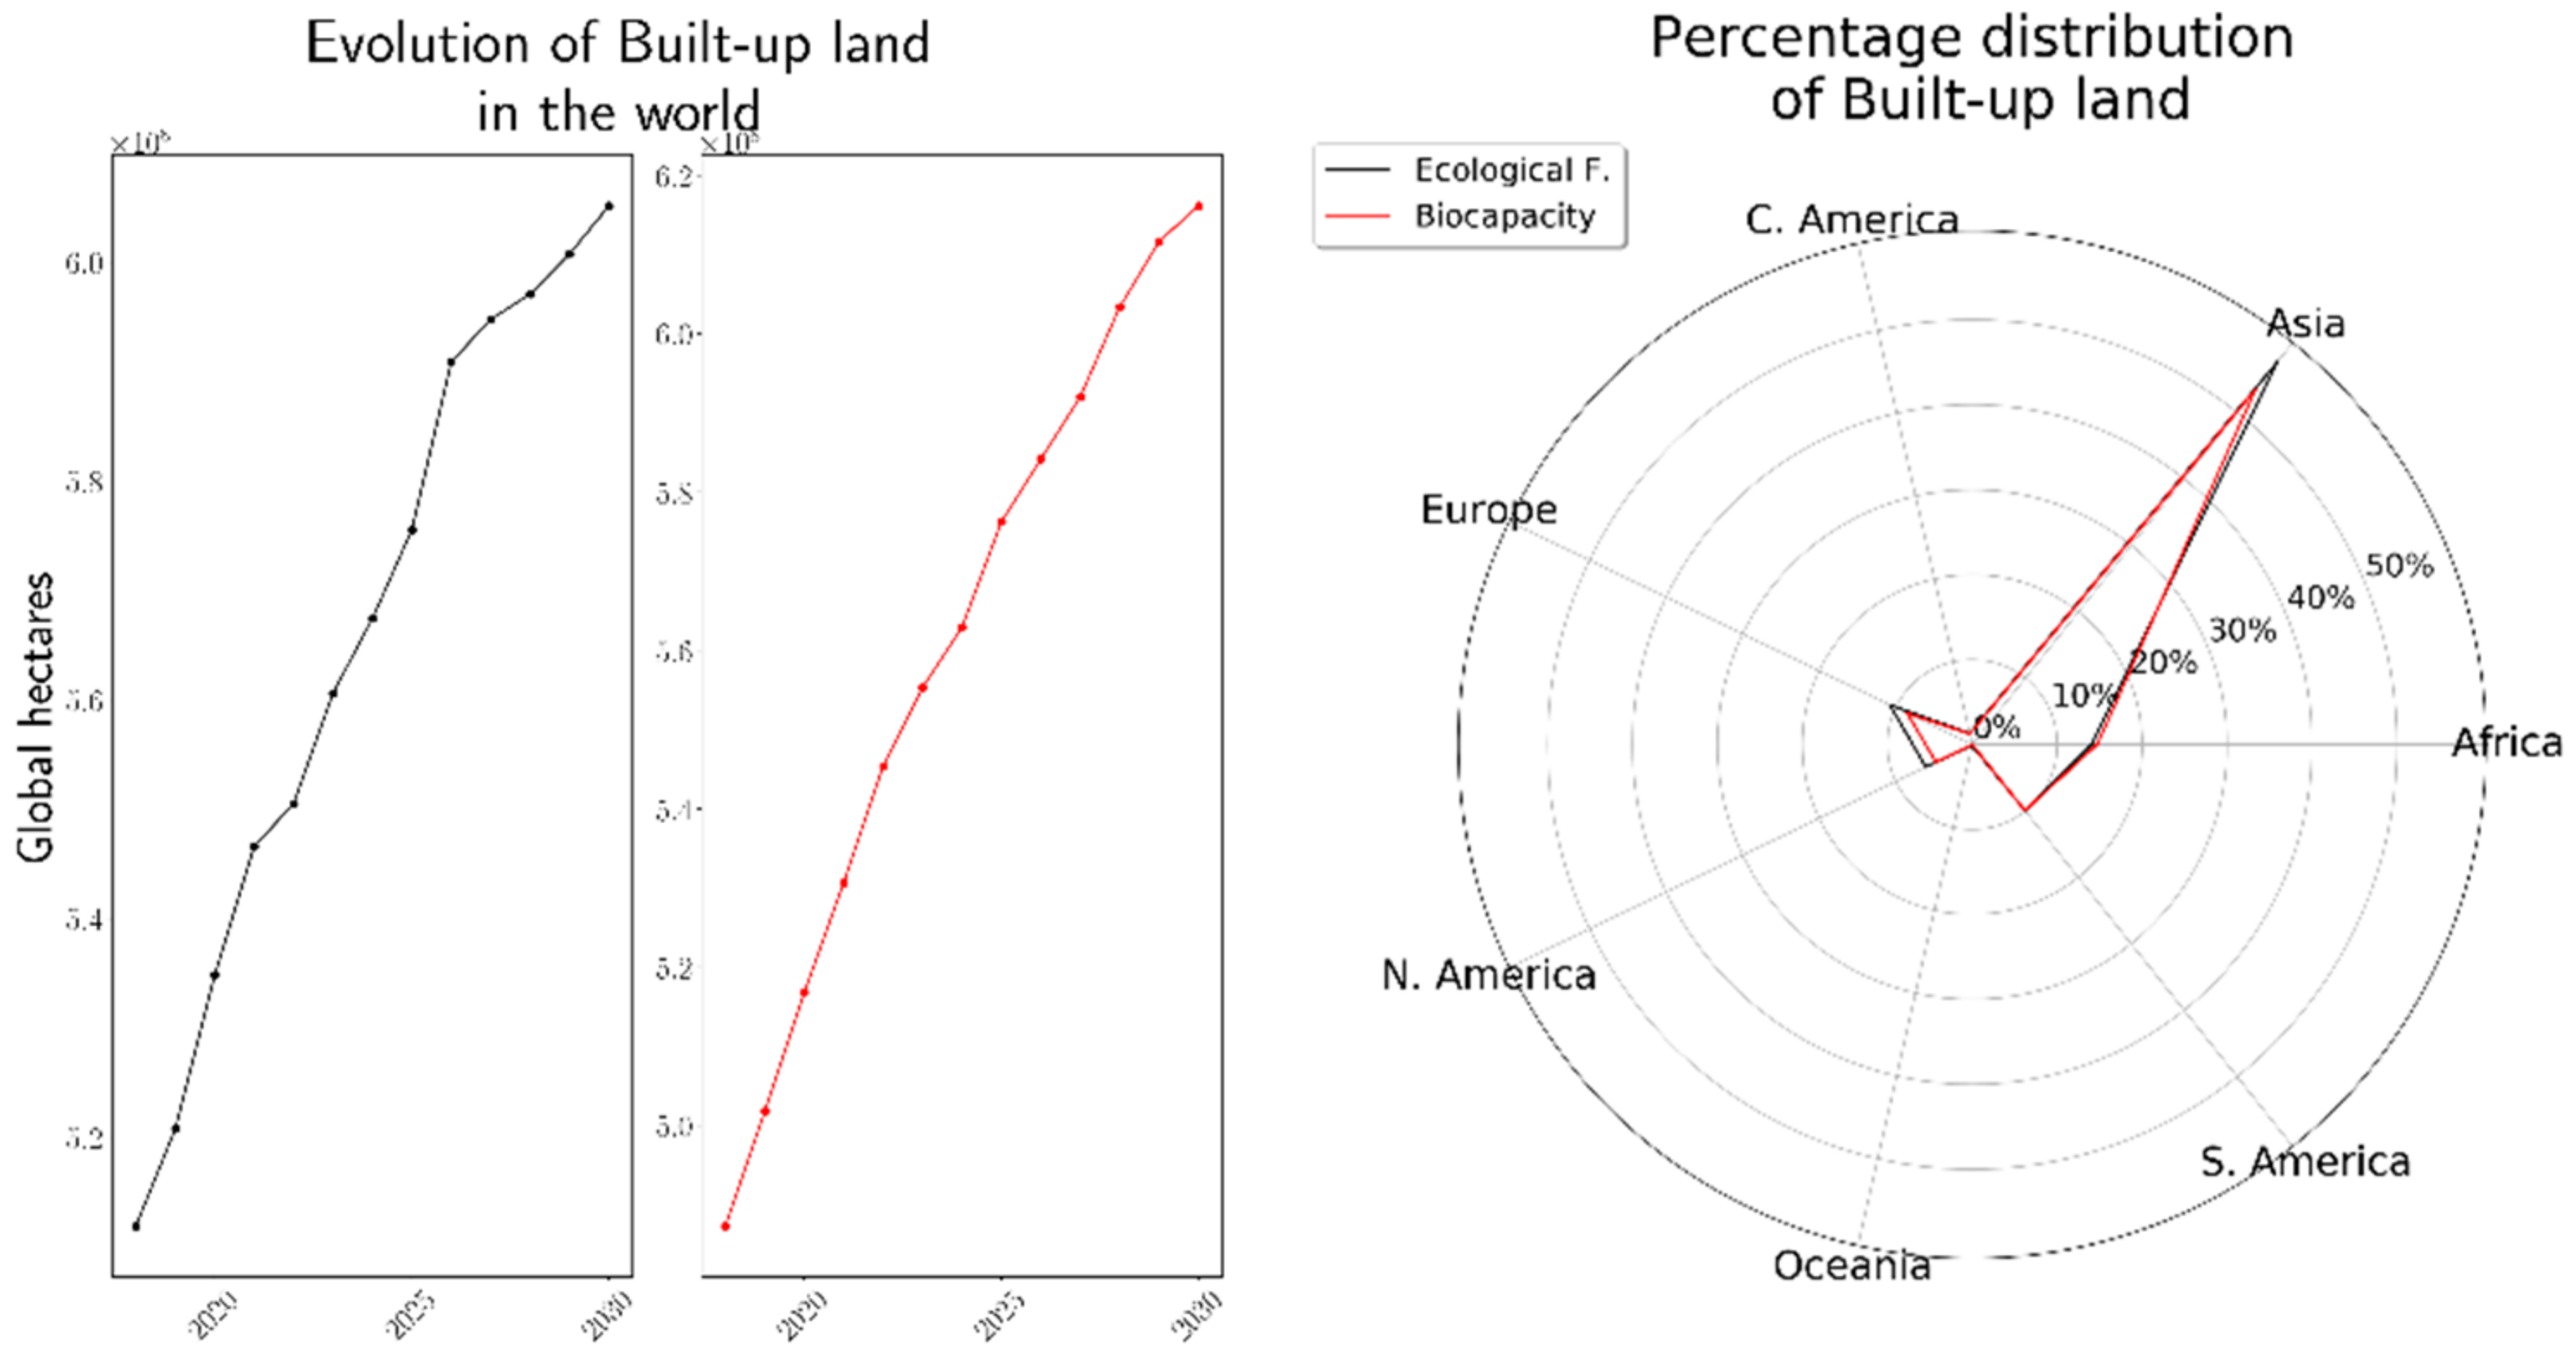
As in the case of cropland, built land has a semi-balance between its EF and its BC aimed at generating more BC. This indicates that cities provide great benefits in the life of humanity, these being the least affected by the consumption and wear policies, which may be due to being lands built and adapted by humanity that generate a supply comparative to what the demand requires. The results shown in
Figure 7 describe the balance between generation and consumption in all regions; however, this is the most invasive land distribution, which generates great impacts on development and regeneration in other lands, indicating the exponential crisis that could eventually be established by needing more and more resources from large built metropolises to replace the natural life provided by other lands.
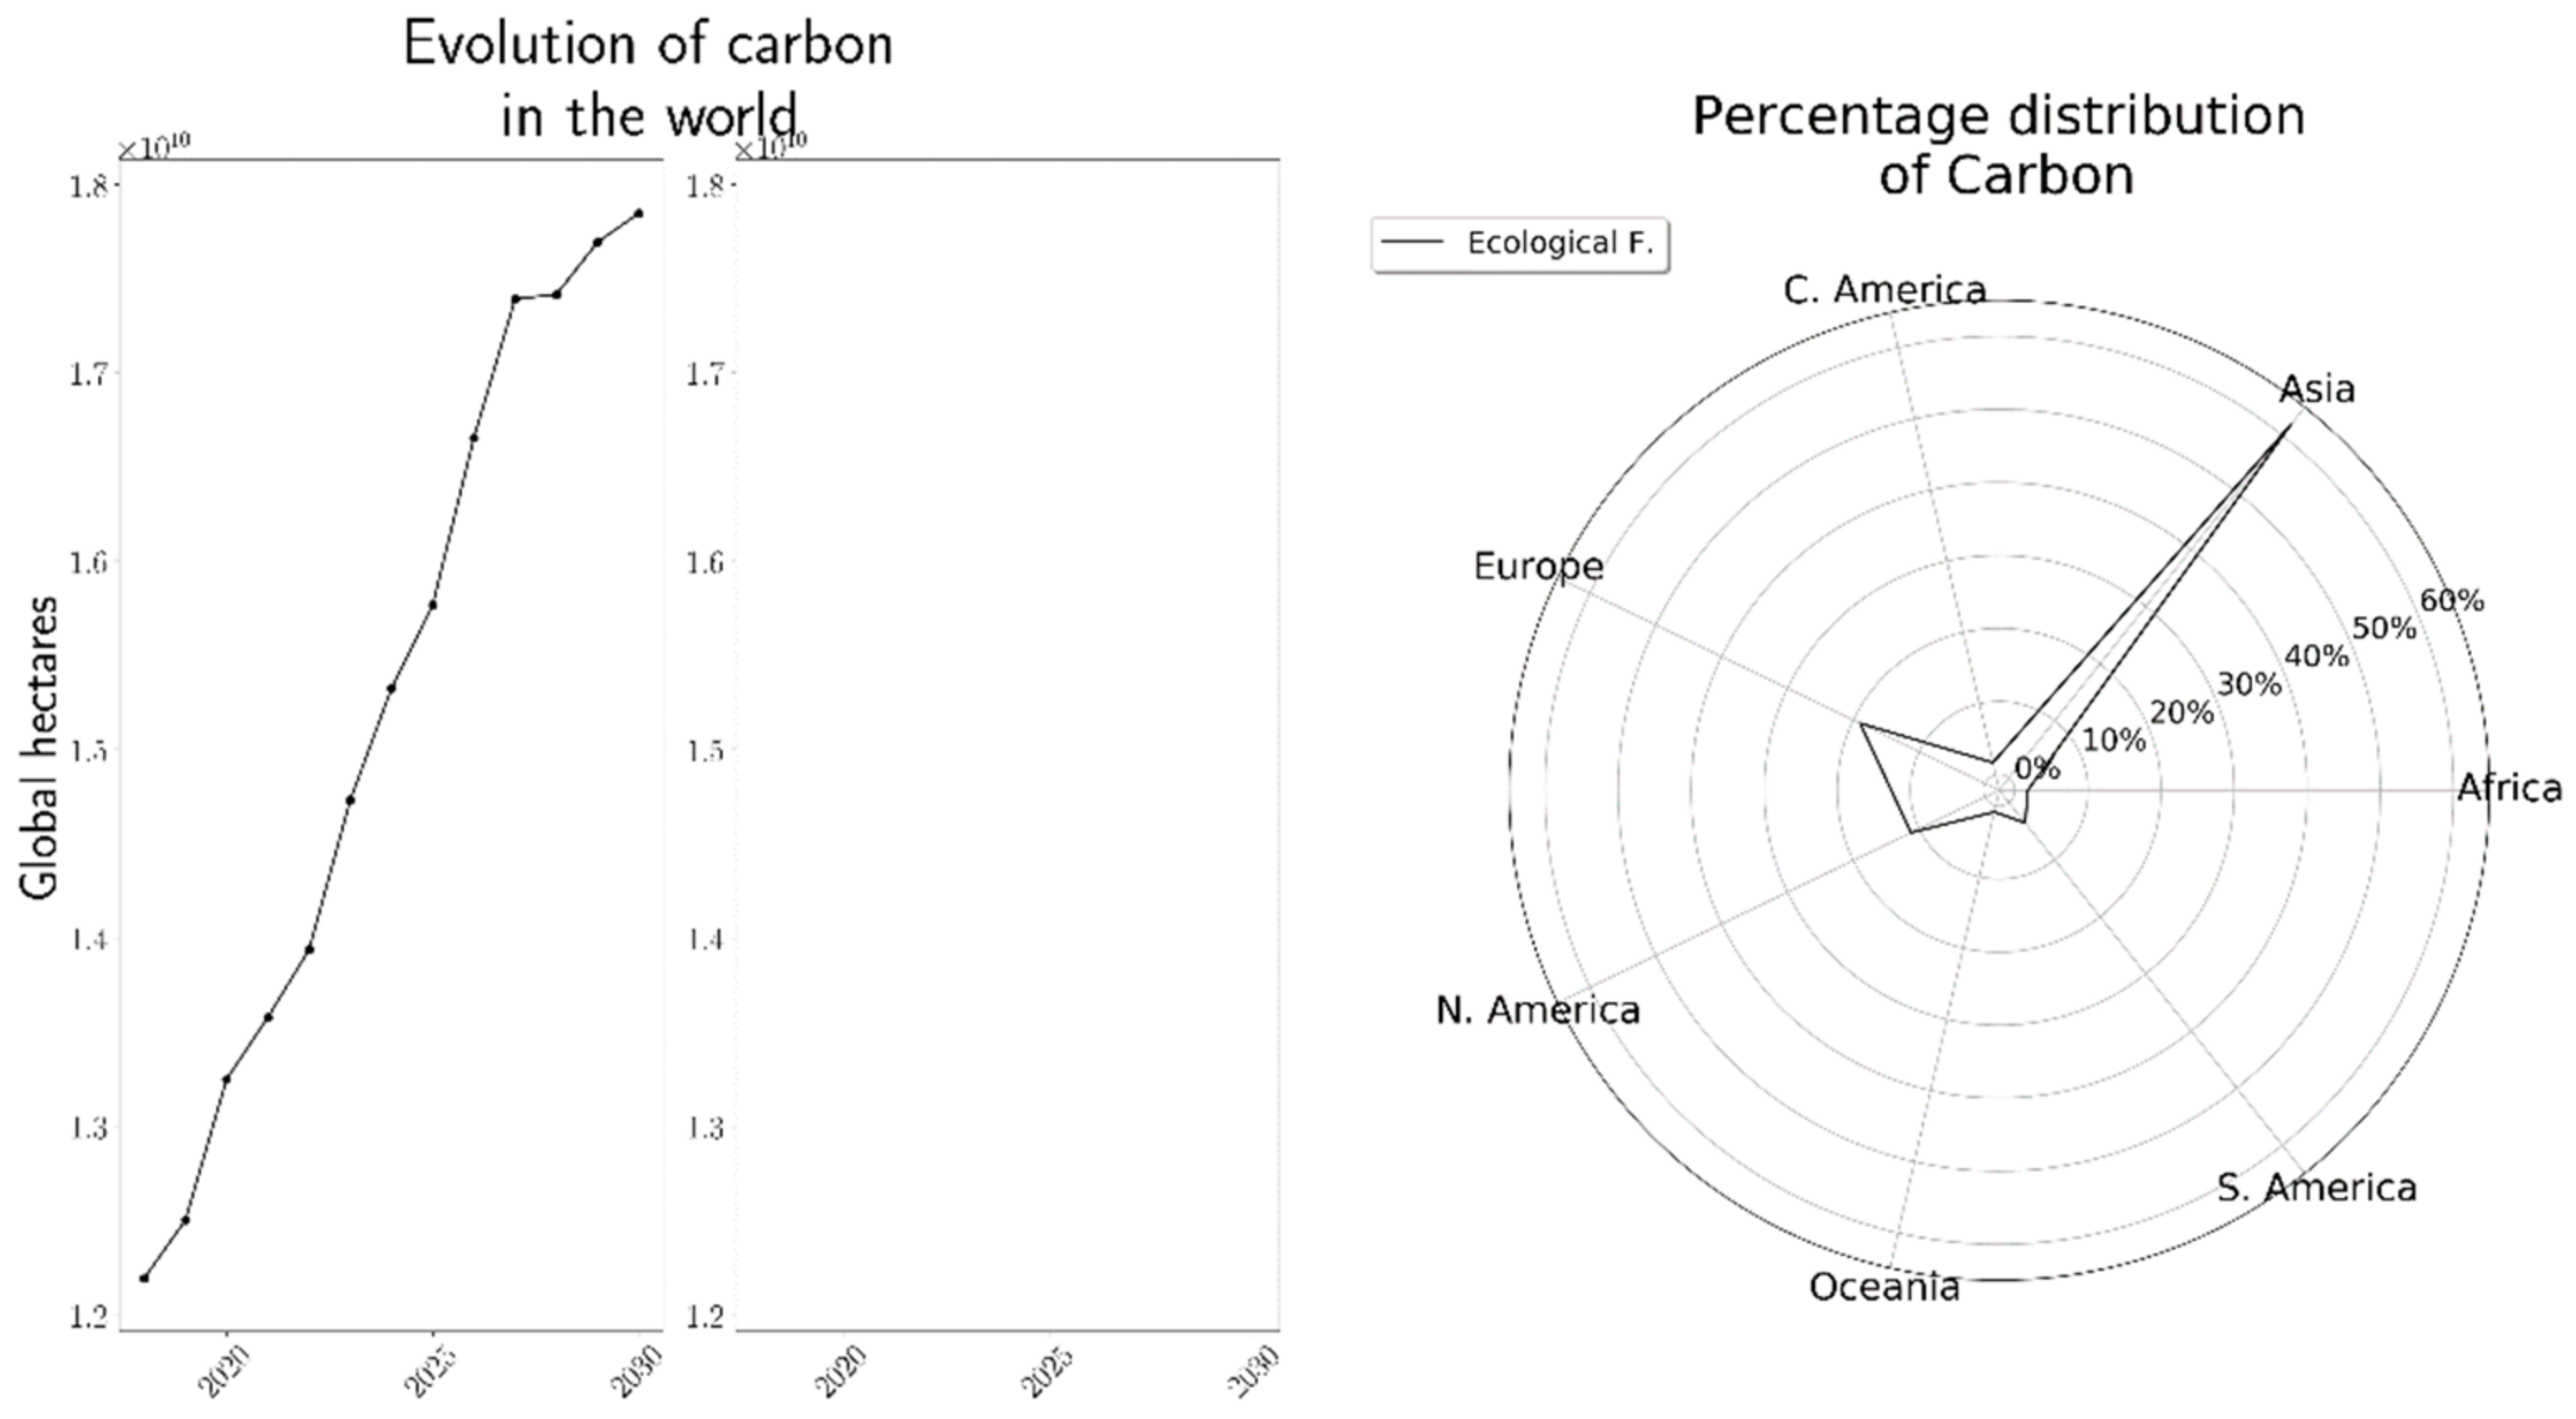
On the other hand, the carbon footprint is the distribution that has the greatest EF since it is managed at scales of an exponential order of E10. The scales of tens of millions are ten times more at any of the scales, as shown in
Figure 8. The distribution of this carbon footprint is especially focused on the economically better developed regions, such as Europe, North America, and Asia, with almost 90% of the global EF, which indicates that consumption needs in these regions exceed 10 times the biological capacities of all other territories―without considering the demand for an individual EF for human development for each terrain.
5. Conclusions
The results in Asia are much more alarming than those in other continents in all components (fishing grounds, grazing lands, forests, crops, built-up land, and carbon footprint) in terms of EF. This situation is different in the other continents where a higher BC stands out with respect to fishing grounds in South America; grazing lands in Europe and North America; and forest lands and croplands in South America, North America, and Europe. This situation provides opportunities to generate entrepreneurial innovations that promote the creation of new business models, integrating sustainable actions to reduce this impact.
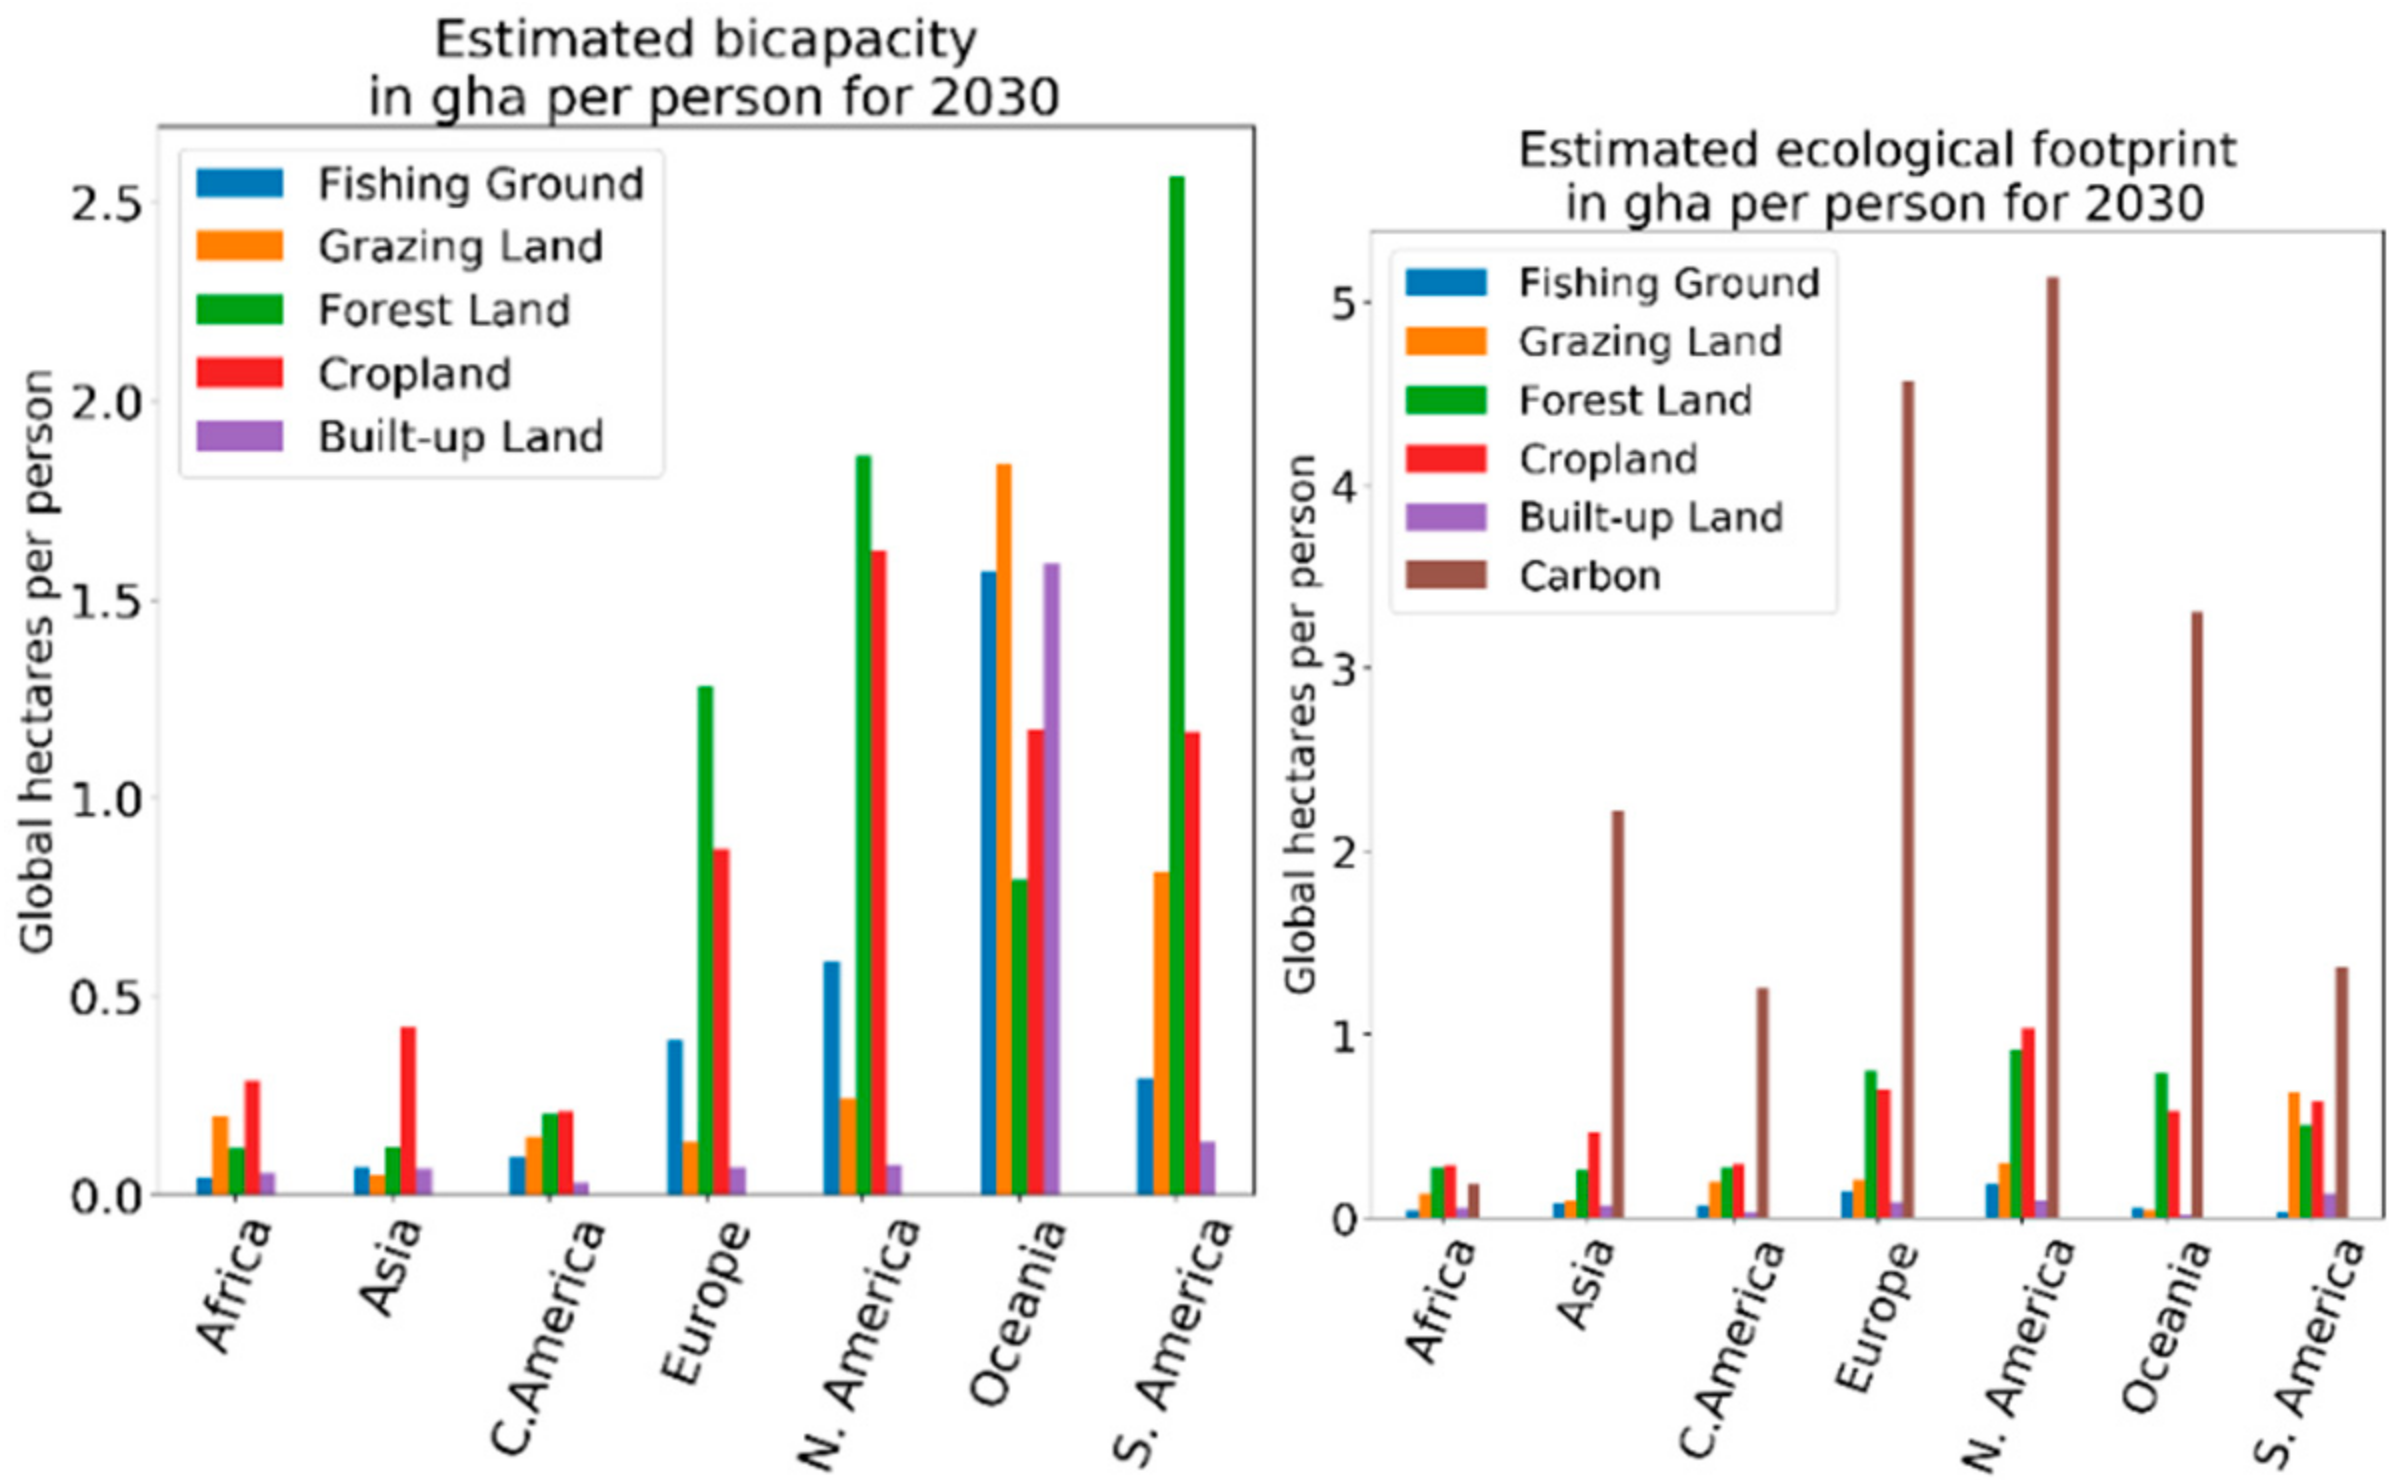
Further, we also estimated the BC and the EF in global hectares per person for the year 2030 (
Figure 9), using the data obtained from [
34,
35,
36].
As we can see in
Figure 9, the fishing grounds metric has a lower EF per person, but at the same time, it also has a lower BC. The opposite is the case in Oceania, which shows a better renewal of fishing resources, when compared to population density. It is important to consider the continuous migration of people and economies to coastal areas. Many economic development plans consider islands as potential sites, but islands have little freshwater, thin soil, and poor vegetation, and are susceptible to natural disasters [
22].
The same is true for Oceania and South America where the grazing land shows a better use of livestock and better policies in the control of rurality.
Regarding forests, South America has the highest BC, indicating the wealth it possesses despite the enormous overpopulation that occurs in several countries in this region. Farmland, on the other hand, in the global general world is presented balanced in all regions, remaining as a biologically sustainable land in most continents, especially Oceania, South America, and North America.
At the same time, the needs of the built land seem to have reached an equilibrium point in which the needs and the renovating goods for it are similar when they are calculated in population density; however, given the accelerated growth of the world population seen up to 2020, it is possible that the estimated value for these lands has been underestimated and that by the year 2030, the number of hectares needed will be much greater than what the algorithm detected from the annual trends (unless the contemporary birth controls will turn out to be highly effective in reducing human expansion).
The limitation of this study is that it was conducted in general for each continent. However, the objective of this study is met. The results show that by 2030, the EF will have an increasing trend greater than the growth of BC, which reflects the need to continue working actively in raising awareness for humanity’s interest in aligning expected results with the SDG 2030 agenda.
The results provide information that is useful for stakeholders and citizens, reflecting data with the potential to stimulate local environmental awareness, support local public policies, and inform the ongoing debate on the EF’s usefulness as a sustainability metric for countries. The results also point to specific policy insights for managing key consumption sectors and reaching targets as grazing lands [
23,
37], governments, and universities that have an important role in training people in different areas―entrepreneurship, management, and data analysis (Big Data)―because there is also the need to promote research with international and interdisciplinary collaboration on sustainability issues.


 ,
, 