
Performance Evaluation of Green Furniture Brands in the Marketing 4.0 Period: An Integrated MCDM Approach


Abstract
:1. Introduction
- What are the weights of the green furniture brand’s performance evaluation criteria (GFBPC) in the Marketing 4.0 period?
- According to GFBPCs, what is the performance ranking of the three green furniture brands with the highest market value in Turkey?
2. Literature Review
2.1. Brand Performance
2.2. Green Marketing in the Marketing 4.0 Period
2.2.1. Green Product
2.2.2. Green Price
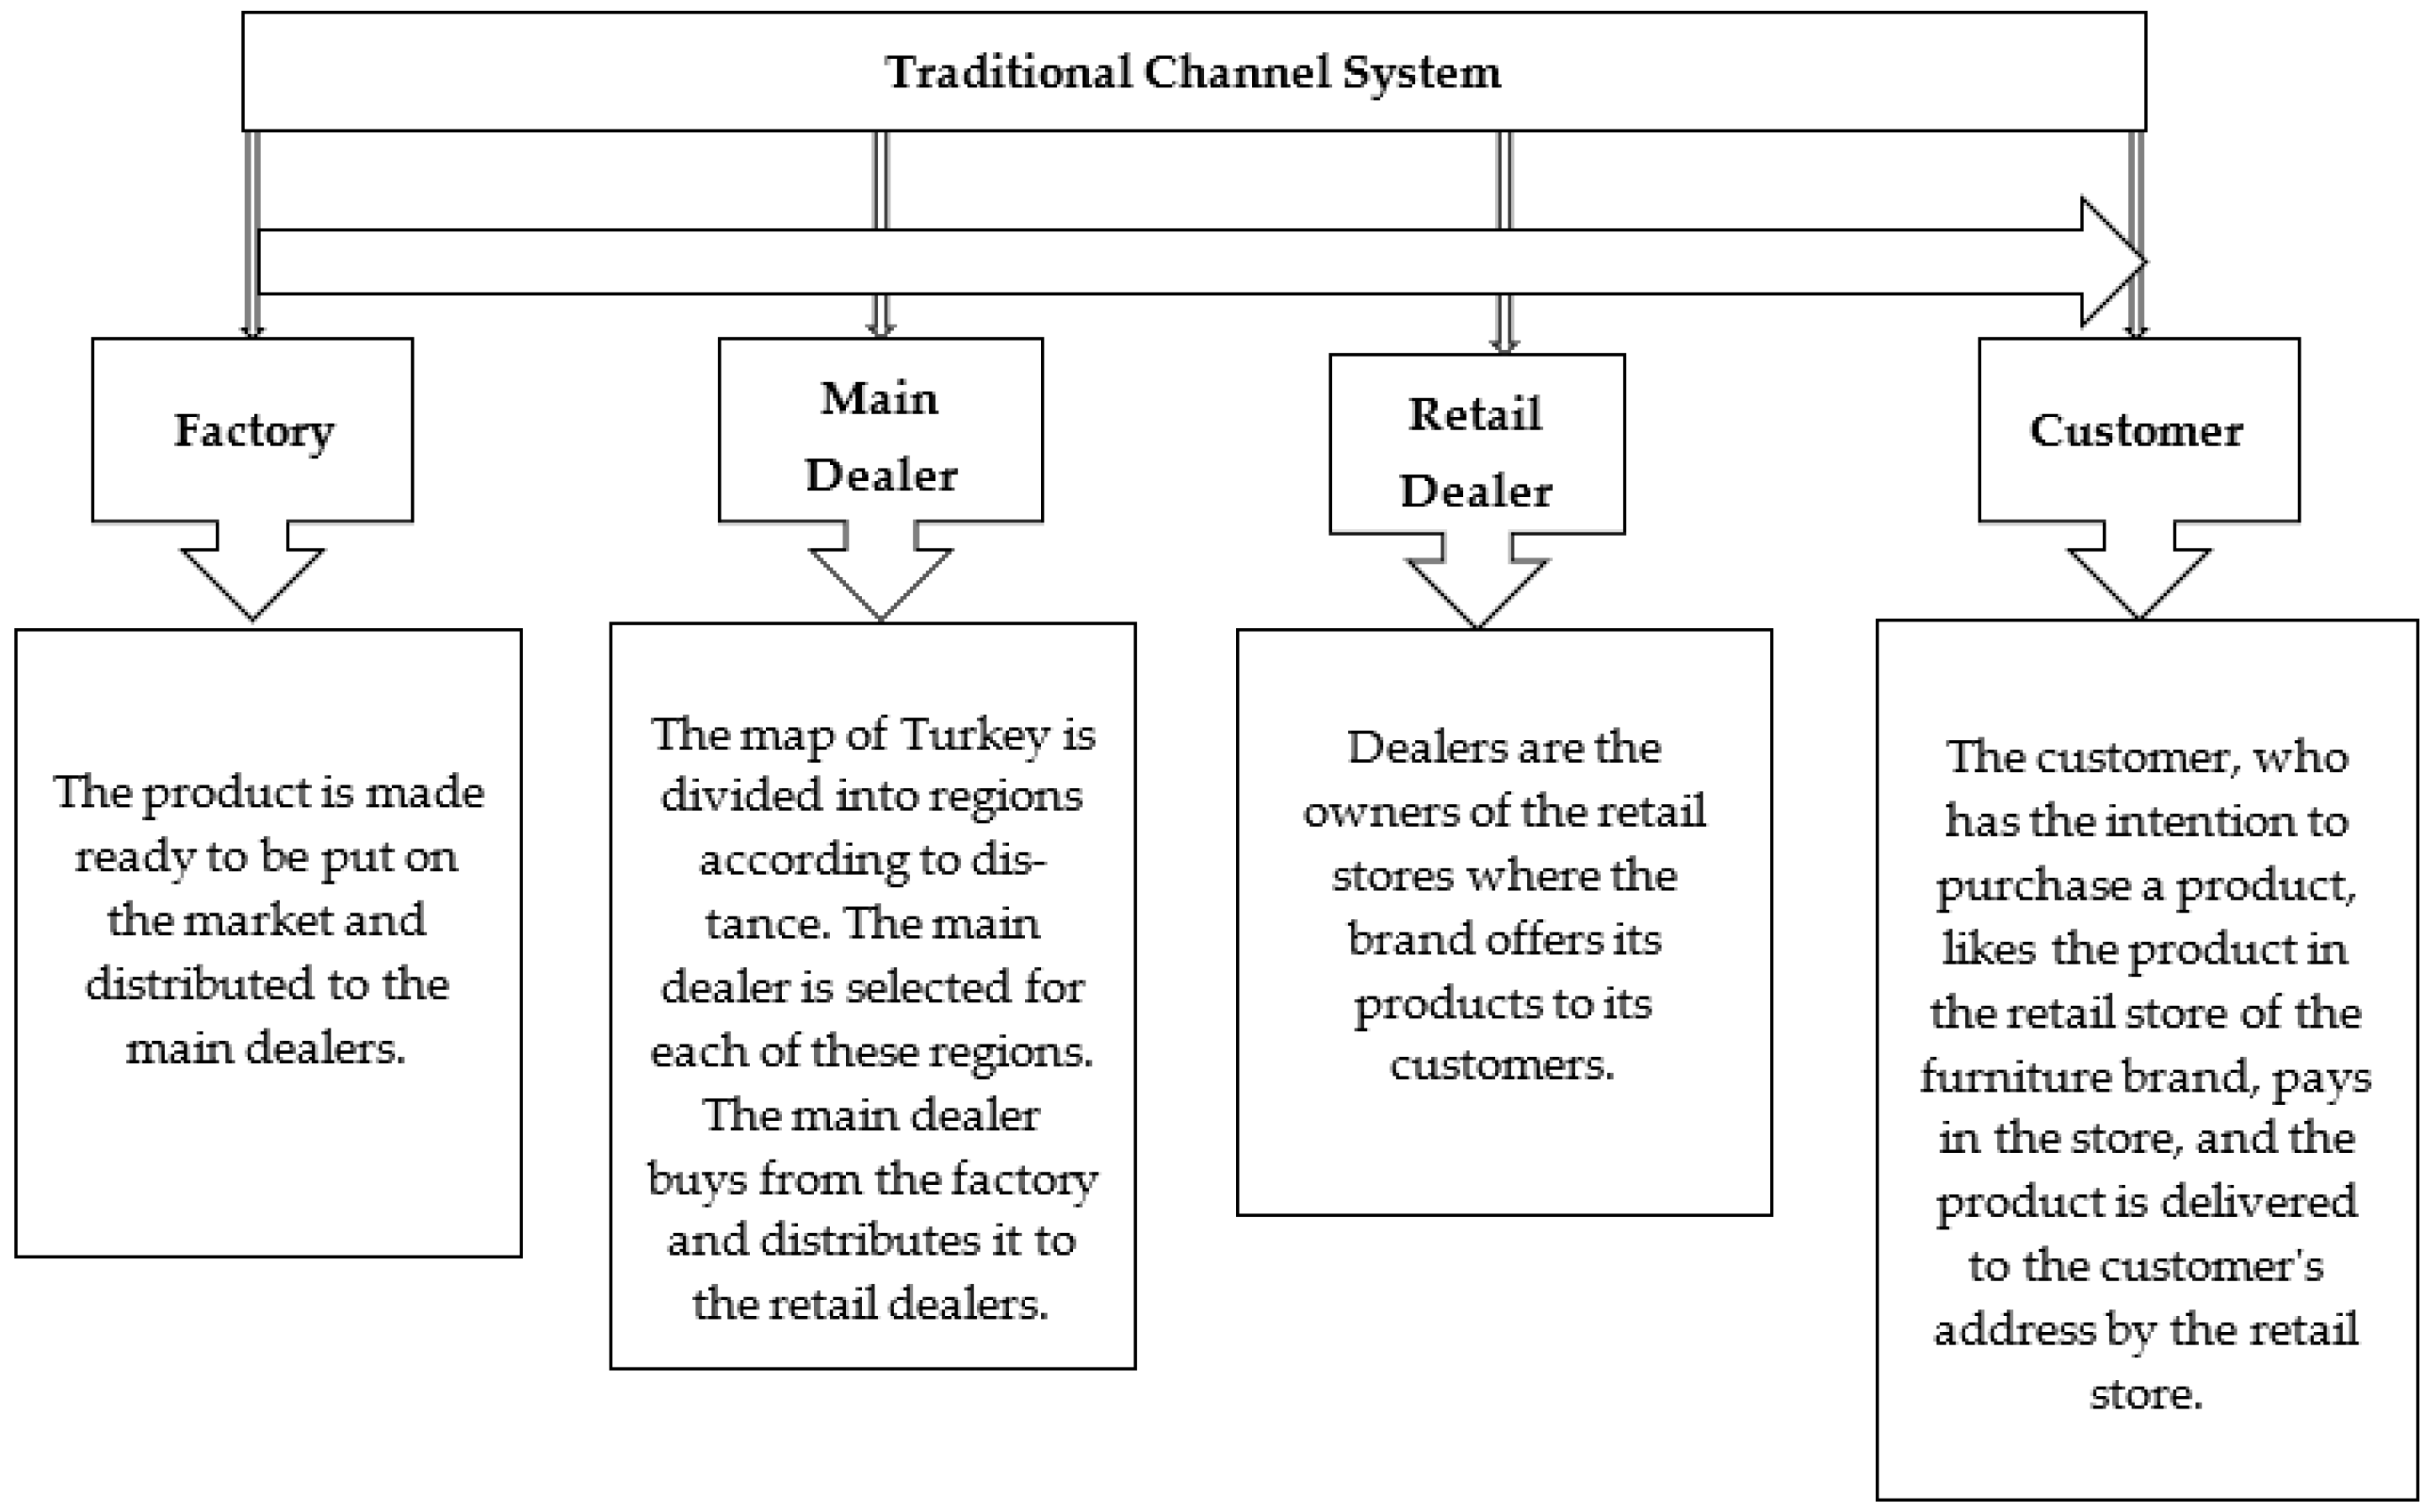
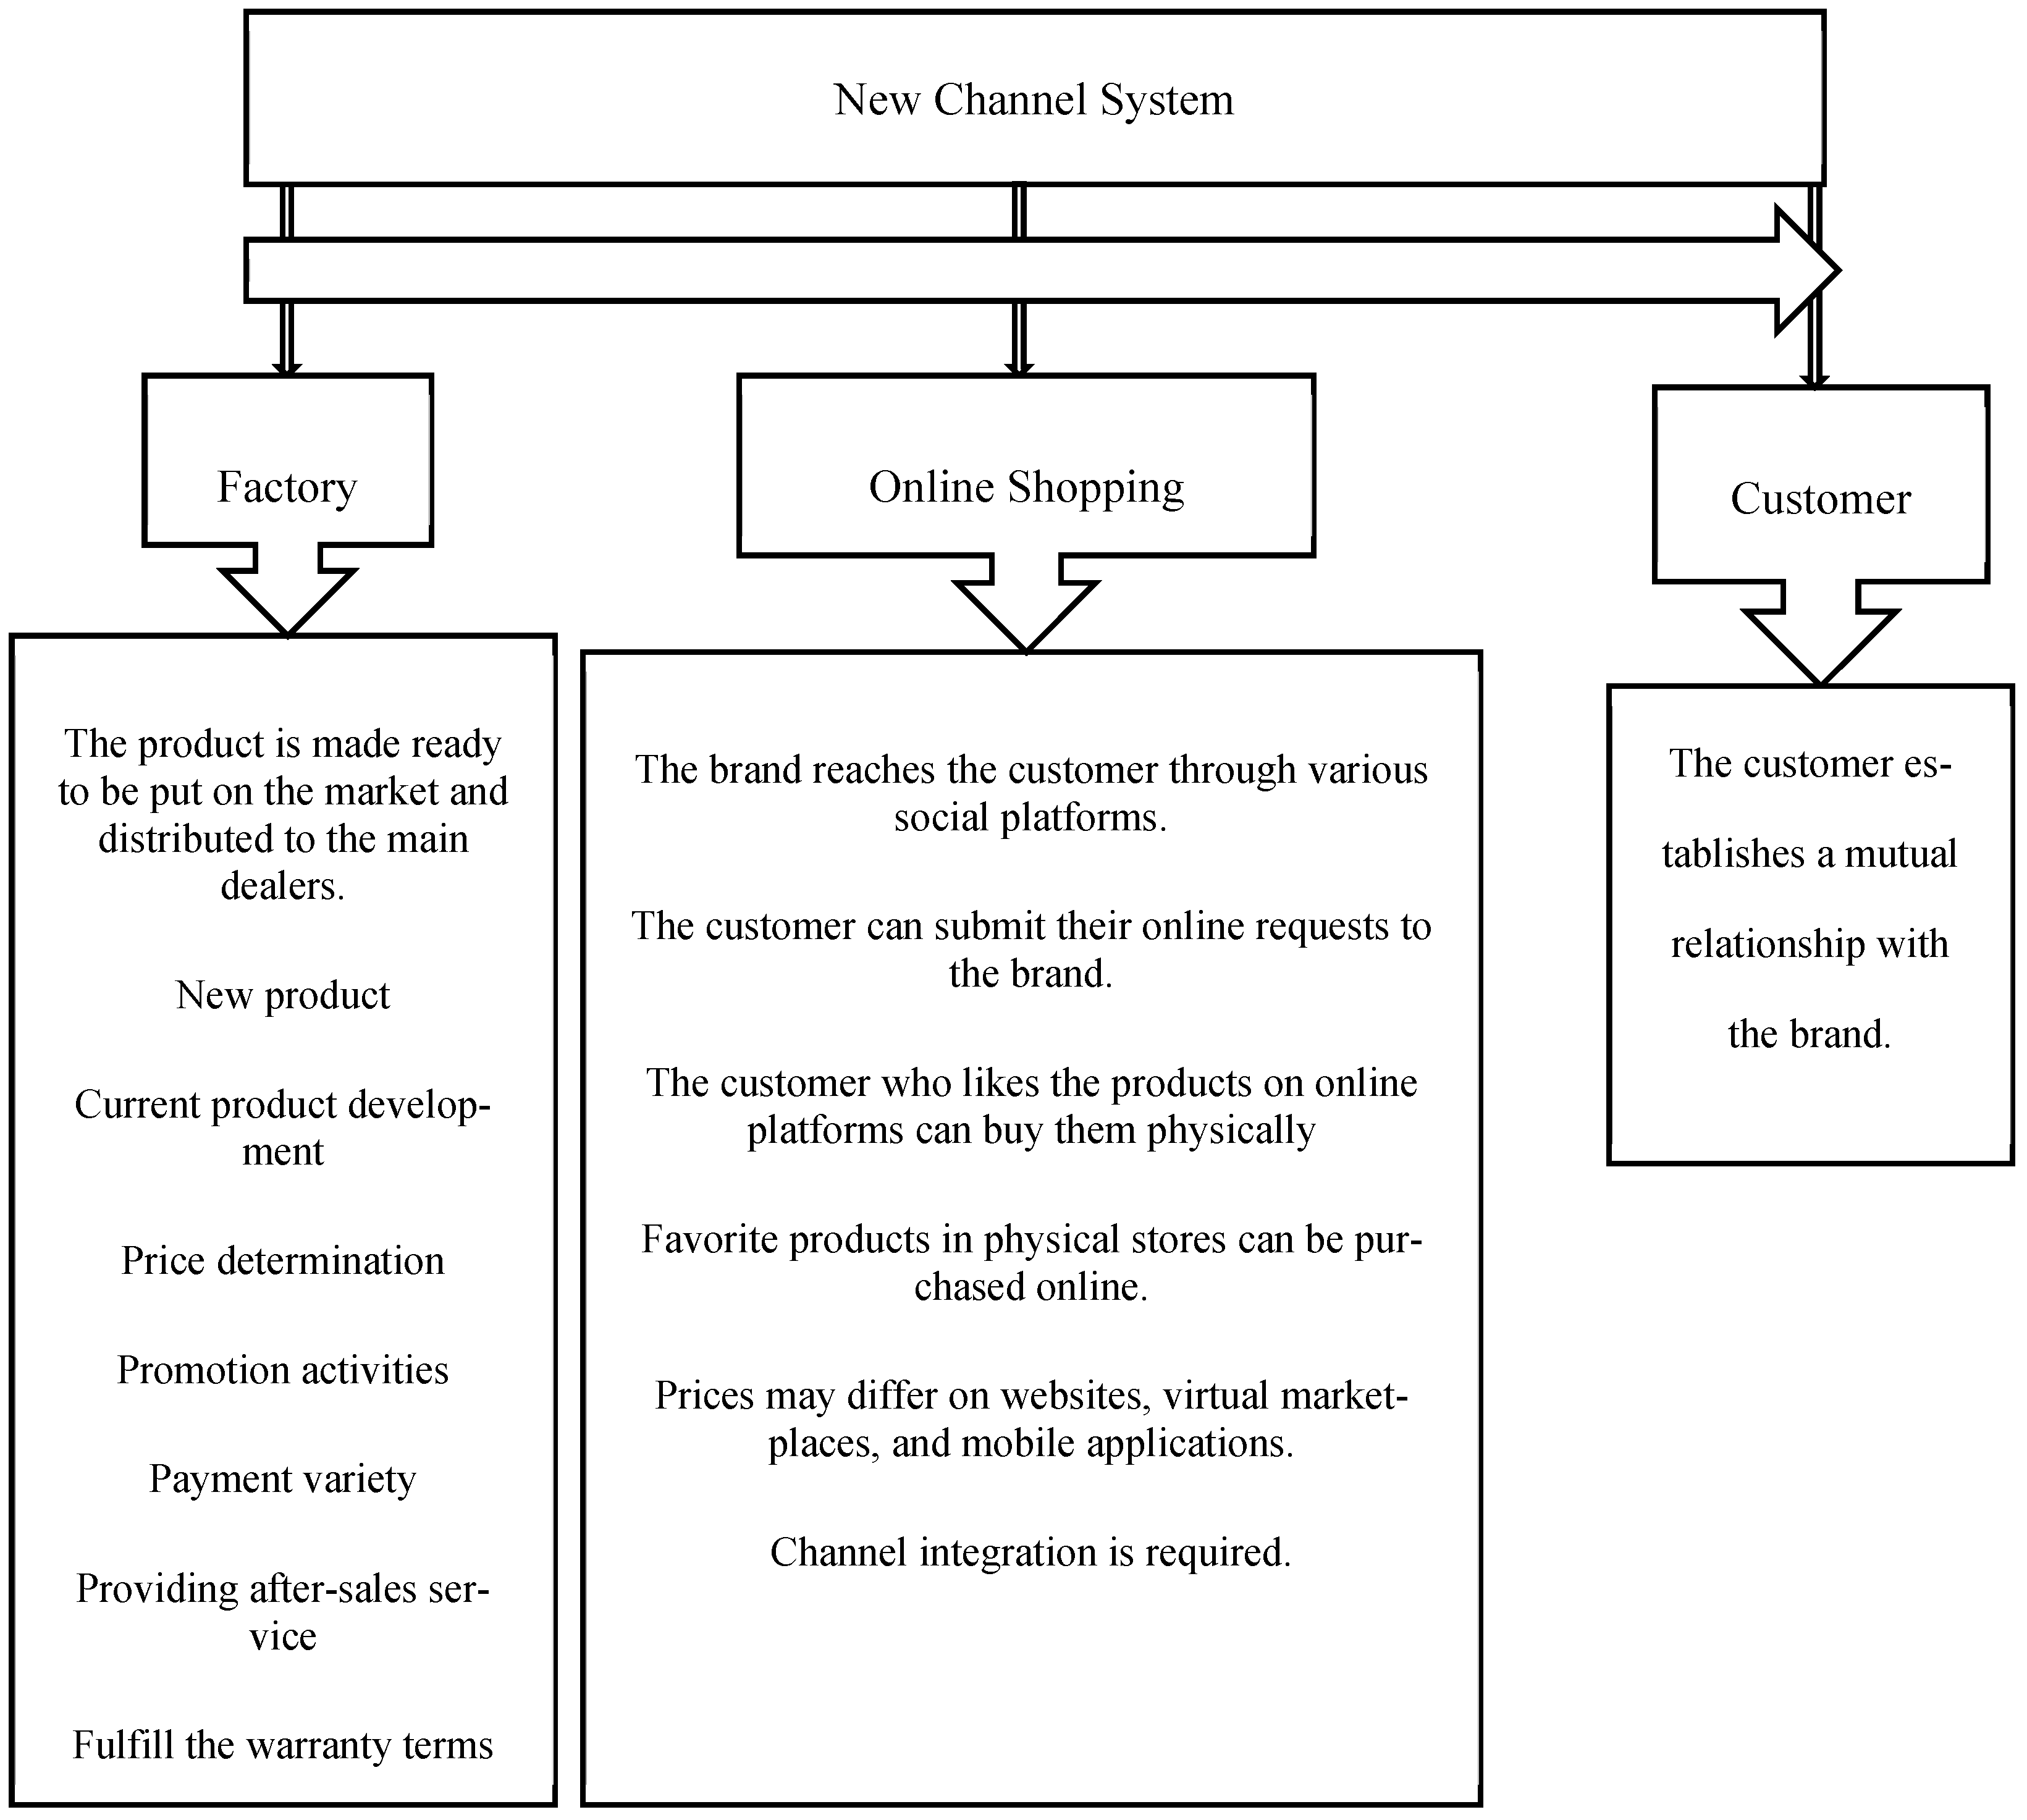
2.2.3. Green Place
- Less fuel consumption of vehicles providing transportation between distribution channels,
- reducing the number of trips with a more complex plan,
- minimizing environmental damage while doing all these.
2.2.4. Green Promotion
2.3. Multi-Criteria Decision Making (MCDM) Related Literature
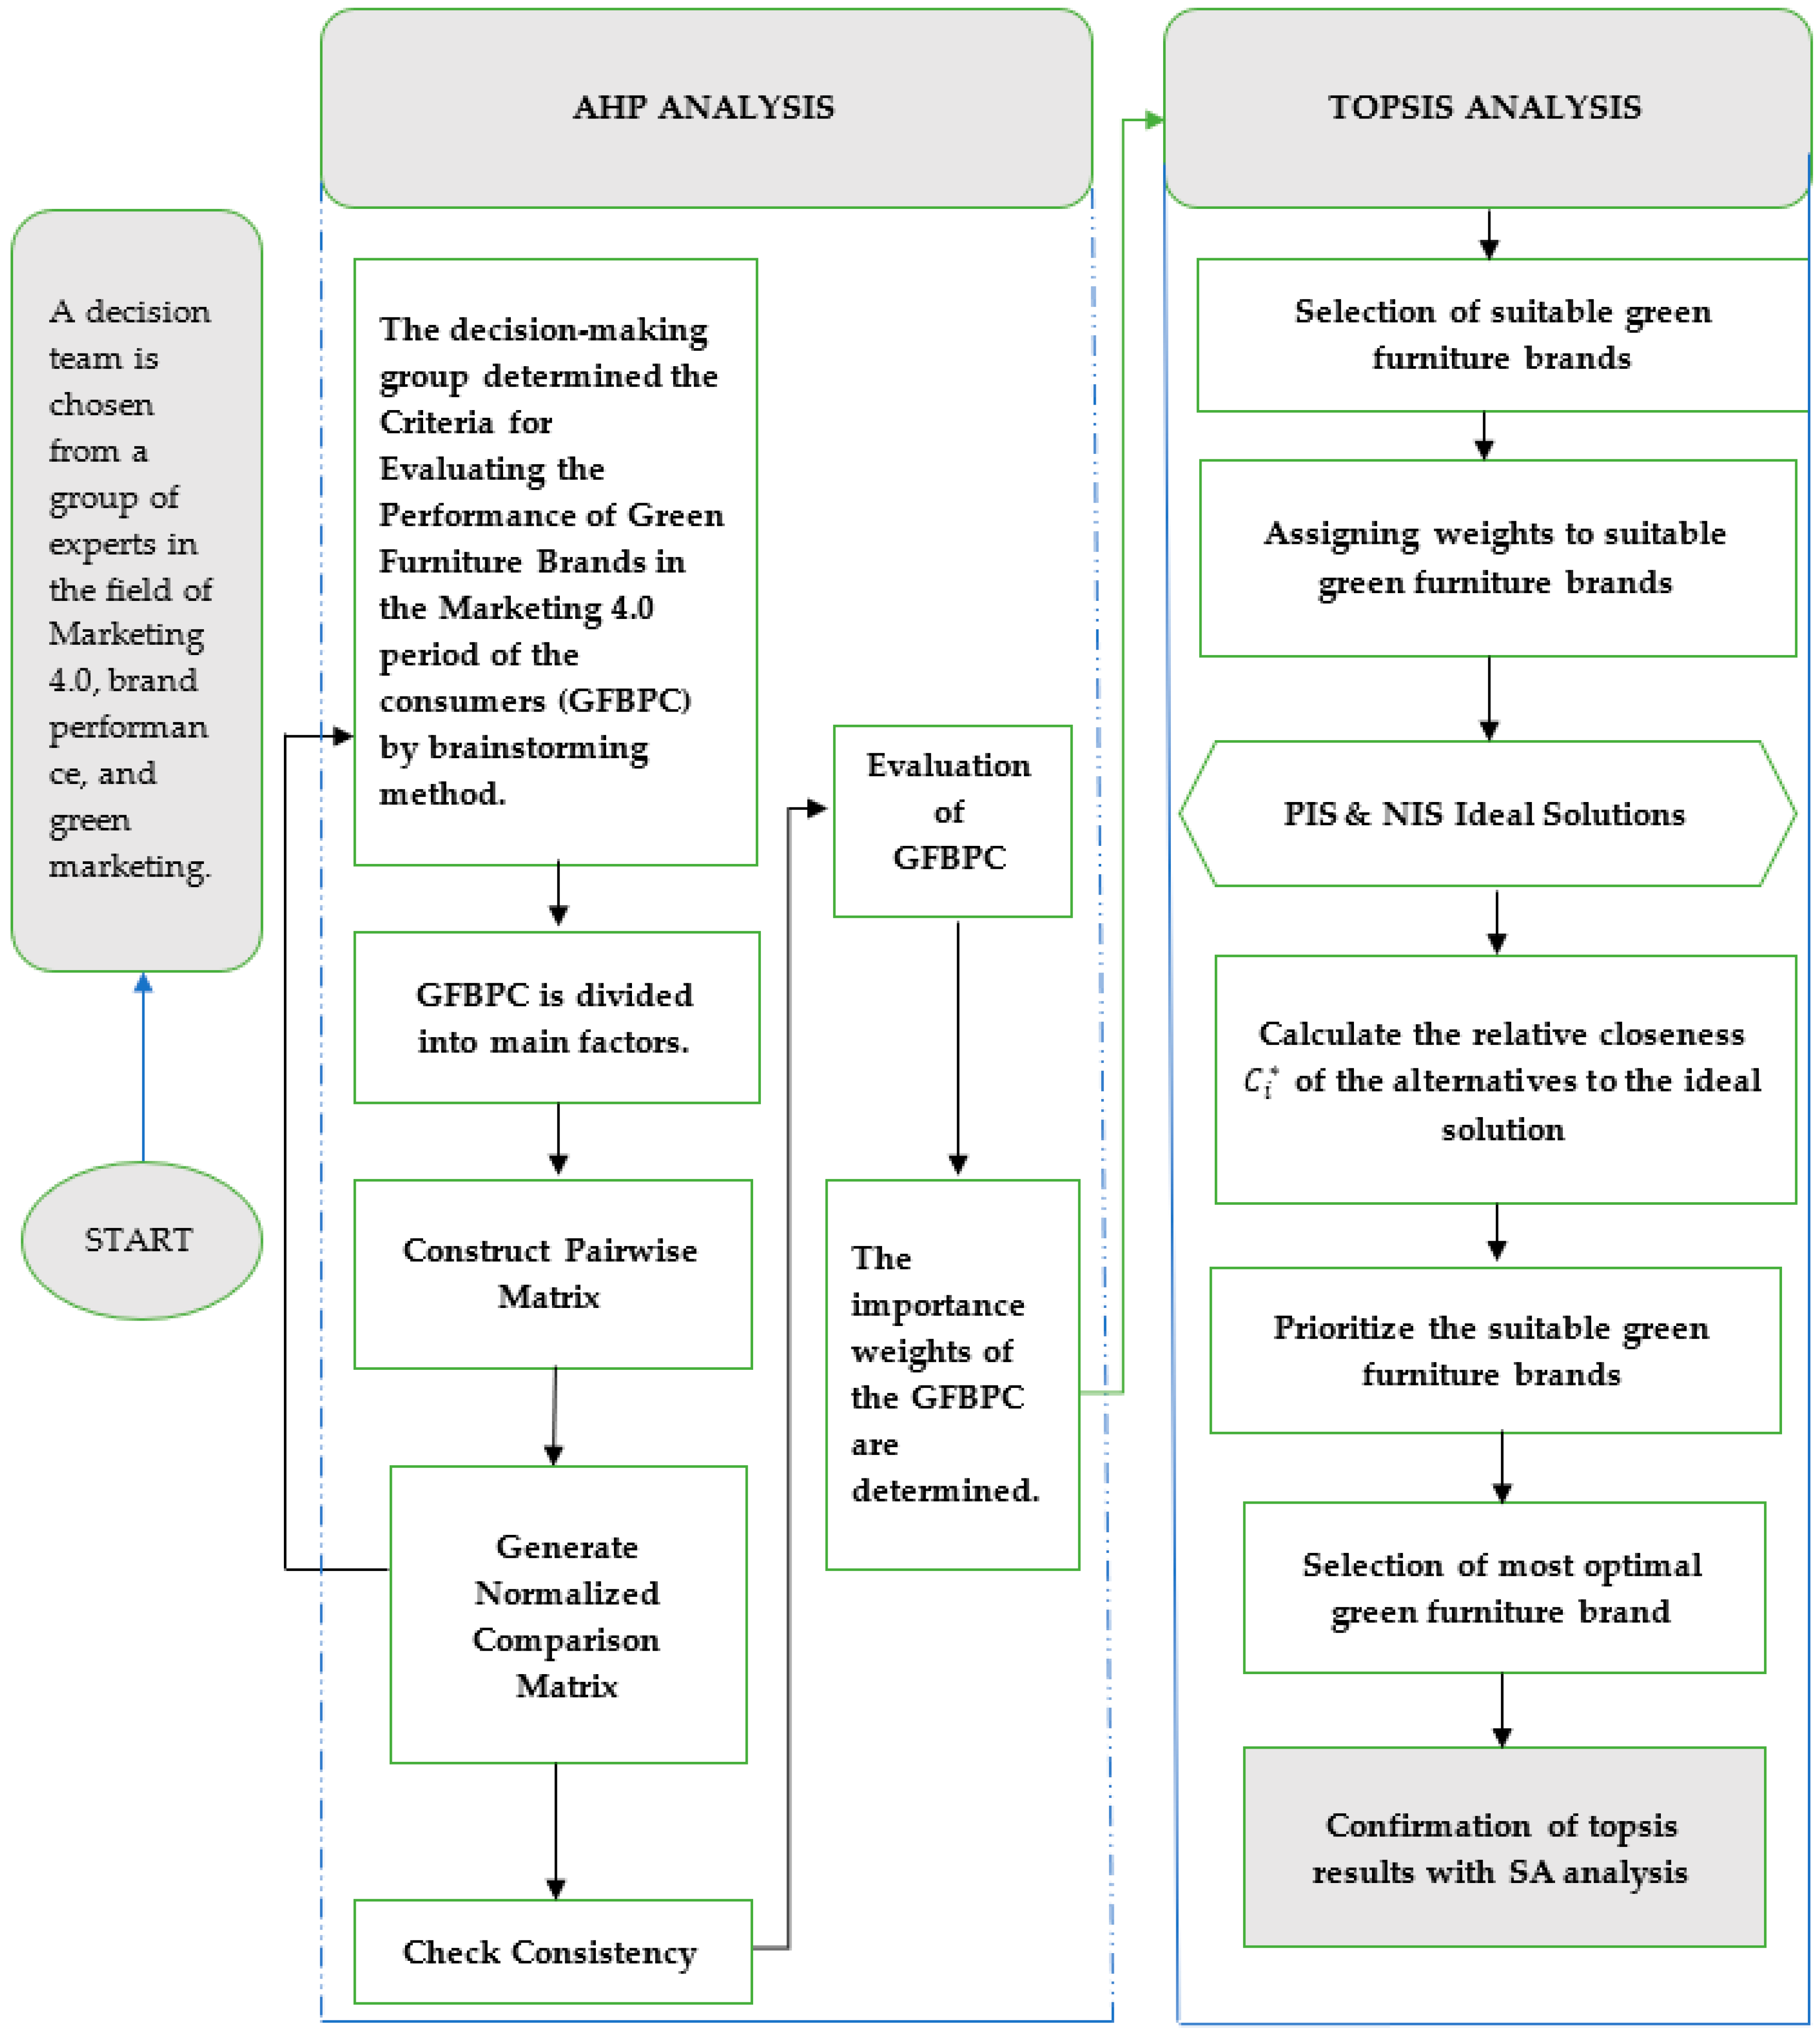
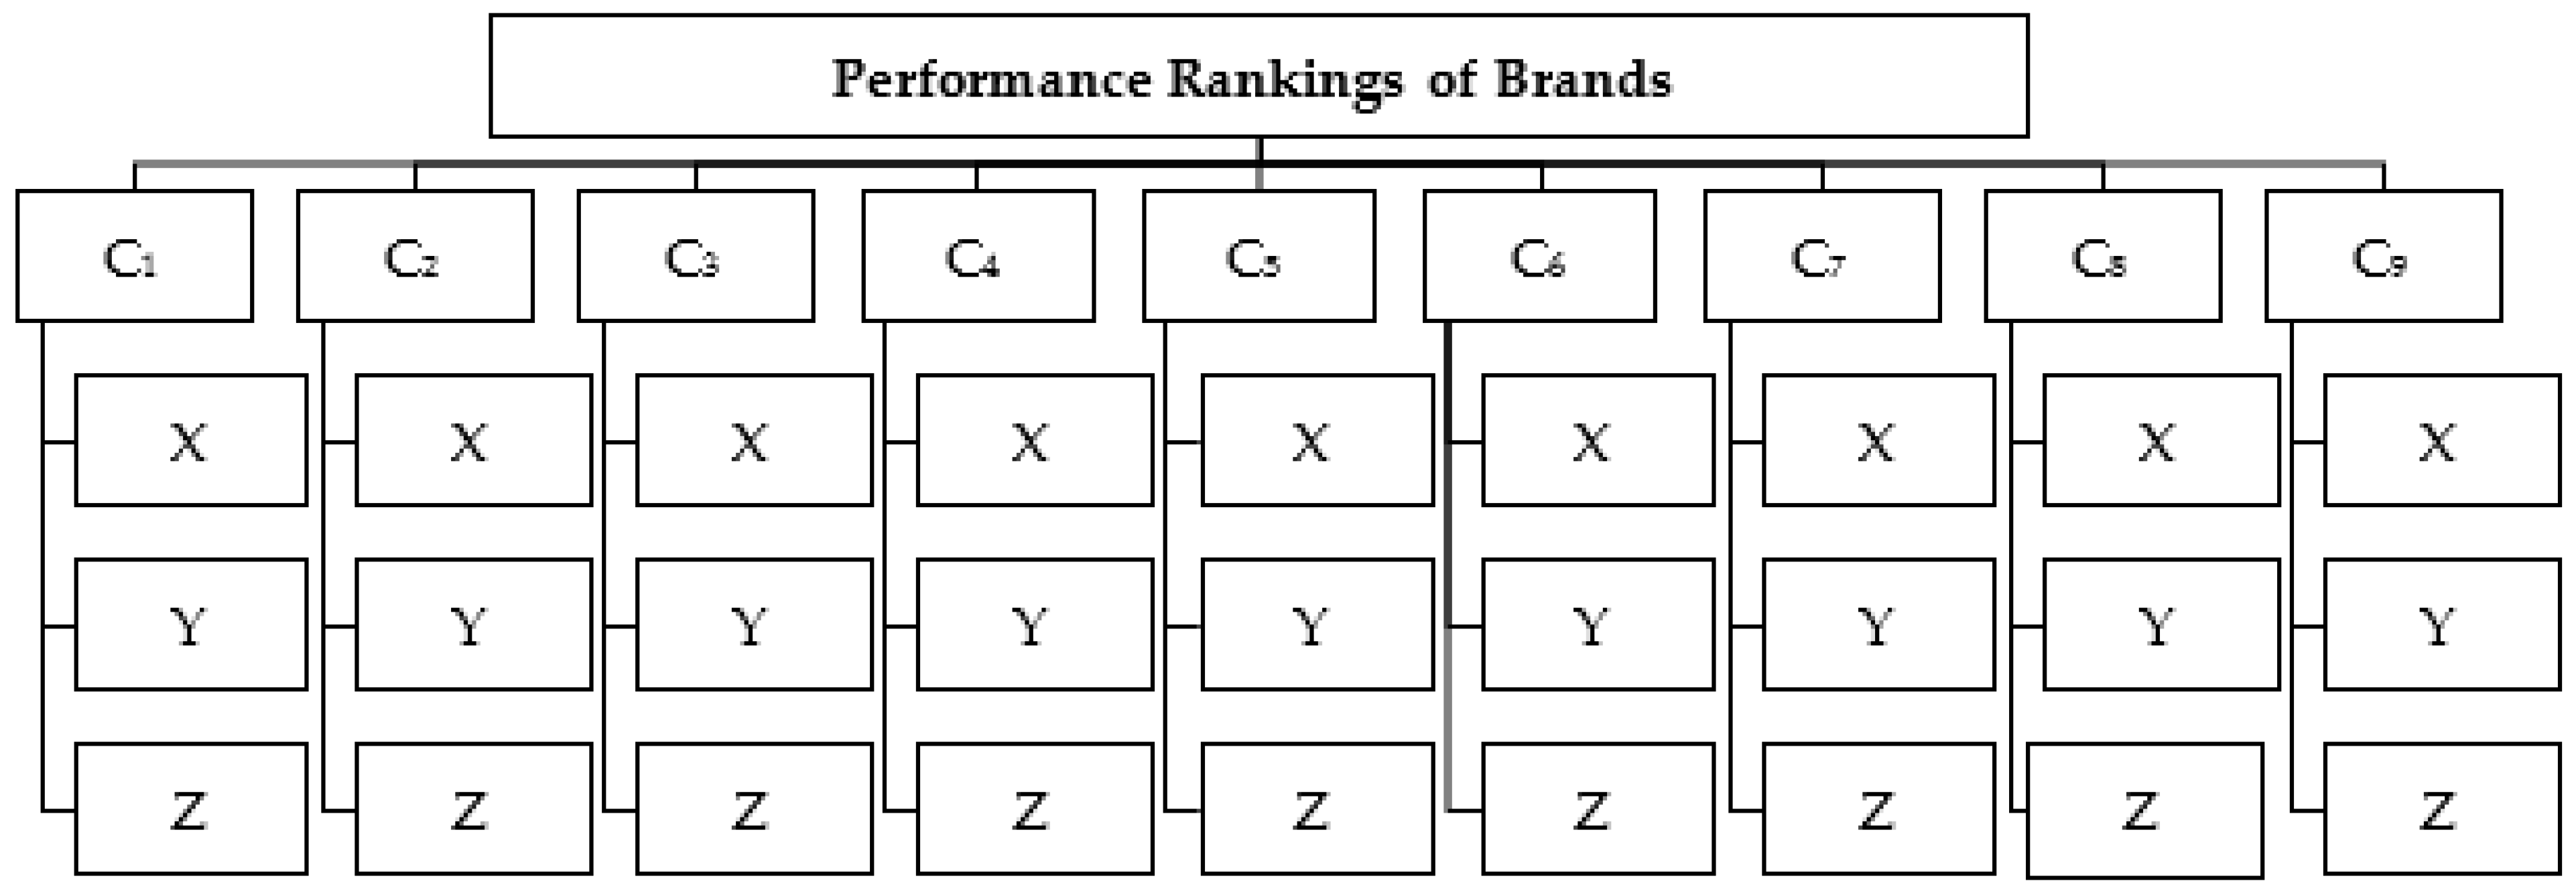
3. Methodology
3.1. Co-creation of Value (C1)
3.2. Pricing (C2)
3.3. Channel (C3)
3.4. Promotion Activities (C4)
3.5. Product Quality (C5)
3.6. Product Variety (C6)
3.7. Trust and Loyalty to the Brand (C7)
3.8. After-Sales Service (C8)
3.9. Payment Variety (C9)
4. Results
4.1. Reliability and Validity Results for the AHP Scale
4.2. AHP and TOPSIS, SA Results
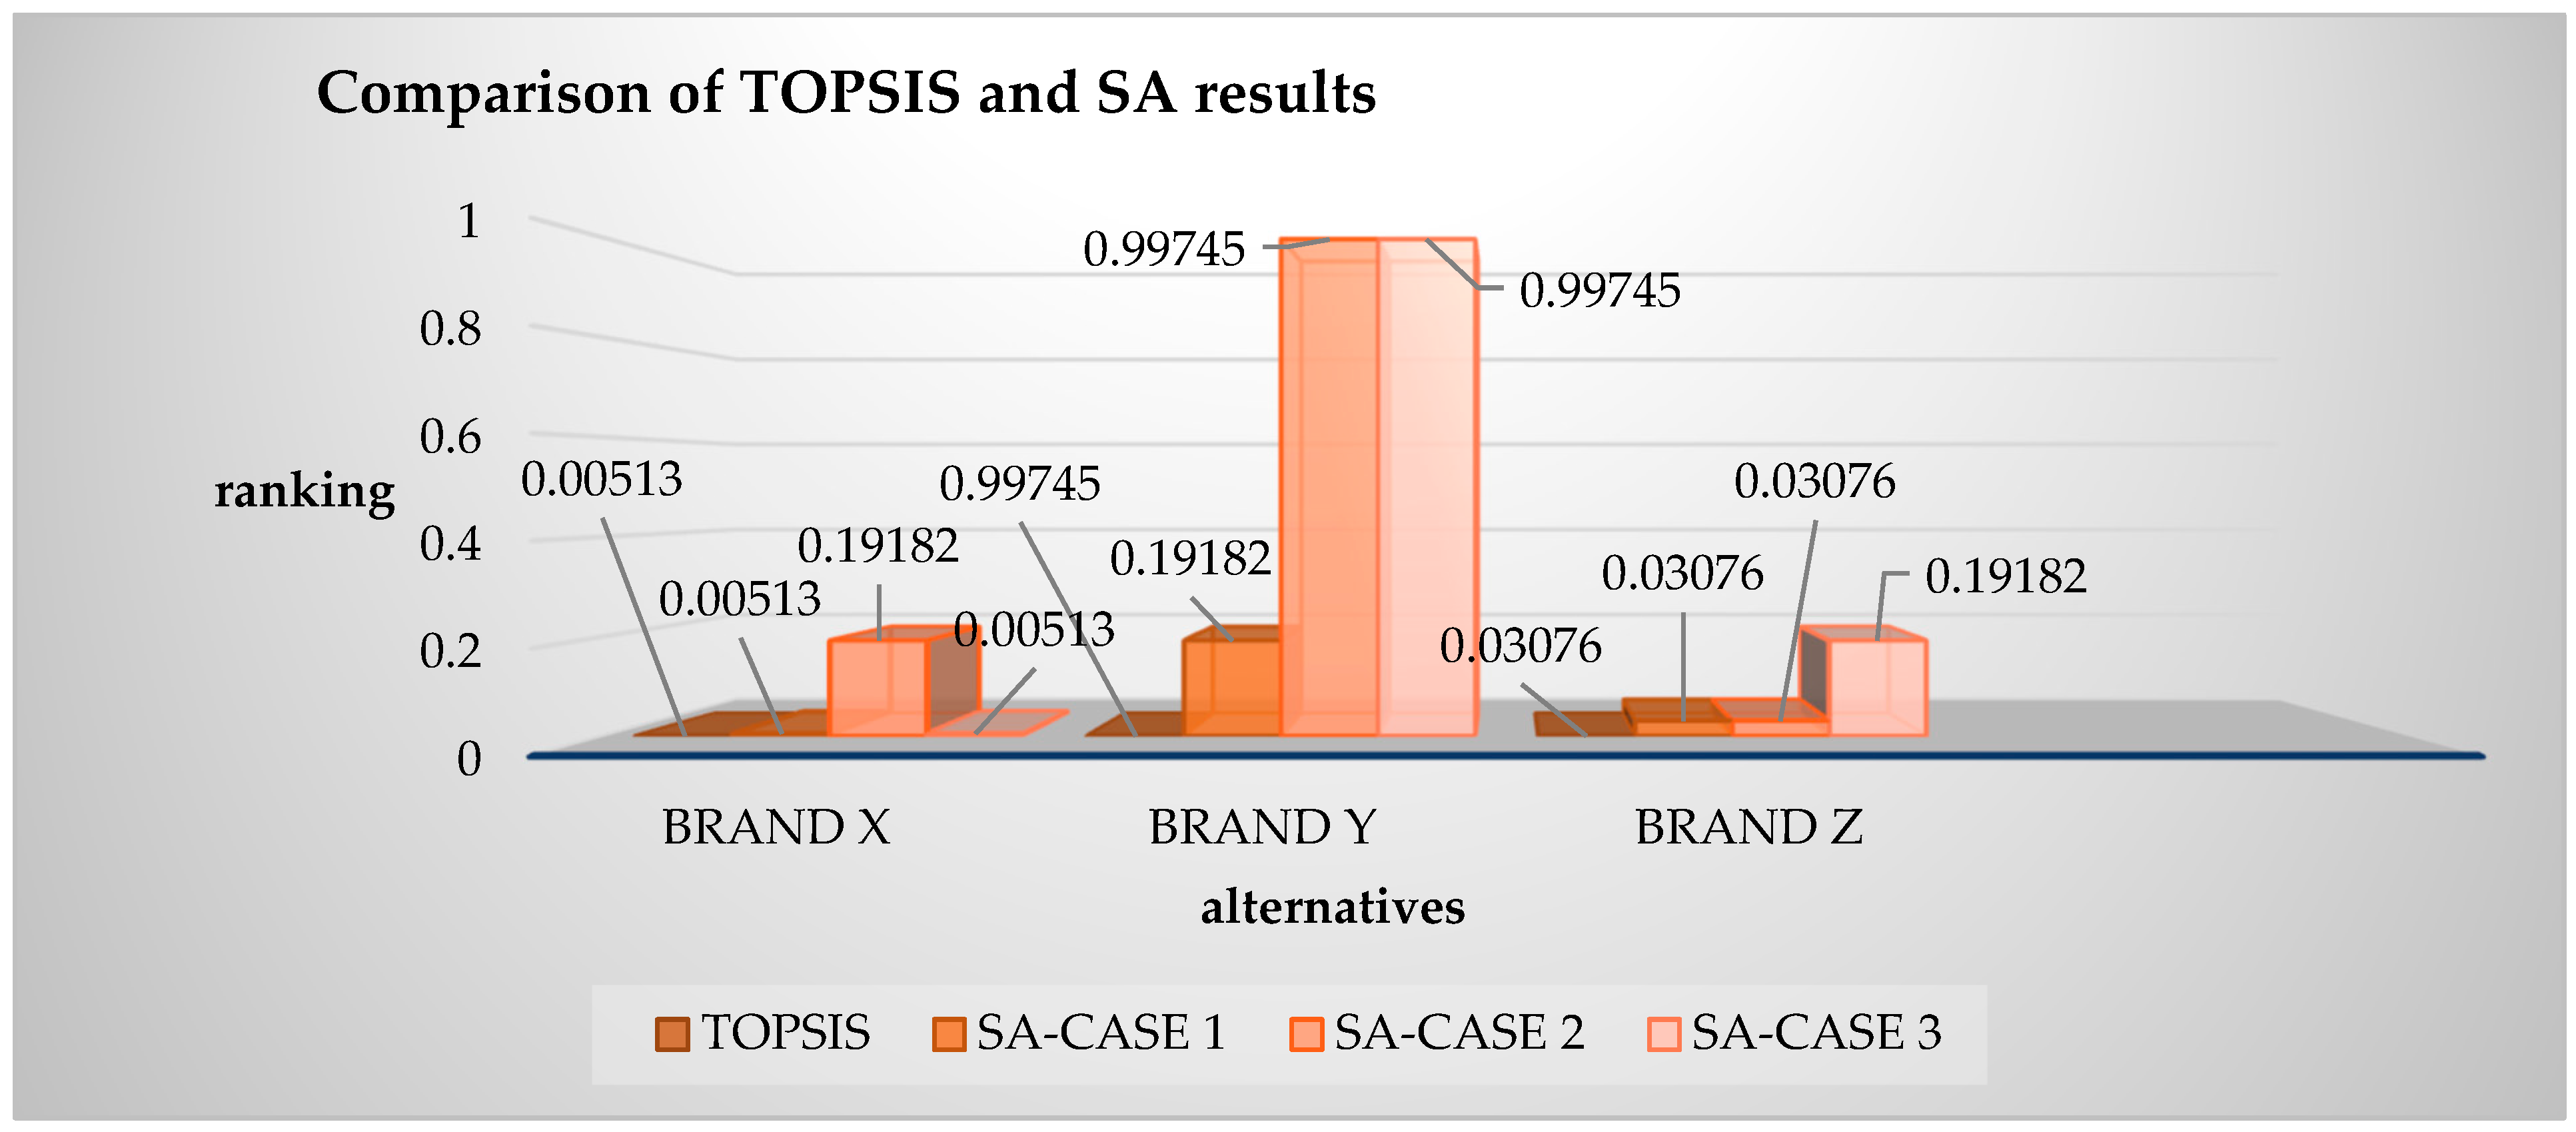
4.3. Sensitivity Analysis for TOPSIS Results
5. Discussion
5.1. Theoretical Implications
5.2. Managerial Implications
6. Conclusions
Author Contributions
Funding
Institutional Review Board Statement
Informed Consent Statement
Data Availability Statement
Conflicts of Interest
Appendix A
| Member | Age | Gender | Experience (years) | Position | Company/University Name |
| 1 | 38 | Female | 9 | Brand Manager | Bellona/Turkey |
| 2 | 42 | Female | 14 | marketing manager | Dogtas/Turkey |
| 3 | 28 | Male | 3 | sales expert | Cilek/Turkey |
| 4 | 34 | Female | 6 | customer relations manager | Bellona/Turkey |
| 5 | 52 | Male | 22 | Regional marketing manager | Istıkbal/Turkey |
| 6 | 60 | Male | 35 | general manager | Mondi/Turkey |
| 7 | 54 | Male | 24 | general manager | Mudo/Turkey |
| 8 | 28 | Female | 5 | e-commerce specialist | Bellona/Turkey |
| 9 | 32 | Female | 8 | marketing manager/computer engineer | Bellona/Azerbaijan |
| 10 | 32 | Male | 9 | Director Operation | Istikbal/Turkey |
| 11 | 41 | Male | 15 | store owner | Cilek/Turkey |
| 12 | 43 | Male | 15 | store owner | Bambi/Turkey |
| 13 | 45 | Male | 19 | professor in marketing | Ankara University/Turkey |
| 14 | 33 | Female | 13 | postdoctoral researcher and brand manager | Gazi University/Bellona/Turkey |
| 15 | 32 | Male | 6 | store owner/Engineer of mechatronics | Karabuk University/Istikbal/Turkey |
| 16 | 38 | Female | 15 | professor in marketing | TOBB University/Turkey |
| 17 | 30 | Male | 8 | Assistant Professor | Gazi University Turkey |
| 18 | 52 | Male | 22 | store owner | Bellona/Germany |
| 19 | 55 | Male | 24 | Marketing Manager | Bellona/Germany |
References
- dos Santos, B.M.; Godoy, L.P.; Campos, L.M.S. Performance Evaluation of Green Suppliers Using Entropy-TOPSIS-F. J. Clean. Prod. 2019, 207, 498–509. [Google Scholar] [CrossRef]
- Sellitto, M.A.; Camfield, C.G.; Buzuku, S. Green Innovation and Competitive Advantages in a Furniture Industrial Cluster: A Survey and Structural Model. Sustain. Prod. Consum. 2020, 23, 94–104. [Google Scholar] [CrossRef]
- Xu, X.; Wang, S.; Yu, Y. Consumer’s Intention to Purchase Green Furniture: Do Health Consciousness and Environmental Awareness Matter? Sci. Total Environ. 2020, 704, 135275. [Google Scholar] [CrossRef] [PubMed]
- Yadav, V.S.; Singh, A.R.; Gunasekaran, A.; Raut, R.D.; Narkhede, B.E. A Systematic Literature Review of the Agro-Food Supply Chain: Challenges, Network Design, and Performance Measurement Perspectives. Sustain. Prod. Consum. 2022, 29, 685–704. [Google Scholar] [CrossRef]
- Keller, K.L. Leveraging Secondary Associations to Build Brand Equity: Theoretical Perspectives and Practical Applications. Int. J. Advert. 2020, 39, 448–465. [Google Scholar] [CrossRef]
- Aaker, D. Managing Brand Equity; Free Press: New York, NY, USA, 1991. [Google Scholar]
- Tarigan, Z.J.H.; Mochtar, J.; Basana, S.R.; Siagian, H. The Effect of Competency Management on Organizational Performance through Supply Chain Integration and Quality. Uncertain Supply Chain. Manag. 2021, 9, 283–294. [Google Scholar] [CrossRef]
- Kang, S.; Hur, W.-M. Investigating the Antecedents of Green Brand Equity: A Sustainable Development Perspective. Corp. Soc. Responsib. Environ. Manag. 2012, 19, 306–316. [Google Scholar] [CrossRef]
- Abu Seman, N.A.; Govindan, K.; Mardani, A.; Zakuan, N.; Mat Saman, M.Z.; Hooker, R.E.; Ozkul, S. The Mediating Effect of Green Innovation on the Relationship between Green Supply Chain Management and Environmental Performance. J. Clean. Prod. 2019, 229, 115–127. [Google Scholar] [CrossRef]
- Hasan, Z.; Ali, N.A. The Impact of Green Marketing Strategy on the Firm’s Performance in Malaysia. Procedia Soc. Behav. Sci. 2015, 172, 463–470. [Google Scholar] [CrossRef]
- Nguyen-Viet, B. The Impact of Green Marketing Mix Elements on Green Customer Based Brand Equity in an Emerging Market. Asia-Pac. J. Bus. Adm. 2022; ahead-of-print. [Google Scholar] [CrossRef]
- Ng, P.F.; Butt, M.M.; Khong, K.W.; Ong, F.S. Antecedents of Green Brand Equity: An Integrated Approach. J. Bus. Ethics 2014, 121, 203–215. [Google Scholar] [CrossRef]
- TUIK Furniture Industry Report; Erai Turkey: Istanbul, Turkey, 2021.
- AKIB Report Furniture, Paper and Forest Products Industry Export Numbers Evaluation 2022 March Report; AKIB: Mersin, Turkey, 2022.
- Hashemi, A.; Dowlatshahi, M.B.; Nezamabadi-pour, H. MFS-MCDM: Multi-Label Feature Selection Using Multi-Criteria Decision Making. Knowl. Based Syst. 2020, 206, 106365. [Google Scholar] [CrossRef]
- Atthirawong, W. Using Multi-Criteria Decision-Making (MCDM) For Green Supplier Selection. In Proceedings of the 33rd International ECMS Conference on Modelling and Simulation, Caserta, Italy, 11–14 June 2019; pp. 330–335. [Google Scholar]
- D’Adamo, I.; Gastaldi, M. Sustainable Development Goals: A Regional Overview Based on Multi-Criteria Decision Analysis. Sustainability 2022, 14, 9779. [Google Scholar] [CrossRef]
- Wang, C.-N.; Huang, Y.-F.; Chai, Y.-C.; Nguyen, V. A Multi-Criteria Decision Making (MCDM) for Renewable Energy Plants Location Selection in Vietnam under a Fuzzy Environment. Appl. Sci. 2018, 8, 2069. [Google Scholar] [CrossRef]
- Ikram, M.; Sroufe, R.; Awan, U.; Abid, N. Enabling Progress in Developing Economies: A Novel Hybrid Decision-Making Model for Green Technology Planning. Sustainability 2021, 14, 258. [Google Scholar] [CrossRef]
- Du, Y.; Chen, W.; Cui, K.; Zhang, K. Study on Damage Assessment of Earthen Sites of the Ming Great Wall in Qinghai Province Based on Fuzzy-AHP and AHP-TOPSIS. Int. J. Archit. Herit. 2020, 14, 903–916. [Google Scholar] [CrossRef]
- D’Adamo, I.; Falcone, P.M.; Gastaldi, M.; Morone, P. RES-T Trajectories and an Integrated SWOT-AHP Analysis for Biomethane. Policy Implications to Support a Green Revolution in European Transport. Energy Policy 2020, 138, 111220. [Google Scholar] [CrossRef]
- Saaty, T.L. The AHP: Planning, Priority Setting Resource Allocation; McGraw-Hill: New York, NY, USA, 1980. [Google Scholar]
- Balioti, V.; Tzimopoulos, C.; Evangelides, C. Multi-Criteria Decision Making Using TOPSIS Method Under Fuzzy Environment. Application in Spillway Selection. In Proceedings of the 3rd EWaS International Conference on “Insights on the Water-Energy-Food Nexus”, Lefkada Island, Greece, 27–30 June 2018; MDPI: Basel, Switzerland, 2018; p. 637. [Google Scholar]
- Xiong, X.; Ma, Q.; Yuan, Y.; Wu, Z.; Zhang, M. Current Situation and Key Manufacturing Considerations of Green Furniture in China: A Review. J. Clean. Prod. 2020, 267, 121957. [Google Scholar] [CrossRef]
- Shao, J.; Taisch, M.; Mier, M.O. Influencing Factors to Facilitate Sustainable Consumption: From the Experts’ Viewpoints. J. Clean. Prod. 2017, 142, 203–216. [Google Scholar] [CrossRef]
- Ramirez, E. Consumer-Defined Sustainably-Oriented Firms and Factors Influencing Adoption. J. Bus. Res. 2013, 66, 2202–2209. [Google Scholar] [CrossRef]
- Tseng, M.-L.; Chiu, S.F.; Tan, R.R.; Siriban-Manalang, A.B. Sustainable Consumption and Production for Asia: Sustainability through Green Design and Practice. J. Clean. Prod. 2013, 40, 1–5. [Google Scholar] [CrossRef]
- O’Cass, A.; Ngo, L. Achieving Customer Satisfaction via Market Orientation, Brand Orientation, and Customer Empowerment: Evidence from Australia. In Proceedings of the Australian and New Zealand Marketing Academy Conference 2009 (ANZMAC 2009), Melbourne, Australia, 30 November–2 December 2009; Australian and New Zealand Marketing Academy (ANZMAC): Melbourne, Australia, 2009. [Google Scholar]
- Chaudhuri, A.; Holbrook, M.B. The Chain of Effects from Brand Trust and Brand Affect to Brand Performance: The Role of Brand Loyalty. J. Mark. 2001, 65, 81–93. [Google Scholar] [CrossRef]
- Oh, T.T.; Keller, K.L.; Neslin, S.A.; Reibstein, D.J.; Lehmann, D.R. The Past, Present, and Future of Brand Research. Mark. Lett. 2020, 31, 151–162. [Google Scholar] [CrossRef]
- Reid, L.W.; Rubin, B.A. Integrating Economic Dualism and Labor Market Segmentation: The Effects of Race, Gender, and Structural Location on Earnings, 1974–2000. Sociol. Q. 2003, 44, 405–432. [Google Scholar] [CrossRef]
- Mudanganyi, M.; Tafadzwa Maziriri, E.; Chuchu, T.; Ndoro, T. Brand Orientation as a Predictor of Customer Orientation, Brand Uniqueness and Competitor Orientation: Evidence from Retail SME Managers in South Africa. Afr. J. Dev. Stud. Former. AFFRIKA J. Politics Econ. Soc. 2020, 10, 303–318. [Google Scholar] [CrossRef]
- Kotler, P. Philip Kotler: Some of My Adventures in Marketing. J. Hist. Res. Mark. 2017, 9, 203–208. [Google Scholar] [CrossRef]
- Vassileva, B. Marketing 4.0: How Technologies Transform Marketing Organization. Óbuda Univ. E-Bull. 2017, 7, 47–56. [Google Scholar]
- Jiménez-Zarco, A.I.; Rospigliosi, A.; Martínez-Ruiz, M.P.; Izquierdo-Yusta, A. Marketing 4.0. In Web Services; IGI Global: Hershey, PA, USA, 2019; pp. 2172–2195. [Google Scholar]
- García-Haro, M.Á.; Martínez-Ruiz, M.P.; Martínez-Cañas, R.; Ruiz-Palomino, P. Marketing 4.0 and Internet Technologies in the Tourism Industry Context. In Encyclopedia of Organizational Knowledge, Administration, and Technology; IGI Global: Hershey, PA, USA, 2021; pp. 1679–1689. [Google Scholar]
- Kotler, P. Why Broadened Marketing Has Enriched Marketing. AMS Rev. 2018, 8, 20–22. [Google Scholar] [CrossRef]
- Awan, U.; Nauman, S.; Sroufe, R. Exploring the Effect of Buyer Engagement on Green Product Innovation: Empirical Evidence from Manufacturers. Bus. Strategy Environ. 2021, 30, 463–477. [Google Scholar] [CrossRef]
- White, K.; Habib, R.; Hardisty, D.J. How to SHIFT Consumer Behaviors to Be More Sustainable: A Literature Review and Guiding Framework. J. Mark. 2019, 83, 22–49. [Google Scholar] [CrossRef]
- Cucchiella, F.; D’Adamo, I.; Gastaldi, M. Future Trajectories of Renewable Energy Consumption in the European Union. Resources 2018, 7, 10. [Google Scholar] [CrossRef] [Green Version]
- Li, G.; Wu, H.; Sethi, S.P.; Zhang, X. Contracting Green Product Supply Chains Considering Marketing Efforts in the Circular Economy Era. Int. J. Prod. Econ. 2021, 234, 108041. [Google Scholar] [CrossRef]
- Melander, L. Achieving Sustainable Development by Collaborating in Green Product Innovation. Bus. Strategy Environ. 2017, 26, 1095–1109. [Google Scholar] [CrossRef]
- Xiong, X.-Q.; Yuan, Y.-Y.; Niu, Y.-T.; Zhang, L.-T. Development of a Cornstarch Adhesive for Laminated Veneer Lumber Bonding for Use in Engineered Wood Flooring. Int. J. Adhes. Adhes. 2020, 98, 102534. [Google Scholar] [CrossRef]
- Peattie, K.; Crane, A. Green Marketing: Legend, Myth, Farce or Prophesy? Qual. Mark. Res. Int. J. 2005, 8, 357–370. [Google Scholar] [CrossRef]
- Lahtinen, V.; Dietrich, T.; Rundle-Thiele, S. Long Live the Marketing Mix. Testing the Effectiveness of the Commercial Marketing Mix in a Social Marketing Context. J. Soc. Mark. 2020, 10, 357–375. [Google Scholar] [CrossRef]
- Gau, W.-B. A Reflection on Marketing 4.0 From the Perspective of Senior Citizens’ Communities of Practice. SAGE Open 2019, 9, 215824401986785. [Google Scholar] [CrossRef]
- Rowley, J. Understanding Digital Content Marketing. J. Mark. Manag. 2008, 24, 517–540. [Google Scholar] [CrossRef]
- Fuciu, M.; Dumitrescu, L. From Marketing 1.0 To Marketing 4.0—The Evolution of the Marketing Concept in the Context of the 21st Century. Int. Conf. Knowl. Based Organ. 2018, 24, 43–48. [Google Scholar] [CrossRef]
- Ikram, M.; Sroufe, R.; Zhang, Q. Prioritizing and Overcoming Barriers to Integrated Management System (IMS) Implementation Using AHP and G-TOPSIS. J. Clean. Prod. 2020, 254, 120121. [Google Scholar] [CrossRef]
- Saaty, T.L. How to Make a Decision: The Analytic Hierarchy Process. Eur. J. Oper. Res. 1990, 48, 9–26. [Google Scholar] [CrossRef]
- Liu, Y.; Eckert, C.M.; Earl, C. A Review of Fuzzy AHP Methods for Decision-Making with Subjective Judgements. Expert Syst. Appl. 2020, 161, 113738. [Google Scholar] [CrossRef]
- Hsu, W.-C.J.; Liou, J.J.H.; Lo, H.-W. A Group Decision-Making Approach for Exploring Trends in the Development of the Healthcare Industry in Taiwan. Decis. Support Syst. 2021, 141, 113447. [Google Scholar] [CrossRef]
- Tsai, W.-H.; Hsu, P.-Y.; Cheng, J.M.-S.; Chen, Y.-W. An AHP Approach to Assessing the Relative Importance Weights of ERP Performance Measures. Int. J. Manag. Enterp. Dev. 2006, 3, 351–375. [Google Scholar] [CrossRef]
- Kumar, A.; Mangla, S.K.; Luthra, S.; Rana, N.P.; Dwivedi, Y.K. Predicting Changing Pattern: Building Model for Consumer Decision Making in Digital Market. J. Enterp. Inf. Manag. 2018, 31, 674–703. [Google Scholar] [CrossRef]
- Kumar, N.M.; Chopra, S.S. Leveraging Blockchain and Smart Contract Technologies to Overcome Circular Economy Implementation Challenges. Sustainability 2022, 14, 9492. [Google Scholar] [CrossRef]
- Hwang, C.-L.; Yoon, K. Methods for Multiple Attribute Decision Making. In Multiple Attribute Decision Making; Springer: Berlin/Heidelberg, Germany, 1981; pp. 58–191. [Google Scholar]
- Bera, B.; Shit, P.K.; Sengupta, N.; Saha, S.; Bhattacharjee, S. Susceptibility of Deforestation Hotspots in Terai-Dooars Belt of Himalayan Foothills: A Comparative Analysis of VIKOR and TOPSIS Models. J. King Saud Univ. Comput. Inf. Sci. 2021; in press. [Google Scholar] [CrossRef]
- Yadav, V.; Karmakar, S. Multi Criteria Decision Making for Sustainable Municipal Solid Waste Management Systems. In Computational Management. Modeling and Optimization in Science and Technologies; Springer: Cham, Switzerland, 2021; Volume 18, pp. 587–598. [Google Scholar] [CrossRef]
- Zhang, C.; Hu, Q.; Zeng, S.; Su, W. IOWLAD-Based MCDM Model for the Site Assessment of a Household Waste Processing Plant under a Pythagorean Fuzzy Environment. Environ. Impact Assess. Rev. 2021, 89, 106579. [Google Scholar] [CrossRef]
- İç, Y.T.; Çelik, B.; Kavak, S.; Baki, B. An Integrated AHP-Modified VIKOR Model for Financial Performance Modeling in Retail and Wholesale Trade Companies. Decis. Anal. J. 2022, 3, 100077. [Google Scholar] [CrossRef]
- Kaushik, R.; Jaiswal, Y.R.; Singh, R.; Singari, R.M.; Chaudhary, R. A Fuzzy AHP Approach for Prioritizing Diesel Locomotive Sheds a Case Study in Northern Railways Network. In Advances in Manufacturing and Industrial Engineering; Springer: Berlin/Heidelberg, Germany, 2021; pp. 231–245. [Google Scholar]
- Ali, S.A.; Parvin, F.; Al-Ansari, N.; Pham, Q.B.; Ahmad, A.; Raj, M.S.; Anh, D.T.; Ba, L.H.; Thai, V.N. Sanitary Landfill Site Selection by Integrating AHP and FTOPSIS with GIS: A Case Study of Memari Municipality, India. Environ. Sci. Pollut. Res. 2021, 28, 7528–7550. [Google Scholar] [CrossRef]
- Mohd, A.; Qureshi, M.N.; Mallick, J.; Hasan, M.A.; Hussain, M. Decision Support Model for Design of High-Performance Concrete Mixtures Using Two-Phase AHP-TOPSIS Approach. Adv. Civ. Eng. 2019, 2019, 1696131. [Google Scholar] [CrossRef]
- Abdel-Basset, M.; Gamal, A.; Chakrabortty, R.K.; Ryan, M.J. Evaluation Approach for Sustainable Renewable Energy Systems under Uncertain Environment: A Case Study. Renew. Energy 2021, 168, 1073–1095. [Google Scholar] [CrossRef]
- Sharma, M.; Joshi, S. Brand Sustainability among Young Consumers: An AHP-TOPSIS Approach. Young Consum. 2019, 20, 314–337. [Google Scholar] [CrossRef]
- Kropivšek, J.; Grošelj, P.; Oblak, L.; Jošt, M. A Comprehensive Evaluation Model for Wood Companies Websites Based on the AHP/R-TOPSIS Method. Forests 2021, 12, 706. [Google Scholar] [CrossRef]
- Liu, Y.; Eckert, C.; Yannou-Le Bris, G.; Petit, G. A Fuzzy Decision Tool to Evaluate the Sustainable Performance of Suppliers in an Agrifood Value Chain. Comput. Ind. Eng. 2019, 127, 196–212. [Google Scholar] [CrossRef]
- Mohd, A.; Qureshi, M.N.; Mallick, J.; ben Kahla, N. Selection of Sustainable Supplementary Concrete Materials Using OSM-AHP-TOPSIS Approach. Adv. Mater. Sci. Eng. 2019, 2019, 2850480. [Google Scholar] [CrossRef]
- Nabeeh, N.A.; Abdel-Basset, M.; Soliman, G. A Model for Evaluating Green Credit Rating and Its Impact on Sustainability Performance. J. Clean. Prod. 2021, 280, 124299. [Google Scholar] [CrossRef]
- Zulqarnain, R.M.; Xin, X.L.; Siddique, I.; Asghar Khan, W.; Yousif, M.A. TOPSIS Method Based on Correlation Coefficient under Pythagorean Fuzzy Soft Environment and Its Application towards Green Supply Chain Management. Sustainability 2021, 13, 1642. [Google Scholar] [CrossRef]
- Önüt, S.; Soner, S. Transshipment Site Selection Using the AHP and TOPSIS Approaches under Fuzzy Environment. Waste Manag. 2008, 28, 1552–1559. [Google Scholar] [CrossRef]
- Solangi, Y.A.; Longsheng, C.; Shah, S.A.A. Assessing and Overcoming the Renewable Energy Barriers for Sustainable Development in Pakistan: An Integrated AHP and Fuzzy TOPSIS Approach. Renew. Energy 2021, 173, 209–222. [Google Scholar] [CrossRef]
- Yin, J.; Qian, L.; Shen, J. From Value Co-Creation to Value Co-Destruction? The Case of Dockless Bike Sharing in China. Transp. Res. Part D Transp. Environ. 2019, 71, 169–185. [Google Scholar] [CrossRef]
- Vargo, S.L.; Akaka, M.A.; Vaughan, C.M. Conceptualizing Value: A Service-Ecosystem View. J. Creat. Value 2017, 3, 117–124. [Google Scholar] [CrossRef]
- Kohtamäki, M.; Rajala, R. Theory and Practice of Value Co-Creation in B2B Systems. Ind. Mark. Manag. 2016, 56, 4–13. [Google Scholar] [CrossRef]
- Sarkar, S.; Banerjee, S. Brand Co-Creation through Triadic Stakeholder Participation. Eur. Bus. Rev. 2019, 31, 585–609. [Google Scholar] [CrossRef]
- Giannopoulos, A.; Piha, L.; Skourtis, G. Destination Branding and Co-Creation: A Service Ecosystem Perspective. J. Prod. Brand Manag. 2021, 30, 148–166. [Google Scholar] [CrossRef]
- Yu, J.; Wen, Y.; Jin, J.; Zhang, Y. Towards a Service-Dominant Platform for Public Value Co-Creation in a Smart City: Evidence from Two Metropolitan Cities in China. Technol. Forecast. Soc. Chang. 2019, 142, 168–182. [Google Scholar] [CrossRef]
- Shulga, L.V.; Busser, J.A. Hospitality Employee and Customer Role in Value Co-Creation: Personal, Organizational and Collaborative Outcomes. Int. J. Hosp. Manag. 2020, 91, 102648. [Google Scholar] [CrossRef]
- Kleber, D.M.S.; Juusola, K. Open Innovation—An Explorative Study on Value Co-Creation Tools for Nation Branding and Building a Competitive Identity. J. Open Innov. Technol. Mark. Complex. 2021, 7, 206. [Google Scholar] [CrossRef]
- Lacoste, S. Sustainable Value Co-Creation in Business Networks. Ind. Mark. Manag. 2016, 52, 151–162. [Google Scholar] [CrossRef]
- Wereda, W.; Woźniak, J. Building Relationships with Customer 4.0 in the Era of Marketing 4.0: The Case Study of Innovative Enterprises in Poland. Soc. Sci. 2019, 8, 177. [Google Scholar] [CrossRef] [Green Version]
- Dash, G.; Kiefer, K.; Paul, J. Marketing-to-Millennials: Marketing 4.0, Customer Satisfaction and Purchase Intention. J. Bus. Res. 2021, 122, 608–620. [Google Scholar] [CrossRef]
- Nallapaneni, M.K.; Chopra, S.S. Sustainability and Resilience of Circular Economy Business Models Based on Digital Ledger Technologies. In Proceedings of the Waste Management and Valorisation for a Sustainable Future, Seoul, Korea, 26–28 October 2021. [Google Scholar]
- Adivar, B.; Hüseyinoğlu, I.Ö.Y.; Christopher, M. A Quantitative Performance Management Framework for Assessing Omnichannel Retail Supply Chains. J. Retail. Consum. Serv. 2019, 48, 257–269. [Google Scholar] [CrossRef]
- Akter, S.; Hossain, M.I.; Lu, S.; Aditya, S.; Hossain, T.M.T.; Kattiyapornpong, U. Does Service Quality Perception in Omnichannel Retailing Matter? A Systematic Review and Agenda for Future Research. In Exploring Omnichannel Retailing; Springer International Publishing: Cham, Switzerland, 2019; pp. 71–97. [Google Scholar]
- Song, G.; Song, S.; Sun, L. Supply Chain Integration in Omni-Channel Retailing: A Logistics Perspective. Int. J. Logist. Manag. 2019, 30, 527–548. [Google Scholar] [CrossRef]
- Florek, M.; Hereźniak, M.; Augustyn, A. Measuring the Effectiveness of City Brand Strategy. In Search for a Universal Evaluative Framework. Cities 2021, 110, 103079. [Google Scholar] [CrossRef]
- Han, H.; Trimi, S. A Fuzzy TOPSIS Method for Performance Evaluation of Reverse Logistics in Social Commerce Platforms. Expert Syst. Appl. 2018, 103, 133–145. [Google Scholar] [CrossRef]
- Wang, M.; Li, Y.; Li, J.; Wang, Z. Green Process Innovation, Green Product Innovation and Its Economic Performance Improvement Paths: A Survey and Structural Model. J. Environ. Manag. 2021, 297, 113282. [Google Scholar] [CrossRef]
- Pangemanan, S.A.; Walukow, I.M. Marketing Strategy Analysis for Small and Medium Scale Business Enterprise (SMEs) for Home Industry Furniture in Leilem, the Regency of Minahasa. J. Phys. Conf. Ser. 2018, 953, 012033. [Google Scholar] [CrossRef]
- Swaen, V.; Chumpitaz, R.C. Impact of Corporate Social Responsibility on Consumer Trust. Rech. Et Appl. En Mark. 2008, 23, 7–34. [Google Scholar] [CrossRef]
- Chen, M.; Hu, Q.; Wei, H. Interaction of After-Sales Service Provider and Contract Type in a Supply Chain. Int. J. Prod. Econ. 2017, 193, 514–527. [Google Scholar] [CrossRef]
- Hillman, S.; Neustaedter, C. Trust and Mobile Commerce in North America. Comput. Hum. Behav. 2017, 70, 10–21. [Google Scholar] [CrossRef]
- Gliem, J.A.; Gliem, R.R. Calculating, Interpreting, And Reporting Cronbach’s Alpha Reliability Coefficient for Likert-Type Scales. In Proceedings of the Midwest Research-to-Practice Conference in Adult, Continuing, and Community Education, Columbus, OH, USA, 8 October 2003; pp. 82–88. [Google Scholar]
- Tabachnick, B.G.; Fidell, L.S.; Ullman, J.B. Using Multivariate Statistics, 7th ed.; Pearson: Boston, MA, USA, 2007; ISBN 9780134790541. [Google Scholar]
- Dinmohammadi, A.; Shafiee, M. Determination of the Most Suitable Technology Transfer Strategy for Wind Turbines Using an Integrated AHP-TOPSIS Decision Model. Energies 2017, 10, 642. [Google Scholar] [CrossRef]
- Ngai, E.W.T. Selection of Web Sites for Online Advertising Using the AHP. Inf. Manag. 2003, 40, 233–242. [Google Scholar] [CrossRef]
- Saaty, T.L. A Note on the AHP and Expected Value Theory. Socio-Econ. Plan. Sci. 1986, 20, 397–398. [Google Scholar] [CrossRef]
- Joshi, S.; Sharma, M.; Singh, R.K. Performance Evaluation of Agro-Tourism Clusters Using AHP–TOPSIS. J. Oper. Strateg. Plan. 2020, 3, 7–30. [Google Scholar] [CrossRef]
- Shih, H.-S.; Shyur, H.-J.; Lee, E.S. An Extension of TOPSIS for Group Decision Making. Math. Comput. Model. 2007, 45, 801–813. [Google Scholar] [CrossRef]
- Bhadra, D.; Dhar, N.R.; Abdus Salam, M. Sensitivity Analysis of the Integrated AHP-TOPSIS and CRITIC-TOPSIS Method for Selection of the Natural Fiber. Mater. Today Proc. 2022, 56, 2618–2629. [Google Scholar] [CrossRef]
- Petersan, R.A. Constructing Effective Questionnaires; Sage Publications: Thousand Oaks, CA, USA, 2000; Volume 1. [Google Scholar]
- Reza Jalilvand, M.; Samiei, N. The Effect of Electronic Word of Mouth on Brand Image and Purchase Intention. Mark. Intell. Plan. 2012, 30, 460–476. [Google Scholar] [CrossRef]
- ElHaffar, G.; Durif, F.; Dubé, L. Towards Closing the Attitude-Intention-Behavior Gap in Green Consumption: A Narrative Review of the Literature and an Overview of Future Research Directions. J. Clean. Prod. 2020, 275, 122556. [Google Scholar] [CrossRef]
- Jiménez-López, A.M.; Hincapié-Llanos, G.A. Identification of Factors Affecting the Reduction of VOC Emissions in the Paint Industry: Systematic Literature Review—SLR. Prog. Org. Coat. 2022, 170, 106945. [Google Scholar] [CrossRef]
- Vuong, B.N.; Khanh Giao, H.N. The Impact of Perceived Brand Globalness on Consumers’ Purchase Intention and the Moderating Role of Consumer Ethnocentrism: An Evidence from Vietnam. J. Int. Consum. Mark. 2020, 32, 47–68. [Google Scholar] [CrossRef]
- Ebrahim, R.; Ghoneim, A.; Irani, Z.; Fan, Y. A Brand Preference and Repurchase Intention Model: The Role of Consumer Experience. J. Mark. Manag. 2016, 32, 1230–1259. [Google Scholar] [CrossRef]
- Reddy, B.A. Green Marketing: A Study on Consumer’s Perspectives. In New Trends in Business Management; Sandra Kirthy, M., Jabez, R., Eds.; Zenon Academic Publishing: Hyderabad, India, 2018; pp. 120–137. [Google Scholar]
- Shaw, S.D.; Bagozzi, R.P. The Neuropsychology of Consumer Behavior and Marketing. Consum. Psychol. Rev. 2018, 1, 22–40. [Google Scholar] [CrossRef]
- Fischer, D.; Böhme, T.; Geiger, S.M. Measuring Young Consumers’ Sustainable Consumption Behavior: Development and Validation of the YCSCB Scale. Young Consum. 2017, 18, 312–326. [Google Scholar] [CrossRef]
- Yadav, R.; Pathak, G.S. Young Consumers’ Intention towards Buying Green Products in a Developing Nation: Extending the Theory of Planned Behavior. J. Clean. Prod. 2016, 135, 732–739. [Google Scholar] [CrossRef]
- McCormick, K.; Kautto, N. The Bioeconomy in Europe: An Overview. Sustainability 2013, 5, 2589–2608. [Google Scholar] [CrossRef]
- Hansen, E. Responding to the Bioeconomy: Business Model Innovation in the Forest Sector. In Environmental Impacts of Traditional and Innovative Forest-Based Bioproducts; Springer: Singapore, 2016; pp. 227–248. [Google Scholar]
- Pfau, S.; Hagens, J.; Dankbaar, B.; Smits, A. Visions of Sustainability in Bioeconomy Research. Sustainability 2014, 6, 1222–1249. [Google Scholar] [CrossRef]
- Liobikiene, G.; Balezentis, T.; Streimikiene, D.; Chen, X. Evaluation of Bioeconomy in the Context of Strong Sustainability. Sustain. Dev. 2019, 27, 955–964. [Google Scholar] [CrossRef]
- Giampietro, M. On the Circular Bioeconomy and Decoupling: Implications for Sustainable Growth. Ecol. Econ. 2019, 162, 143–156. [Google Scholar] [CrossRef]
- Velenturf, A.P.M.; Archer, S.A.; Gomes, H.I.; Christgen, B.; Lag-Brotons, A.J.; Purnell, P. Circular Economy and the Matter of Integrated Resources. Sci. Total Environ. 2019, 689, 963–969. [Google Scholar] [CrossRef]
- Toppinen, A.; D’Amato, D.; Stern, T. Forest-Based Circular Bioeconomy: Matching Sustainability Challenges and Novel Business Opportunities? For. Policy Econ. 2020, 110, 102041. [Google Scholar] [CrossRef]
- Ikram, M. Transition toward Green Economy: Technological Innovation’s Role in the Fashion Industry. Curr. Opin. Green Sustain. Chem. 2022, 37, 100657. [Google Scholar] [CrossRef]
- Appolloni, A.; Chiappetta Jabbour, C.J.; D’Adamo, I.; Gastaldi, M.; Settembre-Blundo, D. Green Recovery in the Mature Manufacturing Industry: The Role of the Green-Circular Premium and Sustainability Certification in Innovative Efforts. Ecol. Econ. 2022, 193, 107311. [Google Scholar] [CrossRef]
- D’Amato, D.; Korhonen, J. Integrating the Green Economy, Circular Economy and Bioeconomy in a Strategic Sustainability Framework. Ecol. Econ. 2021, 188, 107143. [Google Scholar] [CrossRef]


| Reference | MCDM | The Focus of the Study |
|---|---|---|
| [1] | TOPSIS | In this study, carried out in the furniture industry, MCDM was used for green supplier selection. |
| [60] | VIKOR, MOORA, TOPSIS, AHP, Sensitivity Analysis | The study, carried out for six different retail and wholesale companies in Turkey, measures financial performance. |
| [52] | FUZZY AHP and TOPSIS | In this study, researchers make performance rankings for three strong brands in the automotive industry. |
| [61] | FUZZY AHP, VIKOR | This study, carried out in India, determines the criteria that affect the retail brand preferences of individuals in their online clothing shopping. |
| [62] | AHP and FUZZY TOPSIS | This study aims to rank the performance of supply chains for sustainable production in India. |
| [63] | AHP and TOPSIS | In this study, researchers apply an integrated MCDM to rank representative concrete mixing methods, taking into account concrete mixing criteria. |
| [64] | AHP, VIKOR, TOPSIS | This study, which makes performance rankings of 10 companies in the Greek iron and steel industry, makes use of MCDM techniques. |
| [65] | AHP and TOPSIS | The study carried out with 100 young consumers determines the brand qualities necessary for the sustainability of 10 brands and makes performance rankings accordingly. |
| [66] | AHP and TOPSIS | It ranks the websites of 60 different companies operating in the wood industry. |
| [67] | SWOT, FUZZY AHP, and TOPSIS | This study lists the performances of supply companies in the context of sustainability. |
| [68] | OSM (Optimal Scoring Method) and AHP and TOPSIS | This study develops a framework for the selection of sustainable complementary concrete materials with TOPSIS by calculating the importance levels of technical, environmental, social, and economic sustainability criteria with AHP. |
| Important Values | Definition | Description |
|---|---|---|
| 1 | Equal importance | Elements i and j are equally important |
| 3 | Moderate importance | Element i is weakly more important than element j |
| 5 | Strong importance | Element i is strongly more important than element j |
| 7 | Very strong importance | Element i is very strongly more important than element j |
| 9 | Absolute importance | Element i is absolutely more important than element j |
| 2, 4, 6 and 8 | Intermediate values | Represents compromise between the priorities |
| Items | Scale Mean if Item Deleted | Scale Variance if Item Deleted | Corrected Item Total Correlation | Cronbach’s Alpha if Item Deleted |
|---|---|---|---|---|
| C1 | 32,751 | 21,652 | 0.444 | 0.851 |
| C2 | 32,636 | 21,798 | 0.424 | 0.852 |
| C3 | 32,735 | 21,450 | 0.419 | 0.853 |
| C4 | 32,947 | 20,643 | 0.315 | 0.875 |
| C5 | 33,020 | 18,943 | 0.704 | 0.826 |
| C6 | 33,333 | 18,646 | 0.738 | 0.822 |
| C7 | 33,117 | 19,093 | 0.724 | 0.824 |
| C8 | 33,204 | 18,724 | 0.750 | 0.821 |
| C9 | 33,333 | 18,646 | 0.738 | 0.822 |
| Factors | Factor Loading | % of Variance Explained | Cumulative % Age of Variance Explained |
|---|---|---|---|
| C1 | 0.784 | 3852 | 42,800 |
| C2 | 0.790 | 2243 | 24,921 |
| C3 | 0.797 | ||
| C4 | 0.454 | ||
| C5 | 0.855 | ||
| C6 | 0.866 | ||
| C7 | 0.852 | ||
| C8 | 0.879 | ||
| C9 | 0.887 | ||
| Kaiser-Meyer-Olkin Measure of Sampling Adequacy. (KMO) | 0.841 | ||
| Bartlett’s Test of Sphericity | Approx. Chi-Square | 2,094,742 | |
| df | 36 | ||
| Sig. | 0.000 |
| C1 | C2 | C3 | C4 | C5 | C6 | C7 | C8 | C9 | |
|---|---|---|---|---|---|---|---|---|---|
| C1 | 4.00 | 1.00 | 4.00 | 5.00 | 4.00 | 2.00 | 5.00 | 2.00 | 2.00 |
| C2 | 0.50 | 8.00 | 4.00 | 3.00 | 3.00 | 3.00 | 2.00 | 4.00 | 3.00 |
| C3 | 0.50 | 0.33 | 1.00 | 8.00 | 4.00 | 4.00 | 6.00 | 8.00 | 7.00 |
| C4 | 0.50 | 0.33 | 0.25 | 1.00 | 6.00 | 6.00 | 5.00 | 5.00 | 9.00 |
| C5 | 0.33 | 0.33 | 0.50 | 0.33 | 1.00 | 8.00 | 8.00 | 8.00 | 5.00 |
| C6 | 0.50 | 0.50 | 0.50 | 0.33 | 0.50 | 1.00 | 6.00 | 4.00 | 8.00 |
| C7 | 0.50 | 0.33 | 0.33 | 0.50 | 0.33 | 0.33 | 1.00 | 8.00 | 9.00 |
| C8 | 0.50 | 0.33 | 0.50 | 0.50 | 0.50 | 0.50 | 0.50 | 1.00 | 9.00 |
| C9 | 0.50 | 0.50 | 0.33 | 0.50 | 0.33 | 0.50 | 0.50 | 0.50 | 1.00 |
| C1 | C2 | C3 | C4 | C5 | C6 | C7 | C8 | C9 | |
|---|---|---|---|---|---|---|---|---|---|
| C1 | 0.51 | 0.09 | 0.35 | 0.26 | 0.20 | 0.08 | 0.15 | 0.05 | 0.04 |
| C2 | 0.06 | 0.69 | 0.35 | 0.16 | 0.15 | 0.12 | 0.06 | 0.10 | 0.06 |
| C3 | 0.06 | 0.03 | 0.09 | 0.42 | 0.20 | 0.16 | 0.18 | 0.20 | 0.13 |
| C4 | 0.06 | 0.03 | 0.02 | 0.05 | 0.31 | 0.24 | 0.15 | 0.12 | 0.17 |
| C5 | 0.04 | 0.03 | 0.04 | 0.02 | 0.05 | 0.32 | 0.24 | 0.20 | 0.09 |
| C6 | 0.06 | 0.04 | 0.04 | 0.02 | 0.03 | 0.04 | 0.18 | 0.10 | 0.15 |
| C7 | 0.06 | 0.03 | 0.03 | 0.03 | 0.02 | 0.01 | 0.03 | 0.20 | 0.17 |
| C8 | 0.06 | 0.03 | 0.04 | 0.03 | 0.03 | 0.02 | 0.01 | 0.02 | 0.17 |
| C9 | 0.06 | 0.04 | 0.03 | 0.03 | 0.02 | 0.02 | 0.01 | 0.01 | 0.02 |
| Criteria | Criteria | Priority Value |
|---|---|---|
| C1 | Co-creation to value | 0.19 |
| C2 | Pricing | 0.19 |
| C3 | Distribution channels | 0.16 |
| C4 | Promotion activities | 0.13 |
| C5 | Product Quality | 0.11 |
| C6 | Product Variety | 0.07 |
| C7 | Trust and loyalty to the brand | 0.06 |
| C8 | After-sales service | 0.05 |
| C9 | Diversity of payment options | 0.03 |
| Criteria | Criteria Weight | C Total |
|---|---|---|
| C1 | 0.19 | 1.91 |
| C2 | 0.19 | 2.01 |
| C3 | 0.16 | 1.61 |
| C4 | 0.13 | 1.25 |
| C5 | 0.11 | 0.91 |
| C6 | 0.07 | 0.84 |
| C7 | 0.06 | 0.61 |
| C8 | 0.05 | 0.57 |
| C9 | 0.03 | 0.48 |
| 10.04 | ||
| CI | 0.13 | |
| RI | 1.45 | |
| CR | 0.08 < 0.10 |
| 1st Expert’s Decision Matrix | 1st Expert’s Normalized Decision Matrix | 1st Expert’s Weighted Normalized Decision Matrix | |||||||||||||||||||||||||||
|---|---|---|---|---|---|---|---|---|---|---|---|---|---|---|---|---|---|---|---|---|---|---|---|---|---|---|---|---|---|
| 0.19 | 0.19 | 0.16 | 0.13 | 0.11 | 0.07 | 0.06 | 0.05 | 0.03 | 0.19 | 0.19 | 0.16 | 0.13 | 0.11 | 0.07 | 0.06 | 0.05 | 0.03 | 0.19 | 0.19 | 0.16 | 0.13 | 0.11 | 0.07 | 0.06 | 0.05 | 0.03 | |||
| C1 | C2 | C3 | C4 | C5 | C6 | C7 | C8 | C9 | C1 | C2 | C3 | C4 | C5 | C6 | C7 | C8 | C9 | C1 | C2 | C3 | C4 | C5 | C6 | C7 | C8 | C9 | |||
| X | 5 | 4 | 4 | 4 | 3 | 3 | 8 | 8 | 4 | X | 0.43 | 0.59 | 0.37 | 0.31 | 0.24 | 0.32 | 0.55 | 0.60 | 0.37 | X | 0.08 | 0.11 | 0.05 | 0.03 | 0.02 | 0.03 | 0.03 | 0.03 | 0.02 |
| Y | 9 | 5 | 9 | 9 | 9 | 7 | 9 | 7 | 9 | Y | 0.7 | 0.74 | 0.84 | 0.70 | 0.72 | 0.76 | 0.62 | 0.52 | 0.84 | Y | 0.14 | 0.14 | 0.12 | 0.08 | 0.06 | 0.06 | 0.04 | 0.03 | 0.04 |
| Z | 5 | 2 | 4 | 8 | 8 | 5 | 8 | 8 | 4 | Z | 0.43 | 0.29 | 0.37 | 0.63 | 0.64 | 0.54 | 0.55 | 0.60 | 0.38 | Z | 0.08 | 0.06 | 0.06 | 0.08 | 0.06 | 0.05 | 0.03 | 0.04 | 0.02 |
| 2nd Expert’s Decision Matrix | 2nd Expert’s Normalized Decision Matrix | 2nd Expert’s Weighted Normalized Decision Matrix | |||||||||||||||||||||||||||
|---|---|---|---|---|---|---|---|---|---|---|---|---|---|---|---|---|---|---|---|---|---|---|---|---|---|---|---|---|---|
| 0.19 | 0.19 | 0.16 | 0.13 | 0.11 | 0.07 | 0.06 | 0.05 | 0.03 | 0.19 | 0.19 | 0.16 | 0.13 | 0.11 | 0.07 | 0.06 | 0.05 | 0.03 | 0.19 | 0.19 | 0.16 | 0.13 | 0.11 | 0.07 | 0.06 | 0.05 | 0.03 | |||
| C1 | C2 | C3 | C4 | C5 | C6 | C7 | C8 | C9 | C1 | C2 | C3 | C4 | C5 | C6 | C7 | C8 | C9 | C1 | C2 | C3 | C4 | C5 | C6 | C7 | C8 | C9 | |||
| X | 9 | 9 | 8 | 8 | 9 | 6 | 6 | 8 | 2 | X | 0.60 | 0.60 | 0.55 | 0.55 | 0.60 | 0.45 | 0.56 | 0.82 | 0.16 | X | 0.11 | 0.11 | 0.08 | 0.07 | 0.05 | 0.04 | 0.03 | 0.05 | 0.01 |
| Y | 8 | 8 | 8 | 9 | 9 | 9 | 8 | 4 | 8 | Y | 0.53 | 0.53 | 0.55 | 0.62 | 0.60 | 0.67 | 0.74 | 0.41 | 0.66 | Y | 0.10 | 0.10 | 0.08 | 0.07 | 0.05 | 0.06 | 0.04 | 0.02 | 0.03 |
| Z | 9 | 9 | 9 | 8 | 8 | 8 | 4 | 4 | 9 | Z | 0.60 | 0.60 | 0.62 | 0.55 | 0.53 | 0.59 | 0.37 | 0.41 | 0.74 | Z | 0.11 | 0.11 | 0.09 | 0.07 | 0.05 | 0.05 | 0.02 | 0.02 | 0.04 |
| 3rd Expert’s Decision Matrix | 3rd Expert’s Normalized Decision Matrix | 3rd Expert’s Weighted Normalized Decision Matrix | |||||||||||||||||||||||||||
|---|---|---|---|---|---|---|---|---|---|---|---|---|---|---|---|---|---|---|---|---|---|---|---|---|---|---|---|---|---|
| 0.19 | 0.19 | 0.16 | 0.13 | 0.11 | 0.07 | 0.06 | 0.05 | 0.03 | 0.19 | 0.19 | 0.16 | 0.13 | 0.11 | 0.07 | 0.06 | 0.05 | 0.03 | 0.19 | 0.19 | 0.16 | 0.13 | 0.11 | 0.07 | 0.06 | 0.05 | 0.03 | |||
| C1 | C2 | C3 | C4 | C5 | C6 | C7 | C8 | C9 | C1 | C2 | C3 | C4 | C5 | C6 | C7 | C8 | C9 | C1 | C2 | C3 | C4 | C5 | C6 | C7 | C8 | C9 | |||
| X | 6.00 | 6.00 | 9.00 | 9.00 | 9.00 | 8.00 | 8.00 | 8.00 | 8.00 | X | 0.43 | 0.43 | 0.60 | 0.58 | 0.58 | 0.53 | 0.53 | 0.63 | 0.62 | X | 0.08 | 0.08 | 0.09 | 0.07 | 0.05 | 0.05 | 0.03 | 0.04 | 0.03 |
| Y | 9.00 | 9.00 | 8.00 | 9.00 | 9.00 | 9.00 | 9.00 | 9.00 | 8.00 | Y | 0.64 | 0.64 | 0.53 | 0.58 | 0.58 | 0.60 | 0.60 | 0.71 | 0.62 | Y | 0.12 | 0.12 | 0.08 | 0.07 | 0.05 | 0.05 | 0.04 | 0.04 | 0.03 |
| Z | 9.00 | 9.00 | 9.00 | 9.00 | 9.00 | 9.00 | 9.00 | 4.00 | 6.00 | Z | 0.64 | 0.64 | 0.60 | 0.58 | 0.58 | 0.60 | 0.60 | 0.32 | 0.47 | Z | 0.12 | 0.12 | 0.09 | 0.07 | 0.05 | 0.05 | 0.04 | 0.02 | 0.02 |
| 4th Expert’s Decision Matrix | 4th Expert’s Normalized Decision Matrix | 4th Expert’s Weighted Normalized Decision Matrix | |||||||||||||||||||||||||||
|---|---|---|---|---|---|---|---|---|---|---|---|---|---|---|---|---|---|---|---|---|---|---|---|---|---|---|---|---|---|
| 0.19 | 0.19 | 0.16 | 0.13 | 0.11 | 0.07 | 0.06 | 0.05 | 0.03 | 0.19 | 0.19 | 0.16 | 0.13 | 0.11 | 0.07 | 0.06 | 0.05 | 0.03 | 0.19 | 0.19 | 0.16 | 0.13 | 0.11 | 0.07 | 0.06 | 0.05 | 0.03 | |||
| C1 | C2 | C3 | C4 | C5 | C6 | C7 | C8 | C9 | C1 | C2 | C3 | C4 | C5 | C6 | C7 | C8 | C9 | C1 | C2 | C3 | C4 | C5 | C6 | C7 | C8 | C9 | |||
| X | 2 | 5 | 5 | 4 | 4 | 4 | 5 | 5 | 4 | X | 0.30 | 0.62 | 0.68 | 0.53 | 0.62 | 0.57 | 0.66 | 0.62 | 0.53 | X | 0.06 | 0.12 | 0.10 | 0.06 | 0.06 | 0.05 | 0.04 | 0.04 | 0.03 |
| Y | 5 | 5 | 5 | 4 | 4 | 5 | 4 | 5 | 4 | Y | 0.75 | 0.62 | 0.68 | 0.53 | 0.62 | 0.71 | 0.53 | 0.62 | 0.53 | Y | 0.14 | 0.12 | 0.10 | 0.06 | 0.06 | 0.06 | 0.03 | 0.04 | 0.03 |
| Z | 4 | 4 | 2 | 5 | 3 | 3 | 4 | 4 | 5 | Z | 0.60 | 0.49 | 0.27 | 0.66 | 0.47 | 0.42 | 0.53 | 0.49 | 0.66 | Z | 0.11 | 0.09 | 0.04 | 0.08 | 0.04 | 0.04 | 0.03 | 0.03 | 0.03 |
| C1 | C2 | C3 | C4 | C5 | C6 | C7 | C8 | C9 | C1 | C2 | C3 | C4 | C5 | C6 | C7 | C8 | C9 | ||
|---|---|---|---|---|---|---|---|---|---|---|---|---|---|---|---|---|---|---|---|
| 0.15 | 0.14 | 0.13 | 0.09 | 0.07 | 0.07 | 0.04 | 0.04 | 0.04 | 0.11 | 0.11 | 0.09 | 0.07 | 0.05 | 0.06 | 0.04 | 0.05 | 0.04 | ||
| 0.08 | 0.06 | 0.06 | 0.04 | 0.02 | 0.03 | 0.03 | 0.03 | 0.02 | 0.10 | 0.10 | 0.08 | 0.07 | 0.05 | 0.04 | 0.02 | 0.02 | 0.01 | ||
| 0.12 | 0.12 | 0.09 | 0.07 | 0.05 | 0.05 | 0.04 | 0.04 | 0.03 | 0.14 | 0.12 | 0.10 | 0.08 | 0.06 | 0.06 | 0.04 | 0.04 | 0.03 | ||
| 0.08 | 0.08 | 0.08 | 0.07 | 0.05 | 0.05 | 0.03 | 0.02 | 0.02 | 0.06 | 0.09 | 0.04 | 0.06 | 0.04 | 0.04 | 0.03 | 0.03 | 0.03 |
| Alternatives | Ranking for Green Furniture Brands | |||
|---|---|---|---|---|
| Brand X | 0.09 | 0.04 | 0.33 | 3 |
| Brand Y | 0.01 | 0.08 | 0.89 | 1 |
| Brand Z | 0.06 | 0.05 | 0.45 | 2 |
| Case 1 | C1 | C2 | C3 | C4 | C5 | C6 | C7 | C8 | C9 | P Score | Ranking |
|---|---|---|---|---|---|---|---|---|---|---|---|
| Brand X | 0.0621 | 0.0361 | 0.1023 | 0.0639 | 0.0664 | 0.0305 | 0.0260 | 0.0386 | 0.0266 | 0.0051 | 3 |
| Brand Y | 0.1000 | 0.2000 | 0.3000 | 0.4000 | 0.5000 | 0.6000 | 0.7000 | 0.8000 | 0.9000 | 0.1918 | 1 |
| Brand Z | 0.0621 | 0.0361 | 0.1023 | 0.0639 | 0.0664 | 0.0305 | 0.0260 | 0.0386 | 0.0266 | 0.0051 | 2 |
| Case 2 | C1 | C2 | C3 | C4 | C5 | C6 | C7 | C8 | C9 | P Score | Ranking |
|---|---|---|---|---|---|---|---|---|---|---|---|
| Brand X | 0.1000 | 0.2000 | 0.3000 | 0.4000 | 0.5000 | 0.6000 | 0.7000 | 0.8000 | 0.9000 | 0.1918 | 3 |
| Brand Y | 4.4731 | 4.9673 | 1.5453 | 0.4759 | 0.3791 | 1.9712 | 0.6242 | 0.6293 | 0.5490 | 0.99745 | 1 |
| Brand Z | 0.0621 | 0.0650 | 0.0731 | 0.2558 | 0.1772 | 0.0267 | 0.0130 | 0.0220 | 0.0221 | 0.03076 | 2 |
| Case 3 | C1 | C2 | C3 | C4 | C5 | C6 | C7 | C8 | C9 | P Score | Ranking |
|---|---|---|---|---|---|---|---|---|---|---|---|
| Brand X | 0.0621 | 0.0361 | 0.1023 | 0.0639 | 0.0664 | 0.0305 | 0.0260 | 0.0386 | 0.0266 | 0.00513 | 3 |
| Brand Y | 4.4731 | 4.9673 | 1.5453 | 0.4759 | 0.3791 | 1.9712 | 0.6242 | 0.6293 | 0.5490 | 0.99745 | 1 |
| Brand Z | 0.1000 | 0.2000 | 0.3000 | 0.4000 | 0.5000 | 0.6000 | 0.7000 | 0.8000 | 0.9000 | 0.19182 | 2 |
Publisher’s Note: MDPI stays neutral with regard to jurisdictional claims in published maps and institutional affiliations. |
© 2022 by the authors. Licensee MDPI, Basel, Switzerland. This article is an open access article distributed under the terms and conditions of the Creative Commons Attribution (CC BY) license (https://creativecommons.org/licenses/by/4.0/).
Share and Cite
Yeğin, T.; Ikram, M. Performance Evaluation of Green Furniture Brands in the Marketing 4.0 Period: An Integrated MCDM Approach. Sustainability 2022, 14, 10644. https://doi.org/10.3390/su141710644
Yeğin T, Ikram M. Performance Evaluation of Green Furniture Brands in the Marketing 4.0 Period: An Integrated MCDM Approach. Sustainability. 2022; 14(17):10644. https://doi.org/10.3390/su141710644
Chicago/Turabian StyleYeğin, Tuğba, and Muhammad Ikram. 2022. "Performance Evaluation of Green Furniture Brands in the Marketing 4.0 Period: An Integrated MCDM Approach" Sustainability 14, no. 17: 10644. https://doi.org/10.3390/su141710644
APA StyleYeğin, T., & Ikram, M. (2022). Performance Evaluation of Green Furniture Brands in the Marketing 4.0 Period: An Integrated MCDM Approach. Sustainability, 14(17), 10644. https://doi.org/10.3390/su141710644