1. Introduction
Carbon emission is the main problem in every production sector such as agricultural [
1], industrial [
2], household [
3], and transportation sectors [
4], which may cause climate change [
5]. In recent years, carbon emissions from transportation have become a major concern for countries around the world. Transportation brings economic development, but at the same time, transportation emissions also bring environmental problems and hinder sustainable economic and social development. For developing countries, the economic development of transportation often coincides with the emission of pollution. Each year, nearly 25% of global energy-related carbon dioxide (CO
2) emissions are generated by the transportation sector, and in 2020, China’s transportation sector will generate 9.3 billion tons of CO
2, accounting for 15% of the country’s total emissions. Many scholars have quantified transportation emissions [
6,
7,
8], and the environmental problems caused by transportation emissions have made China realize the importance of transportation emission reduction [
9,
10,
11]. Reducing pollution and carbon is a key strategic direction for China’s ecological civilization and a hot issue of concern for the government and the whole society. Transportation is an important source of carbon emissions in cities, and transportation carbon emission reduction is an important element to achieve the carbon neutrality target and carbon peaking vision. Transportation carbon emissions have regional and external characteristics [
12,
13,
14], and therefore need to be reduced across regions. Inter-regional transportation is interconnected and influences each other, and the two should be developed in a coordinated manner. However, in reality, the two are often in an uncoordinated development situation, affecting the healthy development of regional social and economic development. Uncoordinated transportation and economy are manifested in uncoordinated emission pollution. Transportation has the characteristic of cross-region flow, and the transportation cross-region often benefits the transportation starting city and the transportation ending city, and the intermediate city will be affected by the transportation emission, meanwhile, the province with carbon emission deficit will have an impact on the province with carbon emission surplus, and this impact is not conducive to achieving sustainable social and economic development. Cross-regional abatement can effectively solve the supply problem of the regional ecological environment, and cross-regional abatement involves inter-governmental cooperation, and there is a “cross-game”, i.e., the vertical game between the central government and provincial governments, and the horizontal game between provincial governments [
15,
16]. Under the confrontation between the two games, the central government keeps pushing forward vertically and promotes horizontal inter-regional cooperation, forming a dual governance pattern [
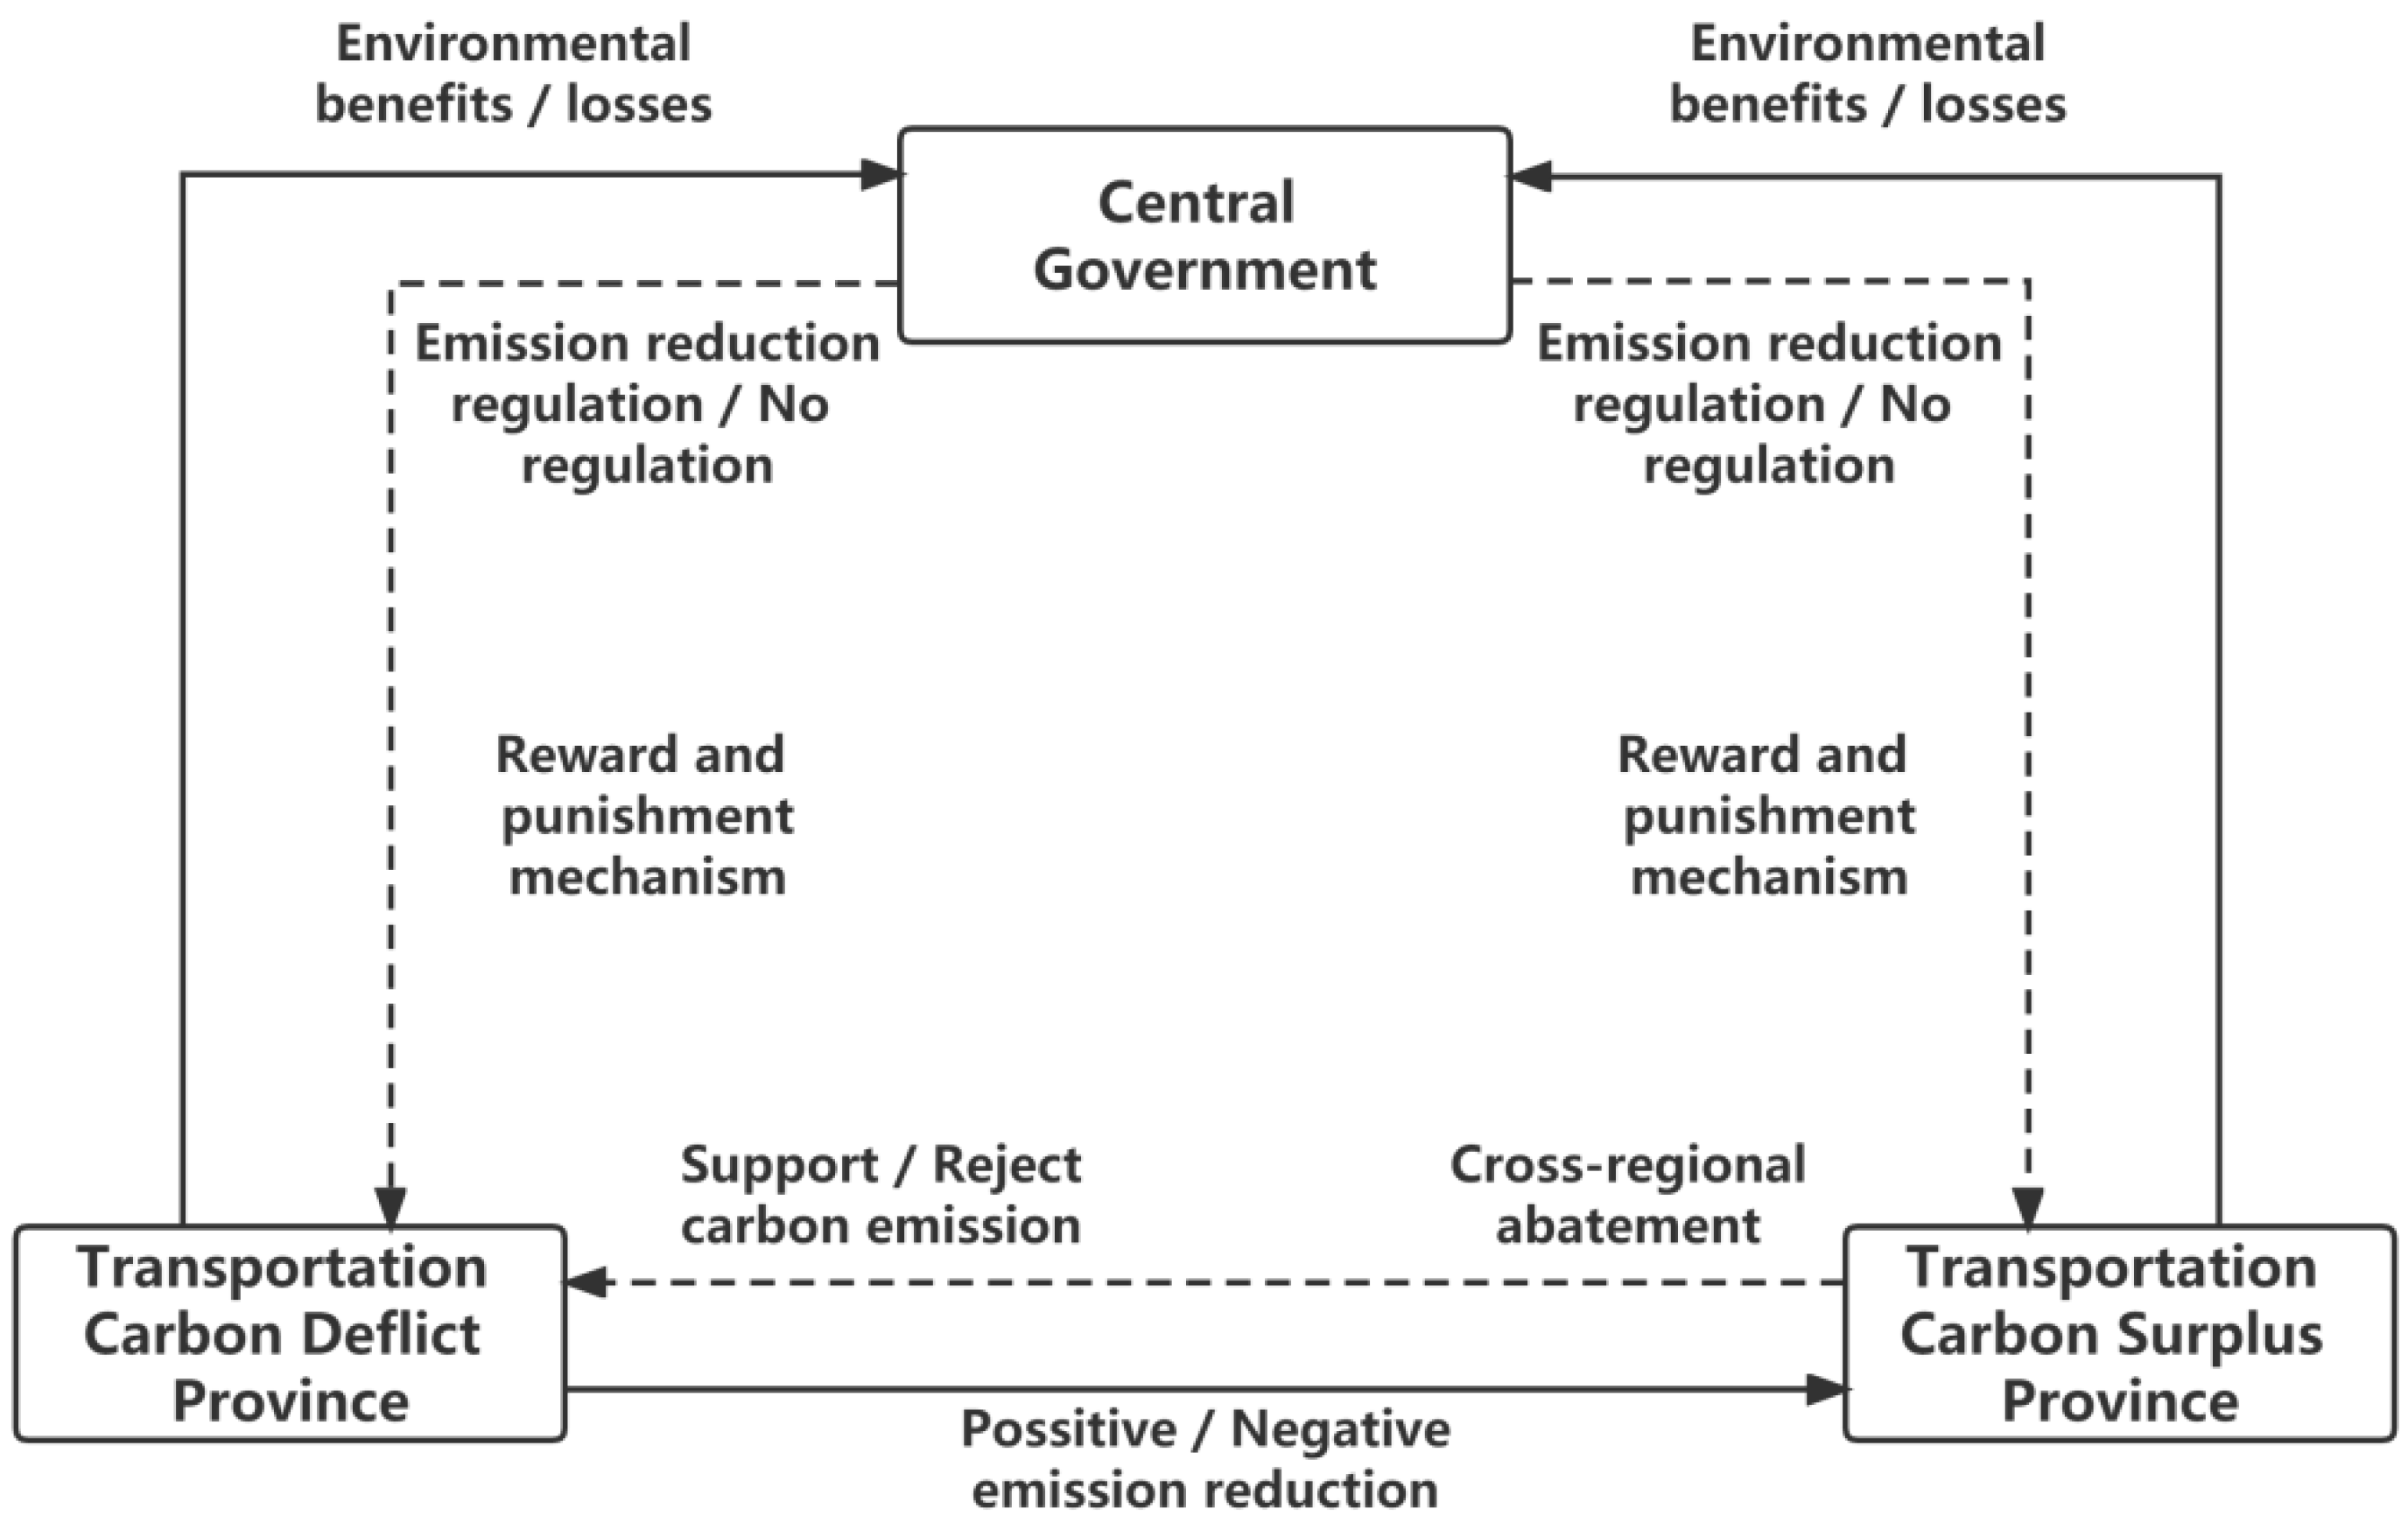
17]. Under this form of cooperation, how can the central government and the regions achieve a cross-regional reduction of transportation carbon emissions? What is the relationship between the specific cooperation strategies of the three parties? Exploring these issues can help clarify the vertical and horizontal strategic structures between central governments and regions, as well as their respective differentiated performance transportation carbon reduction regions, improve regional transportation emissions governance, and promote synergistic development of the transportation economy to achieve sustainable economic and social development.
2. Literature Review
Studies on cross-regional abatement of transportation carbon emissions have mainly focused on dimensions such as regional transportation emission measurement, influencing factors of emissions, and spatial structure of emissions, which are basically quantitative and characteristic analyses of emissions.
One is the measurement of regional traffic emissions. Most methods for calculating traffic-related emissions are based on emission factors that represent the emissions of each vehicle class under normal traffic conditions and operational parameters that represent real-world traffic conditions (e.g., vehicle emissions, vehicle miles traveled, transportation structure). Authors such as [
18] developed a macroscopic modeling approach for estimating traffic-related emissions in urban areas. During this period, a proposal for a global carbon accounting standard was put forward, stating that the calculation of carbon emissions from traffic and freight transport depends to a large extent on the distance traveled [
19]. Authors such as [
20] constructed an optimal urban transport structure model to estimate the absolute carbon emission reduction achievable. Second, is the study of the influencing factors of traffic emissions. Zhou et al. studied the spatial and temporal characteristics of road traffic CO
2 emissions and made an analysis of the influence of environmental factors on road traffic CO
2 emissions [
21]. Some scholars [
22] proposed a comprehensive research framework to explore the spatial and temporal characteristics and driving mechanisms of regional APEs (CO, SO
2, NOx, and PM 2.5) in provincial road traffic in China. Some other scholars [
23] showed that factors such as transportation structure, level of transportation infrastructure, and technological progress have significant positive effects on TSCDEE, while both urbanization level and urban population density have significant negative effects on TSCDEE. Third, is the spatial structure of transportation emissions. The spatial correlation of transportation carbon emissions is crucial to the study of regional green transportation construction and sustainable transportation. Authors such as [
24] proposed a novel fuzzy double boundary NDEA (FDFNDEA) model to systematically explore the sustainability of China’s road transport system from 1985–2017 in terms of both energy and environmental efficiency, and sustainable development. Authors such as [
25] evaluated the ability of three spatio-temporal decomposition methods to estimate traffic emissions and simulate pollutant dispersion in the densely populated and topographically complex Abra Valley, Colombia. Scholars et al. used three geostatistical methods (Getis-Ord Gi*, K-means, and spatial regression) to assess the spatial patterns of traffic emissions in all 5570 municipal districts in Brazil [
26].
However, for carbon emissions as well as environmental governance, many scholars have proposed cross-regional governance cooperation. Tang examined the persistent institutional challenges in contemporary China, focusing on urban governance issues related to government accountability, adapting the system to the type of problem, and encouraging cross-sectoral cooperation [
27]. Authors such as [
28,
29] constructed a regional air pollution collaborative governance. Authors such as [
30] constructed a trilateral dynamic game model for regional cooperation in haze pollution management in China from the perspective of government heterogeneity, analyzed the mixed strategy Nash equilibrium from game theory and studied the feasible mechanism and necessary conditions for establishing the cooperation model. Authors such as [
31] used a non-cooperative tripartite evolutionary game to simulate the dynamic strategic interactions among local governments, polluters, and the public to participate in governance, a new design of public participation mechanism is proposed to achieve cooperative evolutionary equilibrium. Among them, is cross-regional carbon emission governance, in which the central government plays an important regulatory role [
32,
33], and the government’s reward and punishment decisions affect regional competition [
34,
35,
36]. Few studies have been conducted to answer the question of how the inter-regional mitigation of transportation improves the level of emission management and how different strategies affect the level of transportation emission reduction. The structure of the inter-regional mitigation game between the central government and provinces with different levels of carbon emissions remains to be studied. Therefore, this paper constructs a game model for the central government, transportation carbon deficit provinces, and transportation carbon surplus provinces to discuss the equilibrium and stability of the three-party game under different strategies, as well as the influence of different factors on the game structure, in order to provide a reference for regional transportation carbon emission reduction cooperation across regions and improve regional carbon emission efficiency.
It is known from domestic and international practice that there are three main types of regional air pollution collaborative management models. The first model is a top-down regional collaborative governance body led by the central government, which is characterized by administrative compulsion. The UK is a typical representative of such a model. The second model is a voluntary regional collaborative governance model formed by local governments in the region for the purpose of regional environmental pollution control. In practice, the U.S. cross-domain management agency is a typical example. The third model is a combination of the above two models, that is, the initial collaborative governance model is coordinated by the central government, and a certain degree of leadership and management relationship is formed between the collaborative leadership group and each participating entity. After the collaborative work is gradually on the right track, the leading role of the central government is gradually transferred to the local governments in the region, and the collaborative work at this time is more similar to “contractual” collaborative governance, with more emphasis on the initiative and enthusiasm of each participating party. Since traffic emission is cross-regional in nature, the third model should be chosen for cross-regional governance. The reason for this is that neighboring regions have similar administrative peer characteristics and industrial structures, and the competition between them is greater than the cooperation, and in view of the high cost and slow effect of regional air pollution control, the region and the region automatically form the “leader” of regional cooperative governance from within. Therefore, we can only rely on the political mobilization and strong intervention of the central government to ensure the establishment and operation of collaborative institutions. Therefore, the central government’s leadership is necessary at the early stage of the formation of the cross-regional collaborative governance model of transportation. However, the level of transportation carbon emissions varies between regions due to the geographical location and transportation infrastructure, and therefore a tripartite game is formed between transportation carbon deficit provinces, carbon surplus provinces, and the central government.
4. Model Analysis
4.1. Strategy Stability Analysis of the Provincial Government of Transportation Carbon Deficit
The expected benefits, as well as the average benefits of active and negative emission reduction in the transportation carbon deficit provinces, are
,
,
.
The replicated dynamic equation for the choice of strategy for transport carbon deficit emission provinces is:
According to the stability theorem of the differential equation, the probability that the government of a transportation carbon emission deficit province chooses to actively reduce emissions is in a steady state must satisfy:
and
. Due to
,
, therefore,
,
is an increasing function with respect to
. When
,
,
, transportation Carbon Deficit Province Governments Cannot Determine Stabilization Strategies; when
,
,
,
is the evolutionary stabilization strategy of the government of the transportation carbon emission deficit province. Likewise,
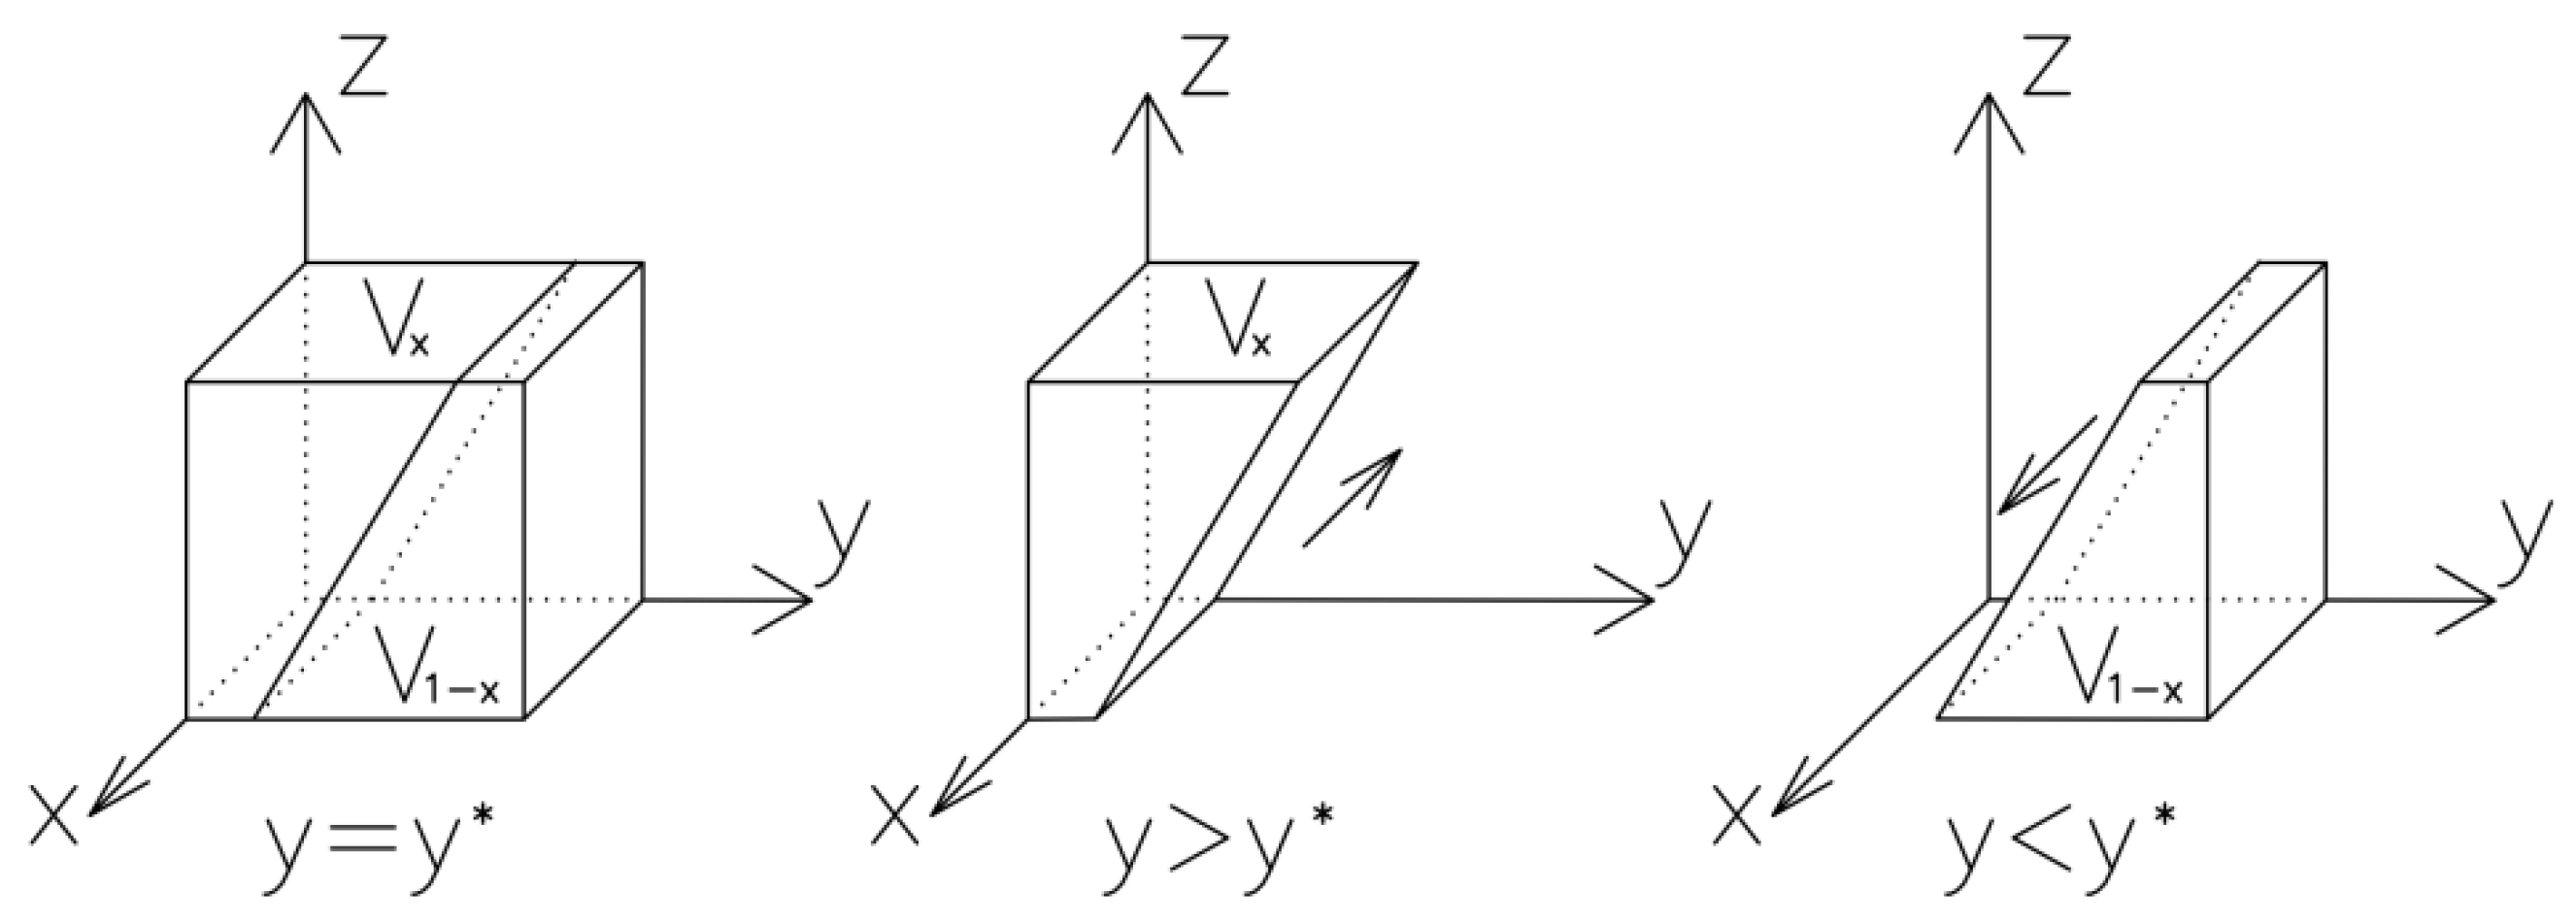
is also ESS, the phase diagram of the evolution of the strategy for the transportation carbon deficit provinces is shown in
Figure 2.
The volume of the probability
of active emission reduction by the government of the province with a transportation carbon emission deficit is
, the volume of the probability
of negative emission reduction, then:
Corollary 1.
The probability of active emission reductionby the government of the transportation carbon deficit province is positively related to environmental losses, government fines, and negatively related to the profit distribution rate and the profit difference between active and negative emission reduction.
Proof of Corollary 1.
Based on the expression for the probability of active emission reduction by the government of a transportation carbon emission deficit province, then each variable to find the first-order partial derivative. The calculation gives the following results: , , , , therefore, an increase in and or a decrease in and will lead to an increase in the probability of active emission reduction by the government of the transportation carbon deficit province. □
From Corollary 1, it is obtained that environmental losses will increase the awareness of transportation carbon deficit provinces to actively reduce emissions, and the government can urge transportation carbon deficit provinces to reduce emissions by increasing fines, while transportation carbon deficit provinces can increase the benefits and reduce the costs of emission reduction through technological improvements, thus increasing the profits of emission reduction.
Corollary 2.
The probability of active emission reduction in transportation carbon deficit provinces during evolution increases with the probability of supporting cross-regional abatement in transportation carbon surplus provinces and the probability of strict government regulation.
Proof of Corollary 2.
As the analysis of the stability of the active emission reduction strategy in the transportation carbon deficit provinces shows that when: and , at this time, , , is ESS; On the contrary, is ESS. Therefore, as gradually increases and gradually decreases, the stabilization strategy of the transportation carbon emission deficit provinces increases from (negative emission reduction) to (active emission reduction). □
It is obtained from Corollary 2: The more the governments of carbon surplus provinces support cross-regional carbon emission reduction, the more the governments of carbon deficit provinces will actively participate in emission reduction, and strict supervision by the central government regulatory department can promote the governments of carbon deficit provinces to actively reduce carbon emissions.
4.2. Strategy Stability Analysis of Carbon Surplus Provinces
The expected benefits, as well as the average benefits of supporting cross-regional carbon emission abatement and rejecting carbon emission abatement in transportation carbon surplus provinces, are
,
,
.
The replicated dynamic equations for the transportation carbon emission surplus provinces and the first order derivatives can be obtained as follows, respectively.
From the stability theorem of the differential equation, the probability that the transportation carbon emission surplus province supports cross-regional carbon emission abatement is in a steady state must satisfy:
and
. Due to
,
is a decreasing function with respect to
. When
,
,
,
, the transportation carbon surplus provinces cannot identify stabilization strategies at this time; when
,
,
,
is ESS; when
,
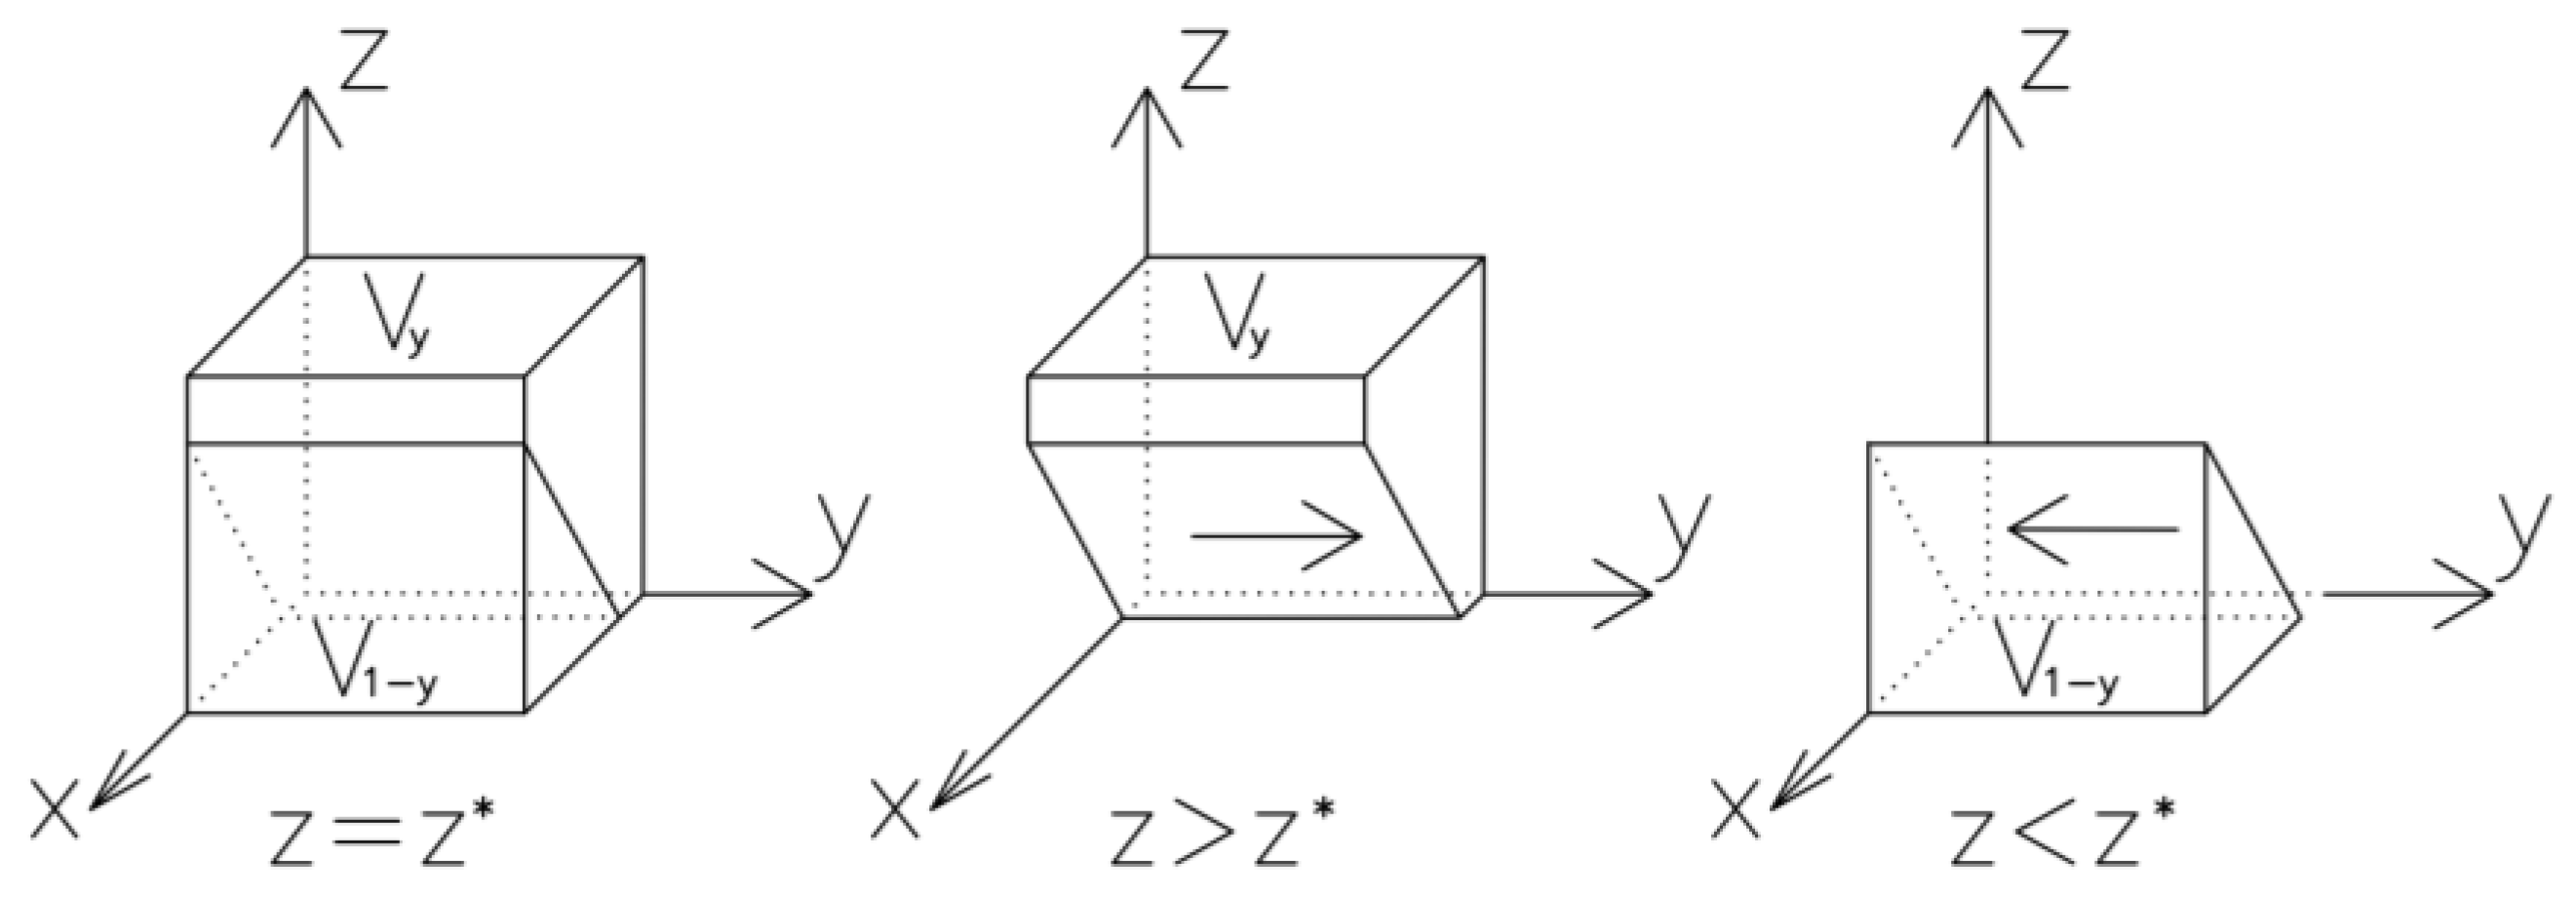
is ESS. The phase diagram of the strategy evolution for the transportation carbon emission surplus provinces is shown in
Figure 3.
From
Figure 3, it can be seen that the tangent plane passes through the point (
,0,0), the volume of the transportation carbon emission surplus provinces supporting the cross-regional cooperation probability
is
. Then, the volume
of the probability
of refusing to cooperate across zones:
Corollary 3.
The probability that a transportation carbon surplus province supports inter-regional abatement of transportation carbon emissions is positively related to the number of subsidies that the central government encourages transportation inter-regional abatement, the fines imposed on carbon surplus provinces for refusing inter-regional abatement, the inter-regional compensation given to carbon surplus provinces by carbon deficit provinces, and the profits from aggressive abatement in carbon deficit provinces, and inversely related to the benefit allocation rate and cost allocation rate in carbon deficit provinces, and the profits when carbon deficit provinces are negative in abatement.
Proof of Corollary 3.
Finding the first-order partial derivatives of each variable of yields: , , , , , . Therefore, an increase in , , , or a decrease in and can increase the probability that the transportation carbon emission surplus province supports the cross-regional abatement of transportation carbon emissions. □
It is obtained from Corollary 3 that the central government’s granting of subsidies for transportation inter-regional abatement or fines to carbon surplus provinces when they refuse inter-regional abatement can promote transportation carbon surplus provinces to support inter-regional carbon emission abatement, while the increase of abatement profits when carbon deficit provinces actively abate or the compensation to carbon surplus provinces for inter-regional abatement can also increase the willingness of carbon surplus provinces to cooperate in supporting transportation carbon emission inter-regional abatement. In addition, the reduction of profit distribution rate of carbon deficit provinces and the reduction of profit when they are lazy to reduce emissions can motivate carbon surplus provinces to participate in cross-regional carbon emission reduction cooperation.
Corollary 4.
The probability of carbon surplus provinces supporting cross-region carbon emission reduction increases with the rate of strict central government regulation and the probability of carbon deficit provinces actively reducing emissions during the evolutionary process.
Proof of Corollary 4.
According to the stability analysis of transportation carbon surplus province strategy, when and , is ESS; vice versa, when and , is ESS. Therefore, the probability of transportation carbon surplus province supporting carbon emission abatement across regions increases from to with the increase of and . □
From Corollary 4, we get that the strategy choice of transportation carbon deficit provinces and the central government will influence the strategy choice of transportation carbon surplus provinces. Strict regulation by the central government and active participation in emission reduction by the transportation carbon deficit provinces can lead the transportation carbon surplus provinces to choose to support cross-regional carbon emission reduction as a stabilization strategy. Therefore, in order to realize the low carbon development of regional transportation and promote the effective implementation of cross-regional emission reduction, it is necessary for the central government to strengthen the regulation, promote the active emission reduction of transportation carbon deficit provinces through incentives and penalties, and implement compensation measures to encourage transportation carbon surplus provinces to support cross-regional emission reduction.
4.3. Central Government’s Strategy Stability Analysis
The expected benefits of emission reduction regulation, non-emission reduction regulation, and the average benefits for the central government sector are
,
,
.
The replica dynamic equation for the central government and the first order derivative can be obtained as:
Central government implementation of abatement regulation is in steady state subject to
and
, due to
,
is an increasing function of
. Therefore, when
,
,
, Stabilization strategy cannot be determined at this point; when
,
,
,
is ESS; vice versa,
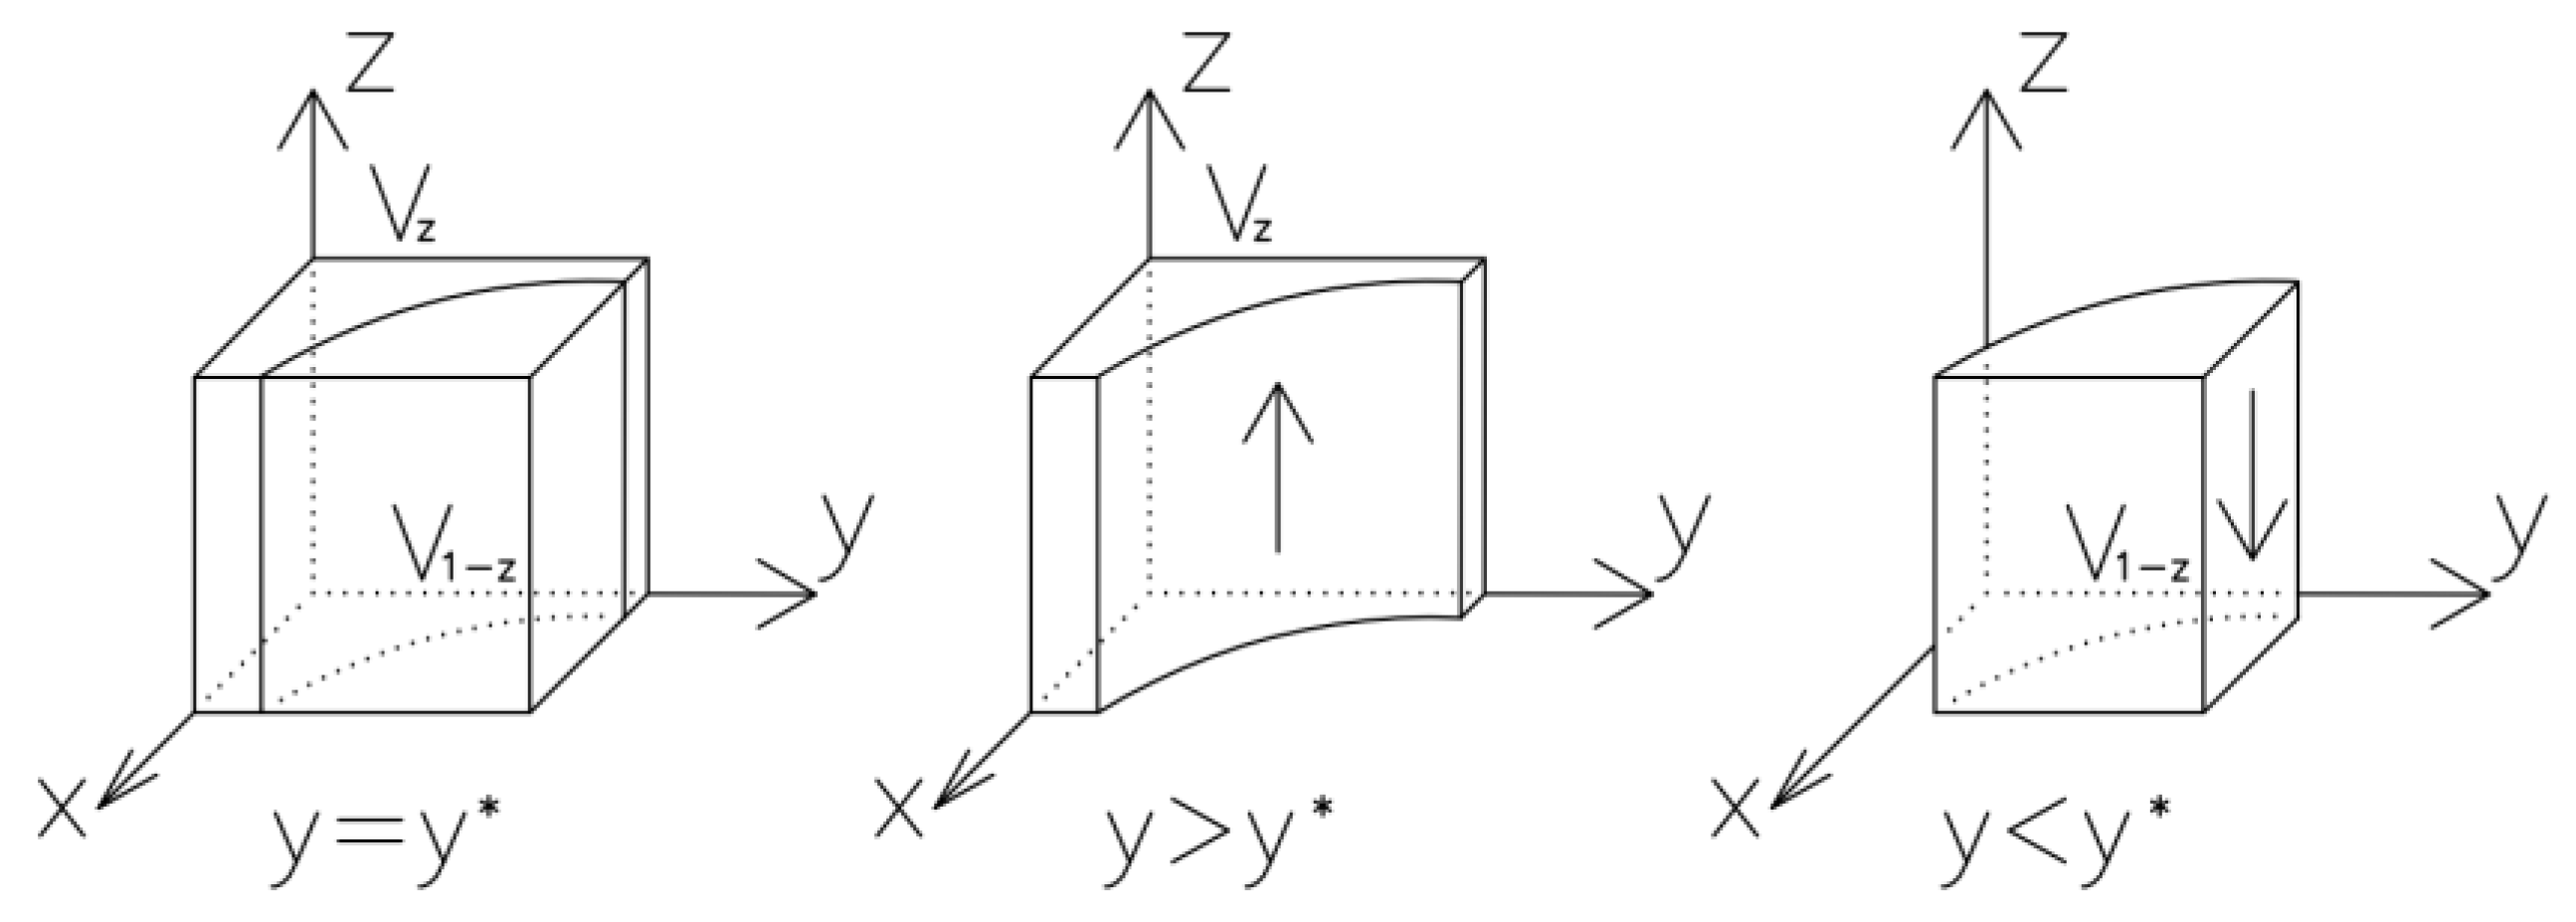
is ESS. The phase diagram of the central government regulatory authority is shown in
Figure 4.
From
Figure 4, the volume of
indicates the probability that the central government will implement abatement regulation, and the probability that the central government will not implement abatement regulation is
. The calculation yields:
Corollary 5.
The probability that the central government imposes regulation on emission reduction is positively related to the fines imposed by the central government on transportation carbon deficit provinces and transportation carbon surplus provinces, and the environmental damage caused when transportation carbon deficit provinces are lazy in reducing emissions, and negatively related to the cost of government regulation and cross-regional cooperation subsidies.
Proof.
Find the first order partial derivatives of each variable according to
, the calculation yields:
Therefore, when
,
increases, it can make
increase. In addition, when
increases or
,
decreases, both can increase the probability of central government regulation of traffic emissions. □
From Corollary 5, it can be concluded that the central government’s fines for inactivity in reducing emissions in carbon deficit provinces and the fines for refusing to reduce cross-zone emissions in carbon surplus provinces can both positively affect the probability of central government regulation of emission reduction, and the higher the set incentive for cross-zone emission reduction, the lower the probability of central government regulation of emission reduction. In addition, reducing the cost of central government regulation can increase the probability of central government regulation.
Corollary 6.
In the evolutionary process, the probability of central government regulation of abatement decreases as the rate of aggressive abatement in carbon deficit provinces and the rate of government support for inter-regional abatement in carbon surplus provinces increase.
Proof of Corollary 6.
The evolutionary stability of the central government’s strategy yields that is ESS when and ; is ESS when and . Therefore, as and increase, the probability of central government abatement regulation decreases from to . □
From Corollary 6, it can be concluded that the central government’s probability of abatement is influenced by the choice of government strategies in transportation carbon deficit provinces and transportation carbon surplus provinces; when transportation carbon deficit provinces are active in abatement and carbon surplus provinces support cross-area abatement, the central government’s regulation of abatement is relaxed, and when transportation carbon deficit provinces are lazy in abatement and carbon surplus provinces support refusal of abatement, the central government’s probability of implementing abatement increases.
4.4. Stability Analysis of the Equilibrium Point of the Tripartite Evolutionary Game for Cross-Regional Mitigation of Transportation Carbon Emissions
Let ,,, Equilibrium point can be obtained, ,, , , , , , , , , , , .
Because
,
makes sense when
, however,
,
don’t make sense. This yields the Jacobi matrix as:
According to Lyapunov’s law [
38], the stability analysis table of the equilibrium point is obtained as in
Table 3.
It is shown that when the cross-regional profit of the transportation carbon surplus province is smaller than the sum of the penalty for refusing cross-regional abatement and cross-regional subsidies and compensation, the strategy evolves steadily to (negative abatement, refusal of cross-regional carbon abatement, abatement regulation), and when the regional damage to the environment is smaller than the sum of the cost of regulation by the central government and cross-regional subsidies paid to both regions, the strategy combination evolves steadily to (Active emission reduction, support of cross-regional carbon abatement, no emission reduction regulation). Central government regulation can effectively restrain the behavior of transportation carbon deficit provinces and transportation carbon surplus provinces, and the emergence of (negative emission reduction, refusal of cross-regional carbon emission abatement, and abatement regulation) can be avoided by setting reasonable reward and punishment mechanisms.
When , the strategy combination evolves steadily towards , i.e., (active emission reduction, support for cross-regional carbon emission abatement, emission reduction regulation), if the fine for negative emission reduction in the transportation carbon deficit province and the damage caused by the region to the environment are greater than the sum of the cost of regulation by the central government and the cross-regional subsidies paid to the two regions. It shows that the central government’s fine for slack emission reduction in the transportation carbon deficit province can have the effect of promoting central government regulation for emission reduction, and also when the regional damage to the environment is too large. It can be seen that the tripartite evolutionary game of cross-regional abatement of transportation carbon emissions is a complex system, and a reasonable reward and punishment mechanism can promote effective control of regional transportation carbon emissions.
5. Simulation Analysis
The stability of the game evolution is analyzed by simulation, and the parameters are assigned to the actual situation. Preset parameters:
,
,
,
,
,
,
,
,
. These parameters satisfy the corresponding conditions in
Table 2. Analysis of the impact of changes in these parameters of
,
,
,
,
,
on the process and outcome of the evolutionary game.
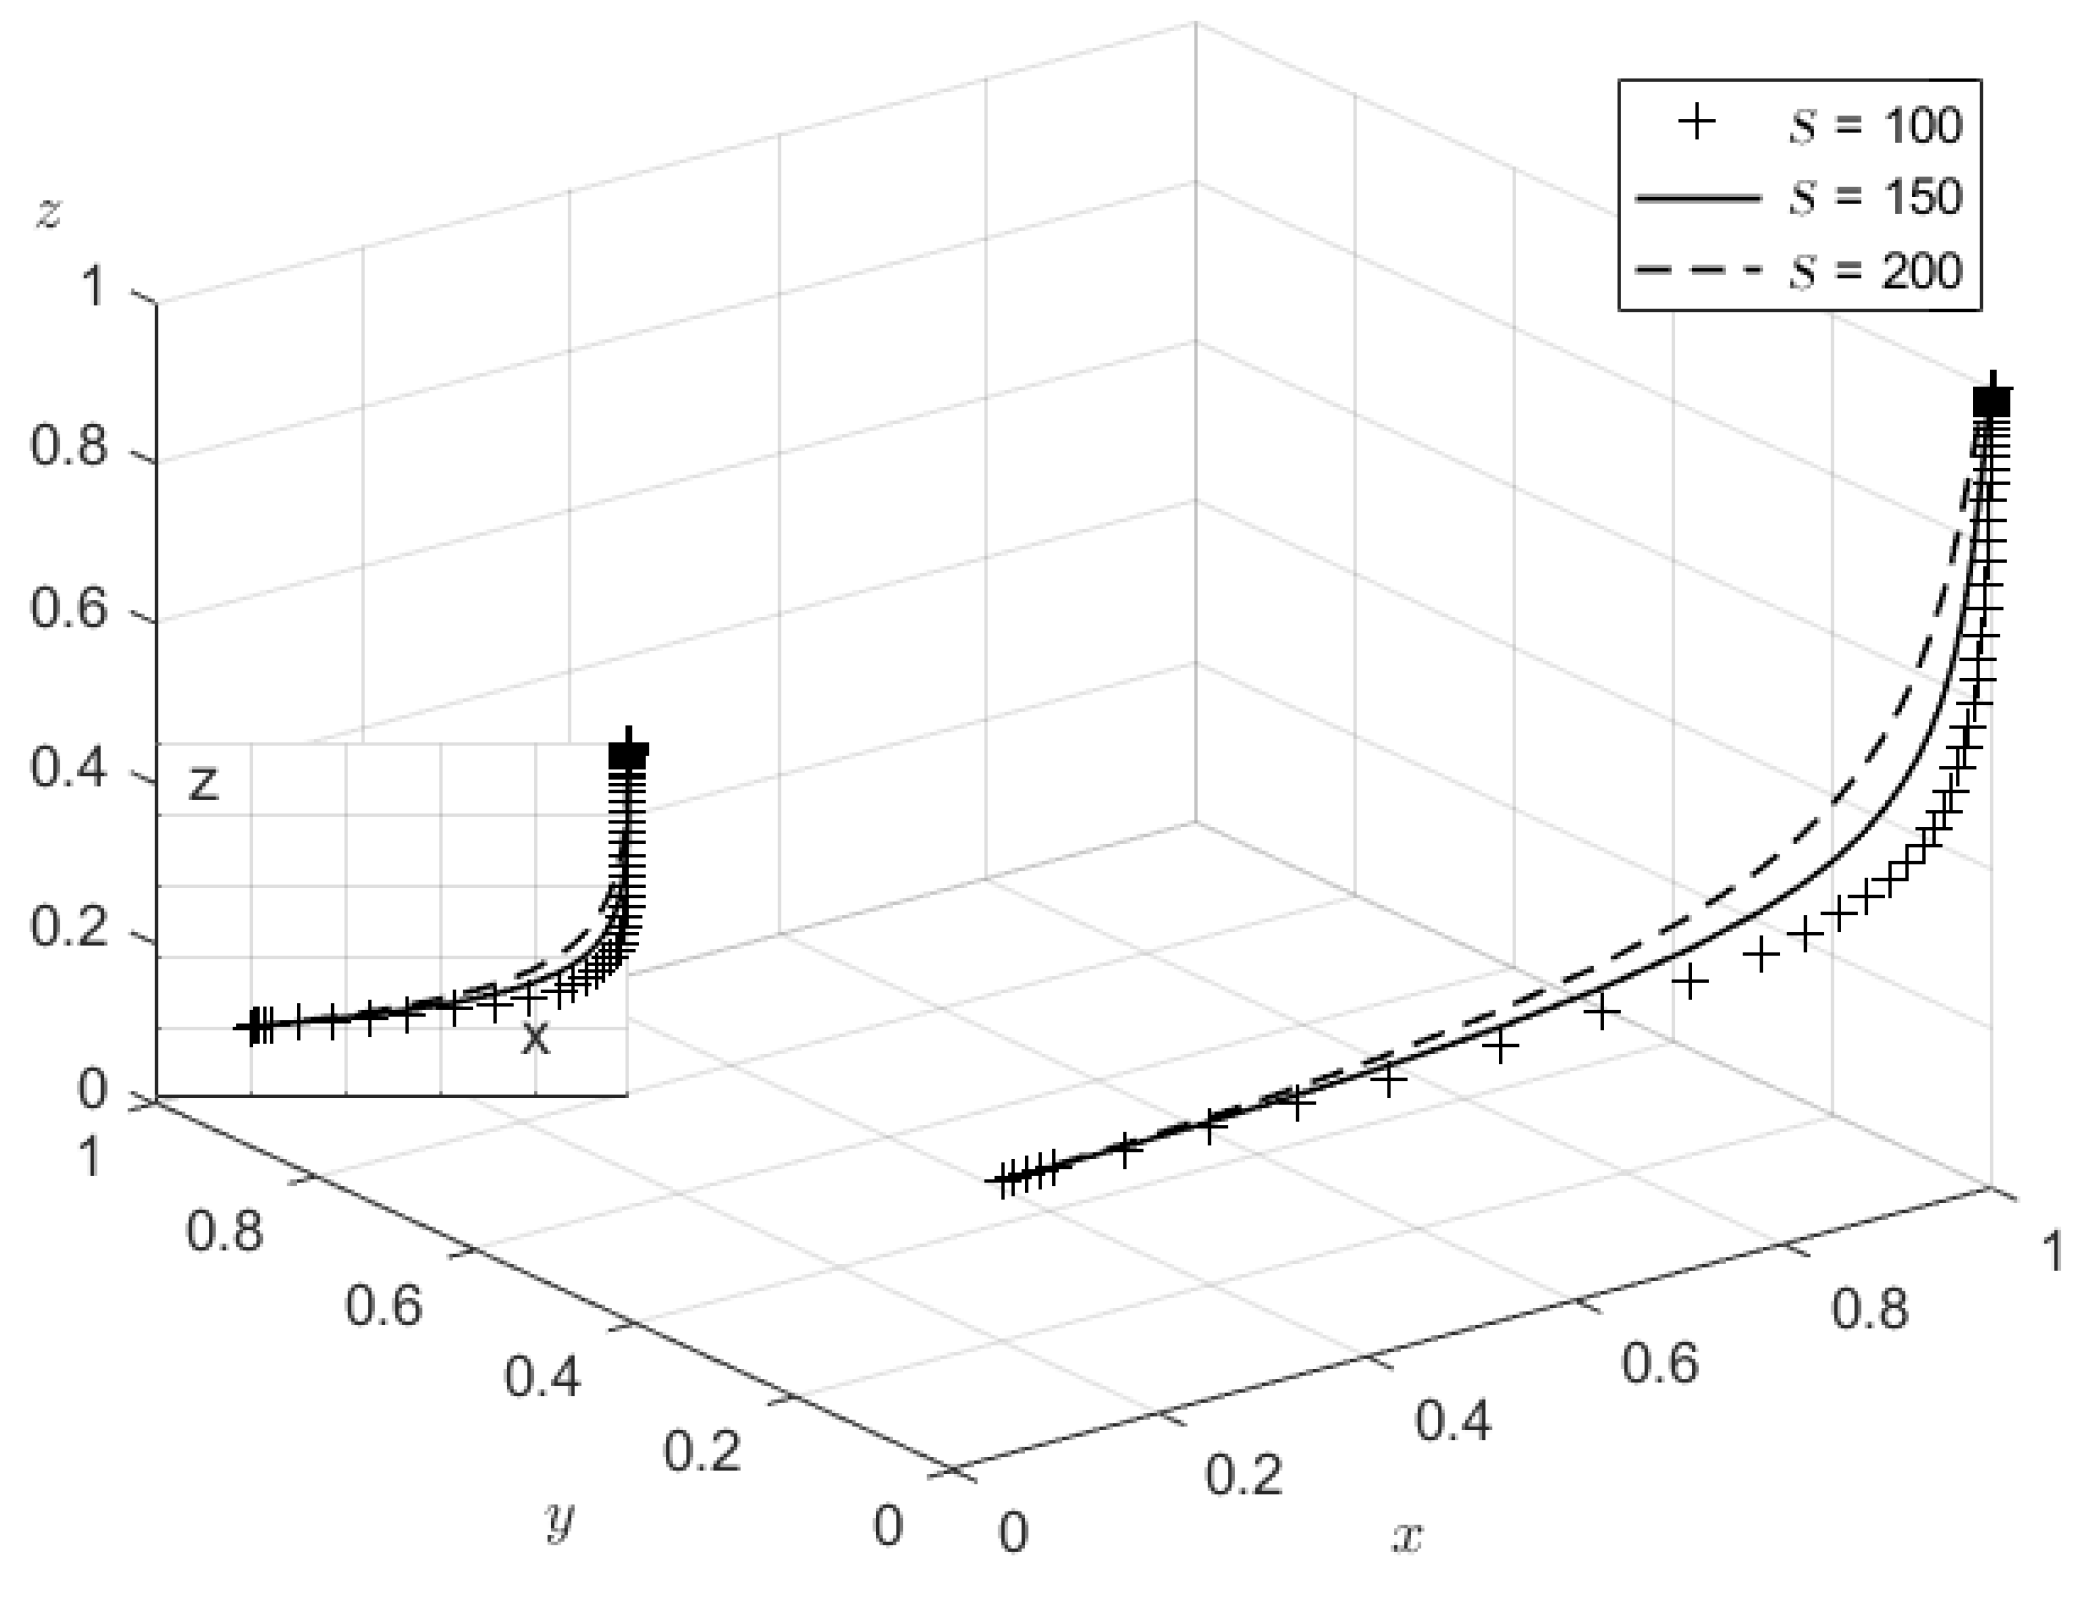
First, the influence of
on the evolutionary game process and results is analyzed and
is assigned to 100, 150, and 200, and the evolutionary process and results are shown in
Figure 5. From
Figure 5, it can be seen that environmental losses can increase the evolutionary speed of active emission reduction in transportation carbon deficit provinces, and as
increases, the probability of active emission reduction in transportation carbon deficit provinces increases, the probability of supporting carbon emission abatement across regions in transportation carbon surplus provinces decreases slightly, and the probability of central government regulation increases. Therefore, the central government strengthens environmental regulation, the transportation carbon deficit provinces actively participate in transportation emission management, and it is conducive to the transportation carbon surplus provinces to make the decision to support emission cross-regional abatement, and the three parties collaborate to achieve effective regional transportation carbon emission abatement.
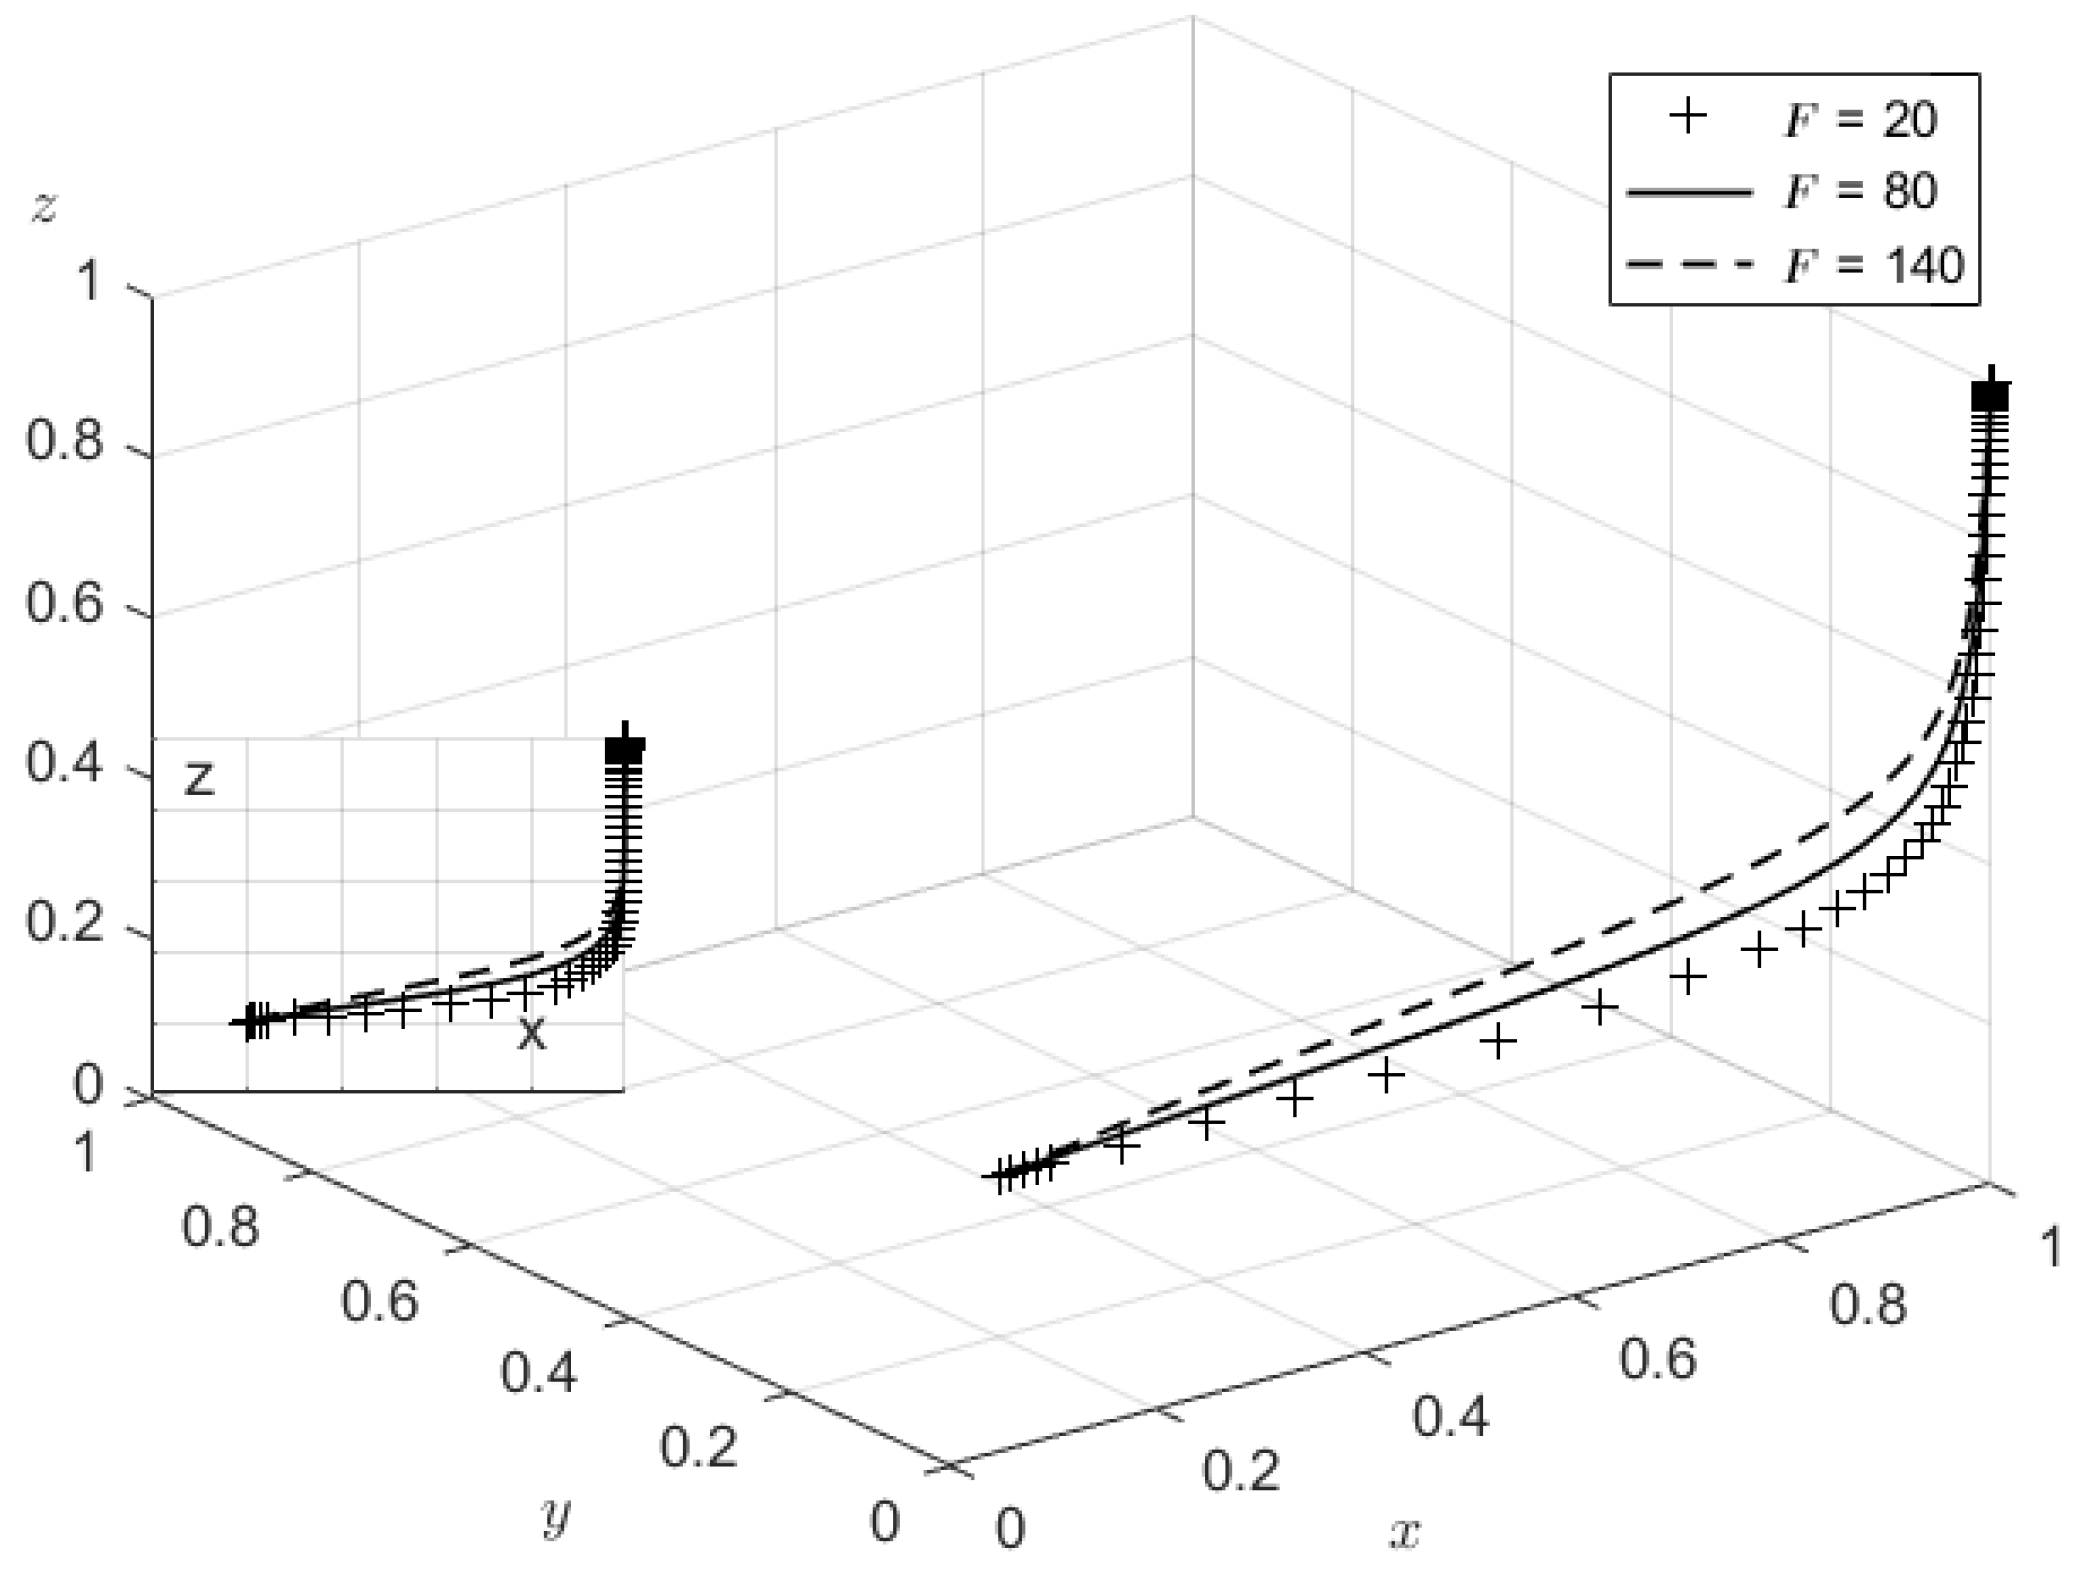
Analyze the influence of
on the process and outcome of the evolutionary game, assign
to 100, 150, and 200, and the simulation results are shown in
Figure 6. From
Figure 6, it can be seen that as
increases, the probability of central government regulation is rising, and the probability of transportation carbon deficit provinces’ governments actively reducing emissions is also increasing, indicating that government regulation has a certain binding effect on transportation carbon deficit provinces, and the government can cultivate transportation carbon deficit provinces’ consciousness of consciously and actively reducing emissions by increasing the fines for transportation carbon deficit provinces’ negative emission reduction, meanwhile, transportation carbon deficit provinces’ active emission reduction has a certain driving effect at the same time, transportation carbon deficit provinces’ active emission reduction has a certain driving effect on transportation carbon surplus provinces’ support for inter-regional carbon emission reduction. When the central government induces transportation carbon deficit provinces’ governments to actively reduce emissions through the fine mechanism, the probability of transportation carbon surplus provinces’ support for transportation inter-regional emission reduction will increase to a small extent.
Simulations are conducted for the value of
, assign the value
to discuss the impact of carbon surplus provinces’ rejection of fines for cross-zone emission abatement.
Figure 7 shows that as the value of
increases, the value of
also increases, and the increase of fines increases the probability of carbon deficit provinces actively reducing emissions, the probability of carbon surplus provinces supporting cross-zone emission abatement, and the probability of central government regulation of emission reduction at the same time. For the carbon surplus provinces, the rate of evolution of cross-zone emission reduction is slow and then fast, and the amount of penalty has little effect on the rate of evolution. Therefore, the government should set a reasonable penalty mechanism to promote cross-regional emission reduction in the form of fines, so that regional synergistic reduction can be achieved and regional transportation can be made low-carbon.
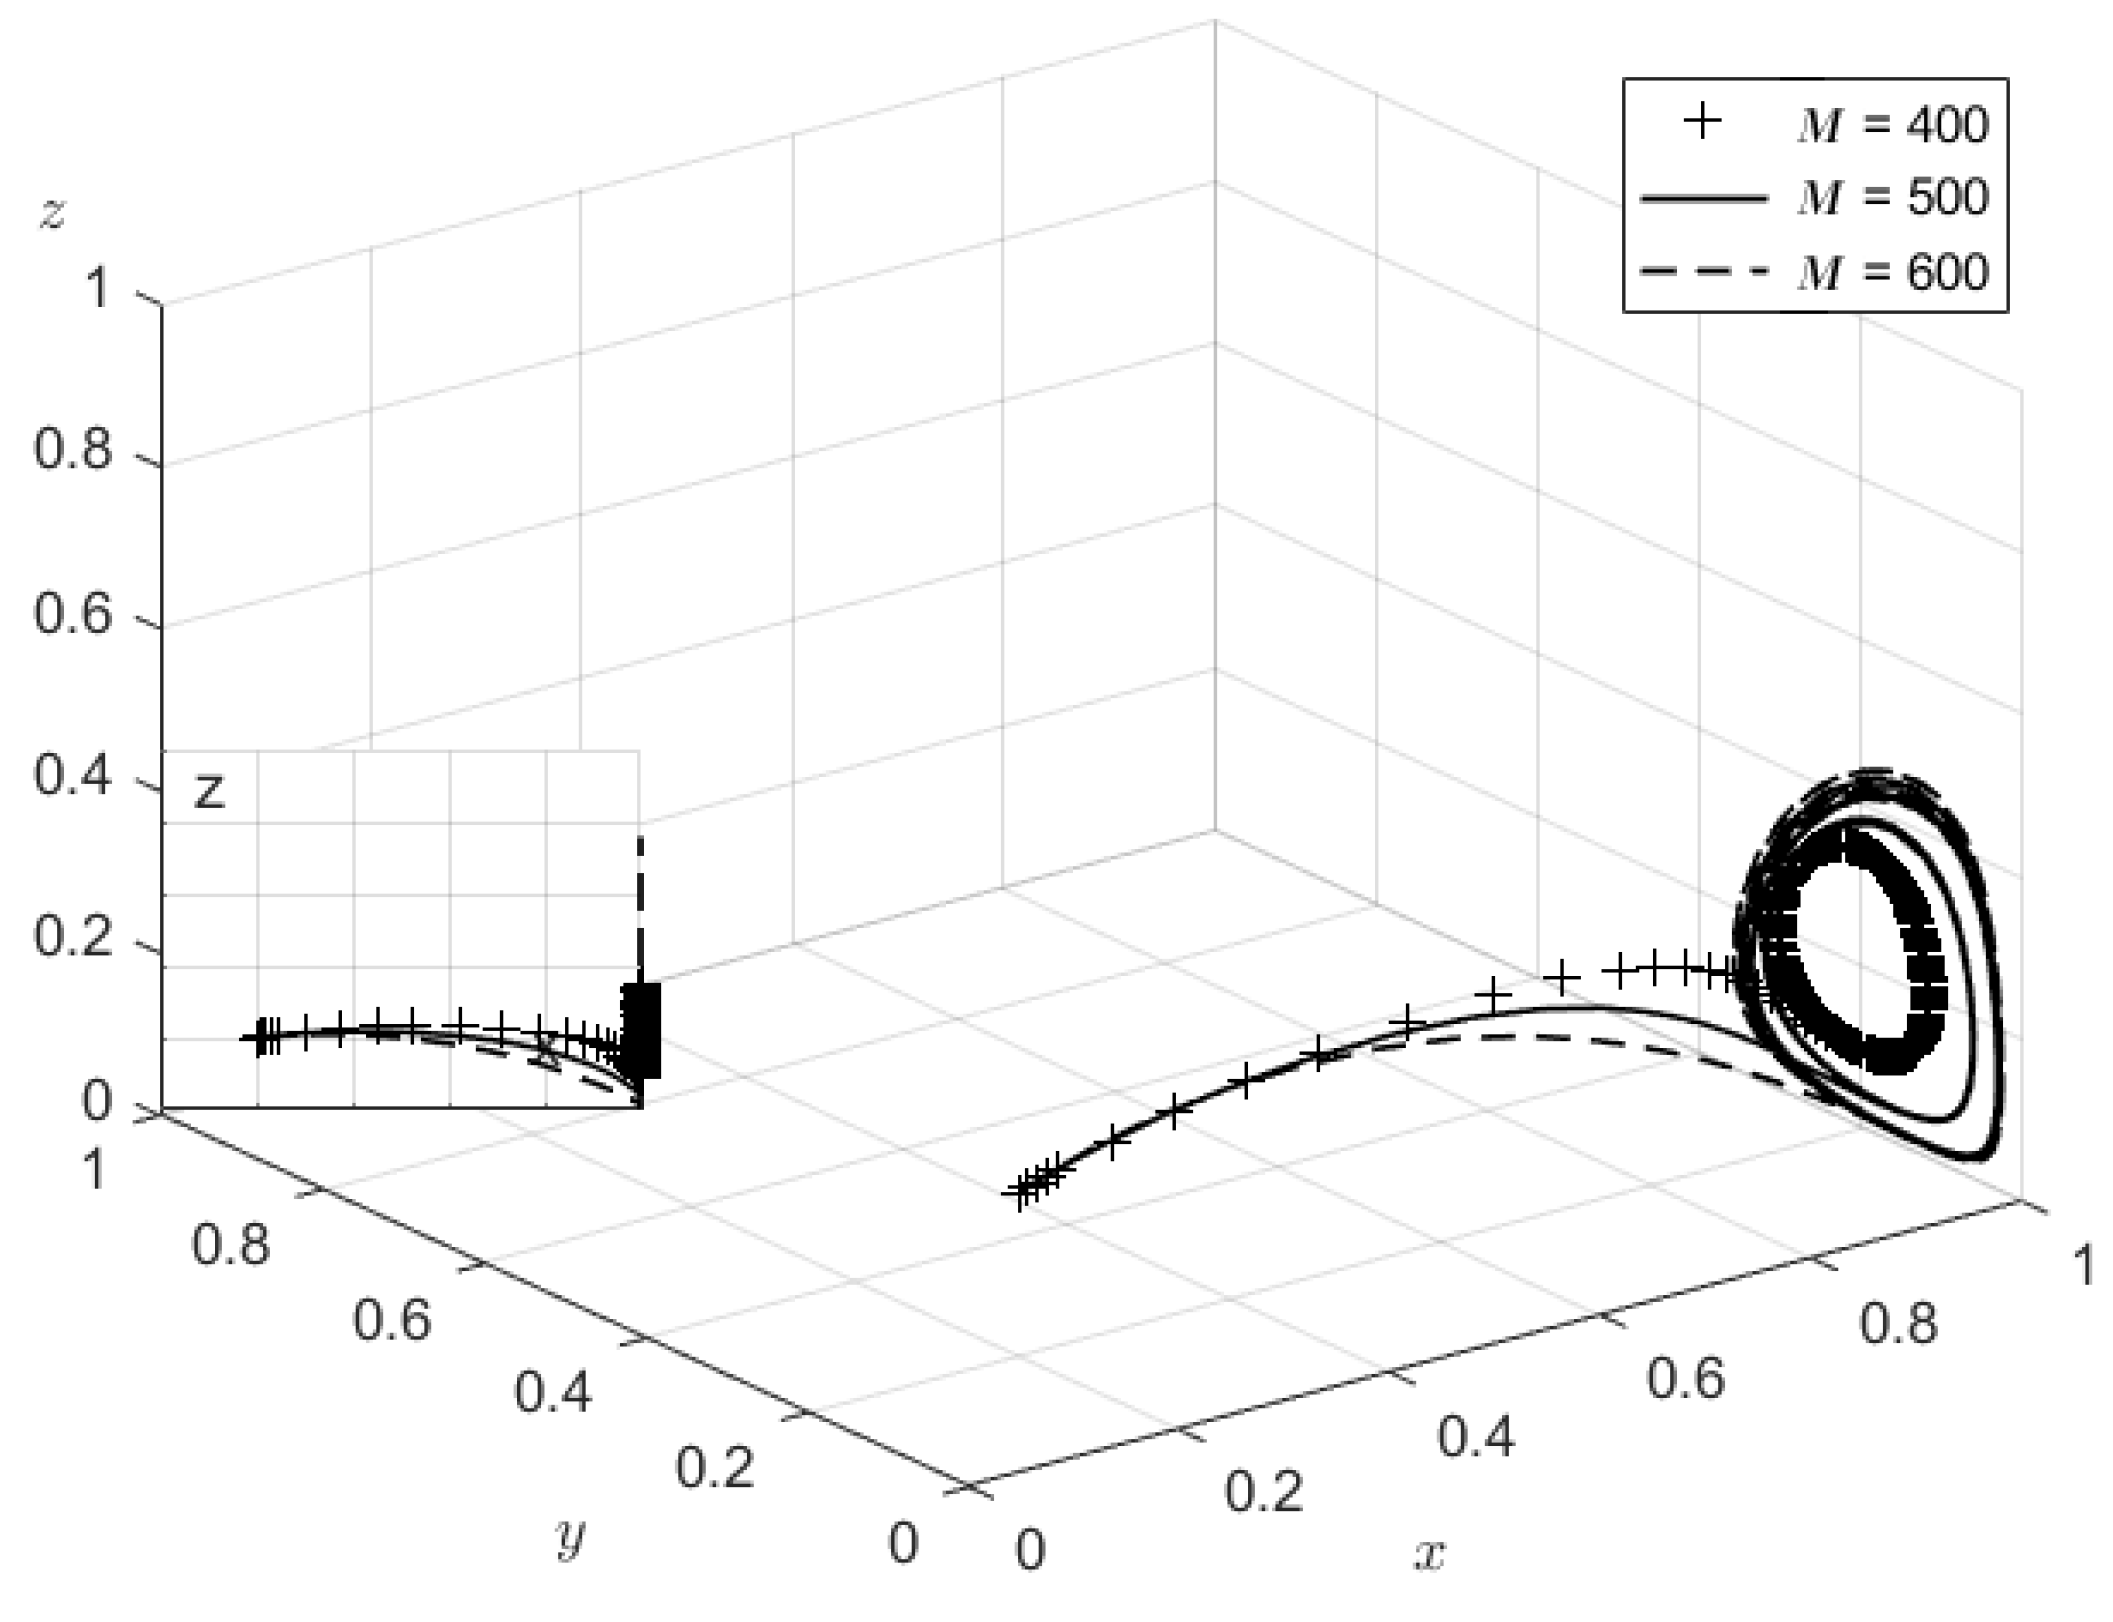
Assignment simulation for
, the results
Figure 8.
Figure 8 shows that
increases with
rapidly, and
decreases with
, indicating that the central government cross-zone cooperation subsidy is beneficial to promote carbon deficit provinces to actively reduce emissions, but will play a negative effect on carbon surplus provinces, in addition, when the probability of carbon deficit provinces to actively reduce emissions is stable to 1, the strategy choice of carbon surplus provinces and the central government is unstable. Therefore, the same cross-regional subsidies do not promote carbon surplus provinces to support cross-regional abatement, and the central government sets different amounts of cross-regional subsidies for both sides.
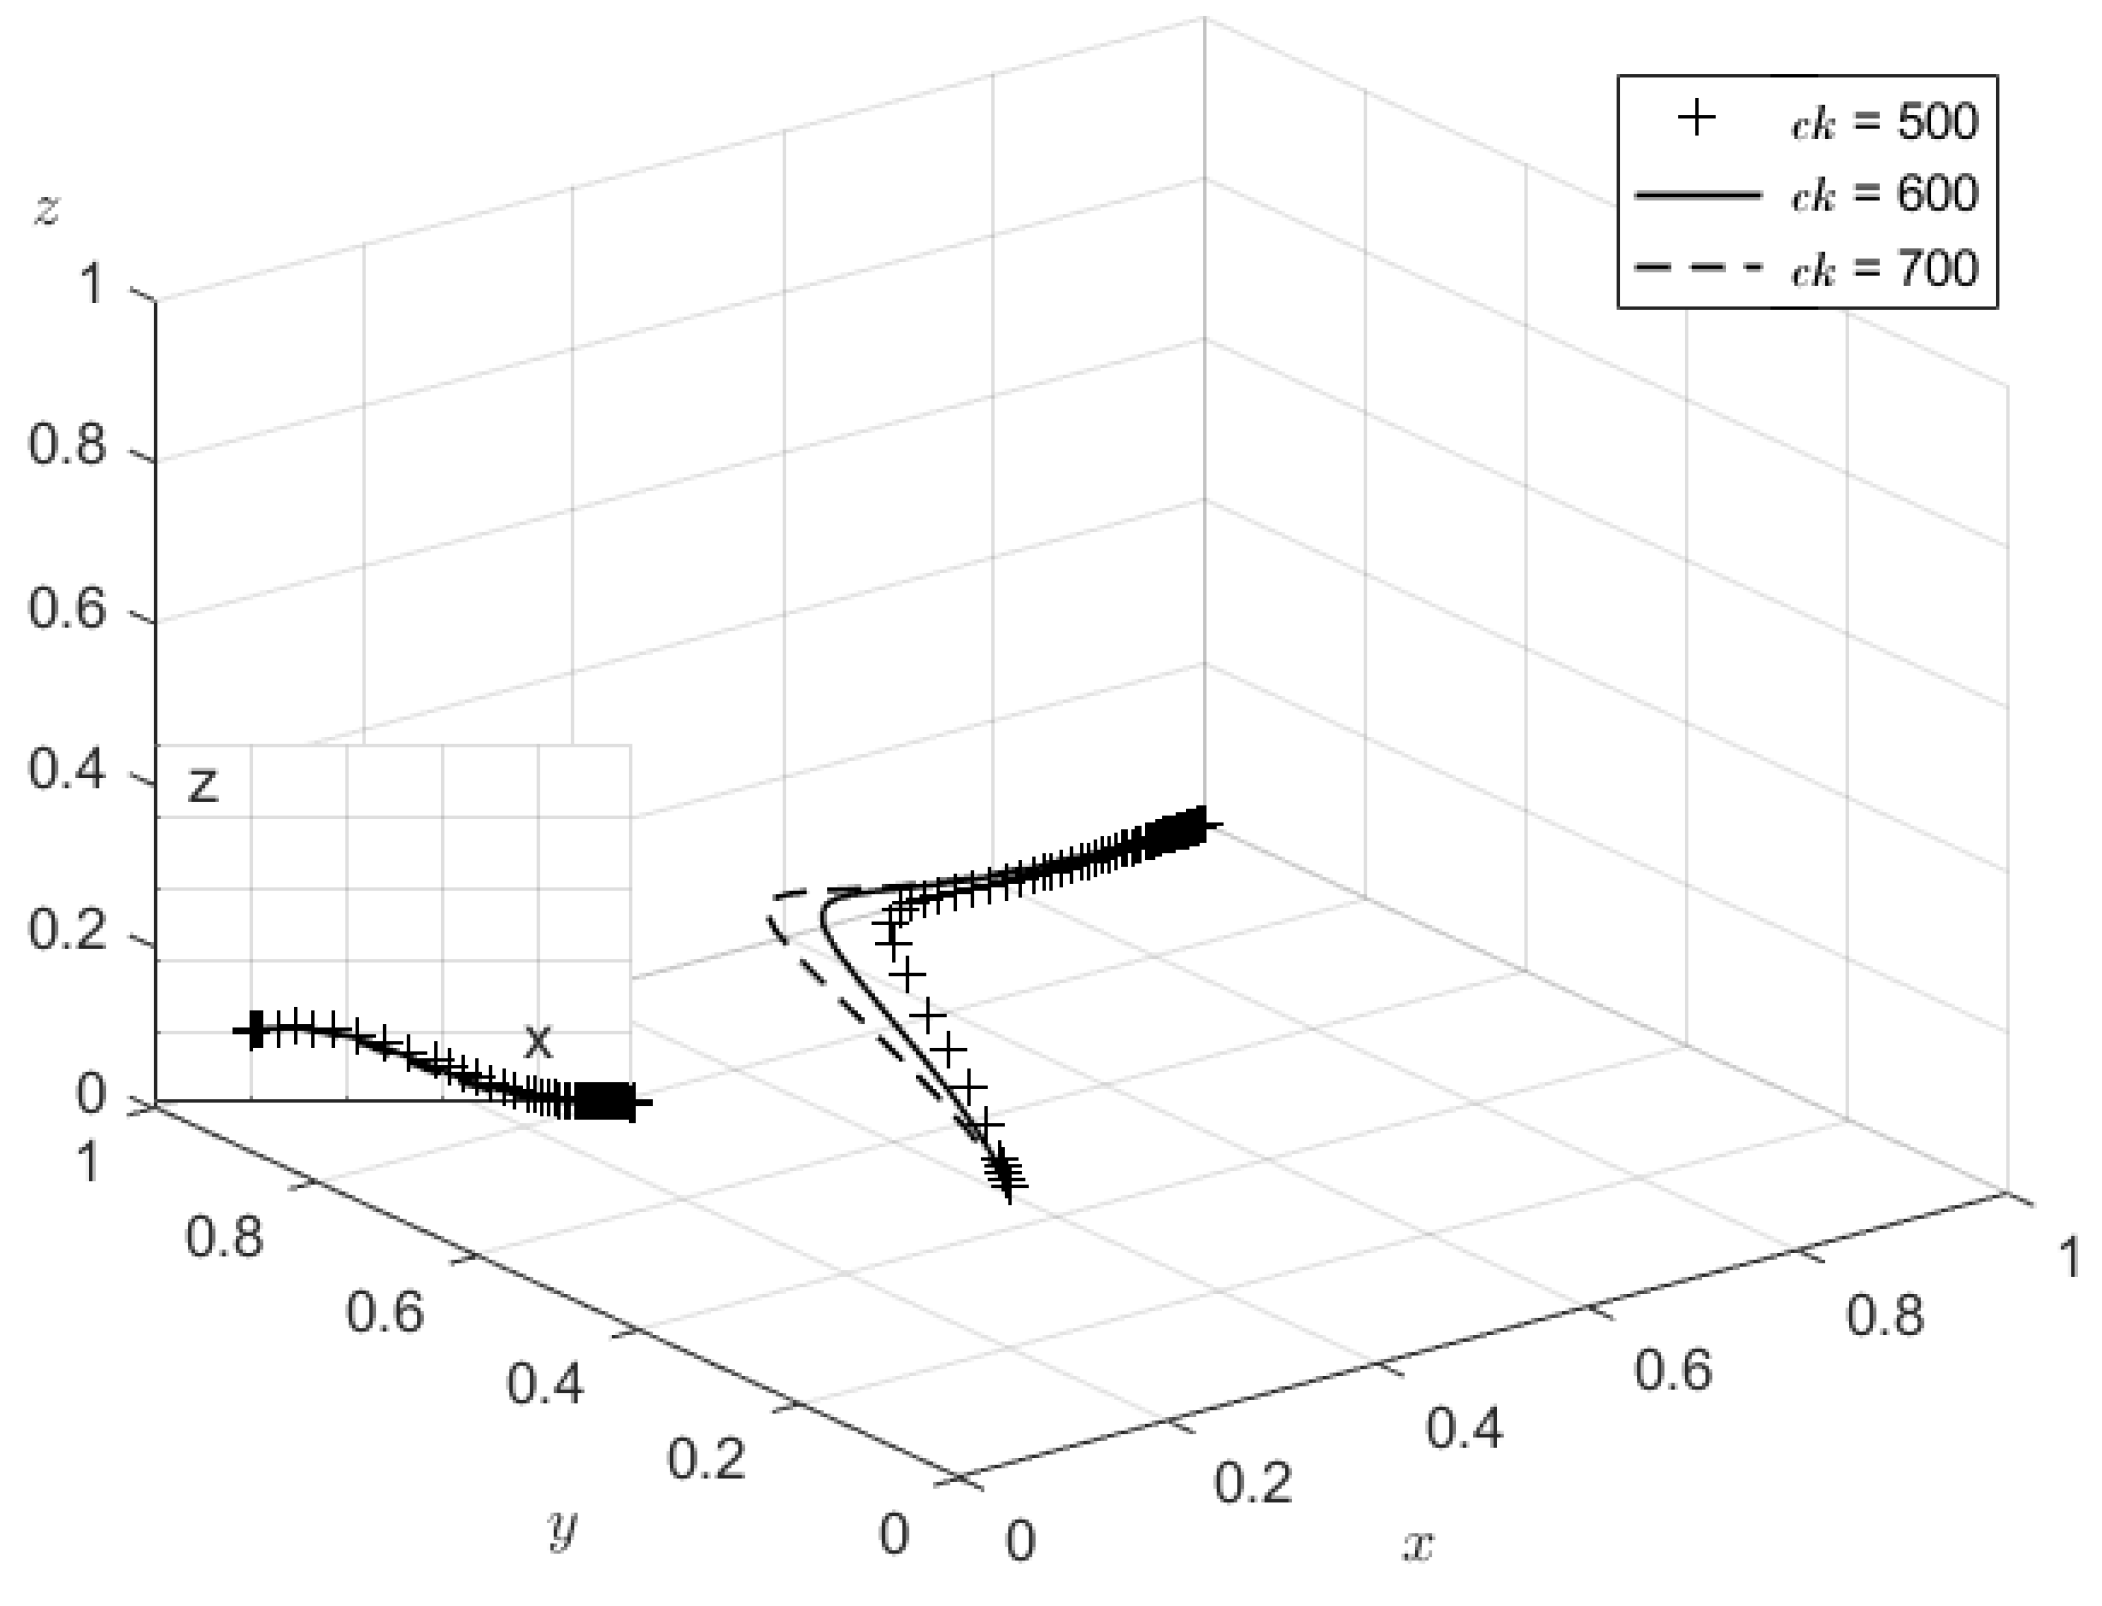
Set
to 500, 600, and 700, respectively, and the simulation results are shown in
Figure 9.
Figure 9 shows that
and
increase with the increase of
, indicating that the inter-regional compensation of carbon deficit provinces can promote the government of carbon surplus provinces to support inter-regional carbon emission reduction, and the rate of increase of
is slow and then fast, and the rate of increase of
is fast and then slow, indicating that the probability impact of inter-regional compensation on the positive emission reduction of carbon deficit identity has a lag, and the probability impact on the support of inter-regional reduction of carbon surplus provinces is rapid. In addition, the probability of central government abatement decreases with increasing cross-zone compensation in carbon deficit provinces, suggesting that central government deregulation occurs after increasing cross-zone compensation drives the probability of cross-zone cooperation between carbon deficit and carbon surplus provinces.
Assigning
respectively, the simulation results are shown in
Figure 10.
Figure 10 shows that
decreases with the increase of
, the higher the cost of regulation, the probability of central government regulation of emission reduction decreases, while
increases with the increase of
, indicating that the cost of environmental loss ambassador regulation increases, the environmental loss at this time is large, the government of carbon deficit provinces will be forced to actively participate in emission reduction due to environmental pressure, while
decreases with the increase of
, the government of carbon surplus provinces support carbon The probability of cross-region emission abatement decreases with the decrease of the probability of government regulation.
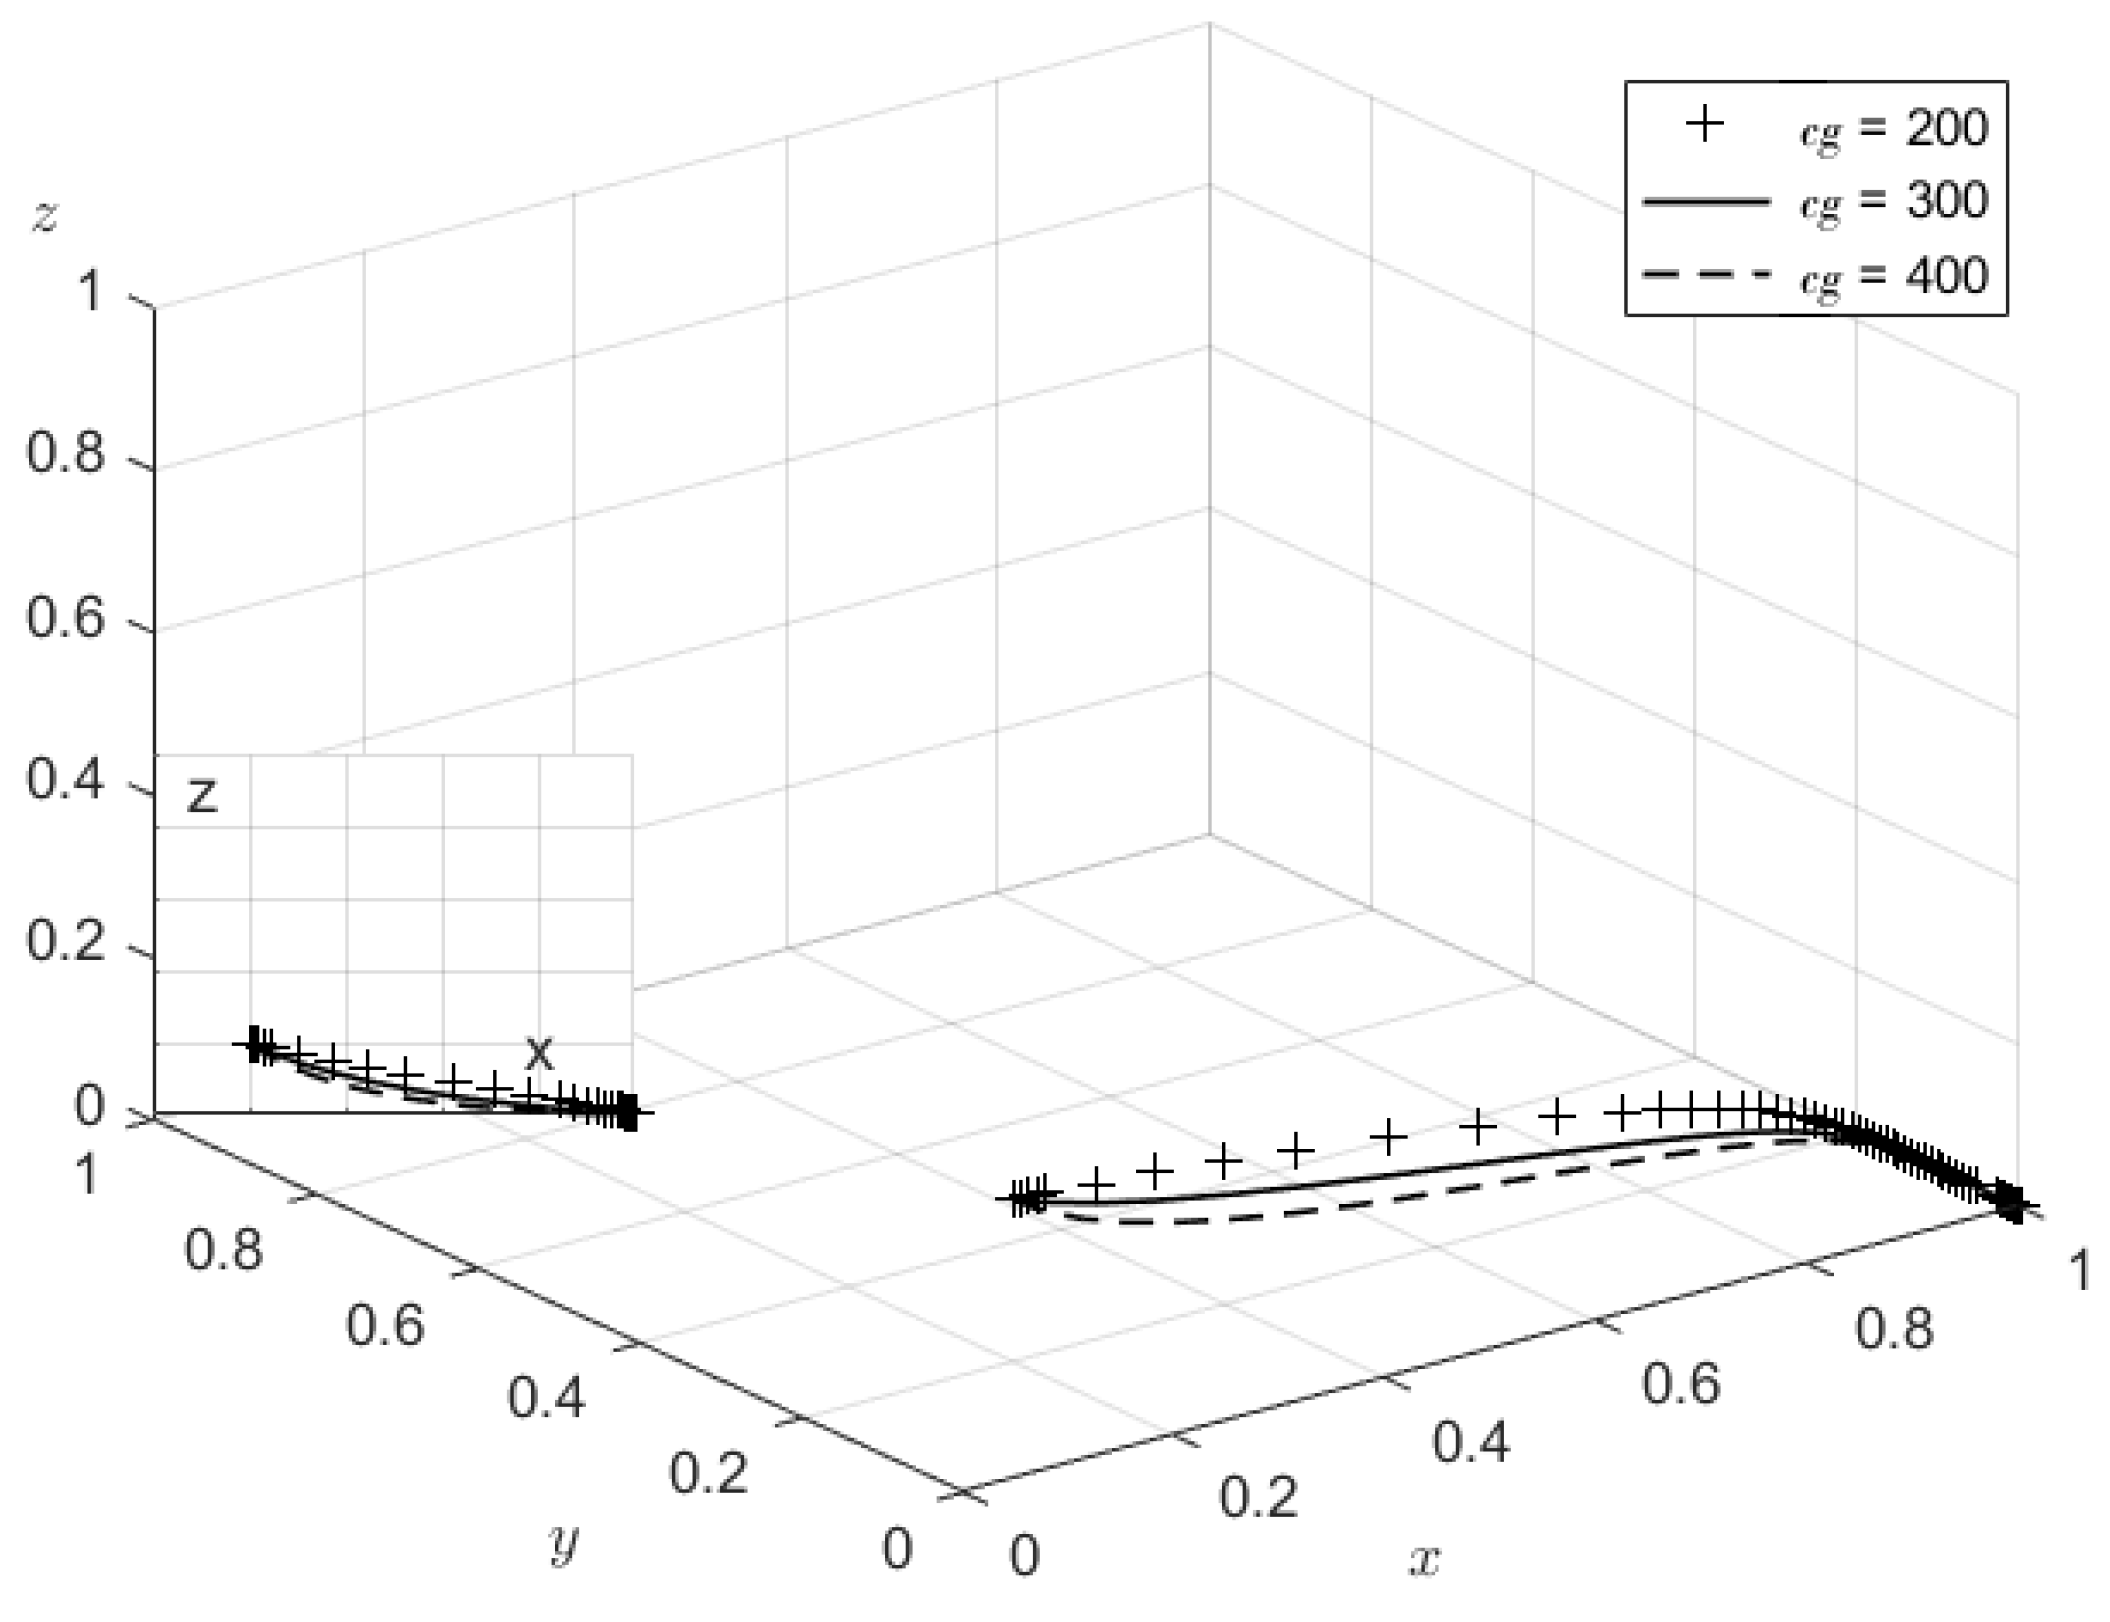
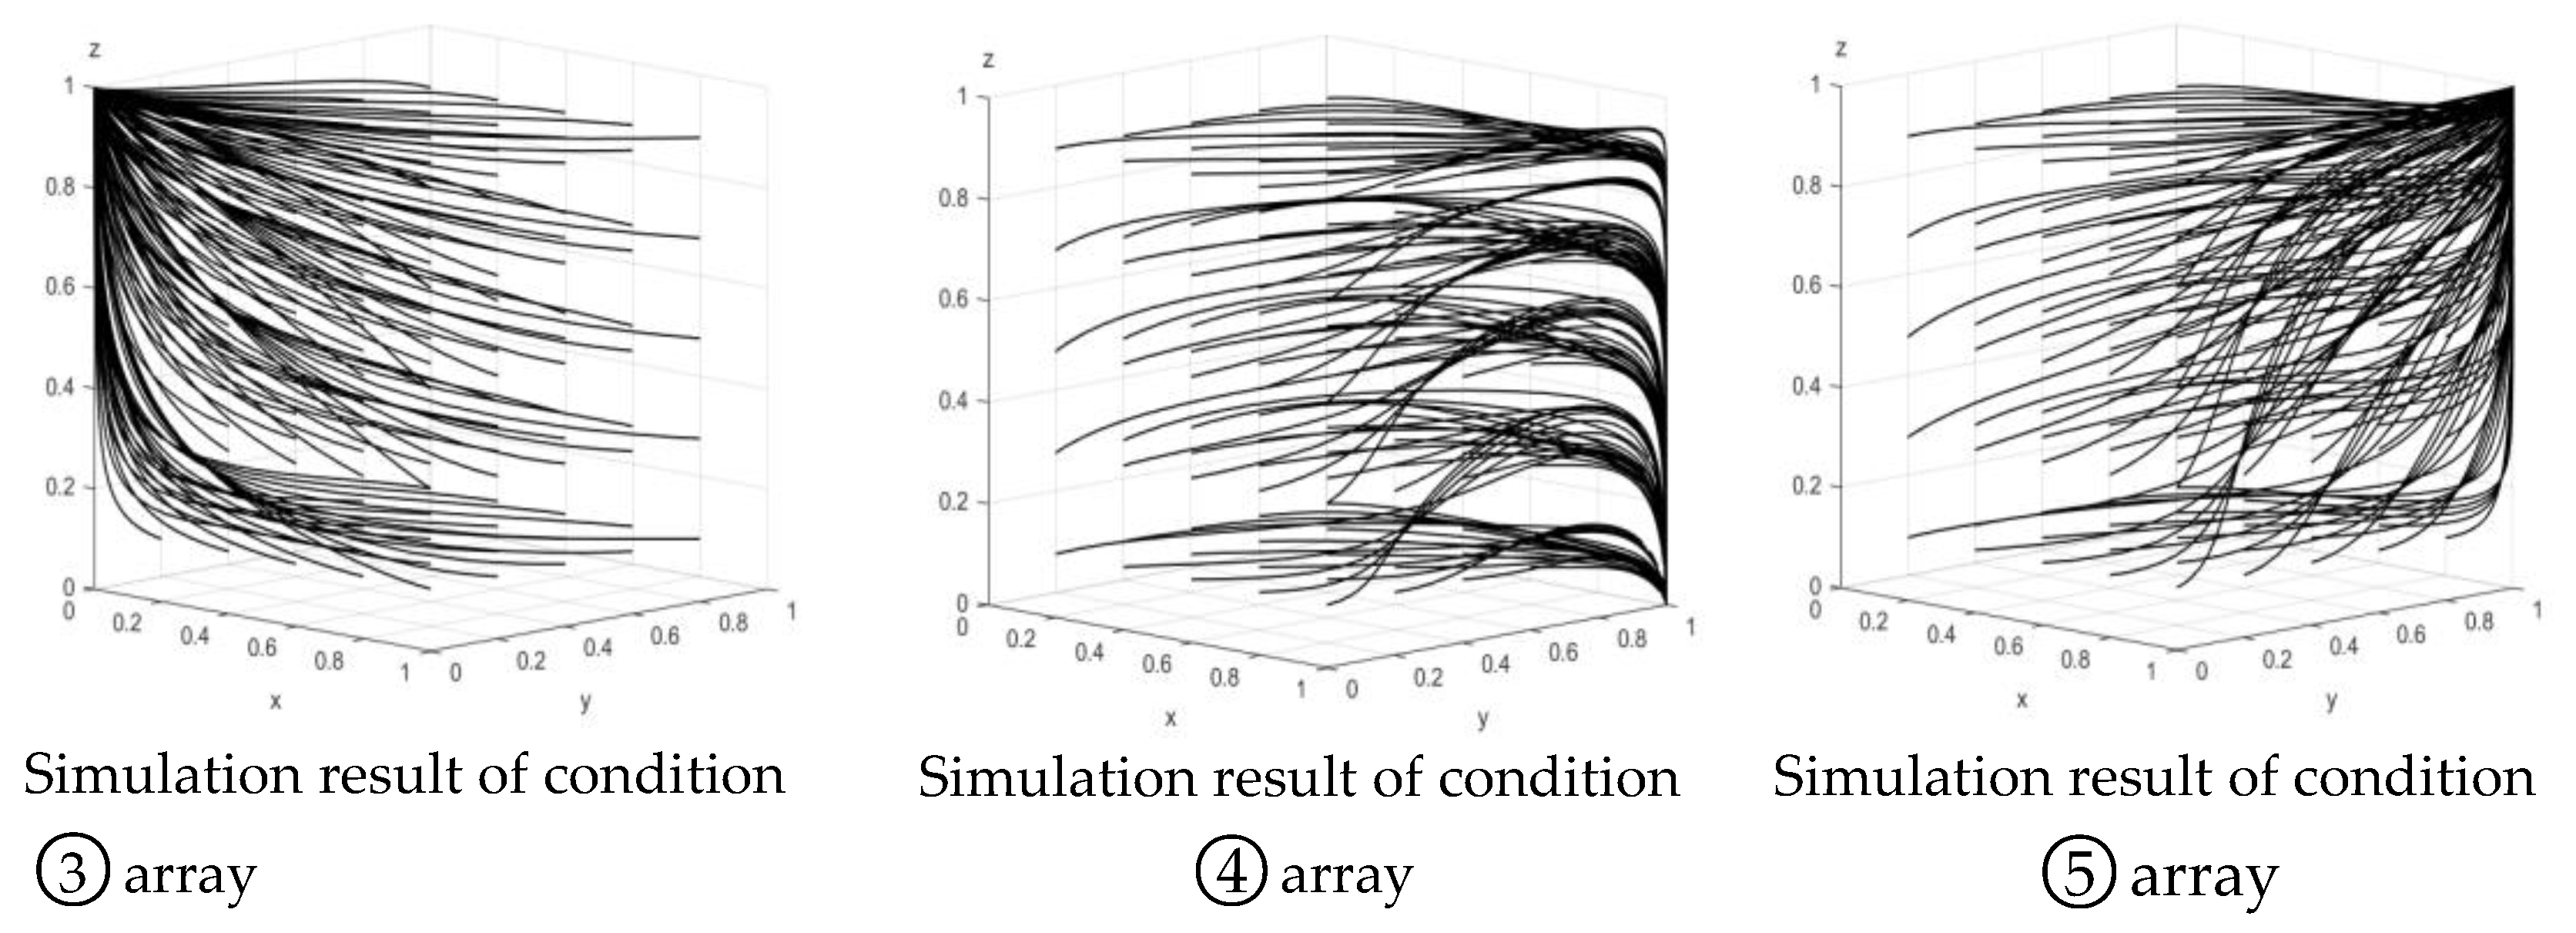
The three sets of arrays are set to satisfy conditions in
Table 2, and the three sets of data are simulated 60 times according to different strategy combinations. The results are shown in
Figure 11.
From
Figure 11 it can be seen that there are three evolutionary stability points of the system as
,
,
. That is, the strategy combinations of transportation carbon deficit provinces, transportation carbon surplus provinces, and the central government are (negative emission reduction, refusal of carbon emission cross-regional abatement, abatement regulation), (positive emission reduction, support of carbon emission cross-regional abatement, no abatement regulation), and (positive emission reduction, support of carbon emission cross-regional abatement, abatement regulation), which is consistent with the stability analysis of the equilibrium point. Therefore, the central government should strengthen the transportation environment management and set a reasonable reward and punishment mechanism to achieve regional transportation cross-regional carbon emission abatement.
6. Conclusions
Transportation has negative externalities, which means that economic growth in transportation will bring about transportation emissions, and transportation emissions are inherently cross-regional. Currently, there are more studies on the measurement of transportation carbon emissions and the drivers of carbon emissions, and fewer studies on the strategic structure of transportation emission reduction across regions horizontally and vertically at the provincial level. This paper clarifies the strategic structure of cross-regional transportation emission reduction, which is important for achieving transportation sustainability in the economic circle. Considering the strategy of regional transportation carbon emission reduction across regions, this paper analyzes the stability of the equilibrium point of the three-party game system by constructing a three-party evolutionary game model among transportation carbon deficit provinces, transportation carbon surplus provinces and the central government, and discusses the influence relationship of each element on the three-party strategy. The main conclusions include: that environmental losses can increase the evolution rate of active emission reduction in transportation carbon deficit provinces, and with the increase, the probability of supporting cross-regional carbon emission reduction in transportation carbon surplus provinces decreases slightly, and the probability of central government regulation increases. The central government has a certain degree of binding force on the transportation carbon deficit provinces through fines, and the government can cultivate the awareness of the transportation carbon deficit provinces to reduce emissions voluntarily and actively by increasing the fines on the transportation carbon deficit provinces for being negative in reducing emissions. The central government’s cross-regional cooperation subsidy is beneficial to promoting carbon deficit provinces to actively reduce emissions but will have a negative effect on carbon surplus provinces. Compensation for cross-regional carbon deficit provinces can promote carbon surplus provinces to support cross-regional carbon emission reduction. The higher the central government’s regulatory cost, the lower the probability of the central government’s emission reduction regulation; the central government should set up a reasonable incentive and punishment mechanism, by increasing cross-regional emission reduction subsidy and setting up a reasonable incentive or penalty mechanism to promote cross-region emission reduction. This paper clarifies the game relationship between the central government, transportation carbon deficit provinces, and transportation carbon surplus provinces, and discusses the influence of each variable on the strategy of the three parties, which provides a theoretical basis for the national formulation of cross-regional transportation emission reduction policies and for the country to achieve sustainable transportation. The subsequent study needs to further analyze the mechanisms and effects of different policy combinations on the strategic choices of the central government, transportation carbon deficit provinces, and transportation carbon surplus provinces in conjunction with the existing national transportation emission reduction policies across regions.


